Embed Size (px)
Citation preview
Statistical Parametric Mapping of the EEG in infants from 1 to 10 months.
Jorge Bosch-Bayard, Thalía Fernández, Gloria Otero, Berta González-Frankerberger, Lídice Galán-García, Antonio Fernández-Bouzas, Thalía Harmony
Centro de Neurociencias de CubaUnidad de Investigación en Neurodesarrollo, Instituto de Neurobiología, UNAM
Facultad de Medicina de la Universidad Autónoma del Estado de México
Introduction Up to the present, the analysis of the brain electrical activity in infants
has been based on the visual inspection of the EEG. This doesn’t
allow a proper evaluation of the changes that take place in the brain
electrical activity of infants during the first months of life. Quantitative
EEG may provide a more objective tool for this purpose. Also,
characterization of typical patterns of the development of infant’s
EEG could provide a useful tool for clinical assessment of
pathologies. In this paper norms for the brain electrical activity in the
frequency domain of infants from 2 to 10 months are presented, both
for the voltage scalp EEG recording and the current density at the
sources.
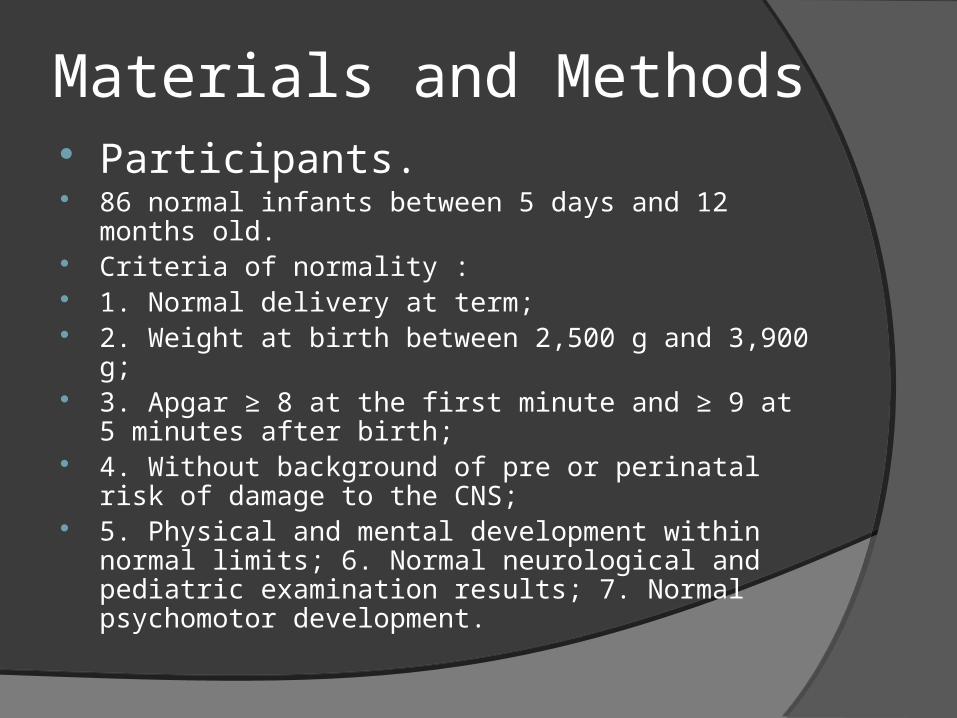
Materials and Methods Participants. 86 normal infants between 5 days and 12 months old. Criteria of normality : 1. Normal delivery at term; 2. Weight at birth between 2,500 g and 3,900 g; 3. Apgar ≥ 8 at the first minute and ≥ 9 at 5 minutes after
birth; 4. Without background of pre or perinatal risk of damage
to the CNS; 5. Physical and mental development within normal limits;
6. Normal neurological and pediatric examination results; 7. Normal psychomotor development.
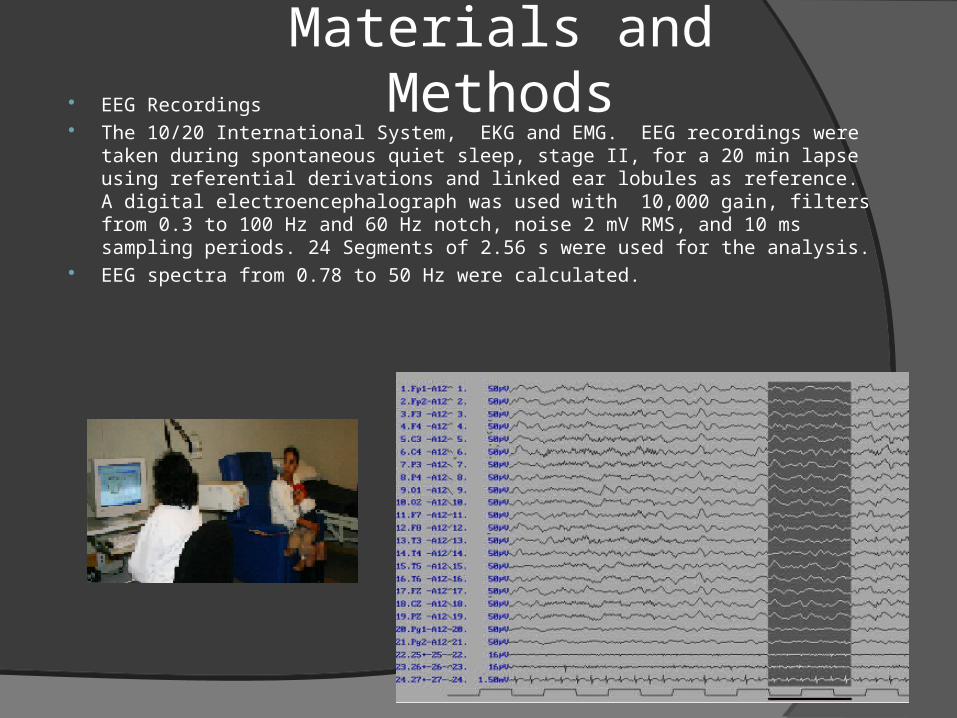
Materials and Methods EEG Recordings
The 10/20 International System, EKG and EMG. EEG recordings were taken during spontaneous quiet sleep, stage II, for a 20 min lapse using referential derivations and linked ear lobules as reference. A digital electroencephalograph was used with 10,000 gain, filters from 0.3 to 100 Hz and 60 Hz notch, noise 2 mV RMS, and 10 ms sampling periods. 24 Segments of 2.56 s were used for the analysis.
EEG spectra from 0.78 to 50 Hz were calculated.
Regression Equations Polynomial regressions were fitted to the Log of the Spectrum
of each variable (Lead or Source) against the Log of the subject´s age, at each frequency.
The regression equations were calculated by a Robust Regression Using Iteratively Reweighted Least-Squares, with the bisquare weighting function. This algorithm is used to limit the effect of outliers.
In each iteration, new weights are computed for each point, to give lower weight to points that are far from their predicted values, and the fit is repeated using these weights. The process continues until it converges.
The results are less sensitive to outliers in the data as compared with ordinary least squares regression.
The polynomial grade was chosen by AIC (Akaike Information Criteria) from 0 to 2.
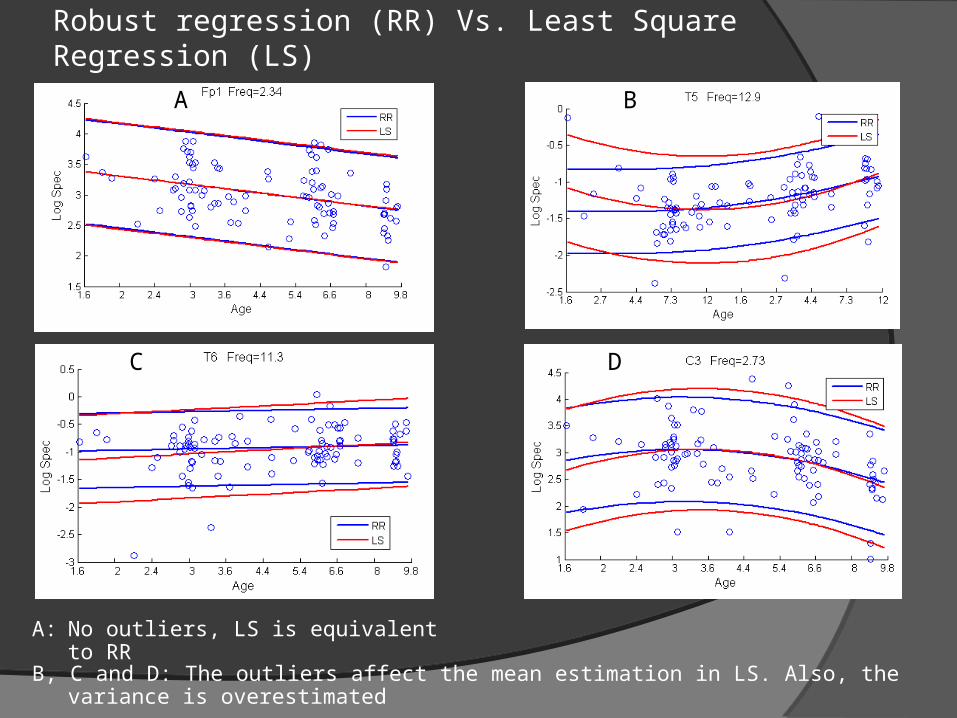
Robust regression (RR) Vs. Least Square Regression (LS)
B, C and D: The outliers affect the mean estimation in LS. Also, the variance is overestimated
A: No outliers, LS is equivalent to RR
C
B
D
A
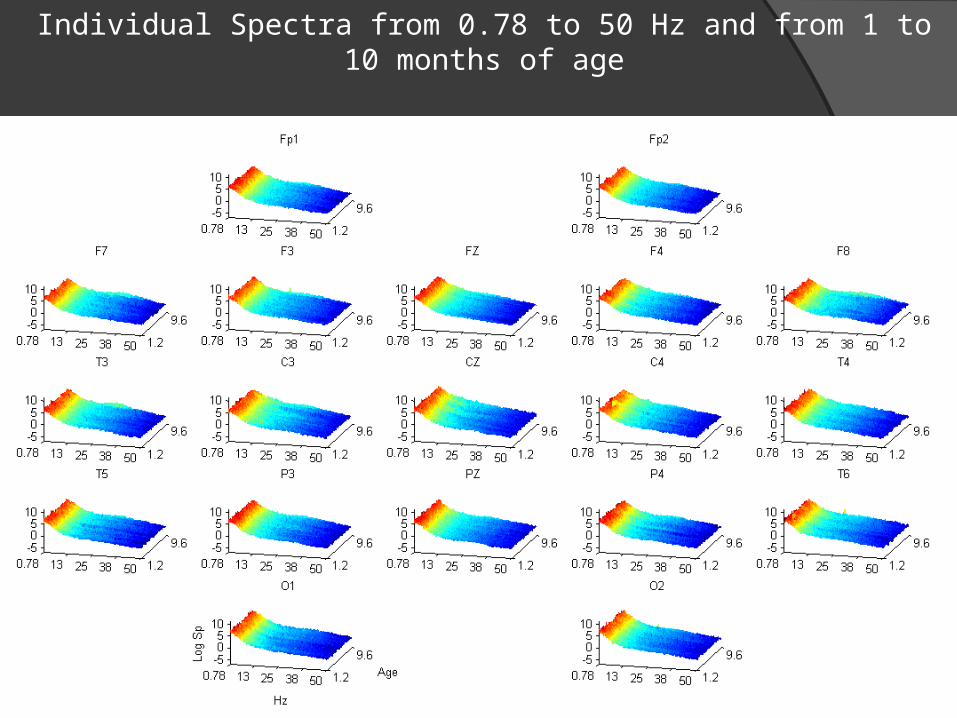
Individual Spectra from 0.78 to 50 Hz and from 1 to 10 months of age
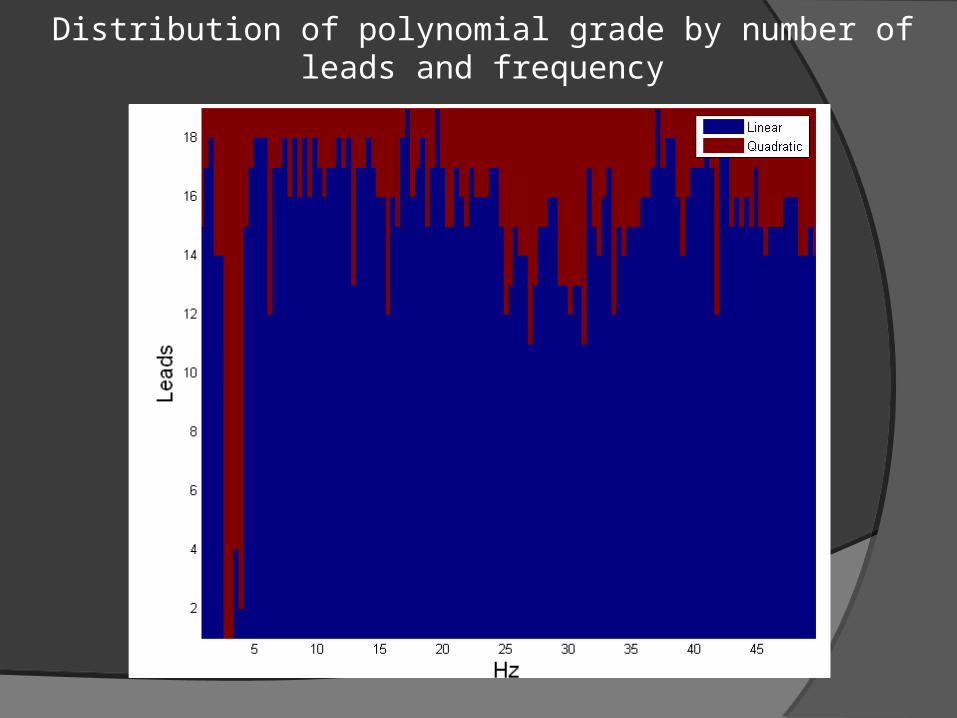
Distribution of polynomial grade by number of leads and frequency
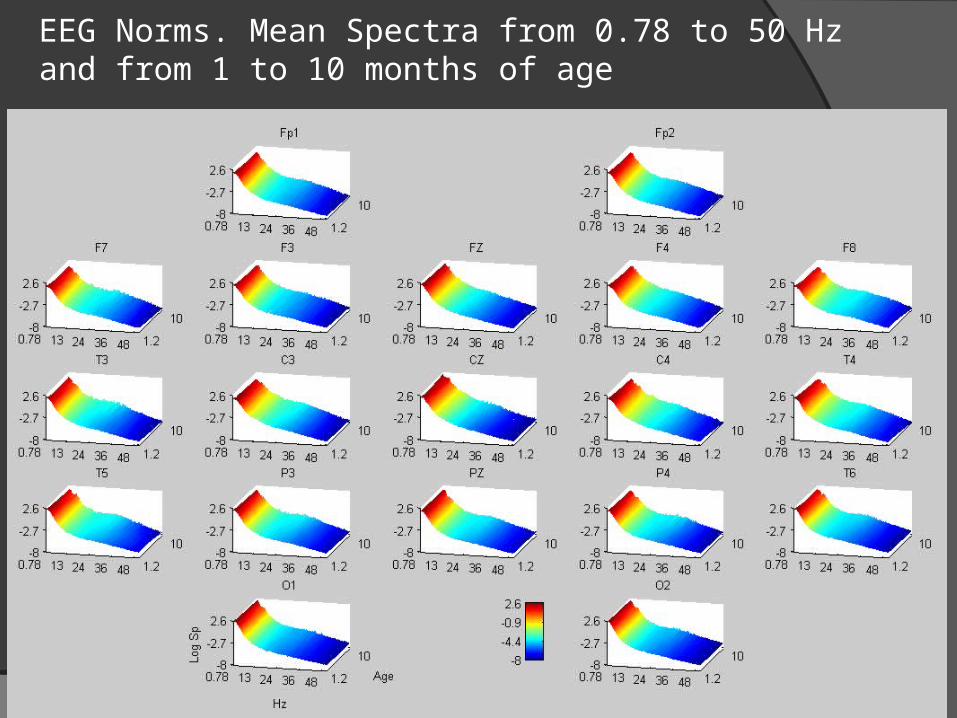
EEG Norms. Mean Spectra from 0.78 to 50 Hz and from 1 to 10 months of age
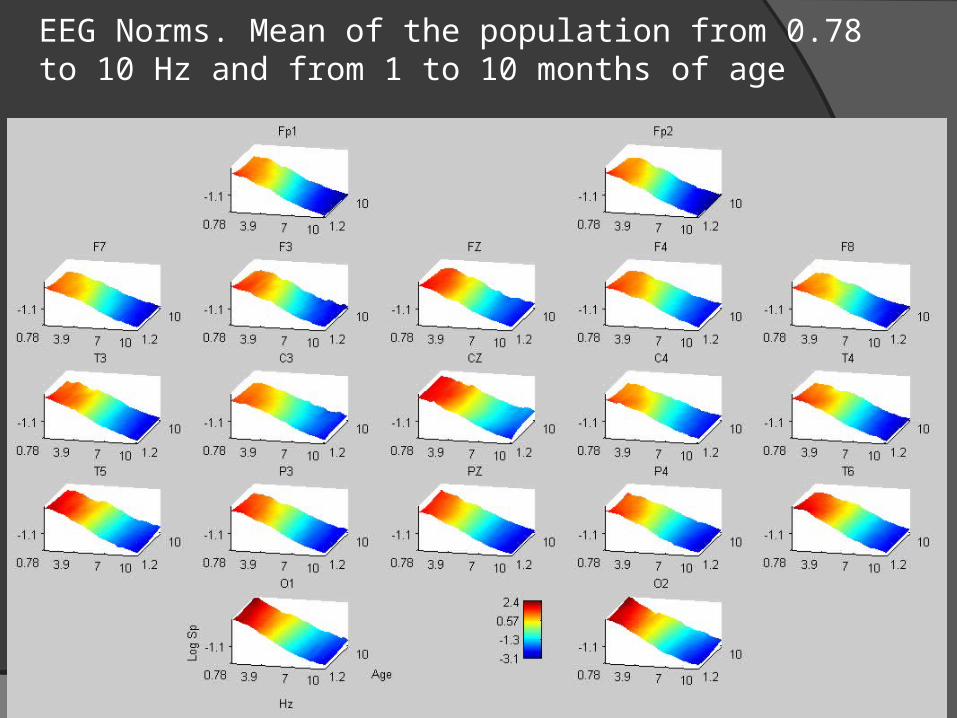
EEG Norms. Mean of the population from 0.78 to 10 Hz and from 1 to 10 months of age
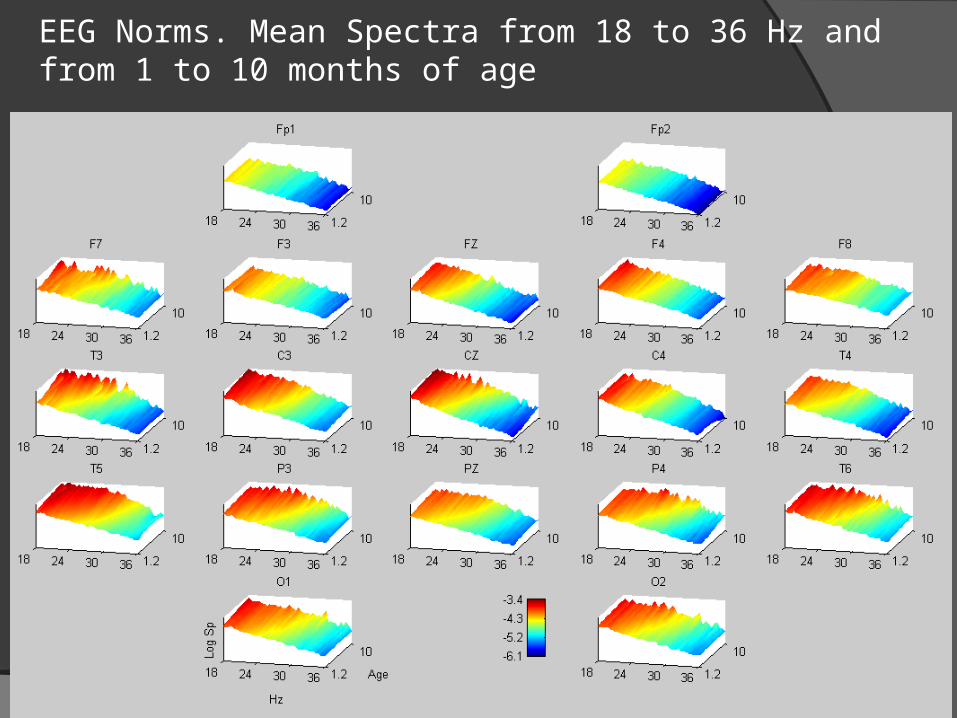
EEG Norms. Mean Spectra from 18 to 36 Hz and from 1 to 10 months of age
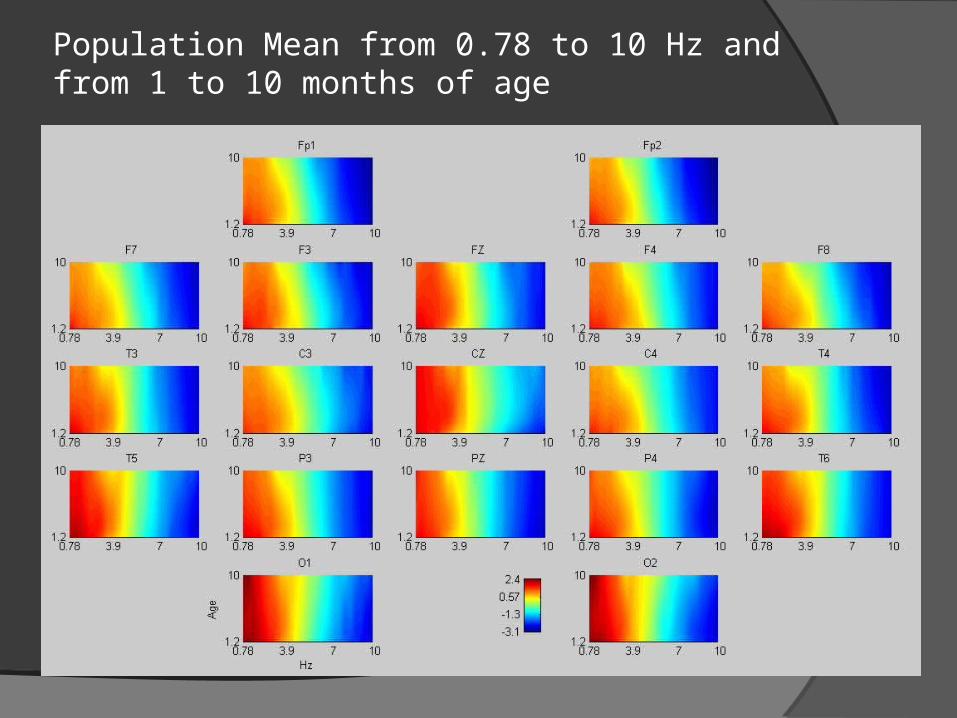
Population Mean from 0.78 to 10 Hz and from 1 to 10 months of age
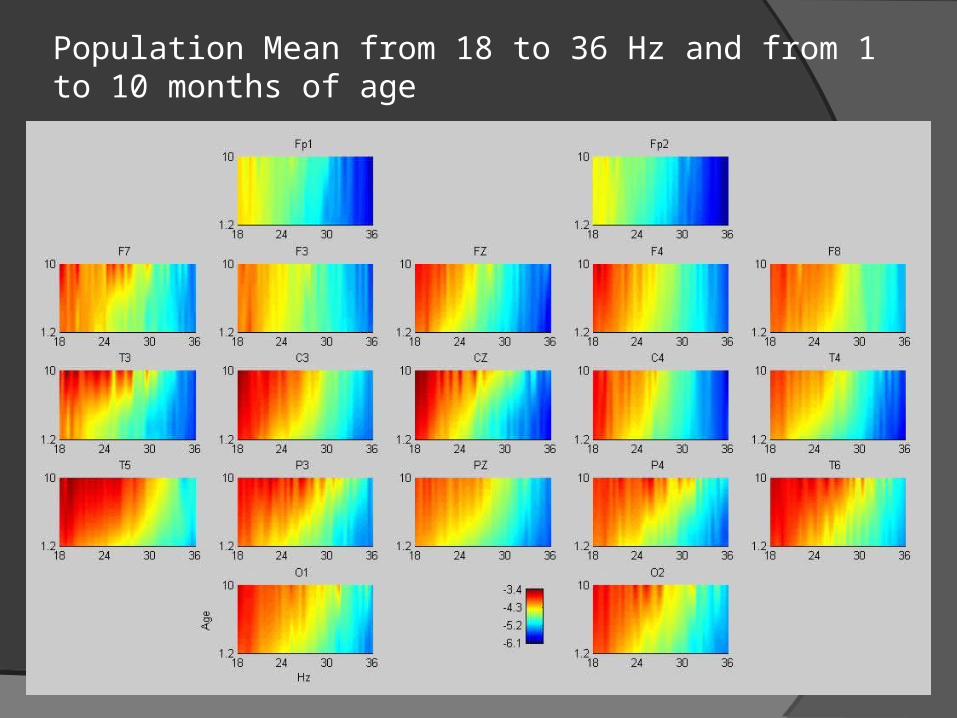
Population Mean from 18 to 36 Hz and from 1 to 10 months of age
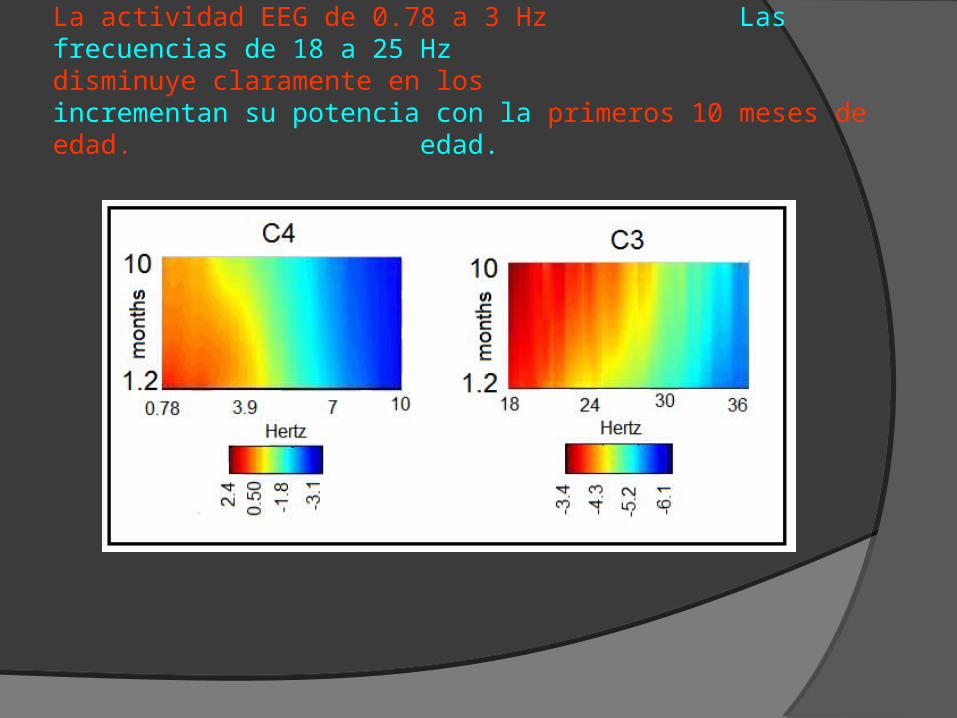
La actividad EEG de 0.78 a 3 Hz Las frecuencias de 18 a 25 Hz disminuye claramente en los incrementan su potencia con la primeros 10 meses de edad. edad.
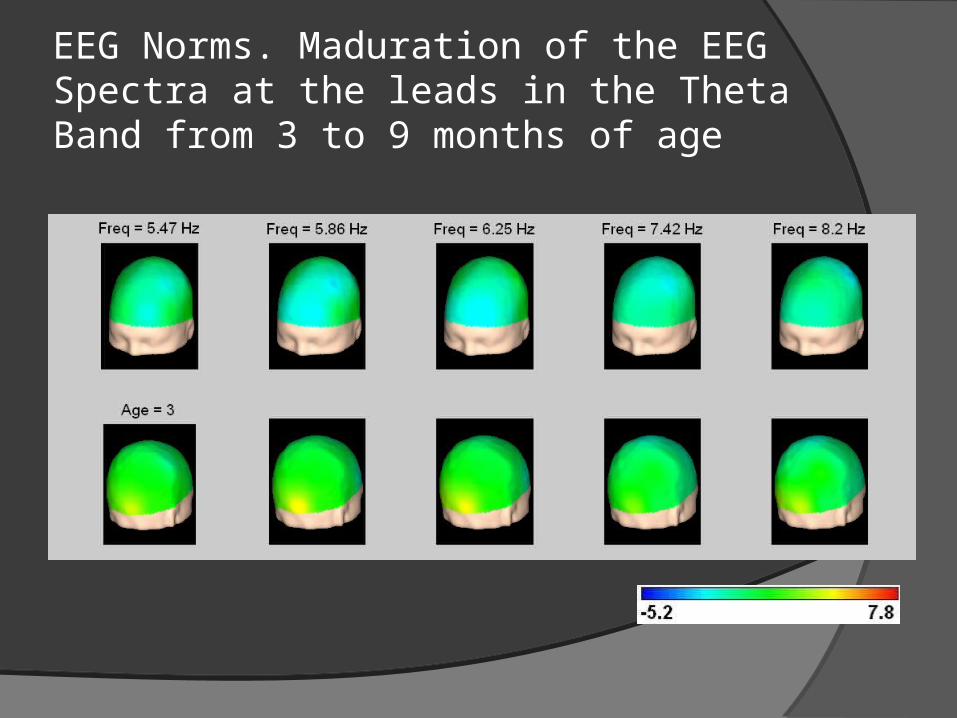
EEG Norms. Maduration of the EEG Spectra at the leads in the Theta Band from 3 to 9 months of age
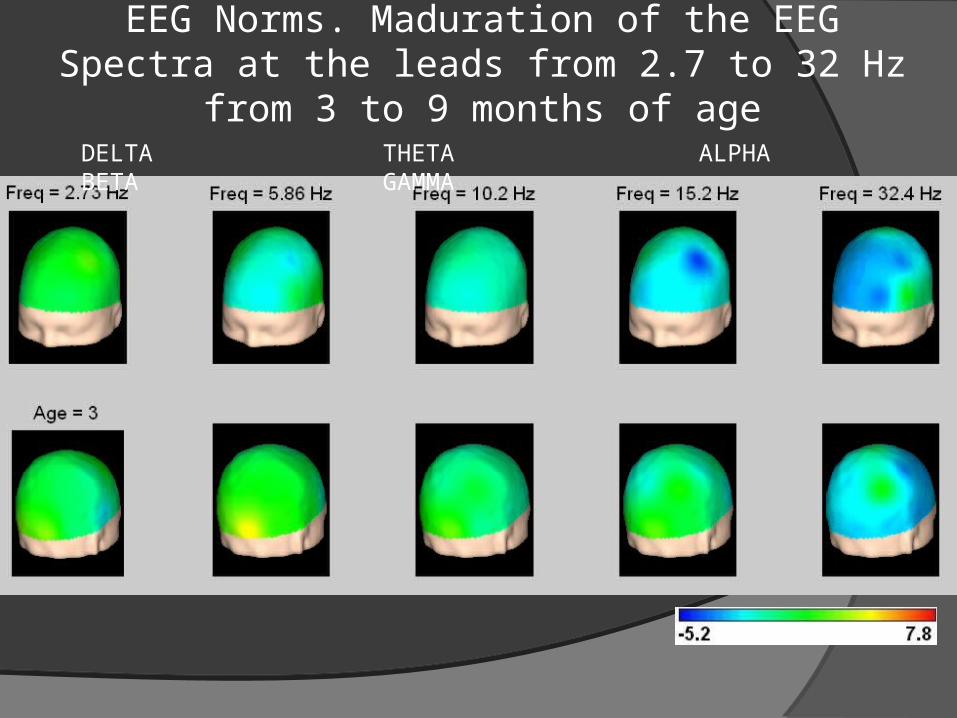
EEG Norms. Maduration of the EEG Spectra at the leads from 2.7 to 32 Hz from 3 to 9 months
of ageDELTA THETA ALPHA BETA GAMMA
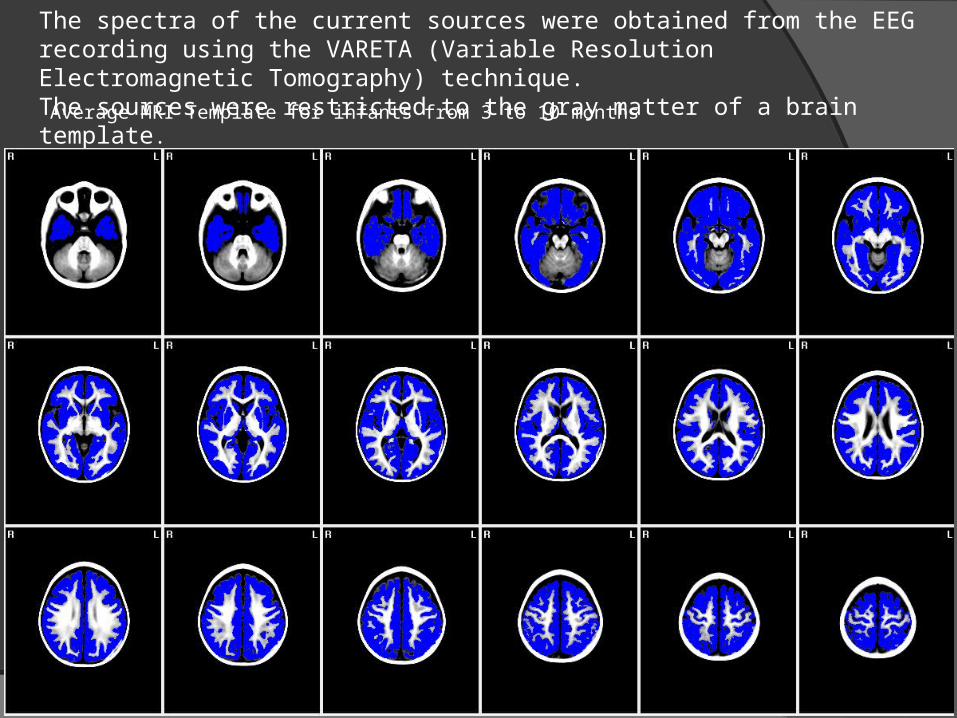
The spectra of the current sources were obtained from the EEG recording using the VARETA (Variable Resolution Electromagnetic Tomography) technique. The sources were restricted to the gray matter of a brain template.Average MRI Template for infants from 3 to 10 months
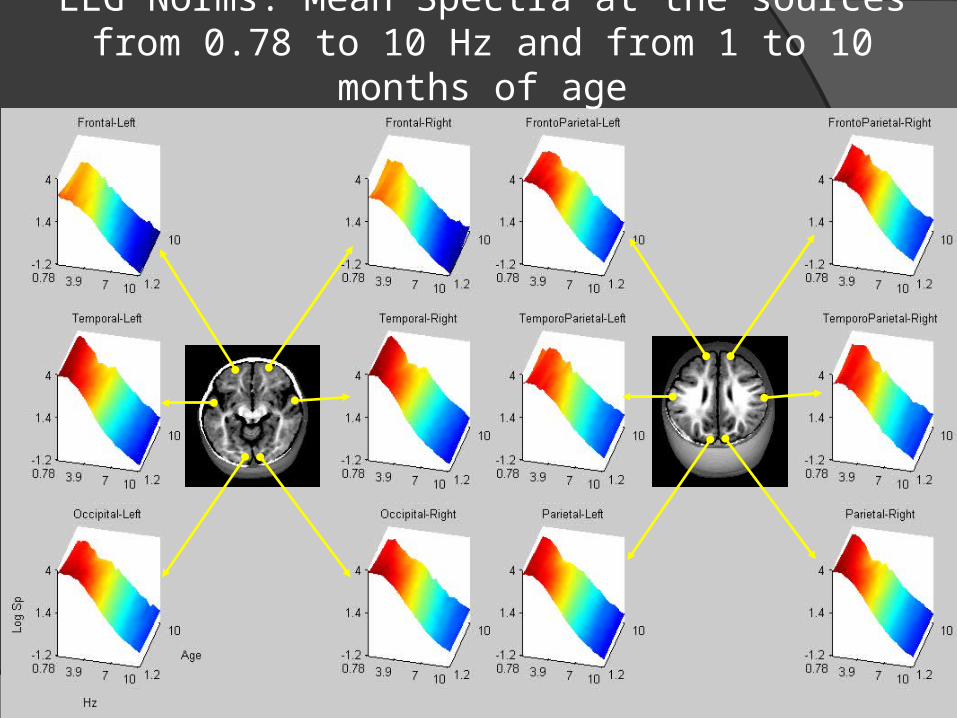
EEG Norms. Mean Spectra at the sources from 0.78 to 10 Hz and from 1 to 10 months of age
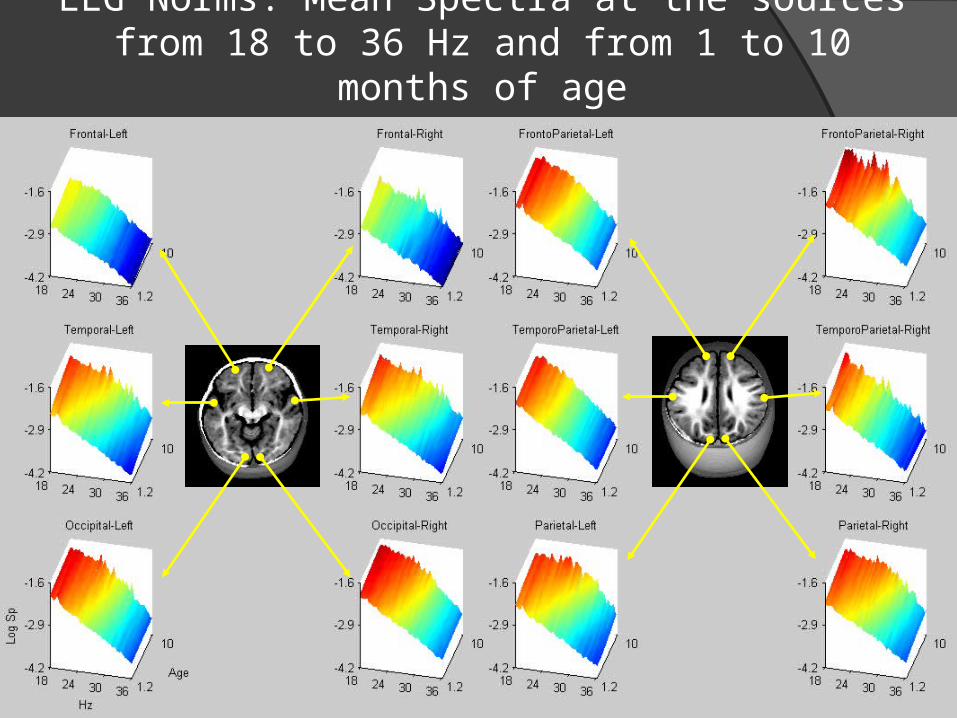
EEG Norms. Mean Spectra at the sources from 18 to 36 Hz and from 1 to 10 months of age
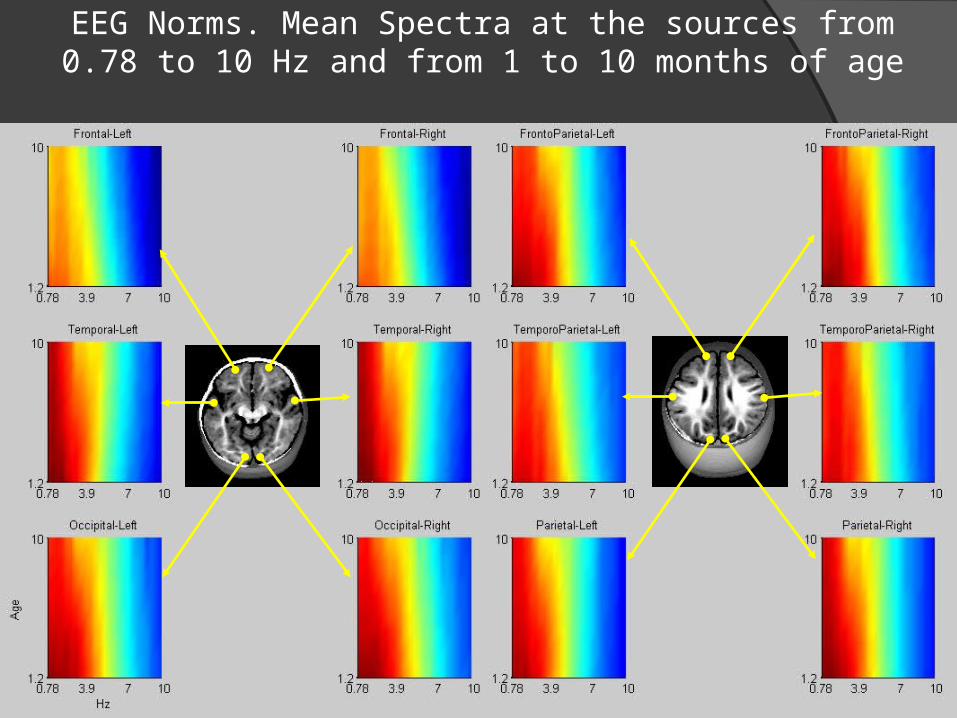
EEG Norms. Mean Spectra at the sources from 0.78 to 10 Hz and from 1 to 10 months of age
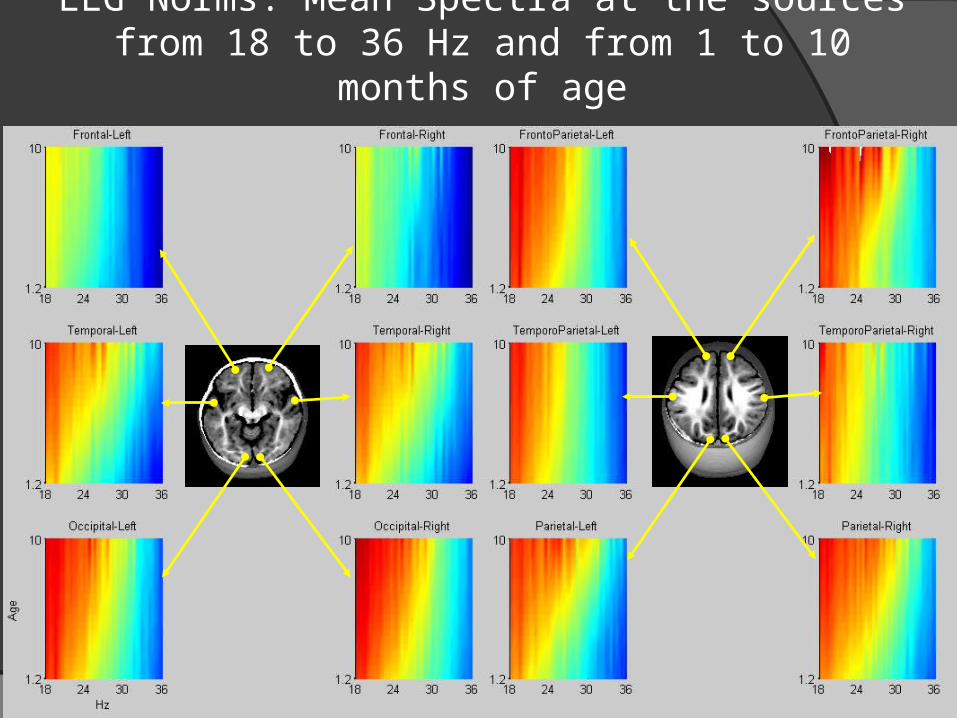
EEG Norms. Mean Spectra at the sources from 18 to 36 Hz and from 1 to 10 months of age
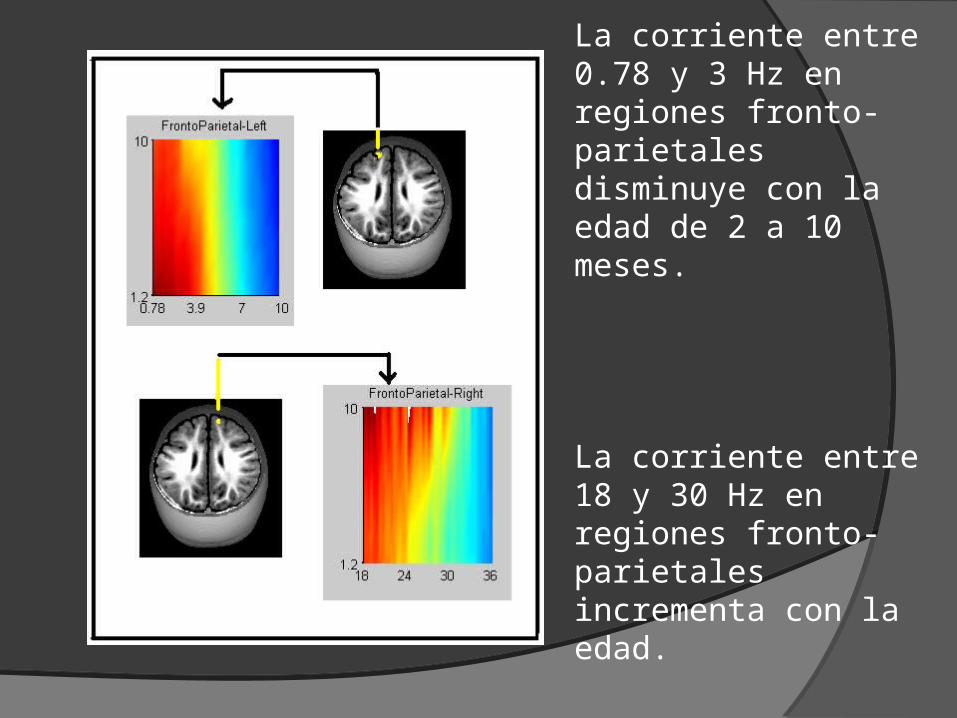
La corriente entre 0.78 y 3 Hz en regiones fronto-parietales disminuye con la edad de 2 a 10 meses.
La corriente entre 18 y 30 Hz en regiones fronto-parietales incrementa con la edad.
Conclusions Data showed what it is known in relation to
lower power values of the slow frequencies at increasing age from 1.2 to 10 months of voltage EEG at the scalp. Robust regression at the slow frequencies were mainly quadratic, whereas at frequencies higher than 4 Hz were mainly linear. Current source densities of the slow frequencies also decreased with age
New data of the effect of age in the first year on frequencies from 18 to 36 Hz showed a progressive increase of power and current density at the sources from 2 to 10 months old.

Thank you for your attention!!