Embed Size (px)
Citation preview
Student: Class: Date:
Statistical Studies: Statistical Investigations III.A Student Activity Sheet 4: Sampling Design and Methods
Charles A. Dana Center at The University of Texas at Austin Advanced Mathematical Decision Making (2010) Activity Sheet 4, 15 pages
23
Recall the Spud Potato Chips scenario from Student Activity Sheet 1. You hypothesized that the true mean weight of bags of Spud’s might be less than the 28.3 grams advertised on the bags. Discuss and make some notes on how you might collect a sample of bags to test your hypothesis. Remember that the sample should be representative of the population. What do you mean by “the population of Spud Potato Chips” that you are interested in testing?
This leads to another circular relationship. You want to know something about a population. You choose a sampling method and obtain a sample. Collecting data from the sample provides some sort of estimate or conclusion about the population of interest.
It may seem that the hard work in statistical investigations comes during data collection. Notice, however, that the other four boxes in the research cycle are the same size as the Collect box—they require the same time and attention as the actual data collection.
In particular, researchers cannot skimp on the time and care given to planning sample selection. If the sample is not representative of your population, the results may be worthless!
Student: Class: Date:
Statistical Studies: Statistical Investigations III.A Student Activity Sheet 4: Sampling Design and Methods
Charles A. Dana Center at The University of Texas at Austin Advanced Mathematical Decision Making (2010) Activity Sheet 4, 15 pages
24
Recall two of the teachers from Student Activity Sheet 1 (Question 13) who were interested in the best test format for student achievement. Mrs. Johnson flipped a coin to decide whether a student would take a multiple-choice or fill-in-the blank exam. Mr. McDonald asked students which format they preferred.
1. These teachers chose to study the population of all students in their classes. This approach is called a census. The U.S. government conducts a census every 10 years. List some things you know about the U.S. Census.
2. Rather than go through the time and expense of a census, researchers usually choose to sample the population. There are a variety of sampling techniques. Define the following common techniques with help from your teacher or by researching other resources.
a. Simple random sampling
b. Stratified random sampling
c. Systematic sampling
Student: Class: Date:
Statistical Studies: Statistical Investigations III.A Student Activity Sheet 4: Sampling Design and Methods
Charles A. Dana Center at The University of Texas at Austin Advanced Mathematical Decision Making (2010) Activity Sheet 4, 15 pages
25
d. Cluster sampling
e. Convenience sampling
3. Suppose the school board wished to see whether the age of the student affects test
achievement. The testing coordinator separated the roster of high school students into freshmen, sophomores, juniors, and seniors and randomly selected 20 students from each classification. She then flipped a coin to determine which test format each student would receive and then compared the results as follows:
• freshmen who took the multiple-choice test compared to freshmen who took the fill-in-the blank exam,
• multiple-choice sophomores compared to fill-in-the-blank sophomores, • multiple-choice juniors compared to fill-in-the-blank juniors, and • multiple-choice seniors compared to fill-in-the-blank seniors.
Randomization still occurred because the testing coordinator flipped the coin to assign the test format to each student. This approach is an example of what type of sampling technique? Explain your thinking.
Student: Class: Date:
Statistical Studies: Statistical Investigations III.A Student Activity Sheet 4: Sampling Design and Methods
Charles A. Dana Center at The University of Texas at Austin Advanced Mathematical Decision Making (2010) Activity Sheet 4, 15 pages
26
4. Mr. McDonald expanded his study to the entire school. He collected a student roster from the office and used the random number generator on his calculator to select one of the first 50 students on the list. Mr. McDonald then selected every 50th student on the list after this initial student for his sample. The calculator generated the number 32. Which students on the roster are the first five in his sample? What type of sampling technique is this? Explain your thinking.
5. Coach Smith wants to know whether students would pay for the privilege of parking their
cars in the lot closest to the school. He surveyed students getting on the buses while he monitored bus loading each afternoon. What type of sampling technique is this? What do you think of his plan?
6. A large university wants to find out whether it is adequately serving the needs of its students who live off campus. The campus is surrounded by a large number of apartment complexes. The researchers randomly selected three of the complexes that seemed to contain a diverse group of residents who adequately reflect the student body as a whole, and they surveyed these residents about campus services. What type of sampling technique is this? Why do you think the university chose this method? Explain your thinking.
Student: Class: Date:
Statistical Studies: Statistical Investigations III.A Student Activity Sheet 4: Sampling Design and Methods
Charles A. Dana Center at The University of Texas at Austin Advanced Mathematical Decision Making (2010) Activity Sheet 4, 15 pages
27
7. Recall the research from Student Activity Sheet 1 (Question 19) in which scientists analyzed the scalp hair samples from 22 participants with epilepsy and 23 participants without epilepsy, checking for differences in levels of copper, iron, zinc, magnesium, and calcium. The scientists were concerned about previous research that showed conflicting results. They speculated that other differences in the study group, besides the presence or absence of epilepsy, could have caused these mixed results. The scientists attempted to control some of these other differences by gathering all participants from the same region of Turkey (indicating similar dietary habits) and separating the participants into the following groups:
• males with epilepsy, • males without epilepsy, • females with epilepsy, and • females without epilepsy.
This is an example of what kind of sampling? Explain your thinking.
8. Recall the study from Student Activity Sheet 1 (Question 19) that tested the effect of replacing rabbits’ soybean diet with Gliricidia sepium Leaf Meal (GLM). Twenty-five young rabbits were randomly assigned to receive either 0%, 5%, 10%, 15%, or 20% GLM. Suppose, rather than random assignment, the scientists chose the following method:
The research assistant who was in charge of gathering rabbits went in the barn and assigned the first five rabbits he could catch to the 0% group. He assigned the next five that he caught to the 5% group, and so on.
What type of sampling technique is this? What do you think of his plan?
Student: Class: Date:
Statistical Studies: Statistical Investigations III.A Student Activity Sheet 4: Sampling Design and Methods
Charles A. Dana Center at The University of Texas at Austin Advanced Mathematical Decision Making (2010) Activity Sheet 4, 15 pages
28
9. REFLECTION: During busy political seasons, many opinion polls are conducted. In a presidential race, how do you think the participants in polls are generally selected? Discuss any issues regarding simple random, stratified, systematic, cluster, and convenience sampling in these polls. What about other types of polls, besides political?
Student: Class: Date:
Statistical Studies: Statistical Investigations III.A Student Activity Sheet 4: Sampling Design and Methods
Charles A. Dana Center at The University of Texas at Austin Advanced Mathematical Decision Making (2010) Activity Sheet 4, 15 pages
29
10. Describe briefly how each technique could be used in the potato chip investigation. Which techniques are the most appropriate?
• Simple random sampling
• Stratified random sampling
• Systematic sampling
• Cluster sampling
• Convenience sampling
Student: Class: Date:
Statistical Studies: Statistical Investigations III.A Student Activity Sheet 4: Sampling Design and Methods
Charles A. Dana Center at The University of Texas at Austin Advanced Mathematical Decision Making (2010) Activity Sheet 4, 15 pages
30
11. The most feasible method is to ask other U.S. schools to help with cluster sampling. On a smaller scale, you could mimic this by cluster sampling from grocery stores in the area. The easiest choice (but least reliable) is convenience sampling.
Pursue the idea of cluster sampling with other schools. To do this, you simply modify random selection techniques to choose your schools. Following are two ways to use random numbers for selection.
Method 1: Random Number Tables
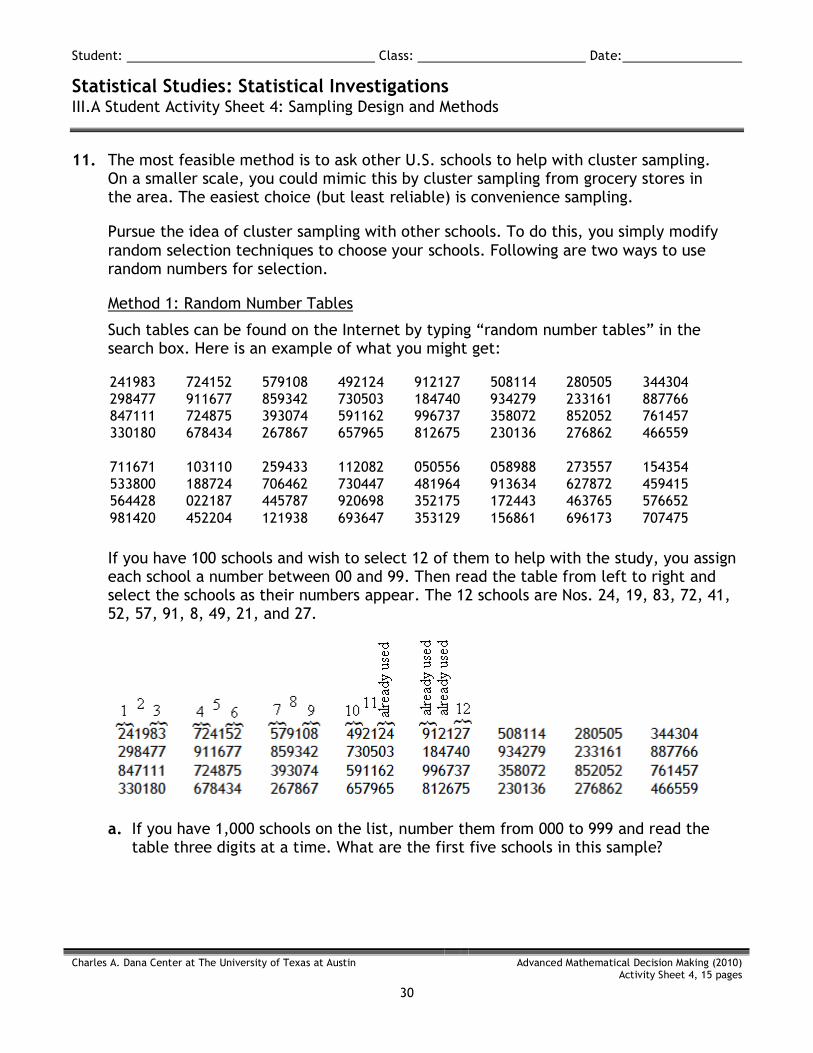
Such tables can be found on the Internet by typing “random number tables” in the search box. Here is an example of what you might get:
241983 724152 579108 492124 912127 508114 280505 344304 298477 911677 859342 730503 184740 934279 233161 887766 847111 724875 393074 591162 996737 358072 852052 761457 330180 678434 267867 657965 812675 230136 276862 466559 711671 103110 259433 112082 050556 058988 273557 154354 533800 188724 706462 730447 481964 913634 627872 459415 564428 022187 445787 920698 352175 172443 463765 576652 981420 452204 121938 693647 353129 156861 696173 707475
If you have 100 schools and wish to select 12 of them to help with the study, you assign each school a number between 00 and 99. Then read the table from left to right and select the schools as their numbers appear. The 12 schools are Nos. 24, 19, 83, 72, 41, 52, 57, 91, 8, 49, 21, and 27.
a. If you have 1,000 schools on the list, number them from 000 to 999 and read the table three digits at a time. What are the first five schools in this sample?
Student: Class: Date:
Statistical Studies: Statistical Investigations III.A Student Activity Sheet 4: Sampling Design and Methods
Charles A. Dana Center at The University of Texas at Austin Advanced Mathematical Decision Making (2010) Activity Sheet 4, 15 pages
31
b. To avoid using the same numbers for every study, you can start from a different row. If you read three digits at a time starting with the third row, what five schools do you put in your sample?
Method 2: Random Number Generators
The same task can be accomplished with your graphing calculator or a random number generator found on the Internet.
c. If you use the calculator to choose a sample from the list of 1,000 schools, what are the first five schools in your sample? (Hint: Remember that you need three-digit numbers.)
Student: Class: Date:
Statistical Studies: Statistical Investigations III.A Student Activity Sheet 4: Sampling Design and Methods
Charles A. Dana Center at The University of Texas at Austin Advanced Mathematical Decision Making (2010) Activity Sheet 4, 15 pages
32
12. EXTENSION
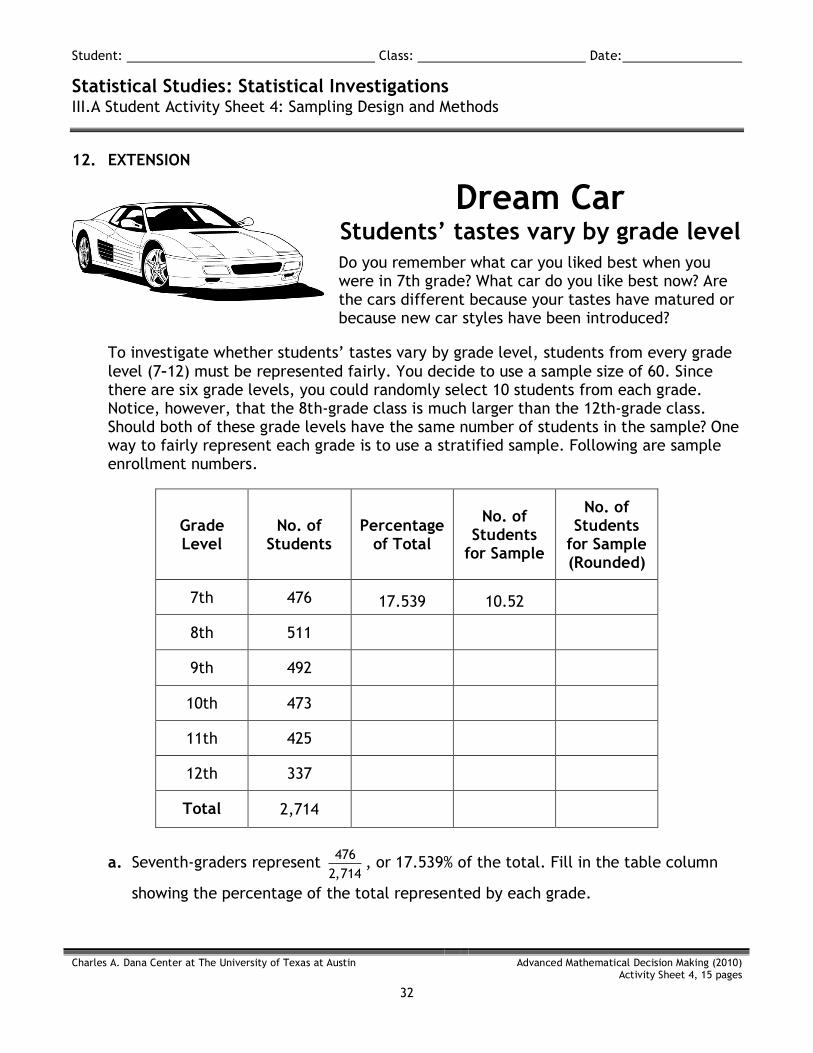
Dream Car Students’ tastes vary by grade level Do you remember what car you liked best when you were in 7th grade? What car do you like best now? Are the cars different because your tastes have matured or because new car styles have been introduced?
To investigate whether students’ tastes vary by grade level, students from every grade level (7–12) must be represented fairly. You decide to use a sample size of 60. Since there are six grade levels, you could randomly select 10 students from each grade. Notice, however, that the 8th-grade class is much larger than the 12th-grade class. Should both of these grade levels have the same number of students in the sample? One way to fairly represent each grade is to use a stratified sample. Following are sample enrollment numbers.
Grade Level
No. of Students
Percentage of Total
No. of Students
for Sample
No. of Students
for Sample (Rounded)
7th 476 17.539 10.52
8th 511
9th 492
10th 473
11th 425
12th 337
Total 2,714
a. Seventh-graders represent
4762,714
, or 17.539% of the total. Fill in the table column
showing the percentage of the total represented by each grade.
Student: Class: Date:
Statistical Studies: Statistical Investigations III.A Student Activity Sheet 4: Sampling Design and Methods
Charles A. Dana Center at The University of Texas at Austin Advanced Mathematical Decision Making (2010) Activity Sheet 4, 15 pages
33
b. Since you plan to collect data from a sample size of 60, fill in the fourth column of the table indicating how many of the sample should be allocated to each grade. For example, the 7th graders get 0.17539 • 60 = 10.52 representatives in the sample.
c. In the fifth column of the table, round each number in the normal way. What sample size does this give?
d. How should you award the extra person(s)?
Student: Class: Date:
Statistical Studies: Statistical Investigations III.A Student Activity Sheet 4: Sampling Design and Methods
Charles A. Dana Center at The University of Texas at Austin Advanced Mathematical Decision Making (2010) Activity Sheet 4, 15 pages
34
13. EXTENSION
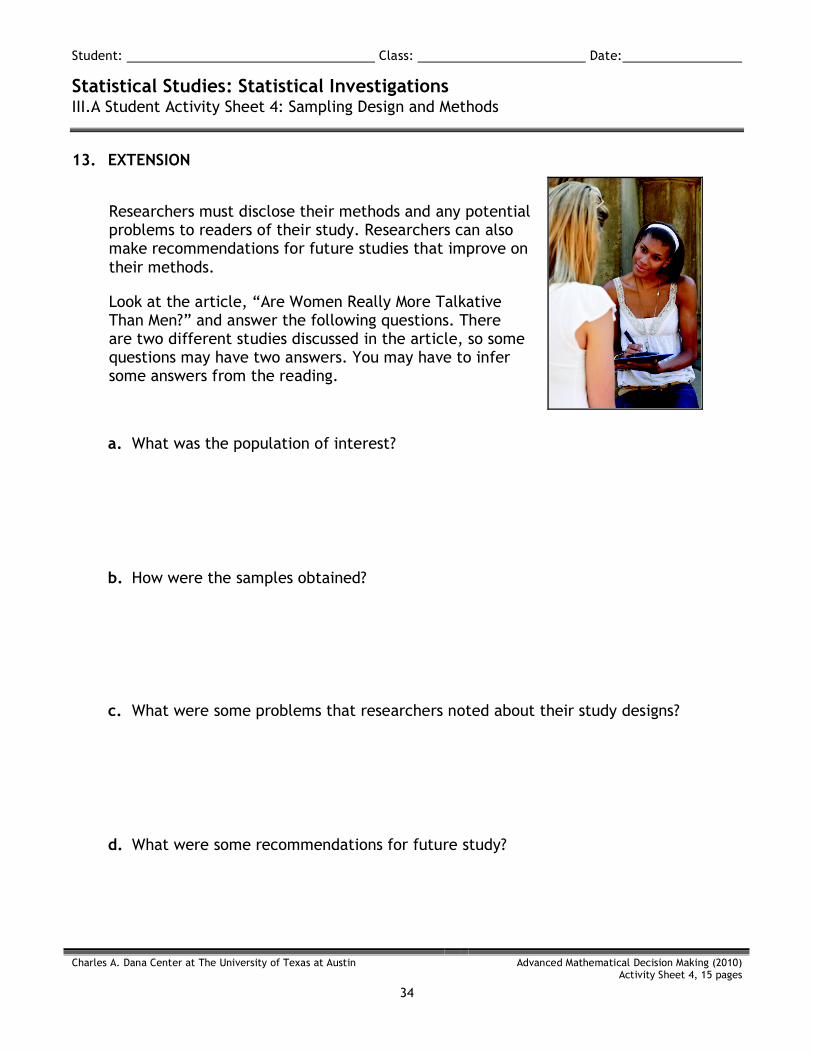
Researchers must disclose their methods and any potential problems to readers of their study. Researchers can also make recommendations for future studies that improve on their methods.
Look at the article, “Are Women Really More Talkative Than Men?” and answer the following questions. There are two different studies discussed in the article, so some questions may have two answers. You may have to infer some answers from the reading.
a. What was the population of interest?
b. How were the samples obtained?
c. What were some problems that researchers noted about their study designs?
d. What were some recommendations for future study?
Student: Class: Date:
Statistical Studies: Statistical Investigations III.A Student Activity Sheet 4: Sampling Design and Methods
Charles A. Dana Center at The University of Texas at Austin Advanced Mathematical Decision Making (2010) Activity Sheet 4, 15 pages
35
14. EXTENSION
Cavities and Kids Does eating candy increase cavities?
Have you ever seen a news report on the effect that eating candy has on children’s teeth? To study this subject further, what are some issues you would have to consider?
a. Describe an observational design to study this issue. Be sure to include a description of the population of interest, your sample selection technique, and what variables will be measured.
b. Describe an experimental design to study this issue. Be sure to include a description of the population of interest, your sample selection technique, and what variables will be measured.
Student: Class: Date:
Statistical Studies: Statistical Investigations III.A Student Activity Sheet 4: Sampling Design and Methods
Charles A. Dana Center at The University of Texas at Austin Advanced Mathematical Decision Making (2010) Activity Sheet 4, 15 pages
36
c. What is a key difference in what can be reported for each design type?
d. Are there any other issues to consider in this study? For example, do you want to put all children in a group together? Or can you think of a way in which stratified sampling is more appropriate?
Student: Class: Date:
Statistical Studies: Statistical Investigations III.A Student Activity Sheet 4: Sampling Design and Methods
Charles A. Dana Center at The University of Texas at Austin Advanced Mathematical Decision Making (2010) Activity Sheet 4, 15 pages
37
15. EXTENSION
“When I Grow Up…” What careers are of most interest to teens?
a. What do you think a news report on teens’ career plans would say?
b. If you wanted to study this subject further, what are some issues you must consider?
c. Write three questions that could address those issues.