Embed Size (px)
Citation preview
Statistical Techniques
Masoud Mansoury and Anas Abulfaraj
What is Statistics?
https://www.youtube.com/watch?v=LmMZj7599pw
The definition of Statistics
- The practice or science of collecting and analyzing numerical data in large quantities, especially for the purpose of inferring proportions in a whole from those in a representative sample.
- A branch of mathematics dealing with the collection, analysis, interpretation, and presentation of masses of numerical data
The usefulness of statistics in our everyday life- Predicting Disease:
- If the reporter simply reports the number of people who either have the disease or who have died from it, it's an interesting fact but it might not mean much to your life. But when statistics become involved, you have a better idea of how that disease may affect you.
- For example, studies have shown that 85 to 95 percent of lung cancers are smoking related. The statistic should tell you that almost all lung cancers are related to smoking and that if you want to have a good chance of avoiding lung cancer, you shouldn't smoke.
- Quality Testing:- Companies make thousands of products every day and each company must make sure
that a good quality item is sold. But a company can't test each and every item that they ship to you, the consumer. So the company uses statistics to test just a few, called a sample, of what they make. If the sample passes quality tests, then the company assumes that all the items made in the group, called a batch, are good.
The usefulness of statistics in our everyday life- Weather Forecasts.
- Stock Market.
- Others.
Statistical thinking will one day be as necessary for efficient
citizenship as the ability to read and write. Samuel S. Wilks

Think of your own problem or field
Statistical Analysis Three main steps:
- Data Preparation
- Descriptive Statistics
- Inferential Statistics
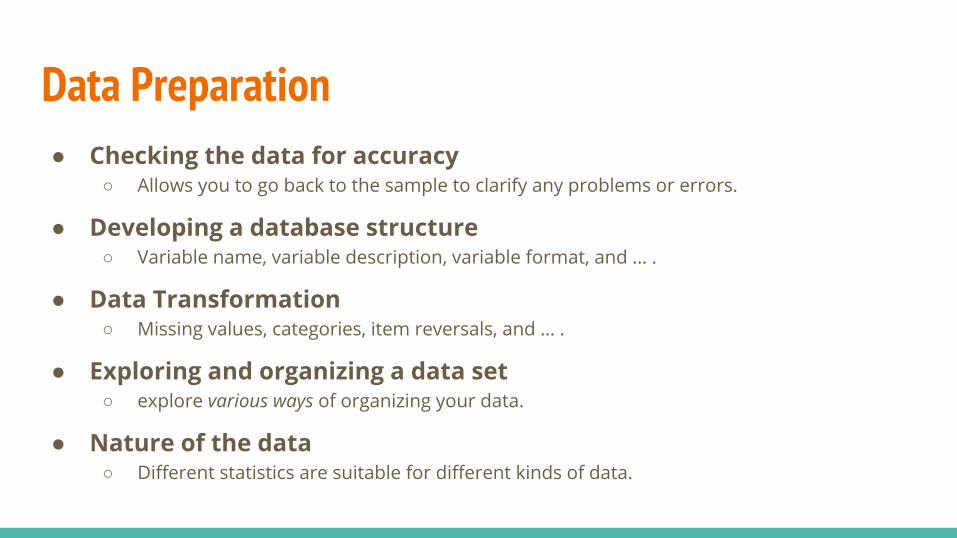
Data Preparation ● Checking the data for accuracy
○ Allows you to go back to the sample to clarify any problems or errors.
● Developing a database structure○ Variable name, variable description, variable format, and … .
● Data Transformation○ Missing values, categories, item reversals, and … .
● Exploring and organizing a data set○ explore various ways of organizing your data.
● Nature of the data○ Different statistics are suitable for different kinds of data.
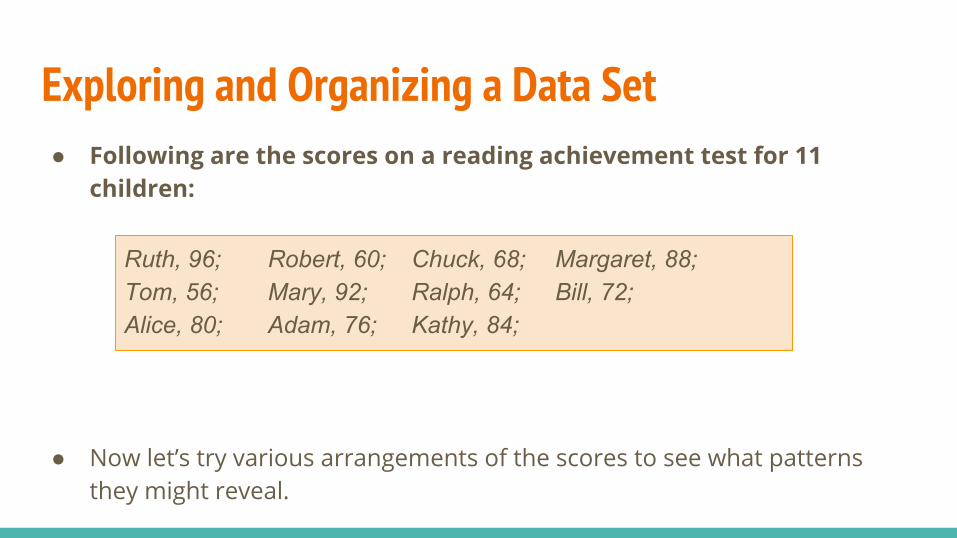
Exploring and Organizing a Data Set● Following are the scores on a reading achievement test for 11
children:
● Now let’s try various arrangements of the scores to see what patterns they might reveal.
Ruth, 96; Robert, 60; Chuck, 68; Margaret, 88;Tom, 56; Mary, 92; Ralph, 64; Bill, 72;Alice, 80; Adam, 76; Kathy, 84;
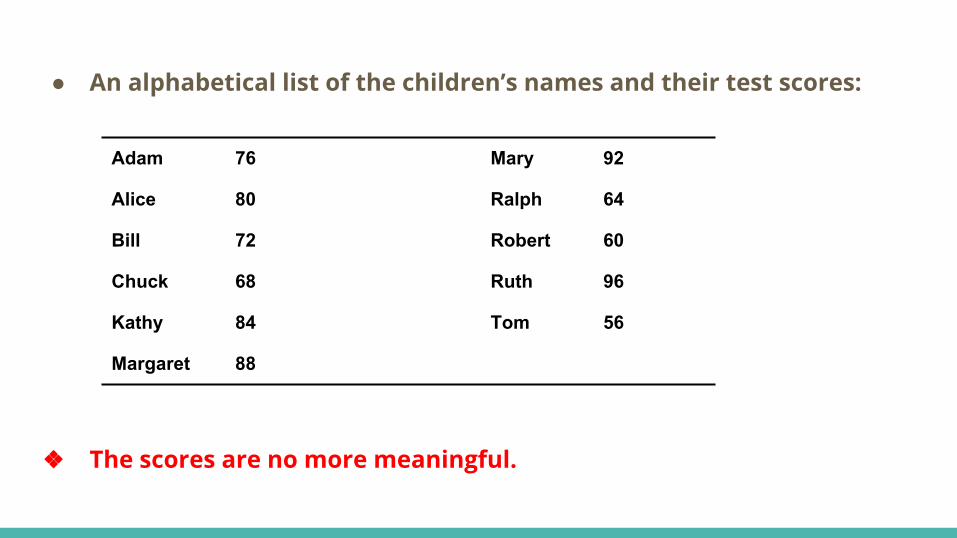
● An alphabetical list of the children’s names and their test scores:
❖ The scores are no more meaningful.
Adam 76 Mary 92
Alice 80 Ralph 64
Bill 72 Robert 60
Chuck 68 Ruth 96
Kathy 84 Tom 56
Margaret 88
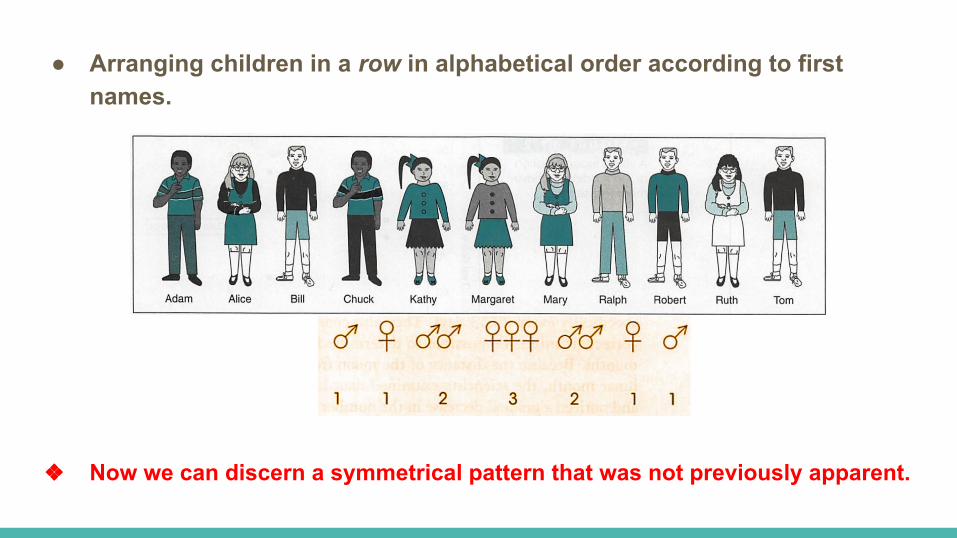
● Arranging children in a row in alphabetical order according to first names.
❖ Now we can discern a symmetrical pattern that was not previously apparent.
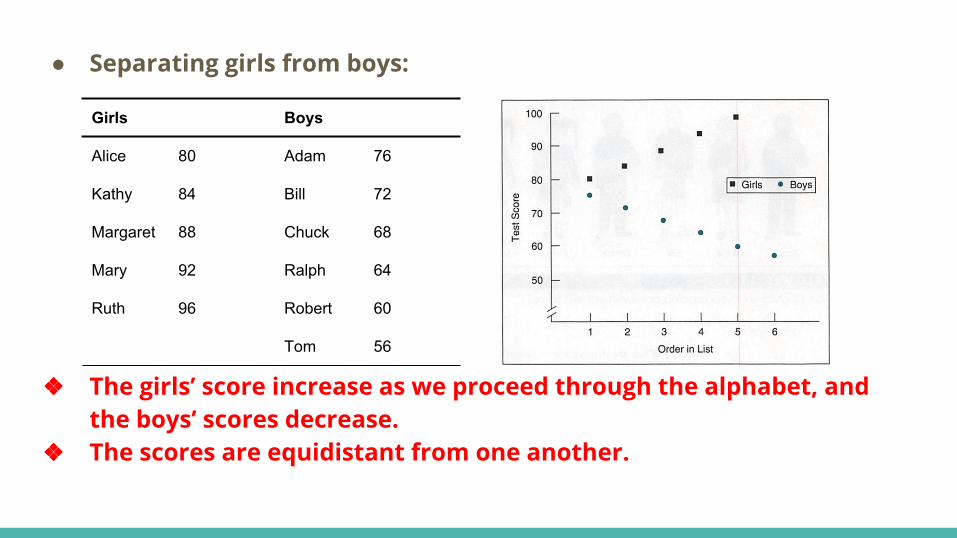
● Separating girls from boys:
❖ The girls’ score increase as we proceed through the alphabet, and the boys’ scores decrease.
❖ The scores are equidistant from one another.
Girls Boys
Alice 80 Adam 76
Kathy 84 Bill 72
Margaret 88 Chuck 68
Mary 92 Ralph 64
Ruth 96 Robert 60
Tom 56
Exploring and Organizing a Data Set● It is important to see the dynamics within the data.
● For the researcher working in an area science, observations of a similar kind may reveal important new knowledge.
● How the researcher prepares the data for inspection or interpretation will affect the meaning that those data reveal. Therefore, every researcher should be able to provide a clear, logical rationale for the procedure used to arrange and organize the data.
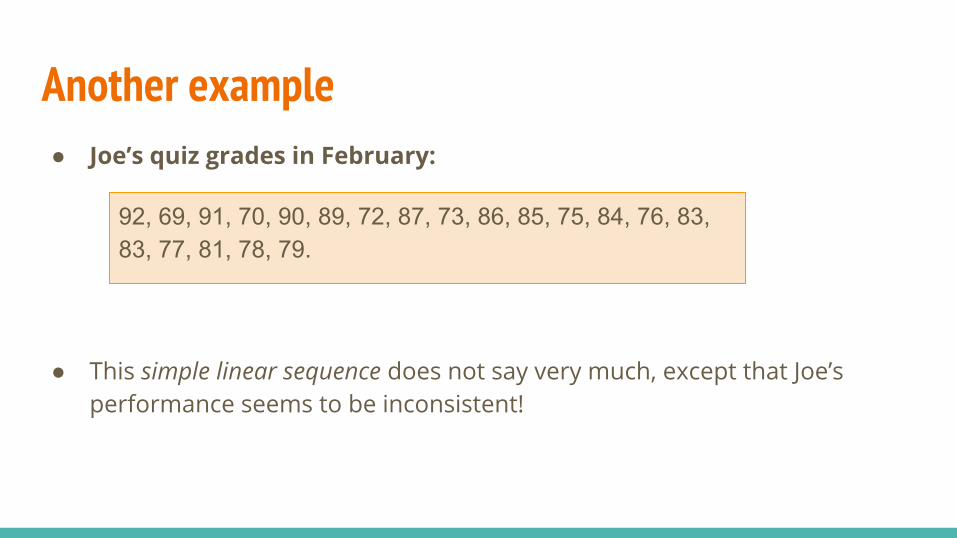
Another example● Joe’s quiz grades in February:
● This simple linear sequence does not say very much, except that Joe’s performance seems to be inconsistent!
92, 69, 91, 70, 90, 89, 72, 87, 73, 86, 85, 75, 84, 76, 83, 83, 77, 81, 78, 79.
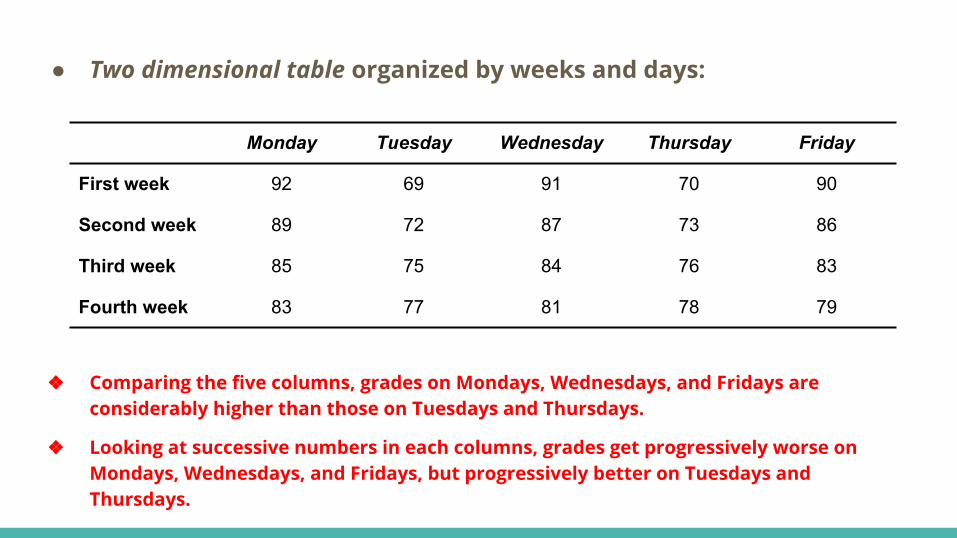
● Two dimensional table organized by weeks and days:
❖ Comparing the five columns, grades on Mondays, Wednesdays, and Fridays are considerably higher than those on Tuesdays and Thursdays.
❖ Looking at successive numbers in each columns, grades get progressively worse on Mondays, Wednesdays, and Fridays, but progressively better on Tuesdays and Thursdays.
Monday Tuesday Wednesday Thursday Friday
First week 92 69 91 70 90
Second week 89 72 87 73 86
Third week 85 75 84 76 83
Fourth week 83 77 81 78 79
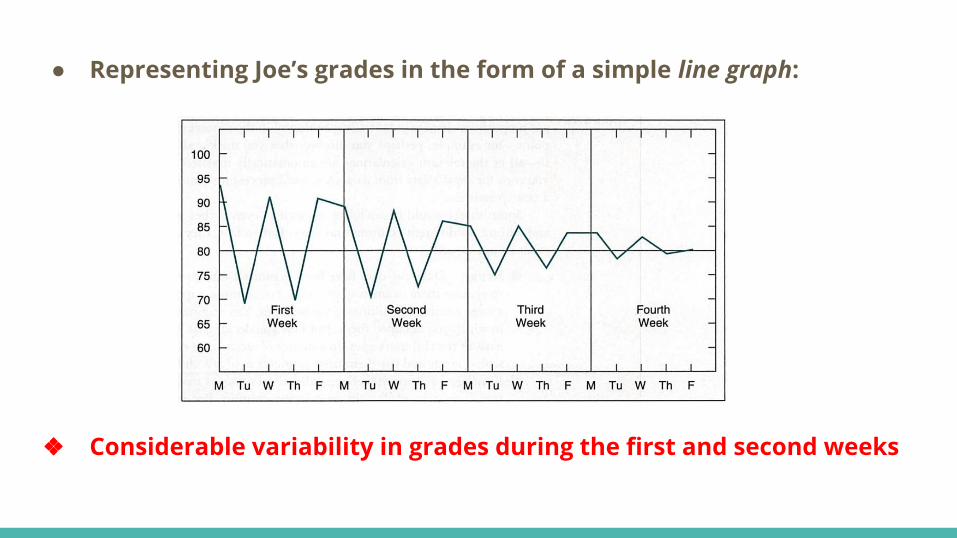
● Representing Joe’s grades in the form of a simple line graph:
❖ Considerable variability in grades during the first and second weeks
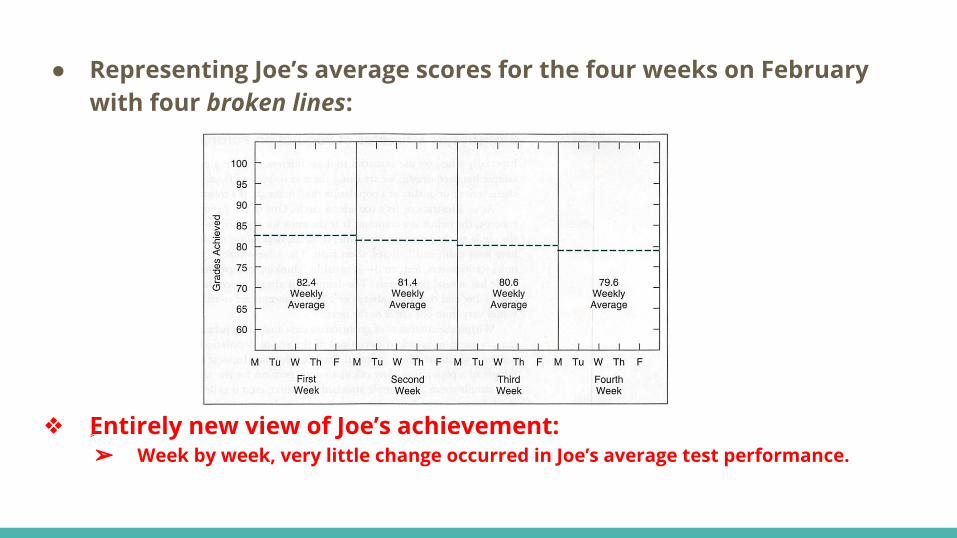
● Representing Joe’s average scores for the four weeks on February with four broken lines:
❖ ٍEntirely new view of Joe’s achievement:➢ Week by week, very little change occurred in Joe’s average test performance.
Looking at data in only one way yields an incomplete view of those data and thus provides only a portion of the meaning those
data hold.
Nature of the Data● Different statistics are suitable for different kinds of data.● You should consider whether your data
○ Have been collected for a single group or, instead, for two or more groups○ Involved continuous or discrete variables○ Represent nominal, ordinal, interval, or ratio scale○ Reflect a normal or non-normal distribution
● After these distinctions, we will relate them to another distinctions:○ Parametric and non-parametric statistics.
Parametric vs. Non-Parametric● Parametric statistics
○ The data reflect an interval or ratio scale.○ The data fall in a normal distribution.
● Non-Parametric statistics○ Not based on such assumptions.
● Why not use non-parametric statistics all the time to avoid having to make (and possibly violate) any assumption about the data?
Descriptive Statistics Descriptive statistics are used to describe the basic features of the data in a study. They provide simple summaries about the sample and the measures. Together with simple graphics analysis, they form the basis of virtually every quantitative analysis of data. There are four important things to know about a data set:
- Distribution - Central Tendency - Variability- Correlation
Data TypesThere are four data types:
- Ordinal- Nominal - Ratio- Interval
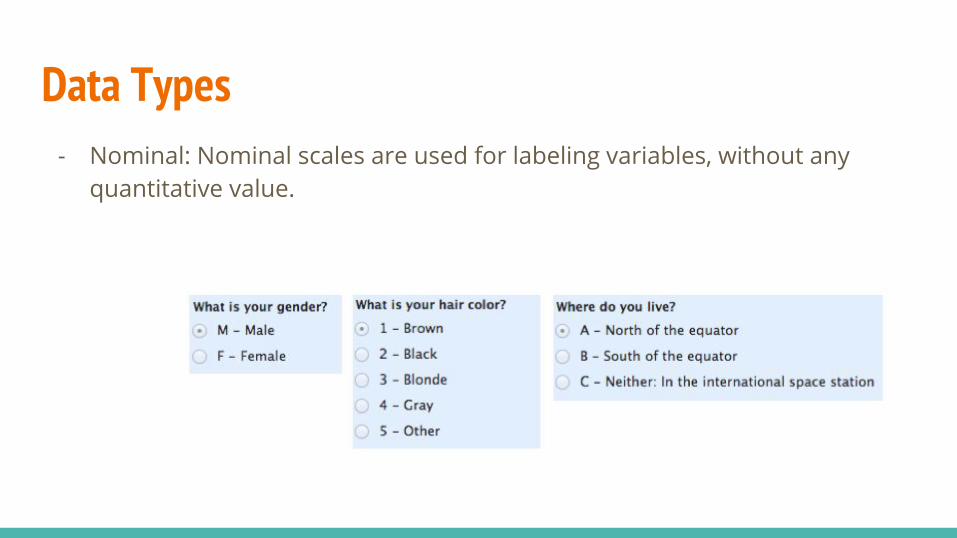
Data Types- Nominal: Nominal scales are used for labeling variables, without any
quantitative value.
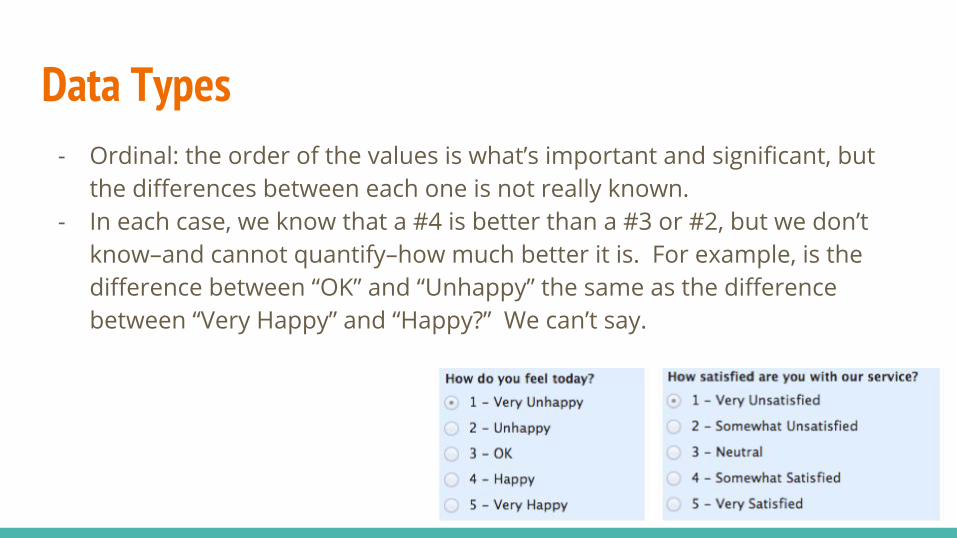
Data Types- Ordinal: the order of the values is what’s important and significant, but
the differences between each one is not really known.- In each case, we know that a #4 is better than a #3 or #2, but we don’t
know–and cannot quantify–how much better it is. For example, is the difference between “OK” and “Unhappy” the same as the difference between “Very Happy” and “Happy?” We can’t say.
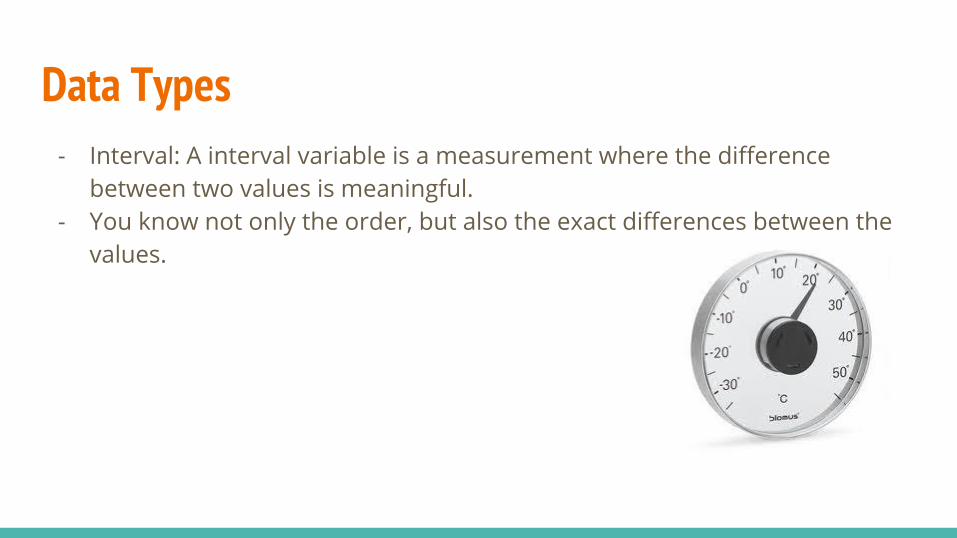
Data Types- Interval: A interval variable is a measurement where the difference
between two values is meaningful.- You know not only the order, but also the exact differences between the
values.
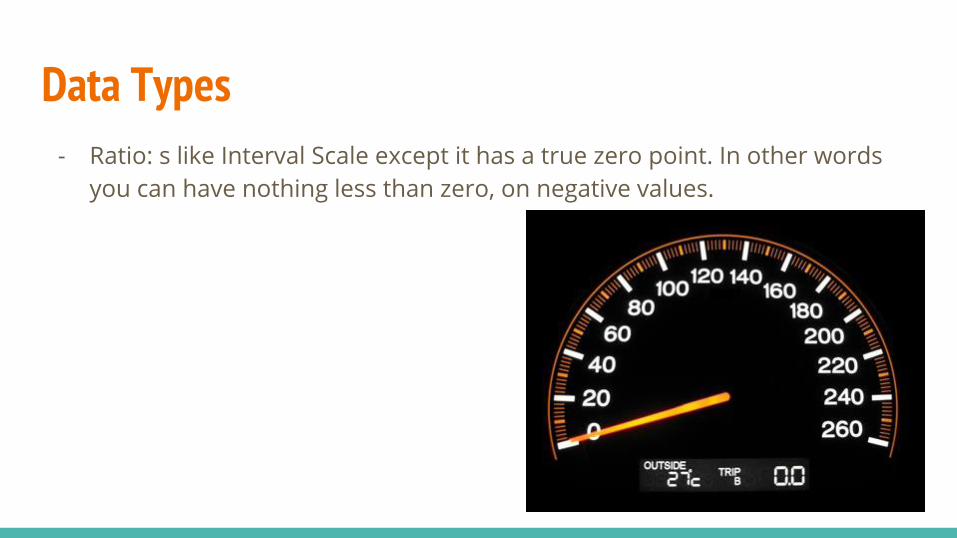
Data Types- Ratio: s like Interval Scale except it has a true zero point. In other words
you can have nothing less than zero, on negative values.
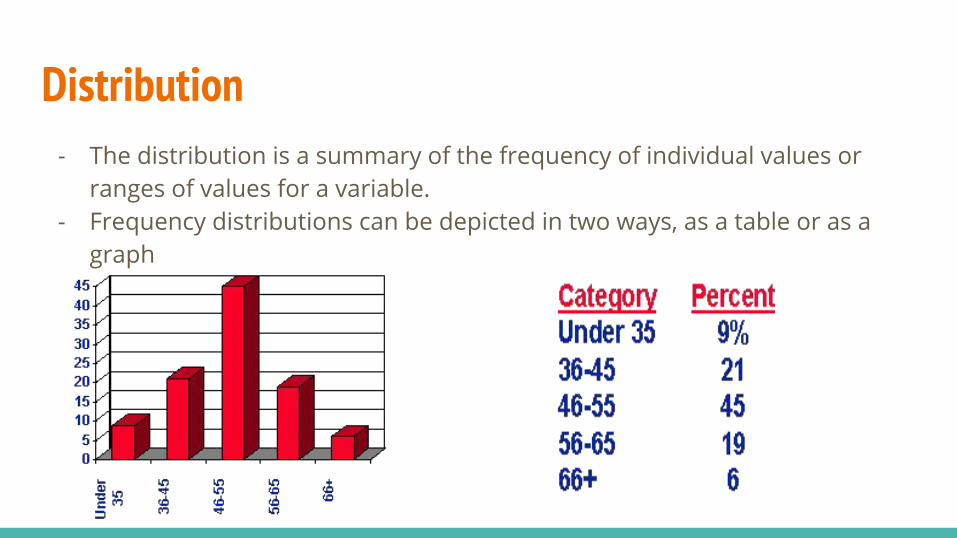
Distribution- The distribution is a summary of the frequency of individual values or
ranges of values for a variable. - Frequency distributions can be depicted in two ways, as a table or as a
graph
Central Tendency - A point of central tendency is a point around which the data revolve, a
middle number around which the data regarding a particular variable seem to hover.
- Three commonly used measures of central tendency are:a. Mode: The single number or score that occurs most frequently.b. Median: The numerical center of a set of data, with exactly as many scores above it as
below it.c. Mean: The single point at which the two sides of a distribution balance.
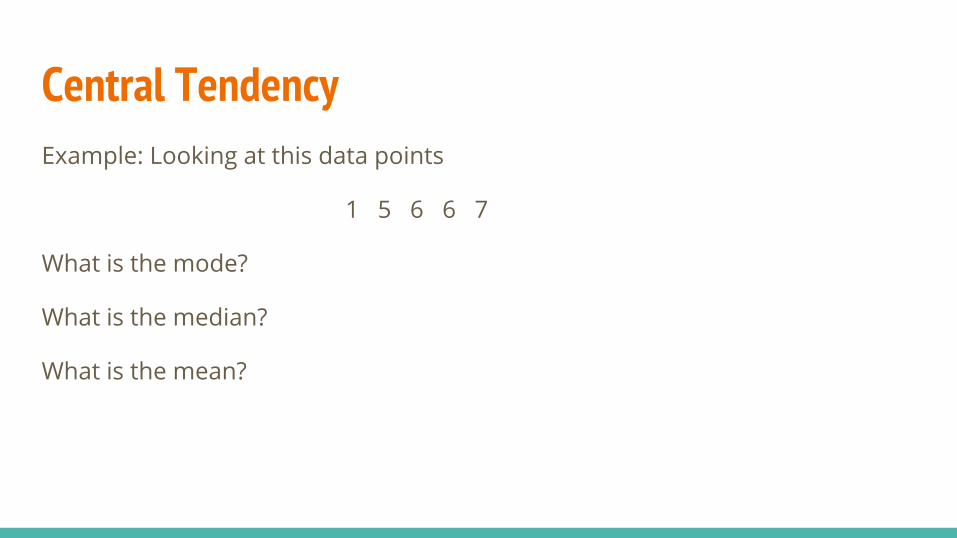
Central TendencyExample: Looking at this data points
1 5 6 6 7
What is the mode?
What is the median?
What is the mean?
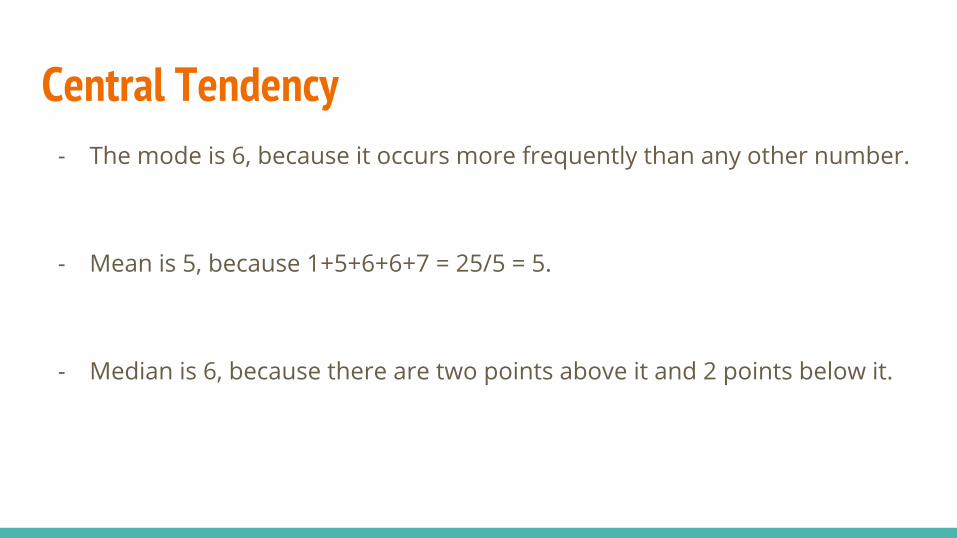
Central Tendency- The mode is 6, because it occurs more frequently than any other number.
- Mean is 5, because 1+5+6+6+7 = 25/5 = 5.
- Median is 6, because there are two points above it and 2 points below it.
Central TendencyWhen to use mode?
When to use median?
When to use mean?
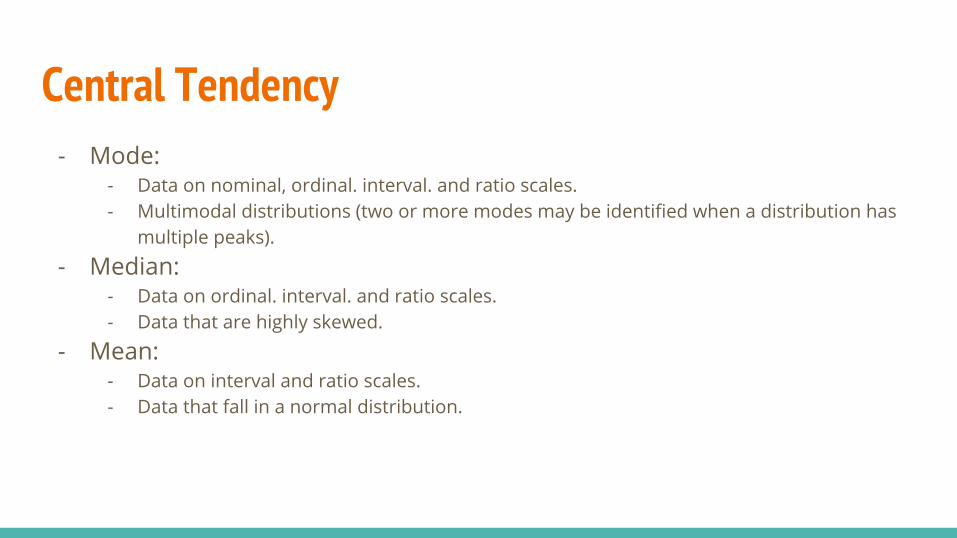
Central Tendency- Mode:
- Data on nominal, ordinal. interval. and ratio scales.- Multimodal distributions (two or more modes may be identified when a distribution has
multiple peaks).
- Median:- Data on ordinal. interval. and ratio scales.- Data that are highly skewed.
- Mean:- Data on interval and ratio scales.- Data that fall in a normal distribution.
Central Tendency as Predictor Suppose you are walking down the street. Suddenly you come to a crowd of people forming in a normal-curve-like manner. Where, based on your best prediction, will you find the cause for the crowd forming? The answer is simple. Where the crowd is deepest, where the greatest number of people are, you will probably find the cause for the gathering. It may be an accident, a street fight, or a person giving away free candy bars.
Variability- Variability is the extent to which data points in a statistical distribution or
data set diverge from the average, or mean, value as well as the extent to which these data points differ from each other.
- Four commonly used measures of Variability are:a. Range: The difference between the highest and lowest scores in the distribution.b. Interquartile range: The difference between the 25th and 75th percentiles.c. Standard deviation: a quantity calculated to indicate the extent of deviation for a group as
a whole.d. Variance: The average of the squared differences from the mean.
VariabilityExample: looking at this data points
4 4 6 7 10 11 12 14 15
What is the range?
What is the interquartile range?
What is the variance?
What is the standard deviation?
Variability 4 4 6 7 10 11 12 14 15
- The range is 11. - The max value is 15, and the min value is 4. Therefore, 15-4 = 11.
- The interquartile range is 8. - The median is 10, the 25th percentile is 5 and the 75th percentile is 13. Therefore, 13-5 =
8.
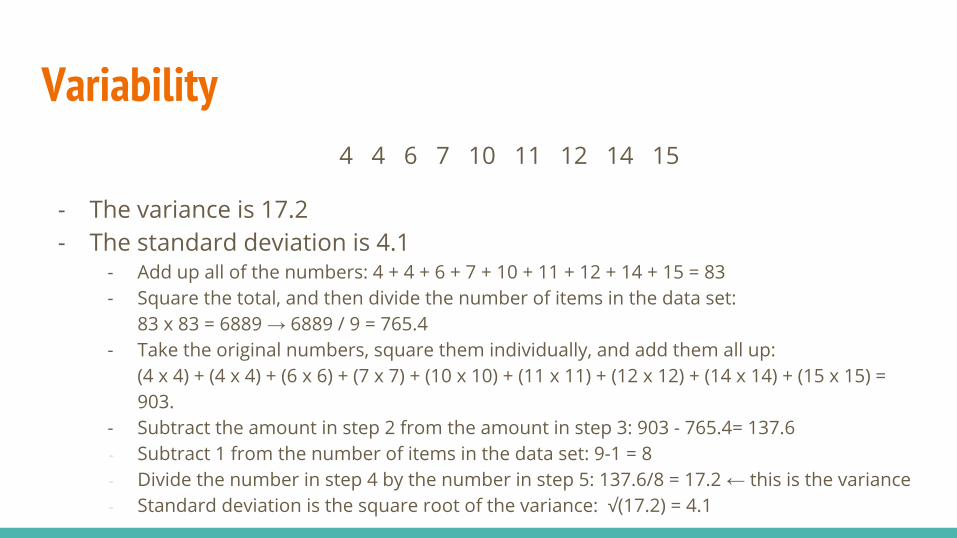
Variability 4 4 6 7 10 11 12 14 15
- The variance is 17.2- The standard deviation is 4.1
- Add up all of the numbers: 4 + 4 + 6 + 7 + 10 + 11 + 12 + 14 + 15 = 83- Square the total, and then divide the number of items in the data set:
83 x 83 = 6889 → 6889 / 9 = 765.4- Take the original numbers, square them individually, and add them all up:
(4 x 4) + (4 x 4) + (6 x 6) + (7 x 7) + (10 x 10) + (11 x 11) + (12 x 12) + (14 x 14) + (15 x 15) = 903.
- Subtract the amount in step 2 from the amount in step 3: 903 - 765.4= 137.6- Subtract 1 from the number of items in the data set: 9-1 = 8 - Divide the number in step 4 by the number in step 5: 137.6/8 = 17.2 ← this is the variance- Standard deviation is the square root of the variance: √(17.2) = 4.1
VariabilityWhen to use range?
When to use Interquartile range?
When to use standard deviation?
When to use variance?
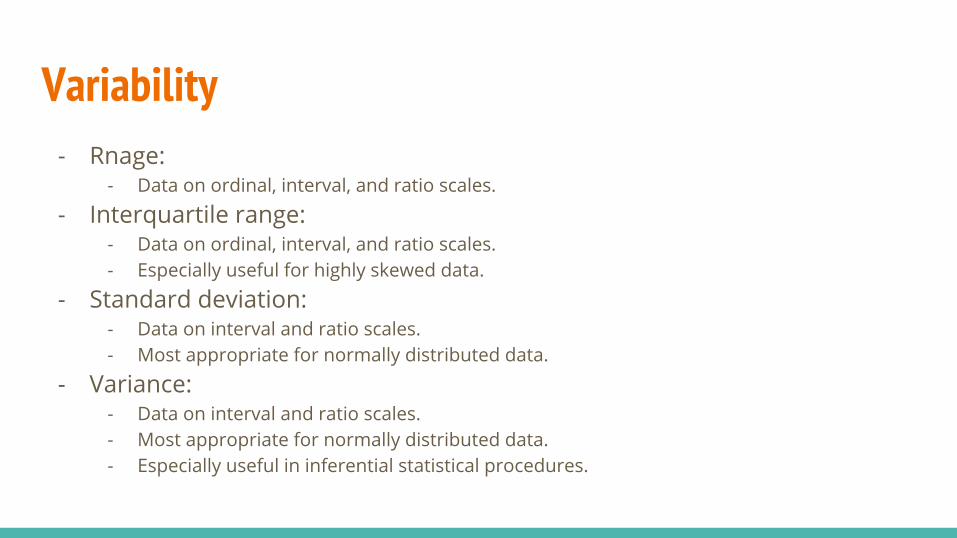
Variability- Rnage:
- Data on ordinal, interval, and ratio scales.
- Interquartile range:- Data on ordinal, interval, and ratio scales.- Especially useful for highly skewed data.
- Standard deviation:- Data on interval and ratio scales.- Most appropriate for normally distributed data.
- Variance: - Data on interval and ratio scales.- Most appropriate for normally distributed data.- Especially useful in inferential statistical procedures.
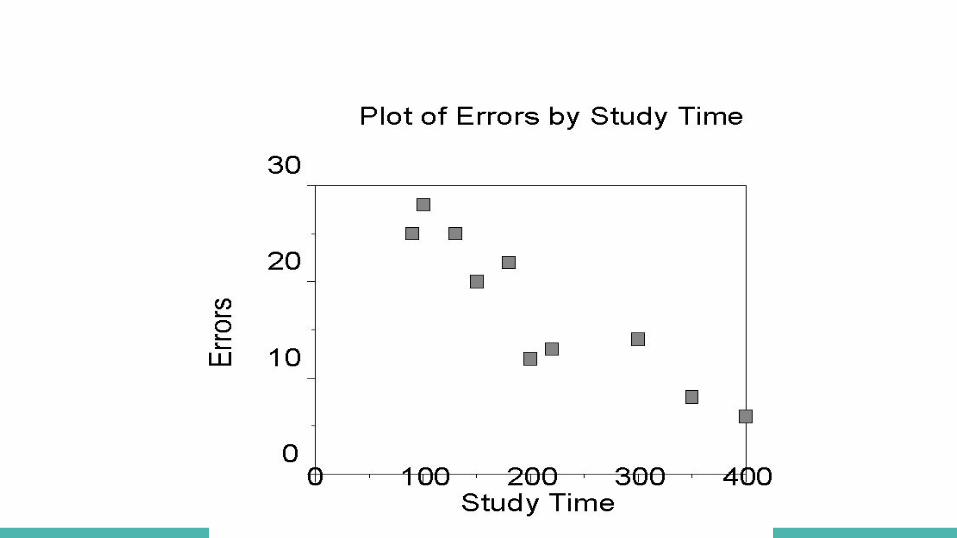
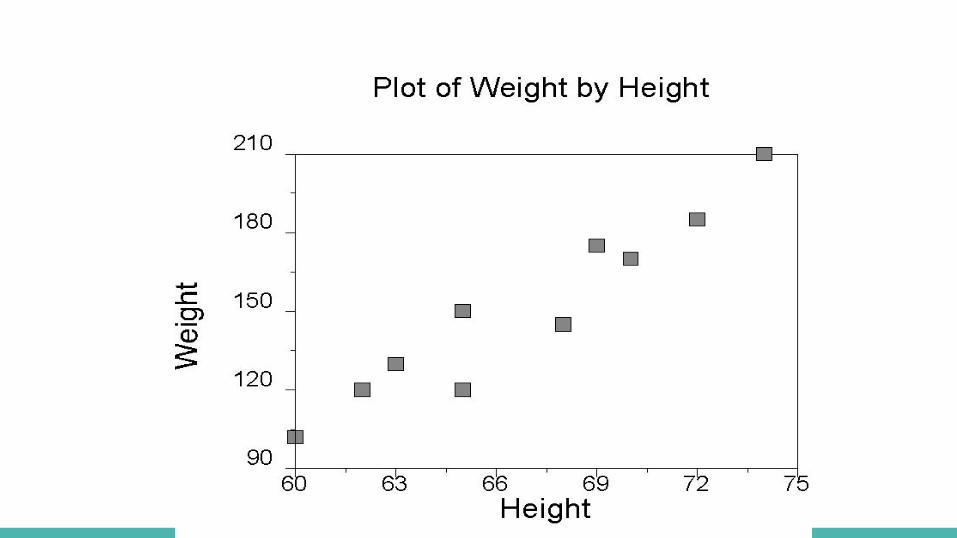
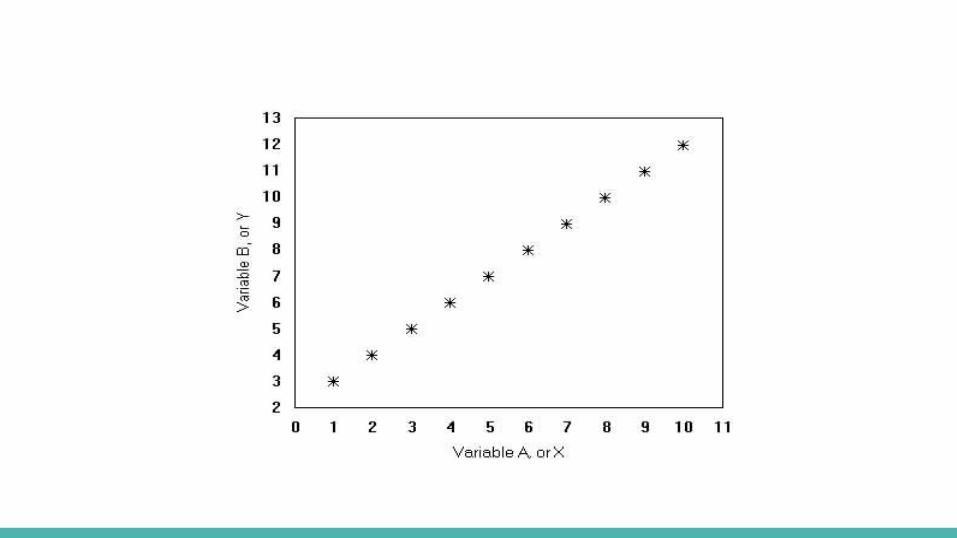
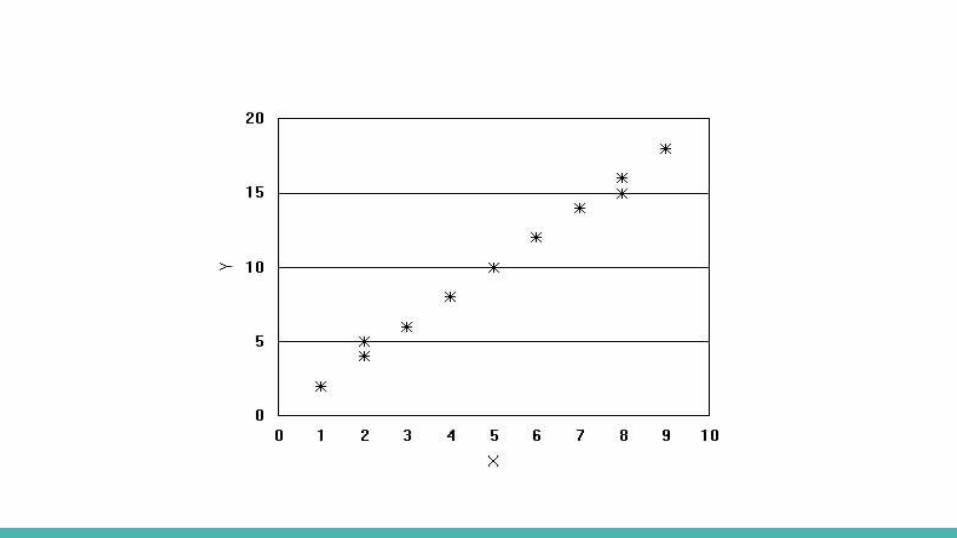
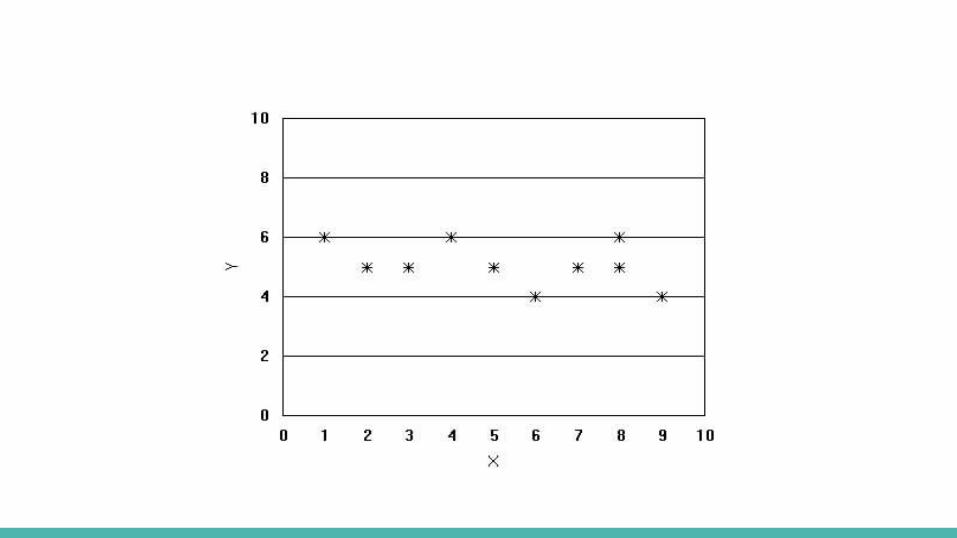
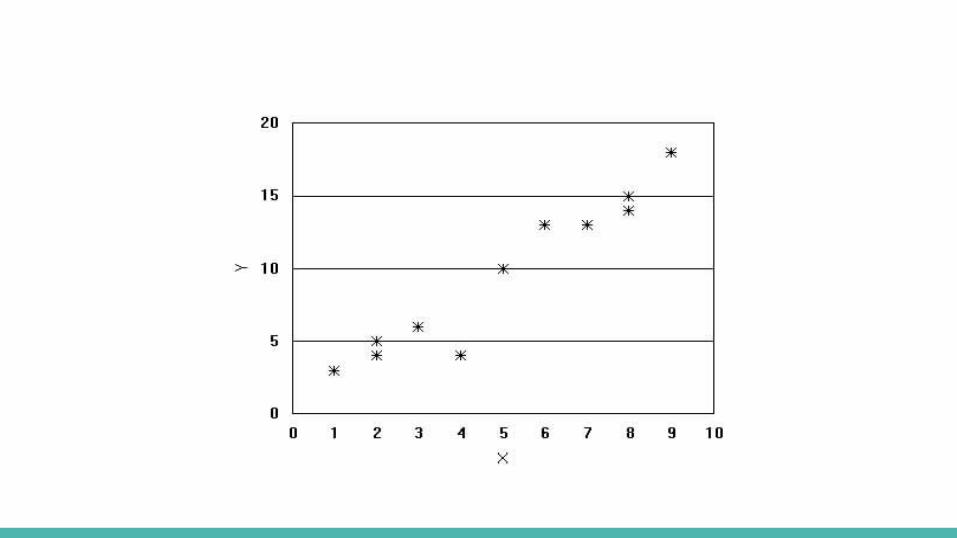
Correlation- Correlation is the statistical process by which we discover whether two or
more variables are in some way associated with one another. - The resulting statistic, called a correlation coefficient, is a number
between -1 and + 1; most correlation coefficients are decimals (either positive or negative) somewhere between these two extremes.
- A correlation coefficient for two variables tells us two different things about the relationship between those variables:
- Direction: is the relationship positive or negative? - Strength: is the relationship perfect, strong, moderate or weak?
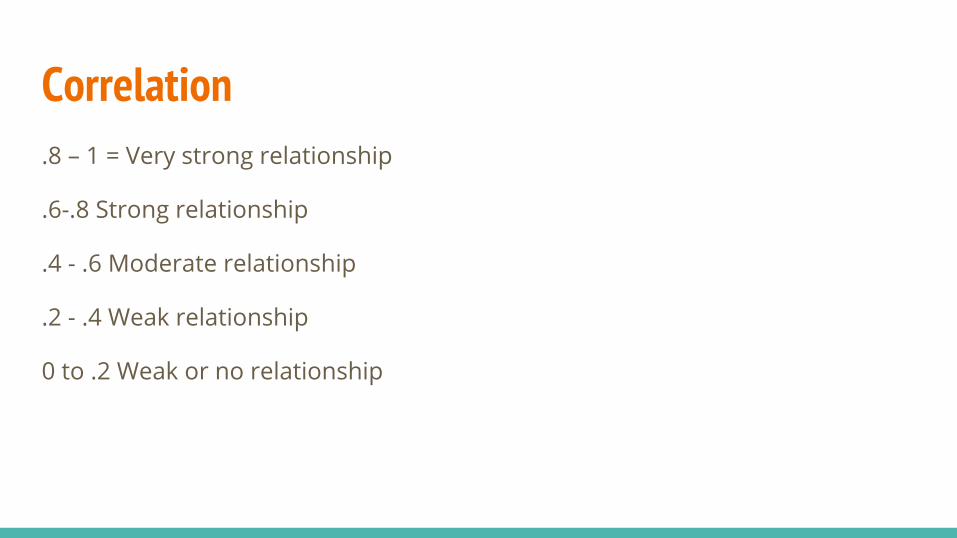
Correlation.8 – 1 = Very strong relationship
.6-.8 Strong relationship
.4 - .6 Moderate relationship
.2 - .4 Weak relationship
0 to .2 Weak or no relationship
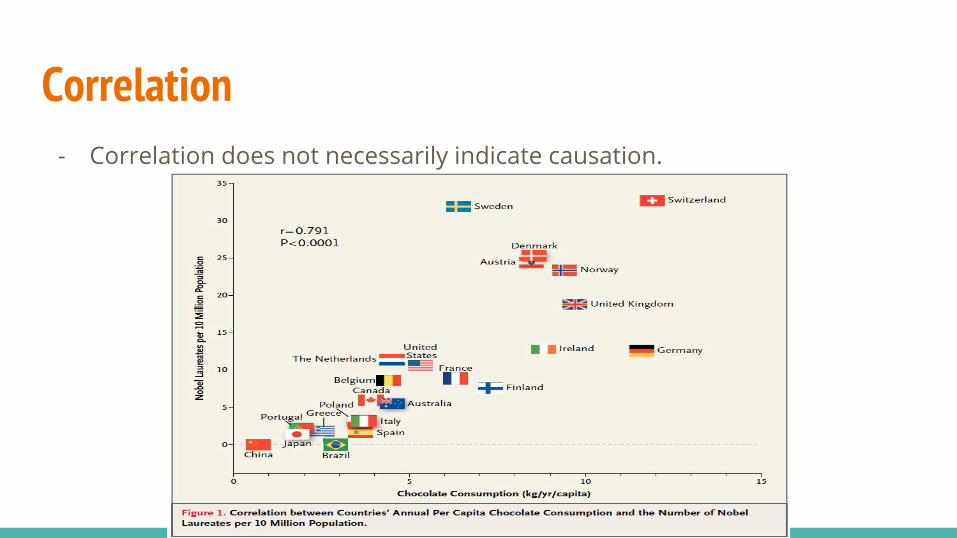
Correlation- Correlation does not necessarily indicate causation.
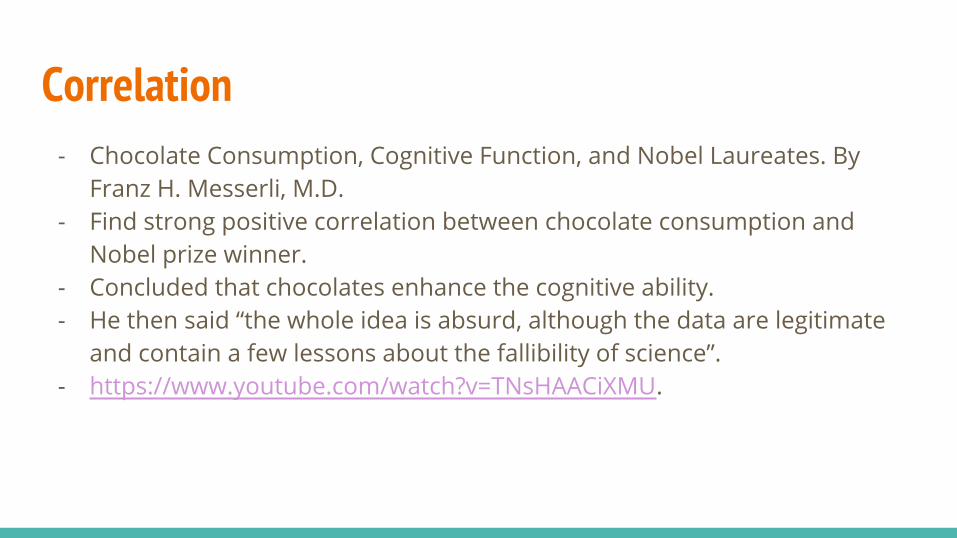
Correlation- Chocolate Consumption, Cognitive Function, and Nobel Laureates. By
Franz H. Messerli, M.D. - Find strong positive correlation between chocolate consumption and
Nobel prize winner. - Concluded that chocolates enhance the cognitive ability. - He then said “the whole idea is absurd, although the data are legitimate
and contain a few lessons about the fallibility of science”. - https://www.youtube.com/watch?v=TNsHAACiXMU.
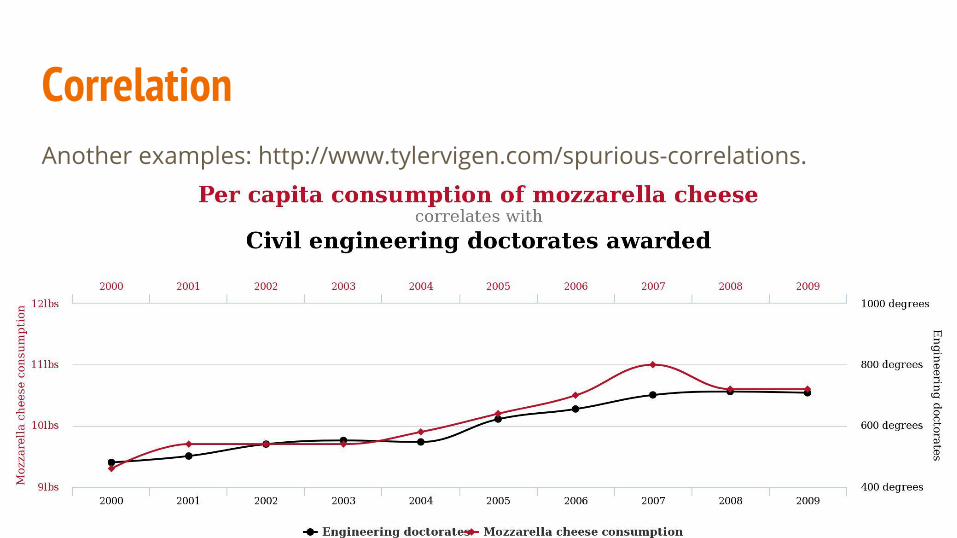
CorrelationAnother examples: http://www.tylervigen.com/spurious-correlations.
Statistics are no substitute for judgement.
Henry Clay
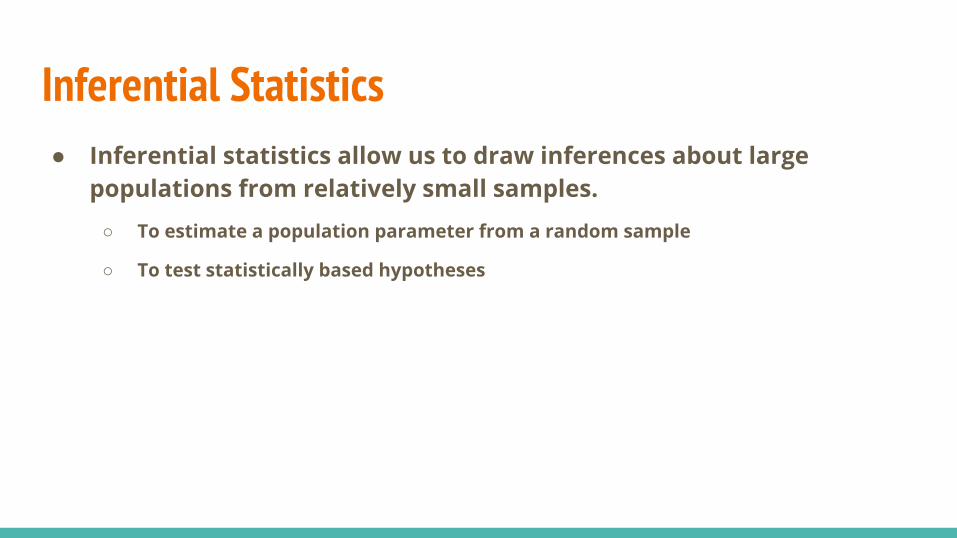
Inferential Statistics● Inferential statistics allow us to draw inferences about large
populations from relatively small samples.
○ To estimate a population parameter from a random sample
○ To test statistically based hypotheses
Estimating Population Parameters● Inferential statistics can tell us how closely sample statistics
approximate parameters of the overall population.
● Assumption:○ The sample is randomly chosen and representative of the total population.
An Example: Estimating a Population Mean● Estimate the average height of 10-years-old boys in the state of New
Hampshire.
● Measure the heights of a random and representative sample of 200 boys.
● We expect the mean height for our sample to be approximately the same as the mean for the overall population.
● The difference between the population mean and a sample mean constitutes an error in our estimation.
Estimating a Population Mean● We don’t know the exact population mean, but we know:
○ The means we might obtain from an infinite number of random samples form a normal distribution.
○ The population mean equals the mean of all the sample means.
○ The standard deviation of this distribution of sample means is directly related to the standard deviation of the characteristic in question for the overall population. (standard error of the mean)
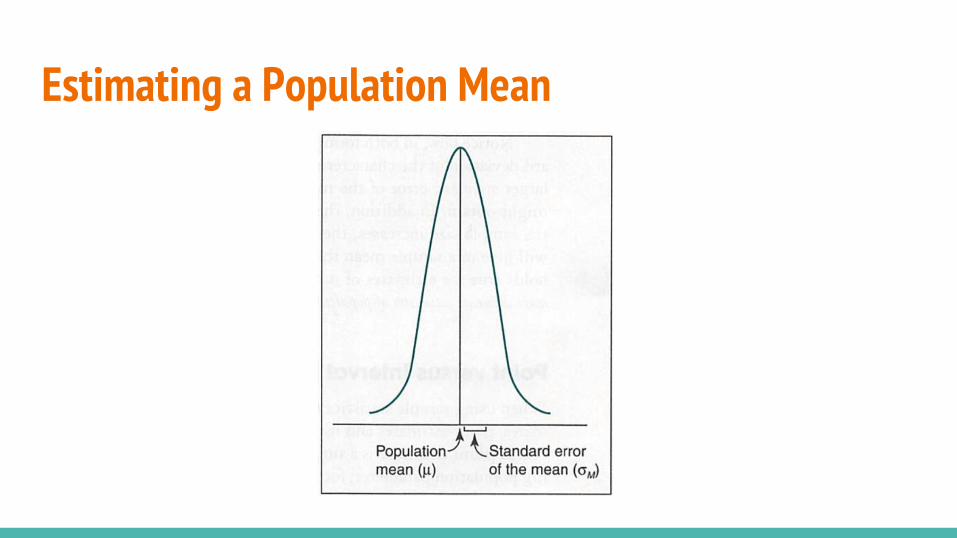
Estimating a Population Mean
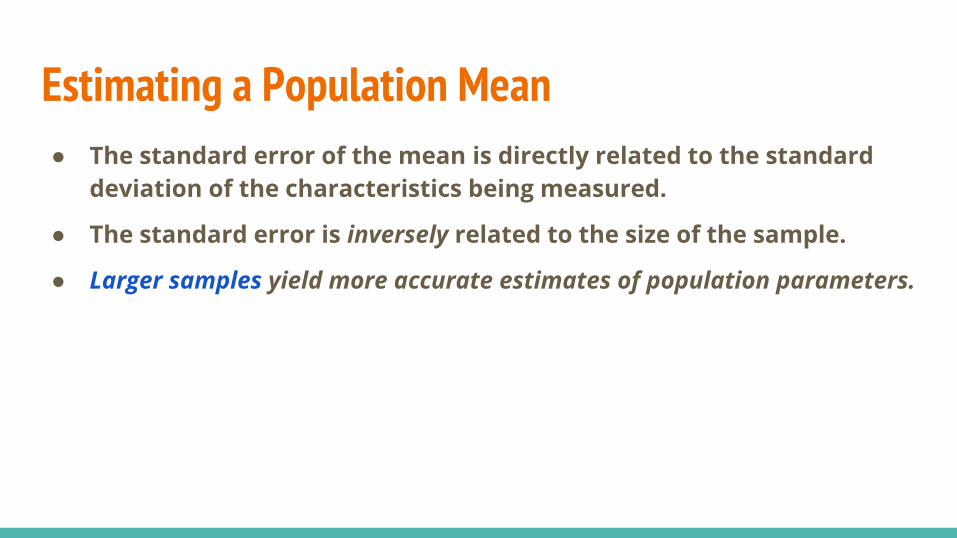
Estimating a Population Mean● The standard error of the mean is directly related to the standard
deviation of the characteristics being measured.
● The standard error is inversely related to the size of the sample.
● Larger samples yield more accurate estimates of population parameters.
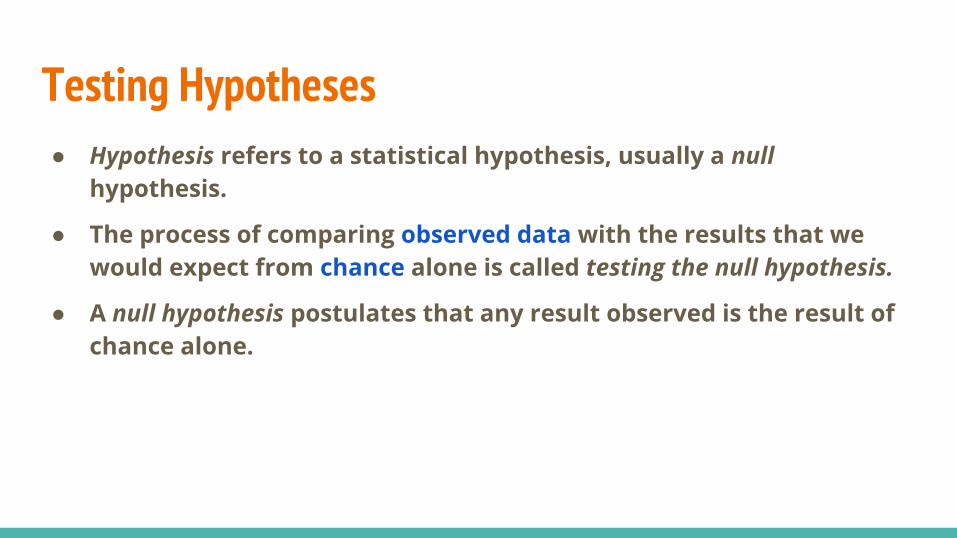
Testing Hypotheses● Hypothesis refers to a statistical hypothesis, usually a null
hypothesis.
● The process of comparing observed data with the results that we would expect from chance alone is called testing the null hypothesis.
● A null hypothesis postulates that any result observed is the result of chance alone.
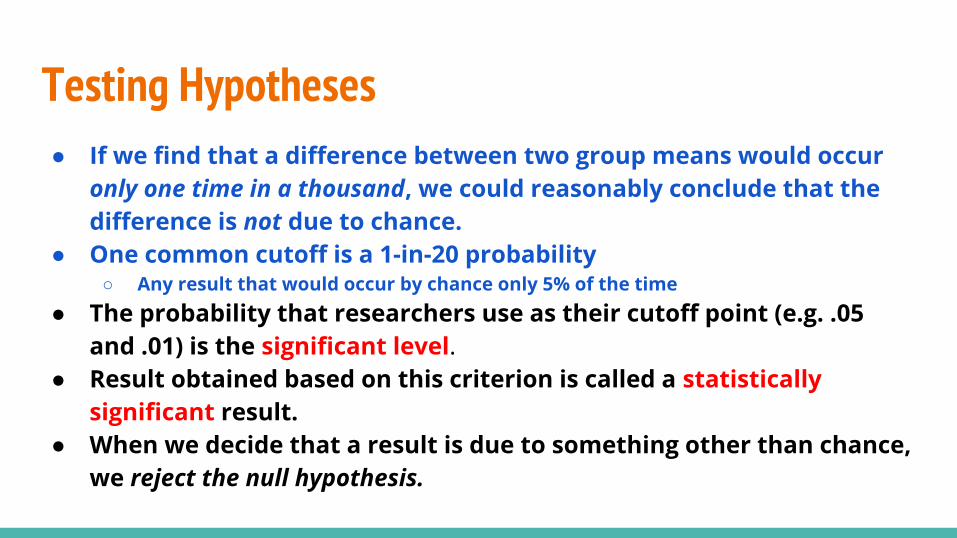
Testing Hypotheses● If we find that a difference between two group means would occur
only one time in a thousand, we could reasonably conclude that the difference is not due to chance.
● One common cutoff is a 1-in-20 probability○ Any result that would occur by chance only 5% of the time
● The probability that researchers use as their cutoff point (e.g. .05 and .01) is the significant level.
● Result obtained based on this criterion is called a statistically significant result.
● When we decide that a result is due to something other than chance, we reject the null hypothesis.
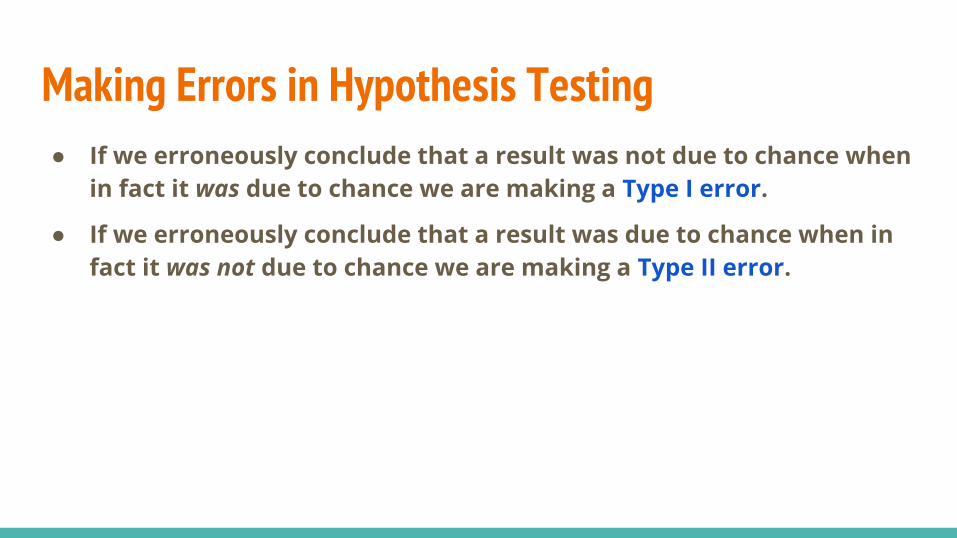
Making Errors in Hypothesis Testing● If we erroneously conclude that a result was not due to chance when
in fact it was due to chance we are making a Type I error.
● If we erroneously conclude that a result was due to chance when in fact it was not due to chance we are making a Type II error.
Validity - Conclusion validity is the degree to which conclusions we reach about
relationships in our data are reasonable.- Whenever you investigate a relationship, you essentially have two
possible conclusions: - Conclude that there is a relationship when in fact there is not. - Infer that there isn't a relationship when in fact there is (but you didn't detect it!).
Threats to Conclusion Validity- low reliability of measures:
● poor question wording.● bad instrument design or layout.● illegibility of field notes.
- random irrelevancies in the setting.
● traffic outside the room.● disturbances in the hallway.
Threats to Conclusion Validity- random heterogeneity of respondents.
● a very diverse group of respondents.
- fishing and the error rate problem.
● you conduct 20 separate analyses. Let's say that you find that of the twenty results, only one is statistically significant at the 0.05 level. Does that mean you have found a statistically significant relationship?
Threats to Conclusion Validity- poor reliability of treatment implementation.
● doesn't follow the prescribed procedures or is inconsistently carried out.
- violated assumptions of statistical tests
● For instance, many statistical analyses assume that the data are distributed normally
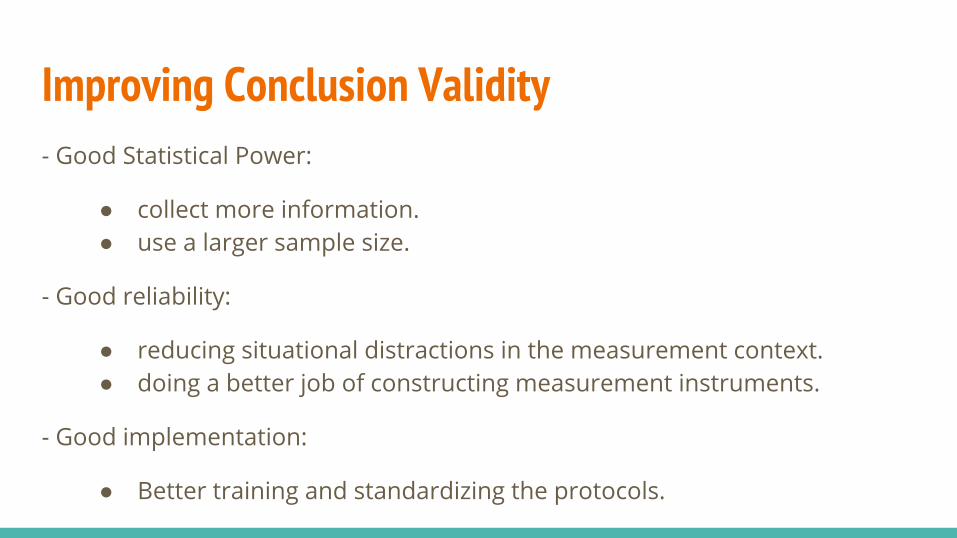
Improving Conclusion Validity- Good Statistical Power:
● collect more information.● use a larger sample size.
- Good reliability:
● reducing situational distractions in the measurement context.● doing a better job of constructing measurement instruments.
- Good implementation:
● Better training and standardizing the protocols.
Questions?

![[PPT]PowerPoint Presentation - DePaul Universityfacweb.cs.depaul.edu/yele/Course/IS372/IS372w7-2.ppt · Web viewChapter 9: Project Human Resource Management Information Technology](https://img.pdfslide.net/doc/110x75/5aaf4be77f8b9a07498d2246/pptpowerpoint-presentation-depaul-viewchapter-9-project-human-resource-management.jpg)
![[PPT]PowerPoint Presentation - DePaul Universityfacweb.cs.depaul.edu/yele/Course/IS372/IS372w6-1.ppt · Web viewChapter 7: Project Cost Management Information Technology Project Management,](https://img.pdfslide.net/doc/110x75/5aaf4be77f8b9a07498d2266/pptpowerpoint-presentation-depaul-viewchapter-7-project-cost-management-information.jpg)