Embed Size (px)
Citation preview
STATISTICALYEARBOOK
2013
May 2013
For further statistical data, links and contacts, please visit the WKO-Internet pages: http://wko.at/statistik and/or http://wko.at/zdf
Detailed statistical Information about the demographic, social and economic structures and developments in Austria can also be found on the website of STATISTICS AUSTRIA: http://www.statistik.at
Although all content of this booklet was compiled with due care, errors cannot be entirely excluded. Therefore the Austrian Economic Chamber cannot take responsibility or liability for the presented data.
IMPRESSUM:Medieninhaber, Herausgeber, Hersteller: Wirtschaftskammer Österreich – Stabsabteilung StatistikFür den Inhalt verantwortlich: Dr. Ulrike OschischnigSachbearbeiter: Mag. Anton HauthWiedner Hauptstraße 63, 1045 WienE-Mail: [email protected] Offenlegung: http://wko.at/offenlegung
Ein Produkt der Wirtschaftskammern Österreichs
PREFACE
The statistical yearbook 2013 of the Austrian Economic Chambers (WKO)
provides an overview of the most important economic data for Austria with
a focus on the trends of 2012 as well as from a longer term perspective.
With these selected statistics, the WKO hopes to present some useful
basic information about the structure and development of the Austrian
economy.
Vienna, May 2013
1
1.0 7
1.1 8
1.2 10
1.3 12
1.4 14
1.5 15
1.6 16
1.7 18
1.8 20
1.9 22
1.10 24
1.11 25
2.0 26
2.1 27
2.2 28
2.3 28
2.4 29
2.5 30
3.0 31
3.1 32
3.2 32
4.0 33
4.1 34
4.2 34
4.3 35
4.4 36
4.5 37
4.6 38
4.7 39
CONTENT
1 . INTERNATIONAL OVERVIEW
Area and population
Gross domestic product
Gross domestic product per capita
Economic growth
Foreign trade and export ratios
Current balances
Unemployment rates
Inflation rates
Public financial balances
Public debt
Worldwide economic growth
Worldwide export growth
2. NATIONAL ACCOUNTS
Origin of Gross Domestic Product (current prices)
Origin of real Gross Domestic Product
Distribution of Gross Domestic Product (current prices)
Expenditure on Gross Domestic Product (current prices)
Macroeconomic ratios
Per capita figures
3. POPULATION
Area and population
Population by age-groups
Population by labour-force-participation
4. EMPLOYMENT
Labour market (overview)
Employees by province
Unemployment by province
Employment by occupational status and economic activity
Employment by gender and economic activity
Employment by age groups
Establishments and employees by size groups
Self-employment
2
5.0 40
5.1 40
5.2 41
5.3 42
6.0 43
6.1 44
6.2 45
7.0 46
7.1 47
7.2 48
7.3 49
7.4 49
7.5 50
7.6 51
7.7 52
7.8 53
8.0 54
9.0 55
10.0 56
10.1 56
CONTENT
5. INCOME AND WAGES
Wages and salaries
Index of agreed minimum wages
Hourly wages by industrial branch
Monthly salaries by industrial branch
6. PRICES
Consumer prices
Consumer price index by groups of consumption
Wholesale prices and construction costs
7. MANUFACTURING
Contribution of manufacturing to GDP
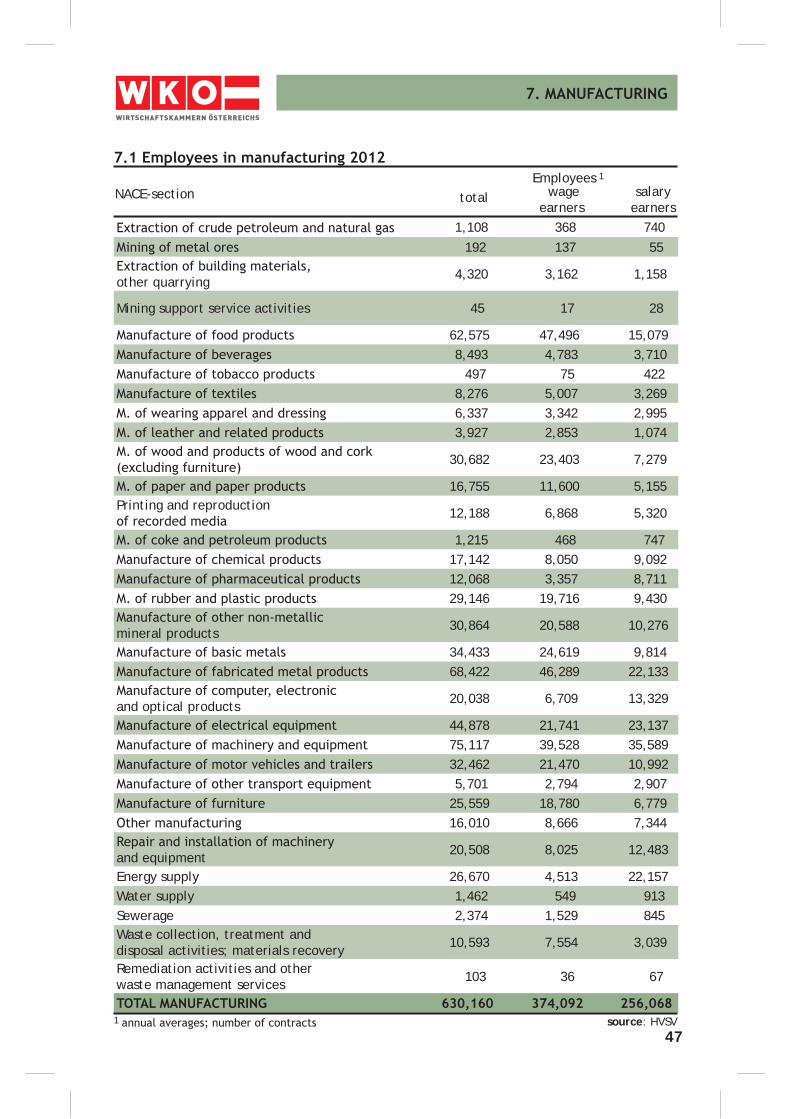
Employees in manufacturing
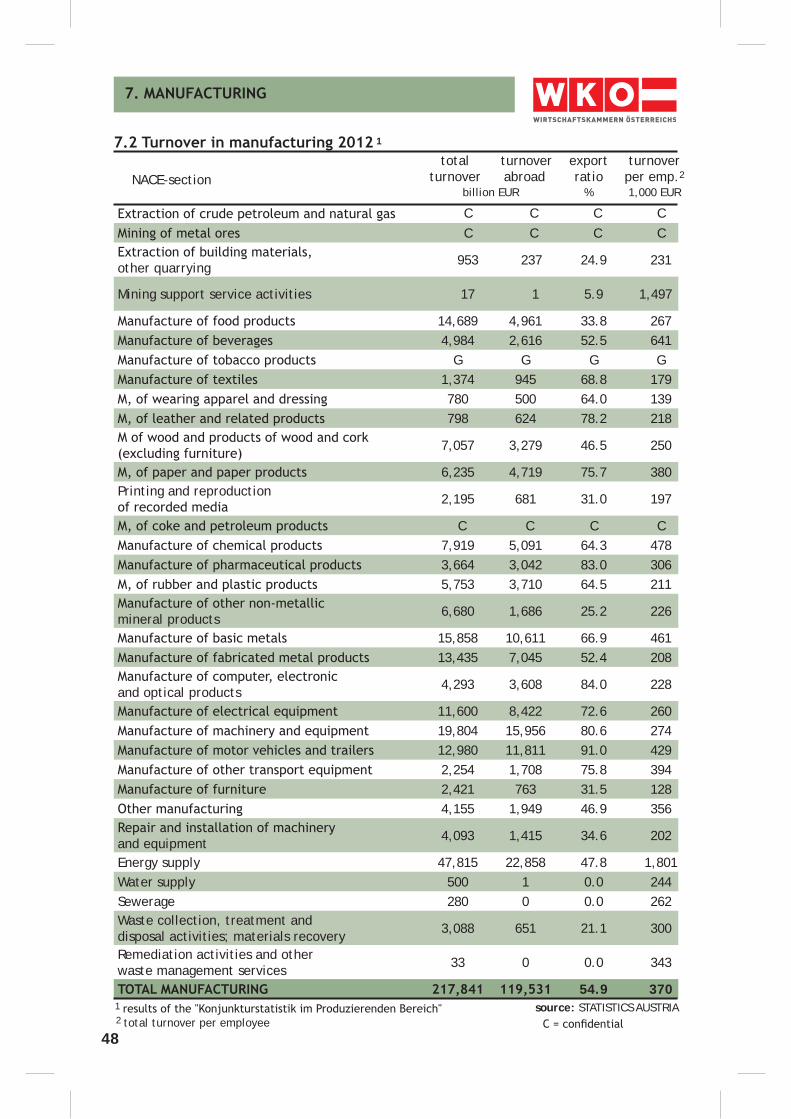
Turnover in manufacturing
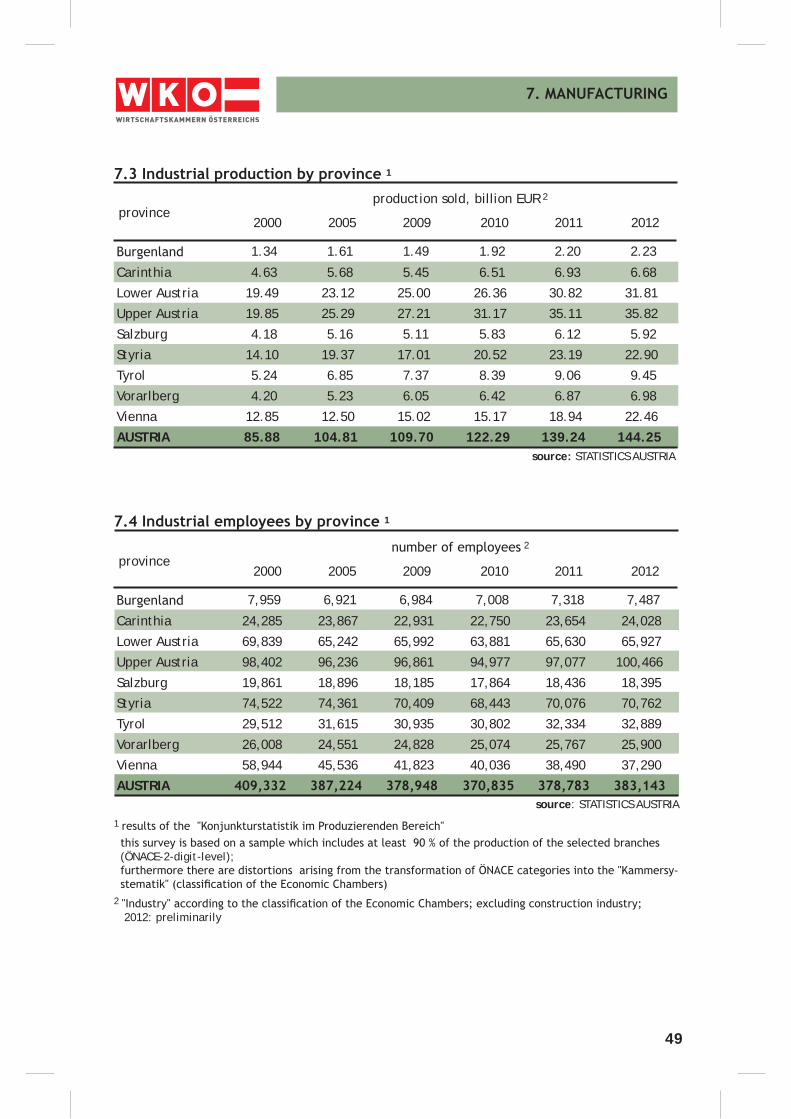
Industrial production by province
Industrial employees by province
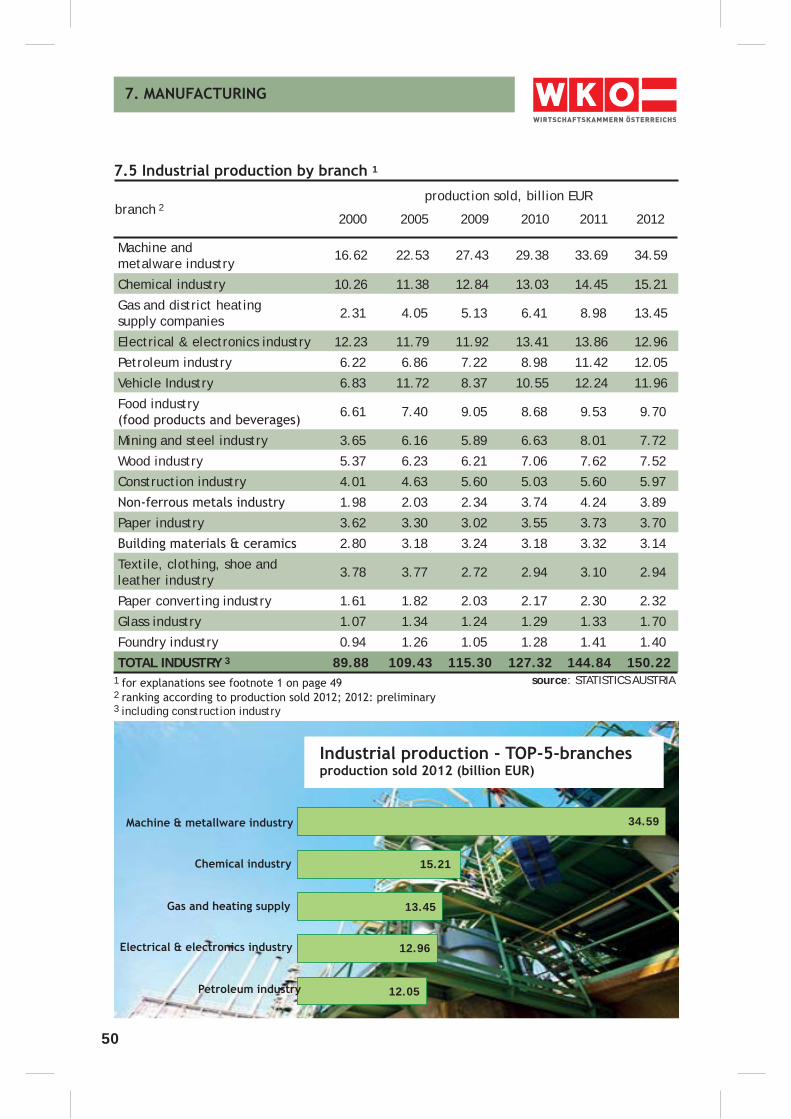
Industrial production by branches
Industrial employees by branches
Investment in industry and manufacturing
Industrial investment by branches
8. CONSTRUCTION
Production values in construction
9. TRADE
Retail trade indices: turnover and employment
10. TRAFFIC
Number of motor vehicles and new registrations
Passenger car-density by province
3
11.0 57
11.1 58
11.2 58
11.3 58
12.0 59
12.1 59
12.2 60
12.3 61
12.4 62 / 63
12.5 64 / 65
12.6 66
12.7 67
12.8 68
13.0 69
13.1 70
13.2 70
13.3 71
13.4 72
14.0 73
14.1 74 / 76
14.2 77 / 81
14.3 82
CONTENT
11. TOURISM
Overnight stays
Overnight stays by province
Overnight stays by type of accommodation
Overnight stays of foreign visitors by country of origin
12. FOREIGN TRADE AND BALANCE OF PAYMENTS
Austria´s foreign trade by world regions
Foreign trade and trade balance
Imports / commodity structure
Exports / commodity structure
Imports of goods / country structure
Exports of goods / country structure
Balance of payments
Austrian direct investment abroad
Foreign direct investment in Austria
13. PUBLIC FINANCE
Federal budget
Federal tax revenues
Federal debt
Deficit and debt of general government
Structure of public expenditure
14. STRUCTURE OF ENTERPRISES
Enterprises and employees by section
Enterprises and employees by size groups
Employer enterprises and employees by professional groups
One-person-enterprises by province and section
4
CONTENT
15. CHAMBER MEMBERS
Chamber members by province
Chamber members by legal form
Section members by gender
Professional group members: section Crafts and Trade
Professional group members: section Industry
Professional group members: section Commerce
Professional group members: section Banks and Insurance
Professional group members: section Transport and Logistics
Professional group members: section Tourism and Leisure
Professional group members: section Information & Consulting
16. APPRENTICESHIPS
Apprenticeships by province
Apprenticeships by section
Apprenticeship beginners and demographic development
The most frequent apprenticeships
17. NEW ENTERPRISES
Enterprise start-ups by province
Enterprise start-ups by legal form
Enterprise start-ups by section
Enterprise start-ups by professional groups
Enterprise start-ups (sole proprietorship) by gender
Enterprise start-ups (sole proprietorship) by age
15.0 83
15.1 84
15.2 84
15.3 85
15.4 86
15.5 87
15.6 87
15.7 88
15.8 88
15.9 89
16.0 90
16.1 90
16.2 91
16.3 92
17.0 93
17.1 94
17.2 94
17.3 95
17.3 96
17.4 96
5
ILLUSTRATIONS
Gross domestic product (GDP) 2013 (international)
GDP per capita 2013 (international)
Economic growth AT/DE/EU-27/USA 2011 - 2014
Unemployment rates 2013 (international)
Inflation rates 2013 (international)
Public financial balances 2013 (international)
Public debt 2013 (international)
Origin of GDP by sector 2012
Real GDP growth 2000 - 2014
Export ratio 2000 - 2012
Investment per capita 2000 - 2012
Population shares 2013 by province
Unemployment rate 2000 - 2012
Employment by establishment size groups 2013
Inflation rates 2000 - 2012
Price development 2012 by consumption groups
Price trends 2000 - 2012
Manufacturing and GDP 2000 - 2012
Industrial production 2012 - Top-5-branches
Industrial employment 2012- Top-5-branches
Industrial investment 2000 - 2013
Industrial investment 2012 - Top-5-branches
Overnight stay in tourism 2000 - 2012
Austria's imports of goods 2012
Austria's exports of goods 2012
Current account balance 2000 - 2012
Federal government deficit 2000 - 2012
Public deficit 2000 - 2012
Structure of public expenditure 2012
Employees 2012 by section
Employer enterprises 2012 by section
One-person-enterprises 2012 by section
Apprenticeship beginners 2000 - 2012
Most frequent apprenticeships 2012
Start-ups of enterprises 2000 - 2012
CONTENT
9
11
13
17
19
21
23
26
27
29
30
31
33
38
43
44
45
46
50
51
52
53
57
63
65
66
69
71
72
73
81
82
91
92
93
6
7
Belgium 30,530 9,967 10,251 11,179 366
Germany 357,127 79,433 82,212 82,074 230Estonia 45,230 1,569 1,370 1,337 30Finland 338,420 4,986 5,176 5,438 16France 549,190 58,185 60,762 65,877 120Greece 131,960 10,157 10,917 11,291 86Ireland 70,280 3,514 3,805 4,629 66Italy 301,340 56,719 56,942 61,202 203Luxembourg 2,590 382 436 539 208Malta 320 354 386 416 1,300Netherlands 41,540 14,952 15,926 16,860 406Austria 83,879 7,678 8,012 8,498 101Portugal 92,090 9,983 10,226 10,483 114Slovakia 49,036 5,299 5,389 5,381 110Slovenia 20,270 1,998 1,989 2,061 102Spain 505,600 38,850 40,263 46,119 91Cyprus 9,250 580 694 882 95Euro area (17) 2,628,652 304,608 314,755 334,266 127Bulgaria 111,000 8,718 8,170 7,213 65Denmark 43,090 5,141 5,340 5,605 130United Kingdom 243,610 57,248 58,893 63,718 262Latvia 64,480 2,663 2,368 2,021 31Lithuania 65,300 3,698 3,500 2,965 45Poland 312,680 38,111 38,454 38,523 123Romania 238,390 23,202 22,443 21,302 89Sweden 450,300 8,559 8,872 9,623 21Czech Republic 78,870 10,333 10,272 10,520 133Hungary 93,030 10,374 10,211 9,930 107EU (15) 3,241,546 365,755 378,033 403,135 124EU (27) 4,329,402 472,654 483,277 505,685 117Iceland 103,000 255 281 320 3Croatia 56,590 4,777 4,468 4,419 78Macedonia 25,710 1,882 2,026 2,066 80Turkey 783,560 55,120 64,252 70,999 91Switzerland 41,280 6,716 7,184 8,053 195Norway 323,790 4,241 4,491 5,084 16United States 9,831,510 249,623 282,166 315,927 32Japan 377,955 123,611 126,926 127,544 337
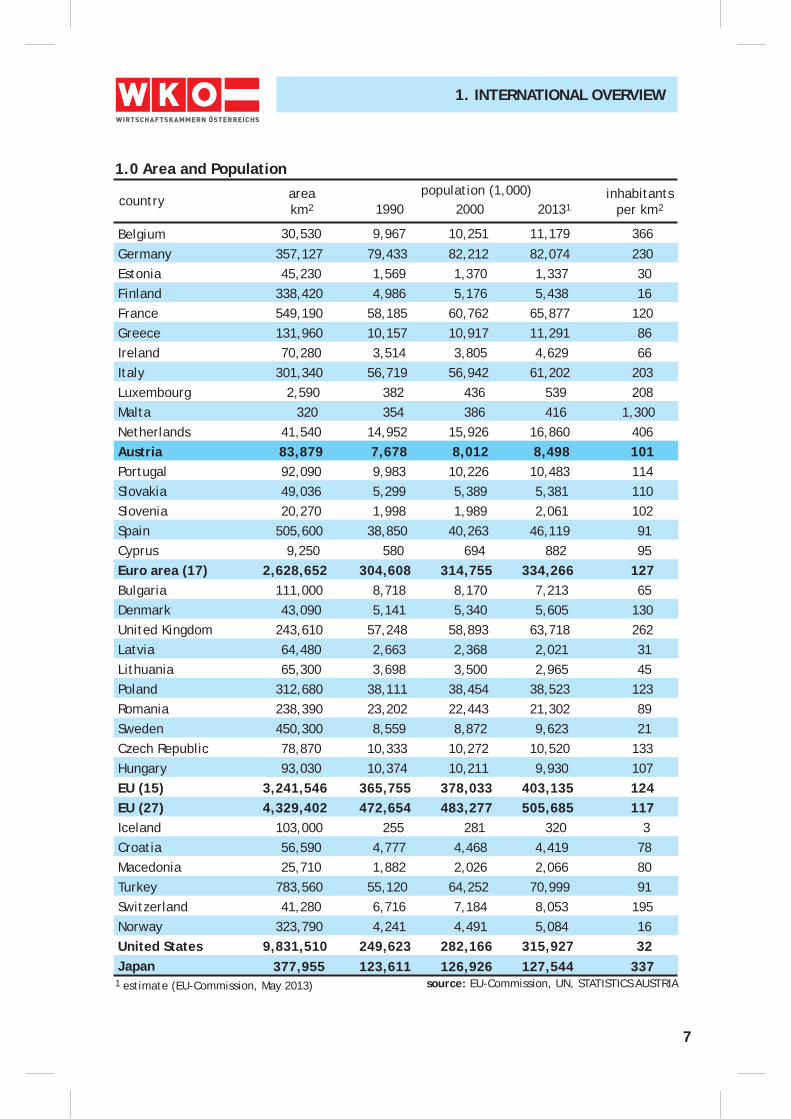
1.0 Area and Population
country areakm2
population (1,000) 1990 201312000
inhabitantsper km2
1. INTERNATIONAL OVERVIEW
1 estimate (EU-Commission, May 2013) source: EU-Commission, UN, STATISTICS AUSTRIA
8
Belgium 252.5 303.4 356.1 376.8 383.1 2.9
Germany 2,047.5 2,224.4 2,496.2 2,643.9 2,694.2 20.7Estonia 6.2 11.2 14.3 17.0 18.1 0.1Finland 132.2 157.4 178.8 194.5 198.8 1.5France 1,439.6 1,718.0 1,937.3 2,028.2 2,055.2 15.8Greece 136.7 193.0 222.2 193.7 183.5 1.4Ireland 105.8 163.0 156.5 163.6 167.4 1.3Italy 1,198.3 1,436.4 1,551.9 1,565.9 1,568.4 12.1Luxembourg 22.0 30.3 39.9 44.4 45.9 0.4Malta 4.4 4.9 6.3 6.8 7.0 0.1Netherlands 418.0 513.4 588.7 600.6 604.5 4.6Austria 208.5 245.2 286.4 309.9 317.9 2.4Portugal 127.3 154.3 172.9 165.4 164.5 1.3Slovakia 22.0 38.5 65.9 71.5 74.0 0.6Slovenia 21.5 28.7 35.6 35.5 35.3 0.3Spain 629.9 909.3 1,048.9 1,049.5 1,051.1 8.1Cyprus 9.9 13.6 17.4 17.9 16.4 0.1Euro area (17) 6,782.3 8,145.2 9,175.2 9,485.2 9,585.1 73.7Bulgaria 14.0 23.3 36.1 39.7 40.9 0.3Denmark 173.6 207.4 236.5 244.5 249.3 1.9United Kingdom 1,600.2 1,846.6 1,709.6 1,901.0 1,847.8 14.2Latvia 8.4 12.9 18.0 22.3 23.4 0.2Lithuania 12.4 21.0 27.6 32.8 34.6 0.3Poland 185.7 244.4 354.6 381.2 396.4 3.0Romania 40.7 79.8 124.3 131.7 142.1 1.1Sweden 268.3 298.4 349.9 408.5 434.7 3.3Czech Republic 63.8 104.6 150.3 152.8 150.4 1.2Hungary 50.3 88.8 96.6 97.8 98.7 0.8EU (15) 8,760.3 10,400.6 11,331.7 11,890.6 11,966.3 92.0EU (27) 9,199.8 11,072.3 12,278.7 12,897.4 13,003.6 100.0Iceland 9.4 13.1 9.5 10.7 11.4Croatia 23.3 36.0 44.4 43.9 43.8Macedonia 3.9 4.8 7.1 7.5 7.9Turkey 289.9 386.9 550.4 612.4 662.8Switzerland 277.6 309.4 416.1 492.0 503.0Norway 182.6 244.6 317.9 390.0 408.2United States 10,717.5 10,099.2 10,876.7 12,140.6 12,325.1Japan 5,125.5 3,682.2 4,150.0 4,643.0 3,780.0
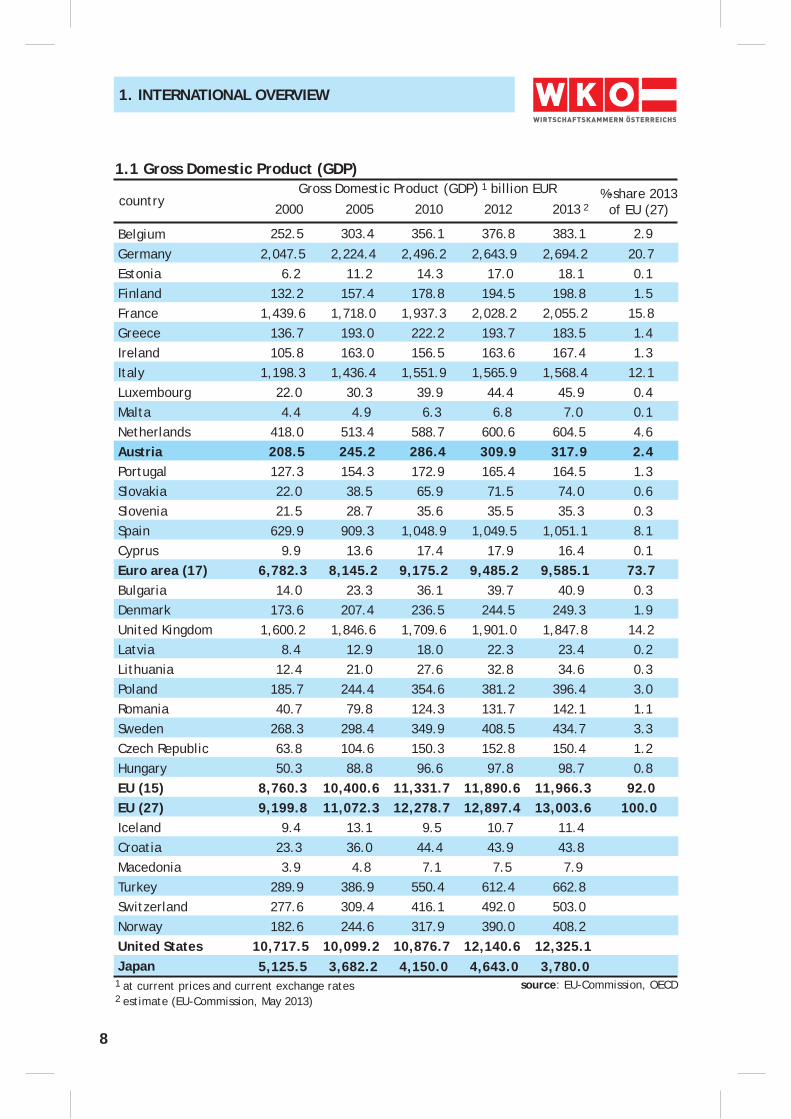
1.1 Gross Domestic Product (GDP)
countryGross Domestic Product (GDP) 1 billion EUR
2005 2013 2 2010%-share 2013
of EU (27)
1. INTERNATIONAL OVERVIEW
2000 2012
1 at current prices and current exchange rates source: EU-Commission, OECD2 estimate (EU-Commission, May 2013)
9
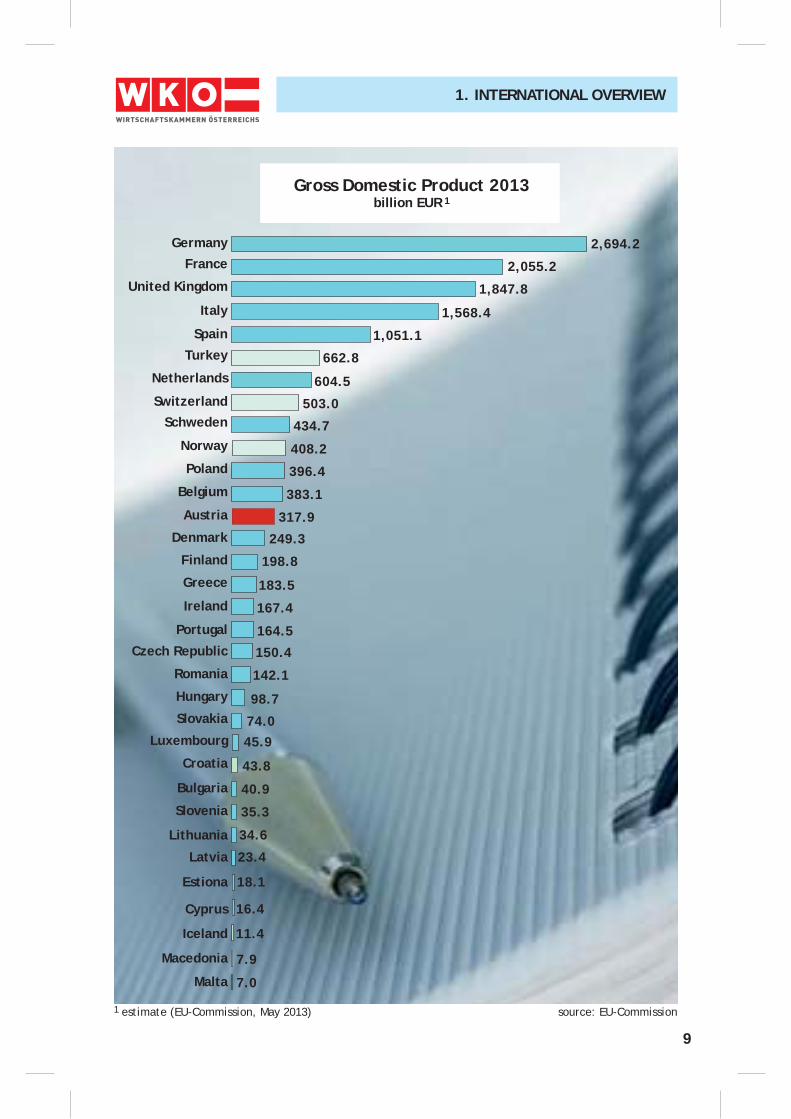
1. INTERNATIONAL OVERVIEW
Gross Domestic Product 2013billion EUR 1
1 estimate (EU-Commission, May 2013) source: EU-Commission
Germany
SchwedenSwitzerland
Netherlands
Turkey
Spain
Italy
United Kingdom
France
Hungary
Romania
Czech Republic
Portugal
Ireland
Greece
Finland
Denmark
Austria
Belgium
Poland
Norway
Iceland
Cyprus
Estiona
Latvia
Lithuania
Slovenia
Bulgaria
Croatia
Luxembourg
Slovakia
Malta
Macedonia
98.7
74.0
142.1
150.4
164.5
167.4
183.5
317.9
198.8
249.3
383.1
396.4
408.2
434.7
503.0
604.5
662.8
7.9
18.1
16.4
23.4
35.3
34.6
43.8
40.9
45.9
1,051.1
1,568.4
1,847.8
2,055.2
2,694.2
7.0
11.4
10
Belgium 24,048 26,960 29,174 30,303 30,377
Germany 22,397 26,050 29,007 31,195 31,551Estonia 8,574 13,839 15,476 17,873 18,606Finland 22,315 25,708 27,751 29,284 29,505France 21,945 24,742 26,492 27,678 27,773Greece 15,861 20,384 21,211 19,058 18,427Ireland 25,128 32,478 30,997 32,850 33,254Italy 22,387 23,675 24,713 25,012 24,805Luxembourg 46,561 57,104 65,217 68,316 68,365Malta 16,516 18,057 21,051 22,217 22,761Netherlands 25,566 29,395 32,104 33,210 33,089Austria 25,127 28,160 31,126 33,297 33,656Portugal 15,469 17,890 19,677 19,405 19,175Slovakia 9,546 13,541 17,864 19,322 19,628Slovenia 15,257 19,650 20,526 20,967 20,707Spain 18,526 22,932 24,319 24,886 24,801Cyprus 16,681 20,873 23,640 23,094 21,069Euro area (17) 21,364 24,541 26,478 27,548 27,598Bulgaria 5,412 8,235 10,700 12,033 12,376Denmark 25,059 27,791 31,271 31,933 32,378United Kingdom 22,638 27,587 27,188 27,848 28,048Latvia 6,953 11,146 13,159 16,052 16,943Lithuania 7,532 12,301 14,932 17,808 18,681Poland 9,186 11,540 15,300 16,931 17,285Romania 4,961 7,861 11,411 12,209 12,544Sweden 24,299 27,377 30,231 32,645 33,215Czech Republic 13,514 17,805 19,536 20,418 20,499Hungary 10,329 14,211 15,886 16,634 16,846EU (15) 21,944 25,353 26,941 27,969 28,061EU (27) 19,047 22,509 24,468 25,578 25,723Iceland 25,075 29,295 27,339 29,272 29,936Croatia 9,404 12,832 14,281 14,871 14,784Macedonia 5,122 6,595 8,748 9,076 9,280Turkey 7,973 9,539 12,151 14,009 14,867Switzerland 28,163 30,680 37,712 40,598 41,152Norway 31,408 39,883 44,253 48,886 49,988United States 30,466 35,536 35,853 38,348 39,157Japan 22,561 25,486 26,255 27,699 28,370
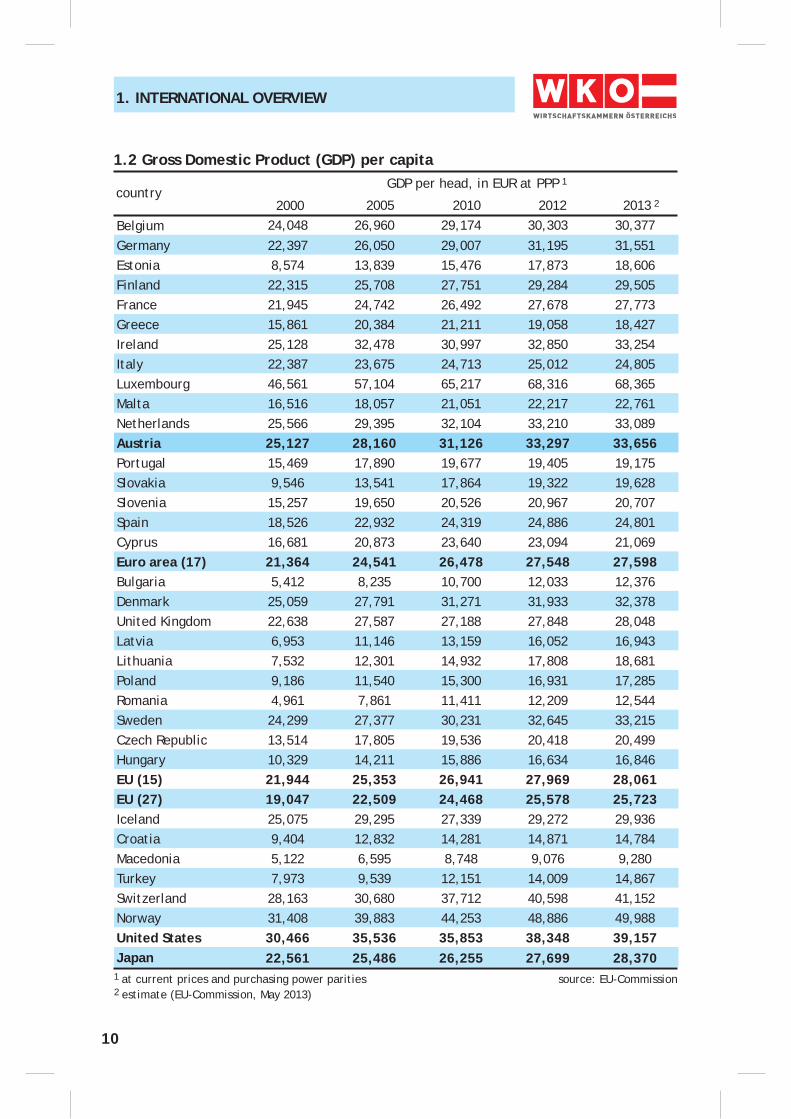
GDP per head, in EUR at PPP 1
2013 2
1 at current prices and purchasing power parities source: EU-Commission2 estimate (EU-Commission, May 2013)
1.2 Gross Domestic Product (GDP) per capita
country 2005 2010 2000 2012
1. INTERNATIONAL OVERVIEW
11
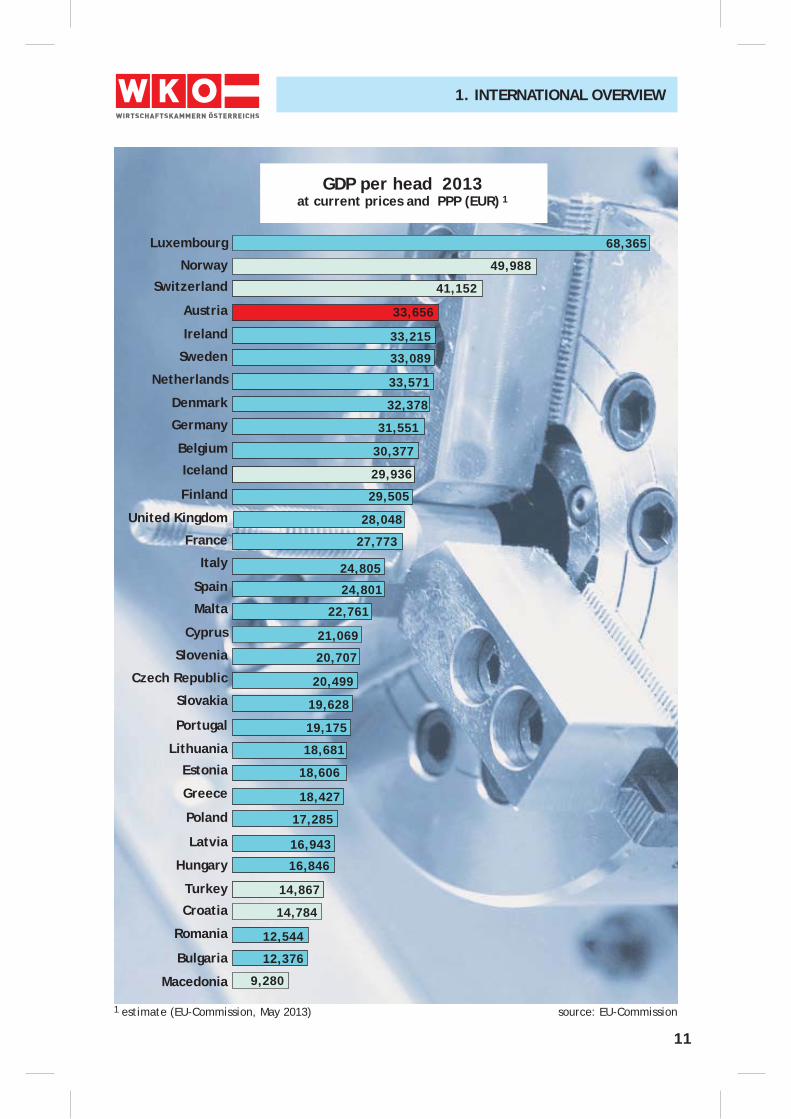
1. INTERNATIONAL OVERVIEW
GDP per head 2013at current prices and PPP (EUR) 1
1 estimate (EU-Commission, May 2013) source: EU-Commission
Luxembourg
Germany
Denmark
Netherlands
Sweden
Ireland
Austria
Switzerland
Norway
Slovakia
Czech Republic
Slovenia
Cyprus
Malta
Spain
Italy
France
United Kingdom
Finland
Iceland
Belgium
Romania
Croatia
Turkey
Hungary
Latvia
Poland
Greece
Estonia
Lithuania
Portugal
Macedonia
Bulgaria
19,628
19,175
20,499
20,707
21,069
22,761
24,801
28,048
24,805
27,773
29,505
29,936
30,377
31,551
32,378
33,571
33,089
33,656
33,215
41,152
49,988
68,365
9,280
14,867
12,376
16,846
17,285
16,943
18,606
18,427
18,681
14,784
12,544
12
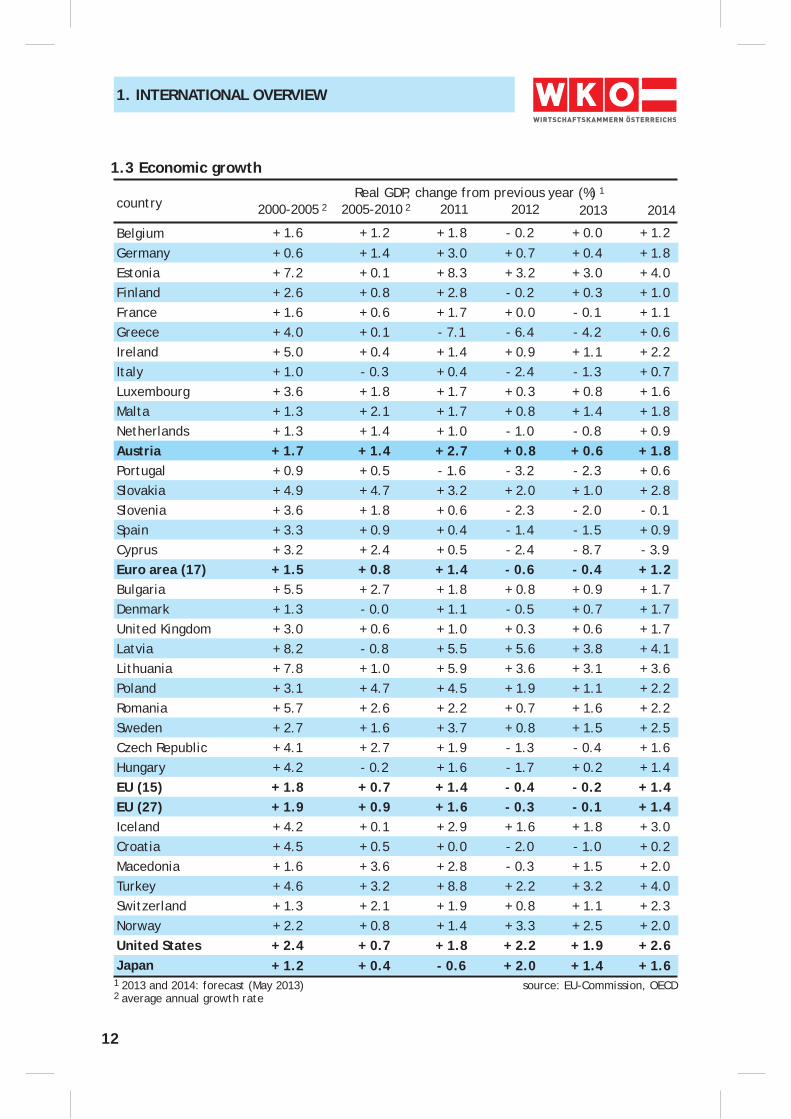
2 average annual growth rate
Real GDP, change from previous year (%) 1
2014
source: EU-Commission, OECD
1.3 Economic growth
country 2011 2012 2000-2005 2
1 2013 and 2014: forecast (May 2013)
Belgium + 1.6 + 1.2 + 1.8 - 0.2 + 0.0 + 1.2
Germany + 0.6 + 1.4 + 3.0 + 0.7 + 0.4 + 1.8Estonia + 7.2 + 0.1 + 8.3 + 3.2 + 3.0 + 4.0Finland + 2.6 + 0.8 + 2.8 - 0.2 + 0.3 + 1.0France + 1.6 + 0.6 + 1.7 + 0.0 - 0.1 + 1.1Greece + 4.0 + 0.1 - 7.1 - 6.4 - 4.2 + 0.6Ireland + 5.0 + 0.4 + 1.4 + 0.9 + 1.1 + 2.2Italy + 1.0 - 0.3 + 0.4 - 2.4 - 1.3 + 0.7Luxembourg + 3.6 + 1.8 + 1.7 + 0.3 + 0.8 + 1.6Malta + 1.3 + 2.1 + 1.7 + 0.8 + 1.4 + 1.8Netherlands + 1.3 + 1.4 + 1.0 - 1.0 - 0.8 + 0.9Austria + 1.7 + 1.4 + 2.7 + 0.8 + 0.6 + 1.8Portugal + 0.9 + 0.5 - 1.6 - 3.2 - 2.3 + 0.6Slovakia + 4.9 + 4.7 + 3.2 + 2.0 + 1.0 + 2.8Slovenia + 3.6 + 1.8 + 0.6 - 2.3 - 2.0 - 0.1Spain + 3.3 + 0.9 + 0.4 - 1.4 - 1.5 + 0.9Cyprus + 3.2 + 2.4 + 0.5 - 2.4 - 8.7 - 3.9Euro area (17) + 1.5 + 0.8 + 1.4 - 0.6 - 0.4 + 1.2Bulgaria + 5.5 + 2.7 + 1.8 + 0.8 + 0.9 + 1.7Denmark + 1.3 - 0.0 + 1.1 - 0.5 + 0.7 + 1.7United Kingdom + 3.0 + 0.6 + 1.0 + 0.3 + 0.6 + 1.7Latvia + 8.2 - 0.8 + 5.5 + 5.6 + 3.8 + 4.1Lithuania + 7.8 + 1.0 + 5.9 + 3.6 + 3.1 + 3.6Poland + 3.1 + 4.7 + 4.5 + 1.9 + 1.1 + 2.2Romania + 5.7 + 2.6 + 2.2 + 0.7 + 1.6 + 2.2Sweden + 2.7 + 1.6 + 3.7 + 0.8 + 1.5 + 2.5Czech Republic + 4.1 + 2.7 + 1.9 - 1.3 - 0.4 + 1.6Hungary + 4.2 - 0.2 + 1.6 - 1.7 + 0.2 + 1.4EU (15) + 1.8 + 0.7 + 1.4 - 0.4 - 0.2 + 1.4EU (27) + 1.9 + 0.9 + 1.6 - 0.3 - 0.1 + 1.4Iceland + 4.2 + 0.1 + 2.9 + 1.6 + 1.8 + 3.0Croatia + 4.5 + 0.5 + 0.0 - 2.0 - 1.0 + 0.2Macedonia + 1.6 + 3.6 + 2.8 - 0.3 + 1.5 + 2.0Turkey + 4.6 + 3.2 + 8.8 + 2.2 + 3.2 + 4.0Switzerland + 1.3 + 2.1 + 1.9 + 0.8 + 1.1 + 2.3Norway + 2.2 + 0.8 + 1.4 + 3.3 + 2.5 + 2.0United States + 2.4 + 0.7 + 1.8 + 2.2 + 1.9 + 2.6Japan + 1.2 + 0.4 - 0.6 + 2.0 + 1.4 + 1.6
2005-2010 2 2013
1. INTERNATIONAL OVERVIEW
13
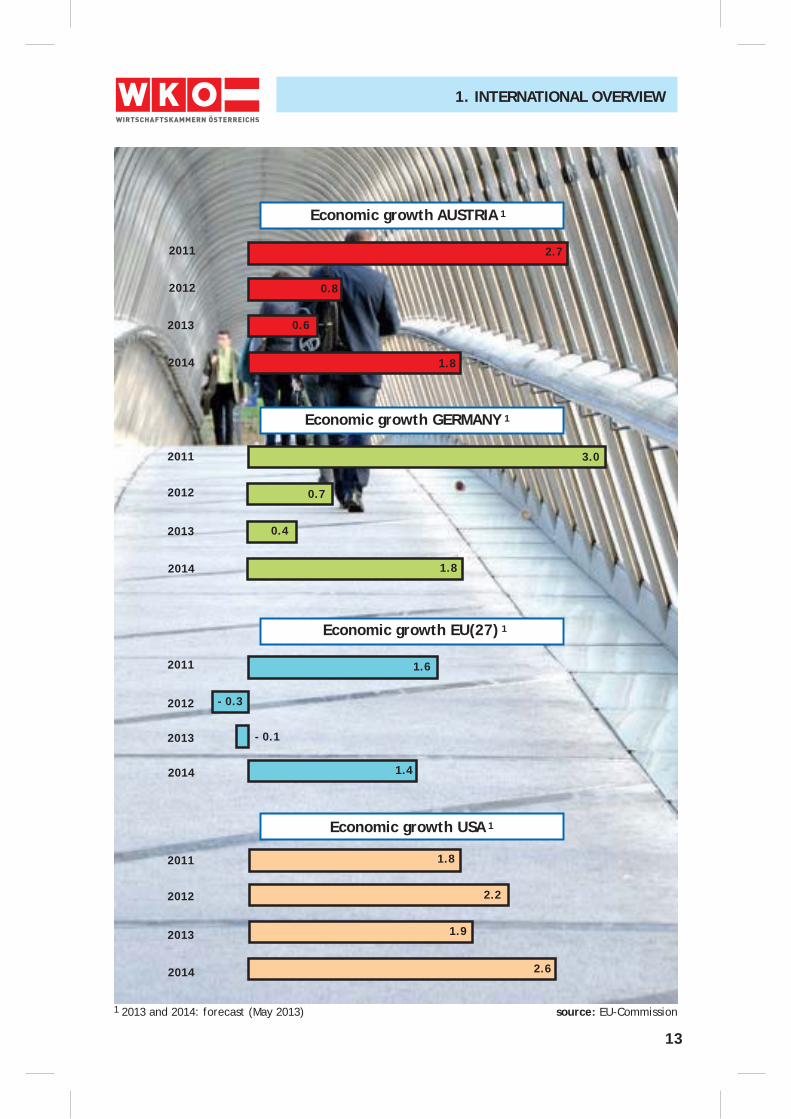
1. INTERNATIONAL OVERVIEW
1 2013 and 2014: forecast (May 2013) source: EU-Commission
Economic growth AUSTRIA 1
Economic growth USA 1
Economic growth EU(27) 1
Economic growth GERMANY 1
2011
2014
2013
2012
2011
2014
2013
2012
2011
2014
2013
2012
2011
2014
2013
2012
0.8
0.6
1.8
2.7
0.7
1.8
0.4
3.0
- 0.3
1.4
- 0.1
1.6
2.2
2.6
1.9
1.8
14
1. INTERNATIONAL OVERVIEW
Belgium 251.0 248.9 66.2 84.8
Germany 987.9 1.163.2 44.0 51.5Estonia 12.6 11.5 67.4 92.5Finland 56.6 56.8 29.2 39.7France 506.7 445.8 22.0 28.0Greece 49.6 27.8 14.3 27.0Ireland 50.0 86.4 52.8 108.3Italy 371.0 389.9 24.9 30.3Luxembourg 19.5 13.4 30.1 170.9Malta 4.2 3.1 46.0 101.9Netherlands 370.4 420.6 70.0 87.4Austria 132.5 126.7 40.9 57.3Portugal 55.4 47.8 28.9 38.7Slovakia 59.3 62.5 87.5 95.6Slovenia 21.8 21.4 60.5 75.0Spain 256.2 230.8 22.0 32.2Cyprus 5.3 1.4 8.1 45.5Euro area (17) 3,203.0 3,349.4 35.3 45.6Bulgaria 24.4 20.8 52.4 66.6Denmark 76.5 81.8 33.5 54.5United Kingdom 501.7 370.5 19.5 31.7Latvia 12.1 9.9 44.6 61.1Lithuania 24.1 23.1 70.2 84.2Poland 149.7 146.6 38.4 46.2Romania 52.4 45.0 34.2 40.0Sweden 126.2 136.6 33.4 48.7Czech Republic 95.5 101.6 66.7 78.0Hungary 72.5 76.5 78.2 94.7EU (15) 3,804.3 3,838.4 32.3 43.2EU (27) 4,337.8 4,361.3 33.8 44.7Iceland 3.5 3.9 37.0 59.2Croatia 16.0 10.0 22.8 43.4Macedonia 4.9 3.1 41.1 52.9Turkey 177.5 127.3 20.8 26.4Switzerland 161.8 176.0 35.8 51.2Norway 70.0 123.6 31.7 40.8United States 1,781.4 1,207.3 9.9 13.9Japan 656.5 598.2 12.9 14.6
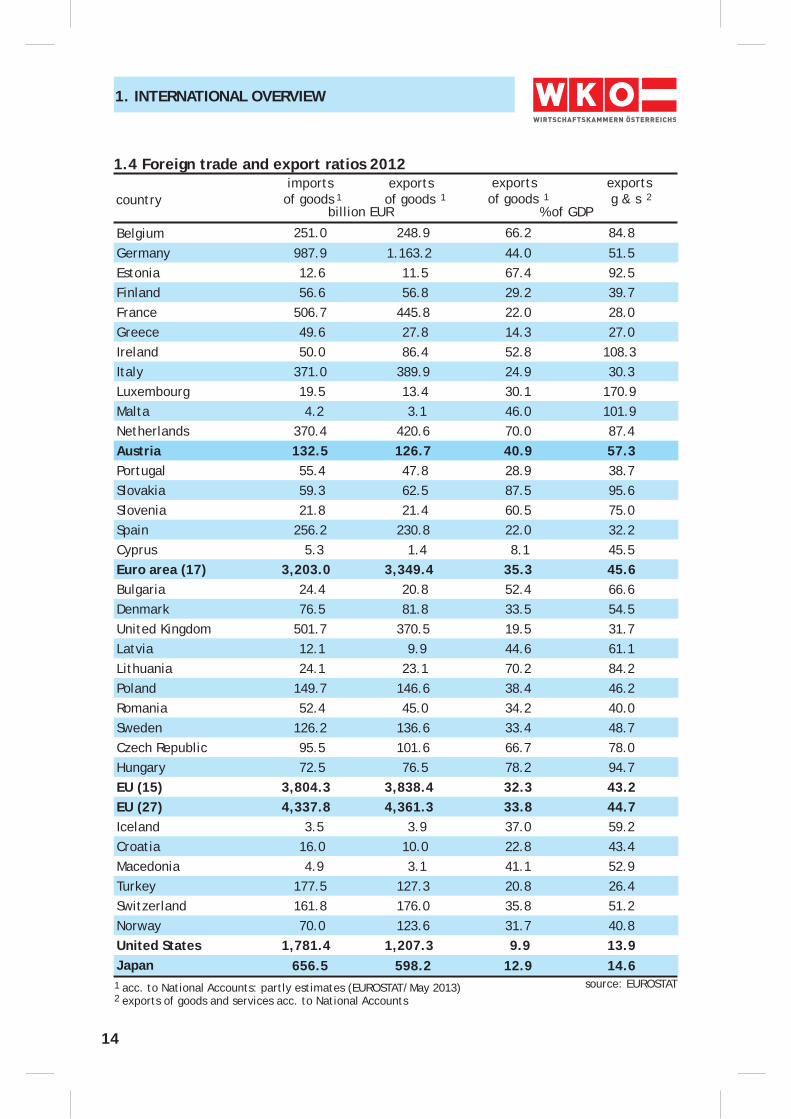
countrybillion EUR
importsof goods 1
1.4 Foreign trade and export ratios 2012
% of GDP
exportsof goods 1
exportsof goods 1
exports g & s 2
2 exports of goods and services acc. to National Accounts1 acc. to National Accounts: partly estimates (EUROSTAT/May 2013) source: EUROSTAT
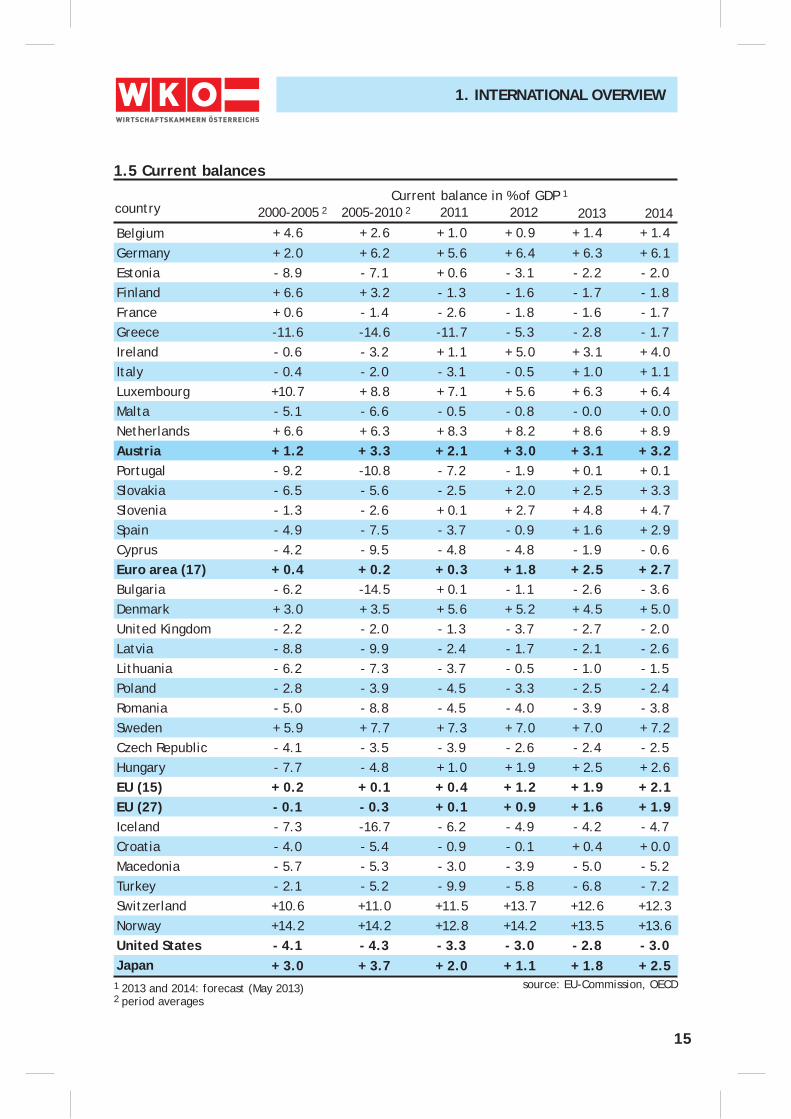
15
1. INTERNATIONAL OVERVIEW
2 period averages
Current balance in % of GDP 1
2014
source: EU-Commission, OECD
1.5 Current balances
country 2011 2012 2000-2005 2
1 2013 and 2014: forecast (May 2013)
Belgium + 4.6 + 2.6 + 1.0 + 0.9 + 1.4 + 1.4
Germany + 2.0 + 6.2 + 5.6 + 6.4 + 6.3 + 6.1Estonia - 8.9 - 7.1 + 0.6 - 3.1 - 2.2 - 2.0Finland + 6.6 + 3.2 - 1.3 - 1.6 - 1.7 - 1.8France + 0.6 - 1.4 - 2.6 - 1.8 - 1.6 - 1.7Greece -11.6 -14.6 -11.7 - 5.3 - 2.8 - 1.7Ireland - 0.6 - 3.2 + 1.1 + 5.0 + 3.1 + 4.0Italy - 0.4 - 2.0 - 3.1 - 0.5 + 1.0 + 1.1Luxembourg +10.7 + 8.8 + 7.1 + 5.6 + 6.3 + 6.4Malta - 5.1 - 6.6 - 0.5 - 0.8 - 0.0 + 0.0Netherlands + 6.6 + 6.3 + 8.3 + 8.2 + 8.6 + 8.9Austria + 1.2 + 3.3 + 2.1 + 3.0 + 3.1 + 3.2Portugal - 9.2 -10.8 - 7.2 - 1.9 + 0.1 + 0.1Slovakia - 6.5 - 5.6 - 2.5 + 2.0 + 2.5 + 3.3Slovenia - 1.3 - 2.6 + 0.1 + 2.7 + 4.8 + 4.7Spain - 4.9 - 7.5 - 3.7 - 0.9 + 1.6 + 2.9Cyprus - 4.2 - 9.5 - 4.8 - 4.8 - 1.9 - 0.6Euro area (17) + 0.4 + 0.2 + 0.3 + 1.8 + 2.5 + 2.7Bulgaria - 6.2 -14.5 + 0.1 - 1.1 - 2.6 - 3.6Denmark + 3.0 + 3.5 + 5.6 + 5.2 + 4.5 + 5.0United Kingdom - 2.2 - 2.0 - 1.3 - 3.7 - 2.7 - 2.0Latvia - 8.8 - 9.9 - 2.4 - 1.7 - 2.1 - 2.6Lithuania - 6.2 - 7.3 - 3.7 - 0.5 - 1.0 - 1.5Poland - 2.8 - 3.9 - 4.5 - 3.3 - 2.5 - 2.4Romania - 5.0 - 8.8 - 4.5 - 4.0 - 3.9 - 3.8Sweden + 5.9 + 7.7 + 7.3 + 7.0 + 7.0 + 7.2Czech Republic - 4.1 - 3.5 - 3.9 - 2.6 - 2.4 - 2.5Hungary - 7.7 - 4.8 + 1.0 + 1.9 + 2.5 + 2.6EU (15) + 0.2 + 0.1 + 0.4 + 1.2 + 1.9 + 2.1EU (27) - 0.1 - 0.3 + 0.1 + 0.9 + 1.6 + 1.9Iceland - 7.3 -16.7 - 6.2 - 4.9 - 4.2 - 4.7Croatia - 4.0 - 5.4 - 0.9 - 0.1 + 0.4 + 0.0Macedonia - 5.7 - 5.3 - 3.0 - 3.9 - 5.0 - 5.2Turkey - 2.1 - 5.2 - 9.9 - 5.8 - 6.8 - 7.2Switzerland +10.6 +11.0 +11.5 +13.7 +12.6 +12.3Norway +14.2 +14.2 +12.8 +14.2 +13.5 +13.6United States - 4.1 - 4.3 - 3.3 - 3.0 - 2.8 - 3.0Japan + 3.0 + 3.7 + 2.0 + 1.1 + 1.8 + 2.5
2005-2010 2 2013
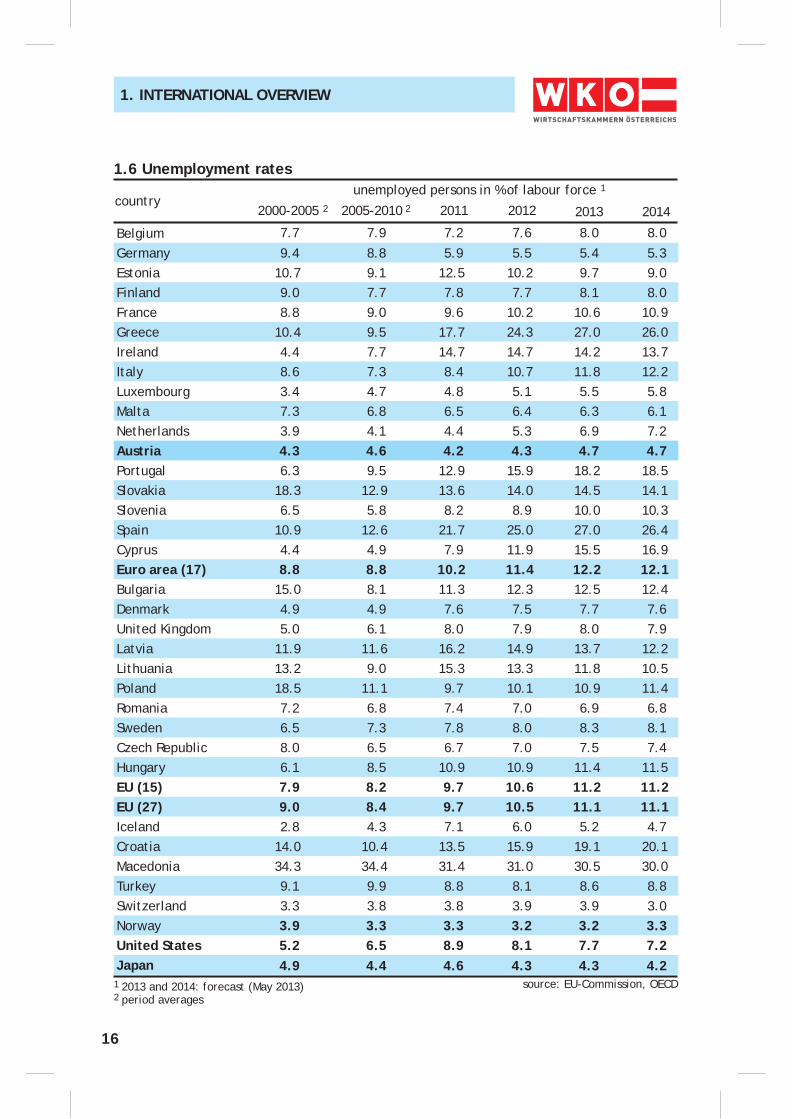
16
1. INTERNATIONAL OVERVIEW
2 period averages
unemployed persons in % of labour force 1
source: EU-Commission, OECD
1.6 Unemployment rates
country 2011 2012 2000-2005 2
1 2013 and 2014: forecast (May 2013)
Belgium 7.7 7.9 7.2 7.6 8.0 8.0
Germany 9.4 8.8 5.9 5.5 5.4 5.3Estonia 10.7 9.1 12.5 10.2 9.7 9.0Finland 9.0 7.7 7.8 7.7 8.1 8.0France 8.8 9.0 9.6 10.2 10.6 10.9Greece 10.4 9.5 17.7 24.3 27.0 26.0Ireland 4.4 7.7 14.7 14.7 14.2 13.7Italy 8.6 7.3 8.4 10.7 11.8 12.2Luxembourg 3.4 4.7 4.8 5.1 5.5 5.8Malta 7.3 6.8 6.5 6.4 6.3 6.1Netherlands 3.9 4.1 4.4 5.3 6.9 7.2Austria 4.3 4.6 4.2 4.3 4.7 4.7Portugal 6.3 9.5 12.9 15.9 18.2 18.5Slovakia 18.3 12.9 13.6 14.0 14.5 14.1Slovenia 6.5 5.8 8.2 8.9 10.0 10.3Spain 10.9 12.6 21.7 25.0 27.0 26.4Cyprus 4.4 4.9 7.9 11.9 15.5 16.9Euro area (17) 8.8 8.8 10.2 11.4 12.2 12.1Bulgaria 15.0 8.1 11.3 12.3 12.5 12.4Denmark 4.9 4.9 7.6 7.5 7.7 7.6United Kingdom 5.0 6.1 8.0 7.9 8.0 7.9Latvia 11.9 11.6 16.2 14.9 13.7 12.2Lithuania 13.2 9.0 15.3 13.3 11.8 10.5Poland 18.5 11.1 9.7 10.1 10.9 11.4Romania 7.2 6.8 7.4 7.0 6.9 6.8Sweden 6.5 7.3 7.8 8.0 8.3 8.1Czech Republic 8.0 6.5 6.7 7.0 7.5 7.4Hungary 6.1 8.5 10.9 10.9 11.4 11.5EU (15) 7.9 8.2 9.7 10.6 11.2 11.2EU (27) 9.0 8.4 9.7 10.5 11.1 11.1Iceland 2.8 4.3 7.1 6.0 5.2 4.7Croatia 14.0 10.4 13.5 15.9 19.1 20.1Macedonia 34.3 34.4 31.4 31.0 30.5 30.0Turkey 9.1 9.9 8.8 8.1 8.6 8.8Switzerland 3.3 3.8 3.8 3.9 3.9 3.0Norway 3.9 3.3 3.3 3.2 3.2 3.3United States 5.2 6.5 8.9 8.1 7.7 7.2Japan 4.9 4.4 4.6 4.3 4.3 4.2
2005-2010 2 2013 2014
17
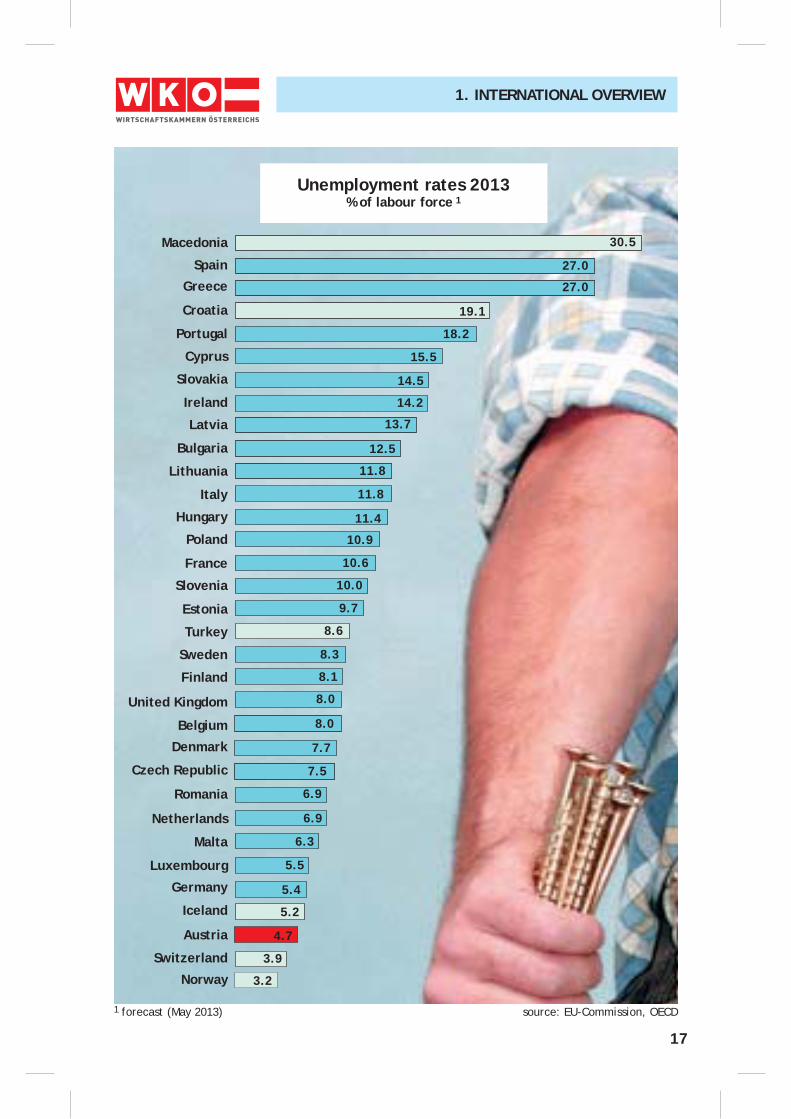
1. INTERNATIONAL OVERVIEW
Unemployment rates 2013% of labour force 1
1 forecast (May 2013) source: EU-Commission, OECD
Macedonia
Latvia
Ireland
Slovakia
Cyprus
Portugal
Croatia
Greece
Spain
Finland
Sweden
Turkey
Estonia
Slovenia
France
Poland
Hungary
Italy
Lithuania
Bulgaria
Iceland
Germany
Luxembourg
Malta
Netherlands
Romania
Czech Republic
Denmark
Belgium
United Kingdom
Austria
Switzerland
Norway
8.0
8.0
8.1
8.3
8.6
9.7
10.9
10.0
10.6
11.4
11.8
12.5
13.7
14.2
14.5
15.5
19.1
18.2
27.0
27.0
30.5
4.7
5.4
5.2
5.5
6.9
6.3
7.5
6.9
7.7
3.2
3.9
11.8
18
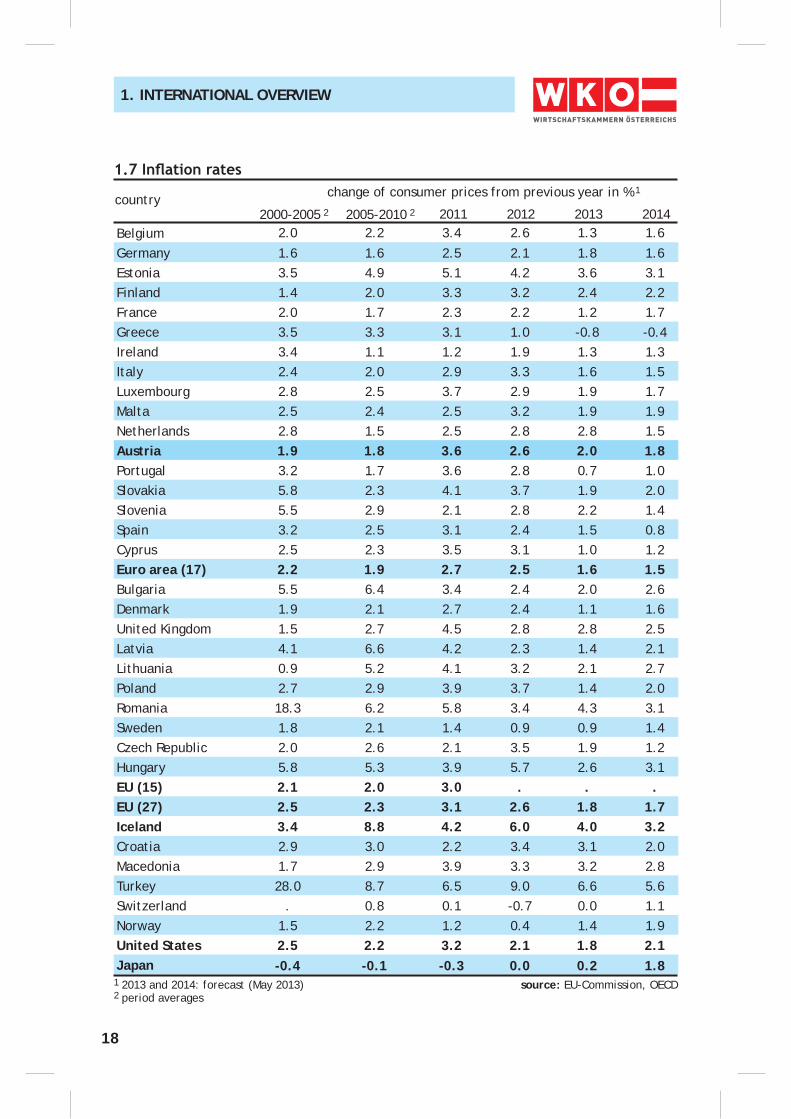
1. INTERNATIONAL OVERVIEW
2 period averages
change of consumer prices from previous year in % 1
source: EU-Commission, OECD
country 2011 2012 2000-2005 2
1 2013 and 2014: forecast (May 2013)
Belgium 2.0 2.2 3.4 2.6 1.3 1.6
Germany 1.6 1.6 2.5 2.1 1.8 1.6Estonia 3.5 4.9 5.1 4.2 3.6 3.1Finland 1.4 2.0 3.3 3.2 2.4 2.2France 2.0 1.7 2.3 2.2 1.2 1.7Greece 3.5 3.3 3.1 1.0 -0.8 -0.4Ireland 3.4 1.1 1.2 1.9 1.3 1.3Italy 2.4 2.0 2.9 3.3 1.6 1.5Luxembourg 2.8 2.5 3.7 2.9 1.9 1.7Malta 2.5 2.4 2.5 3.2 1.9 1.9Netherlands 2.8 1.5 2.5 2.8 2.8 1.5Austria 1.9 1.8 3.6 2.6 2.0 1.8Portugal 3.2 1.7 3.6 2.8 0.7 1.0Slovakia 5.8 2.3 4.1 3.7 1.9 2.0Slovenia 5.5 2.9 2.1 2.8 2.2 1.4Spain 3.2 2.5 3.1 2.4 1.5 0.8Cyprus 2.5 2.3 3.5 3.1 1.0 1.2Euro area (17) 2.2 1.9 2.7 2.5 1.6 1.5Bulgaria 5.5 6.4 3.4 2.4 2.0 2.6Denmark 1.9 2.1 2.7 2.4 1.1 1.6United Kingdom 1.5 2.7 4.5 2.8 2.8 2.5Latvia 4.1 6.6 4.2 2.3 1.4 2.1Lithuania 0.9 5.2 4.1 3.2 2.1 2.7Poland 2.7 2.9 3.9 3.7 1.4 2.0Romania 18.3 6.2 5.8 3.4 4.3 3.1Sweden 1.8 2.1 1.4 0.9 0.9 1.4Czech Republic 2.0 2.6 2.1 3.5 1.9 1.2Hungary 5.8 5.3 3.9 5.7 2.6 3.1EU (15) 2.1 2.0 3.0 . . .EU (27) 2.5 2.3 3.1 2.6 1.8 1.7Iceland 3.4 8.8 4.2 6.0 4.0 3.2Croatia 2.9 3.0 2.2 3.4 3.1 2.0Macedonia 1.7 2.9 3.9 3.3 3.2 2.8Turkey 28.0 8.7 6.5 9.0 6.6 5.6Switzerland . 0.8 0.1 -0.7 0.0 1.1Norway 1.5 2.2 1.2 0.4 1.4 1.9United States 2.5 2.2 3.2 2.1 1.8 2.1Japan -0.4 -0.1 -0.3 0.0 0.2 1.8
2005-2010 2 2013 2014
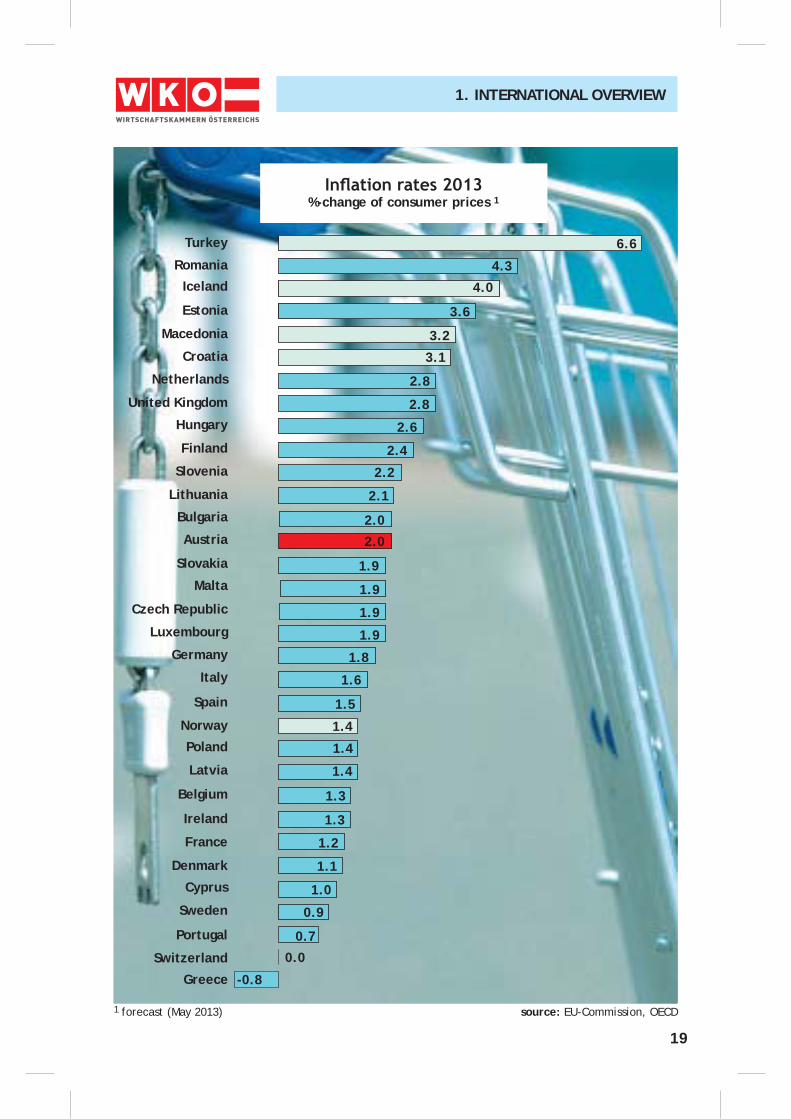
19
1. INTERNATIONAL OVERVIEW
%-change of consumer prices 1
1 forecast (May 2013) source: EU-Commission, OECD
Turkey
Hungary
United Kingdom
Netherlands
Croatia
Macedonia
Estonia
Iceland
Romania
Italy
Germany
Luxembourg
Czech Republic
Malta
Slovakia
Austria
Bulgaria
Lithuania
Slovenia
Finland
Sweden
Cyprus
Denmark
France
Ireland
Belgium
Latvia
Poland
Norway
Spain
Portugal
Switzerland
Greece
1.4
1.4
1.5
1.8
1.9
1.9
2.0
1.9
1.9
2.0
2.1
2.4
2.6
2.8
2.8
3.1
3.6
3.2
4.0
4.3
6.6
0.7
0.9
1.0
1.2
1.1
1.3
1.3
1.4
-0.8
0.0
2.2
1.6
20
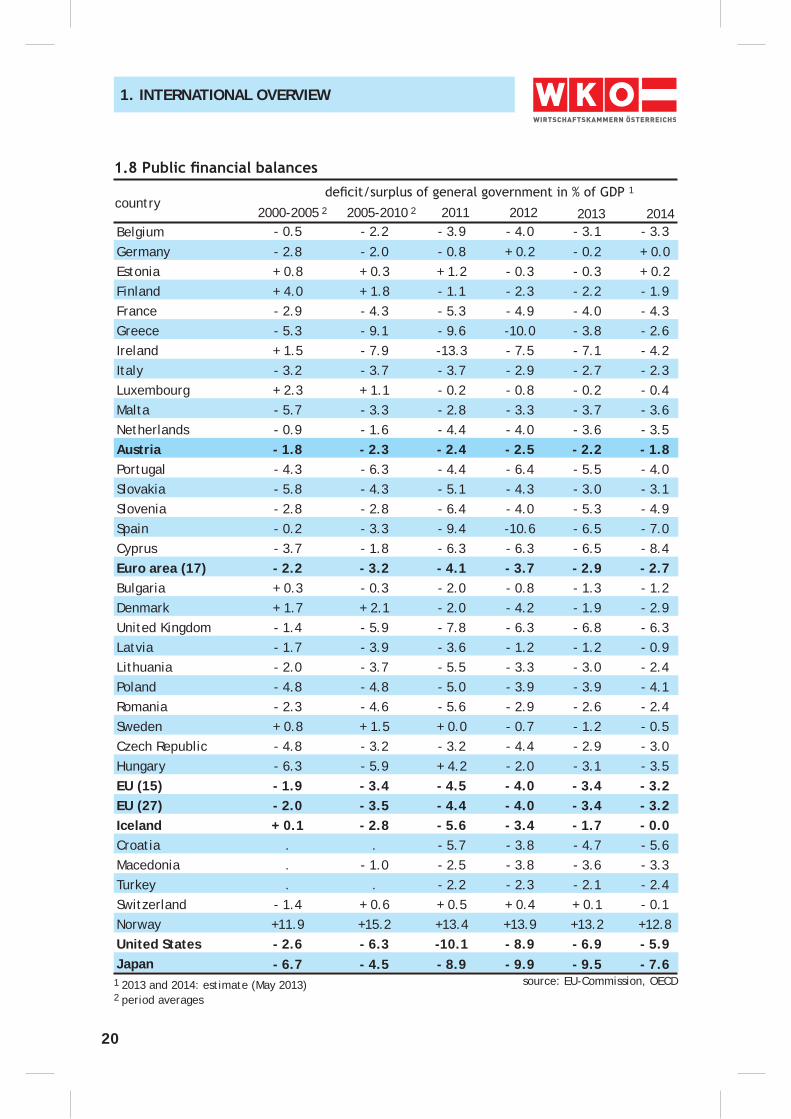
1. INTERNATIONAL OVERVIEW
1
source: EU-Commission, OECD
country 2011 2012 2000-2005 2
1 2013 and 2014: estimate (May 2013)
2005-2010 2 2013 2014Belgium - 0.5 - 2.2 - 3.9 - 4.0 - 3.1 - 3.3
Germany - 2.8 - 2.0 - 0.8 + 0.2 - 0.2 + 0.0Estonia + 0.8 + 0.3 + 1.2 - 0.3 - 0.3 + 0.2Finland + 4.0 + 1.8 - 1.1 - 2.3 - 2.2 - 1.9France - 2.9 - 4.3 - 5.3 - 4.9 - 4.0 - 4.3Greece - 5.3 - 9.1 - 9.6 -10.0 - 3.8 - 2.6Ireland + 1.5 - 7.9 -13.3 - 7.5 - 7.1 - 4.2Italy - 3.2 - 3.7 - 3.7 - 2.9 - 2.7 - 2.3Luxembourg + 2.3 + 1.1 - 0.2 - 0.8 - 0.2 - 0.4Malta - 5.7 - 3.3 - 2.8 - 3.3 - 3.7 - 3.6Netherlands - 0.9 - 1.6 - 4.4 - 4.0 - 3.6 - 3.5Austria - 1.8 - 2.3 - 2.4 - 2.5 - 2.2 - 1.8Portugal - 4.3 - 6.3 - 4.4 - 6.4 - 5.5 - 4.0Slovakia - 5.8 - 4.3 - 5.1 - 4.3 - 3.0 - 3.1Slovenia - 2.8 - 2.8 - 6.4 - 4.0 - 5.3 - 4.9Spain - 0.2 - 3.3 - 9.4 -10.6 - 6.5 - 7.0Cyprus - 3.7 - 1.8 - 6.3 - 6.3 - 6.5 - 8.4Euro area (17) - 2.2 - 3.2 - 4.1 - 3.7 - 2.9 - 2.7Bulgaria + 0.3 - 0.3 - 2.0 - 0.8 - 1.3 - 1.2Denmark + 1.7 + 2.1 - 2.0 - 4.2 - 1.9 - 2.9United Kingdom - 1.4 - 5.9 - 7.8 - 6.3 - 6.8 - 6.3Latvia - 1.7 - 3.9 - 3.6 - 1.2 - 1.2 - 0.9Lithuania - 2.0 - 3.7 - 5.5 - 3.3 - 3.0 - 2.4Poland - 4.8 - 4.8 - 5.0 - 3.9 - 3.9 - 4.1Romania - 2.3 - 4.6 - 5.6 - 2.9 - 2.6 - 2.4Sweden + 0.8 + 1.5 + 0.0 - 0.7 - 1.2 - 0.5Czech Republic - 4.8 - 3.2 - 3.2 - 4.4 - 2.9 - 3.0Hungary - 6.3 - 5.9 + 4.2 - 2.0 - 3.1 - 3.5EU (15) - 1.9 - 3.4 - 4.5 - 4.0 - 3.4 - 3.2EU (27) - 2.0 - 3.5 - 4.4 - 4.0 - 3.4 - 3.2Iceland + 0.1 - 2.8 - 5.6 - 3.4 - 1.7 - 0.0Croatia . . - 5.7 - 3.8 - 4.7 - 5.6Macedonia . - 1.0 - 2.5 - 3.8 - 3.6 - 3.3Turkey . . - 2.2 - 2.3 - 2.1 - 2.4Switzerland - 1.4 + 0.6 + 0.5 + 0.4 + 0.1 - 0.1Norway +11.9 +15.2 +13.4 +13.9 +13.2 +12.8United States - 2.6 - 6.3 -10.1 - 8.9 - 6.9 - 5.9Japan - 6.7 - 4.5 - 8.9 - 9.9 - 9.5 - 7.6
2 period averages
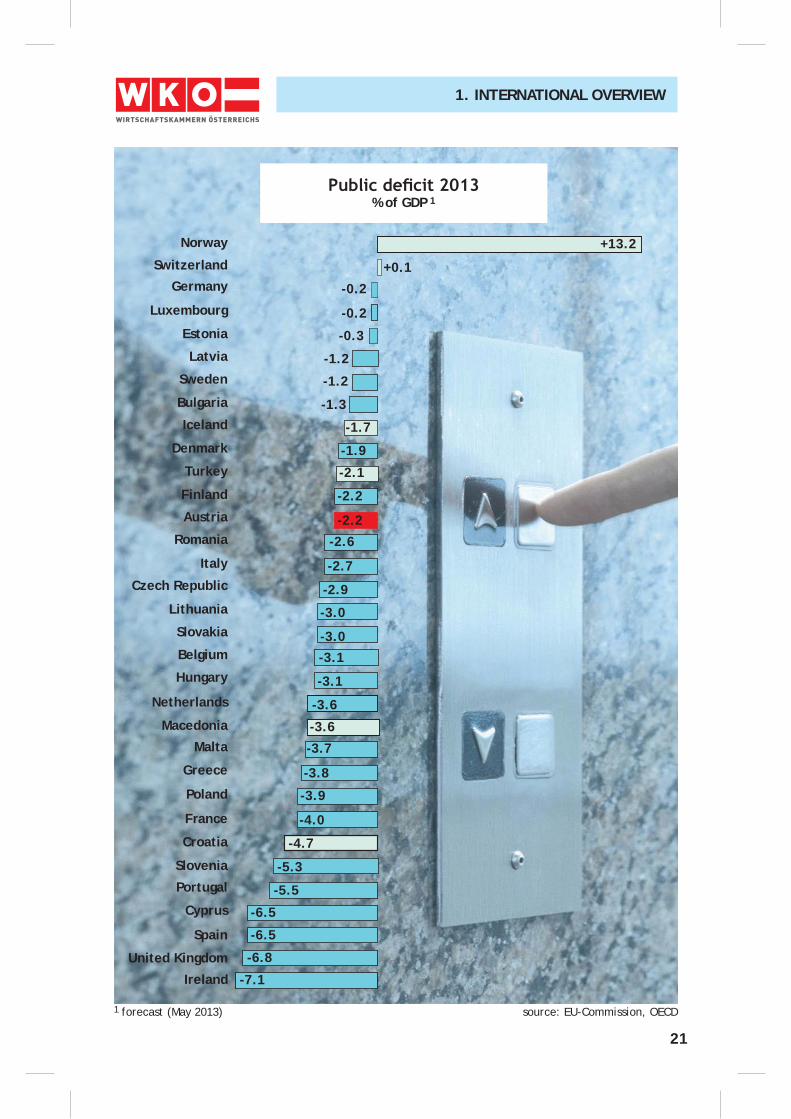
21
1. INTERNATIONAL OVERVIEW
% of GDP 1
1 forecast (May 2013) source: EU-Commission, OECD
Norway
Iceland
Bulgaria
Sweden
Latvia
Estonia
Luxembourg
Germany
Switzerland
Hungary
Belgium
Slovakia
Lithuania
Czech Republic
Italy
Romania
Austria
Finland
Turkey
Denmark
Cyprus
Portugal
Slovenia
Croatia
France
Poland
Greece
Malta
Macedonia
Netherlands
Spain
United Kingdom
Ireland
-3.6
-3.6
-3.1
-3.1
-3.0
-3.0
-2.6
-2.9
-2.7
-2.2
-2.2
-1.9
-1.7
-1.3
-1.2
-1.2
-0.2
-0.3
-0.2
+0.1
+13.2
-6.5
-5.5
-6.5
-5.3
-4.0
-4.7
-3.8
-3.9
-3.7
-7.1
-6.8
-2.1
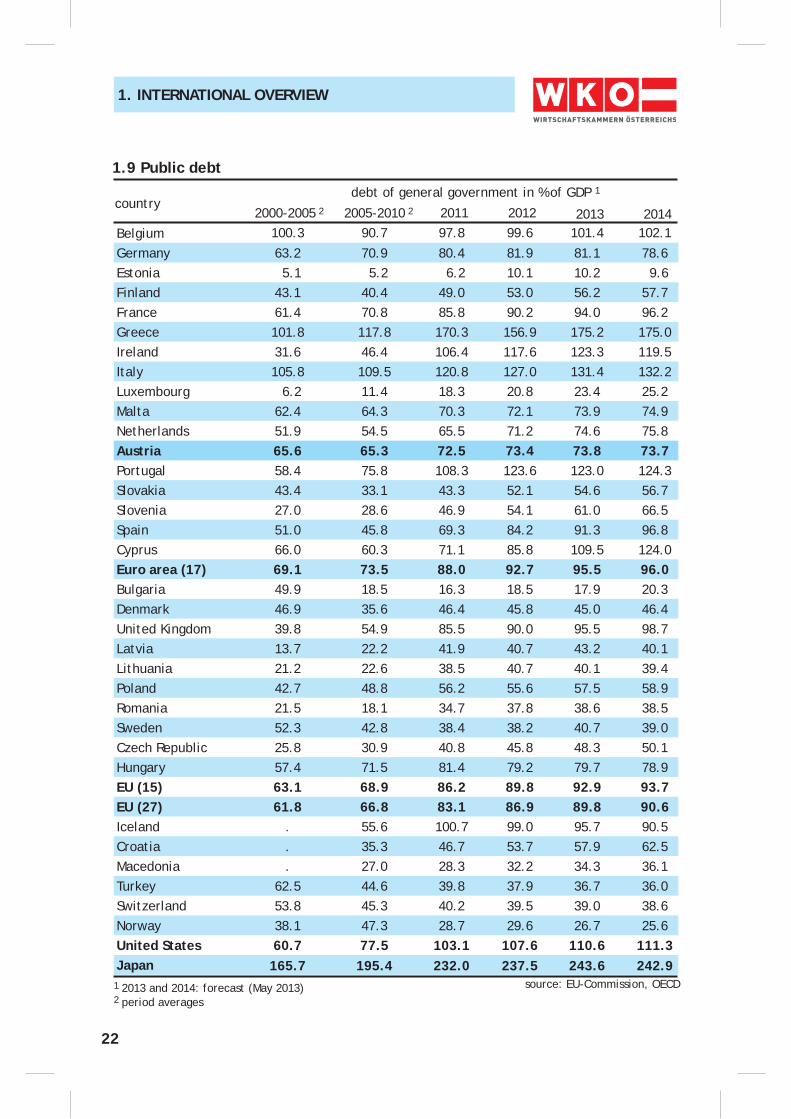
22
1. INTERNATIONAL OVERVIEW
debt of general government in % of GDP 1
source: EU-Commission, OECD
1.9 Public debt
country 2011 20122000-2005 2
1 2013 and 2014: forecast (May 2013)
2005-2010 2 2013Belgium 100.3 90.7 97.8 99.6 101.4 102.1
Germany 63.2 70.9 80.4 81.9 81.1 78.6Estonia 5.1 5.2 6.2 10.1 10.2 9.6Finland 43.1 40.4 49.0 53.0 56.2 57.7France 61.4 70.8 85.8 90.2 94.0 96.2Greece 101.8 117.8 170.3 156.9 175.2 175.0Ireland 31.6 46.4 106.4 117.6 123.3 119.5Italy 105.8 109.5 120.8 127.0 131.4 132.2Luxembourg 6.2 11.4 18.3 20.8 23.4 25.2Malta 62.4 64.3 70.3 72.1 73.9 74.9Netherlands 51.9 54.5 65.5 71.2 74.6 75.8Austria 65.6 65.3 72.5 73.4 73.8 73.7Portugal 58.4 75.8 108.3 123.6 123.0 124.3Slovakia 43.4 33.1 43.3 52.1 54.6 56.7Slovenia 27.0 28.6 46.9 54.1 61.0 66.5Spain 51.0 45.8 69.3 84.2 91.3 96.8Cyprus 66.0 60.3 71.1 85.8 109.5 124.0Euro area (17) 69.1 73.5 88.0 92.7 95.5 96.0Bulgaria 49.9 18.5 16.3 18.5 17.9 20.3Denmark 46.9 35.6 46.4 45.8 45.0 46.4United Kingdom 39.8 54.9 85.5 90.0 95.5 98.7Latvia 13.7 22.2 41.9 40.7 43.2 40.1Lithuania 21.2 22.6 38.5 40.7 40.1 39.4Poland 42.7 48.8 56.2 55.6 57.5 58.9Romania 21.5 18.1 34.7 37.8 38.6 38.5Sweden 52.3 42.8 38.4 38.2 40.7 39.0Czech Republic 25.8 30.9 40.8 45.8 48.3 50.1Hungary 57.4 71.5 81.4 79.2 79.7 78.9EU (15) 63.1 68.9 86.2 89.8 92.9 93.7EU (27) 61.8 66.8 83.1 86.9 89.8 90.6Iceland . 55.6 100.7 99.0 95.7 90.5Croatia . 35.3 46.7 53.7 57.9 62.5Macedonia . 27.0 28.3 32.2 34.3 36.1Turkey 62.5 44.6 39.8 37.9 36.7 36.0Switzerland 53.8 45.3 40.2 39.5 39.0 38.6Norway 38.1 47.3 28.7 29.6 26.7 25.6United States 60.7 77.5 103.1 107.6 110.6 111.3Japan 165.7 195.4 232.0 237.5 243.6 242.9
2014
2 period averages
23
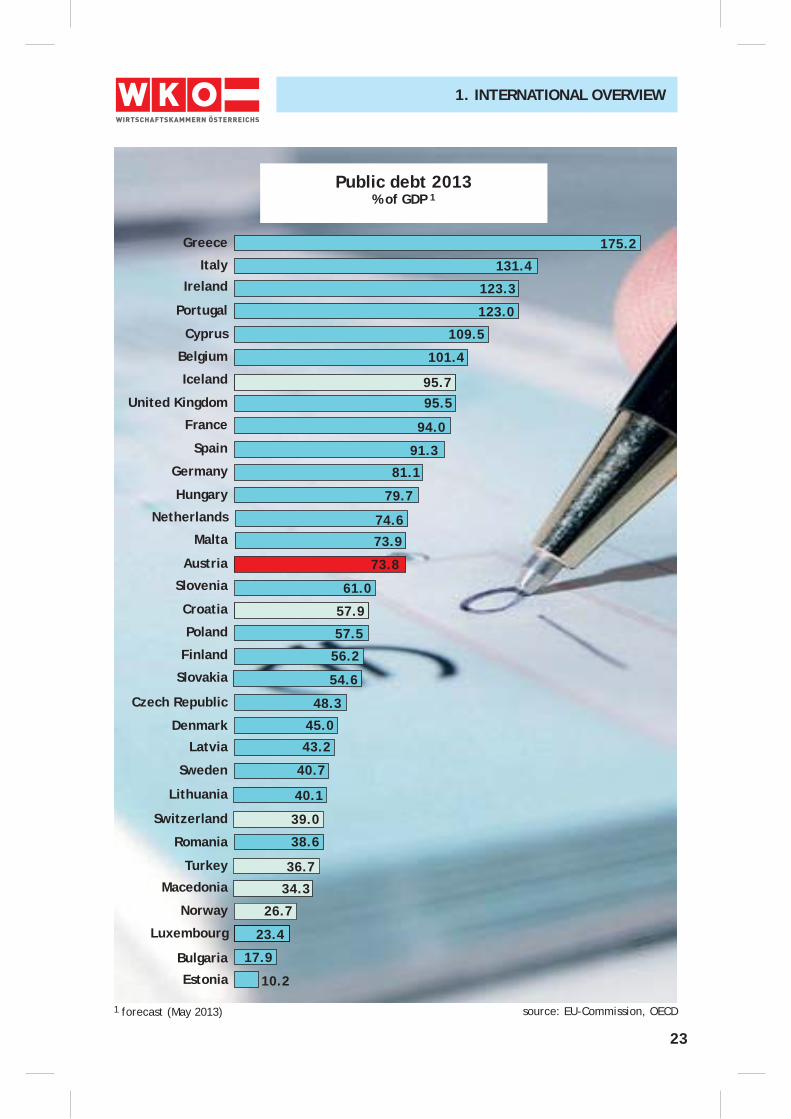
1. INTERNATIONAL OVERVIEW
Public debt 2013% of GDP 1
1 forecast (May 2013) source: EU-Commission, OECD
Greece
France
United Kingdom
Iceland
Belgium
Cyprus
Portugal
Ireland
Italy
Slovakia
Finland
Poland
Croatia
Slovenia
Austria
Malta
Netherlands
Hungary
Germany
Spain
Norway
Macedonia
Turkey
Romania
Switzerland
Lithuania
Sweden
Latvia
Denmark
Czech Republic
Bulgaria
Luxembourg
Estonia
48.3
45.0
54.6
56.2
57.5
57.9
73.9
61.0
73.8
74.6
79.7
91.3
94.0
95.595.7
101.4
123.0
109.5
123.3
131.4
175.2
23.4
34.3
26.7
36.7
39.0
38.6
40.7
40.1
43.2
10.2
17.9
81.1
24
1. INTERNATIONAL OVERVIEW
2 forecast (May 2013)
real annual change of GDP in %
source: EU-Commission
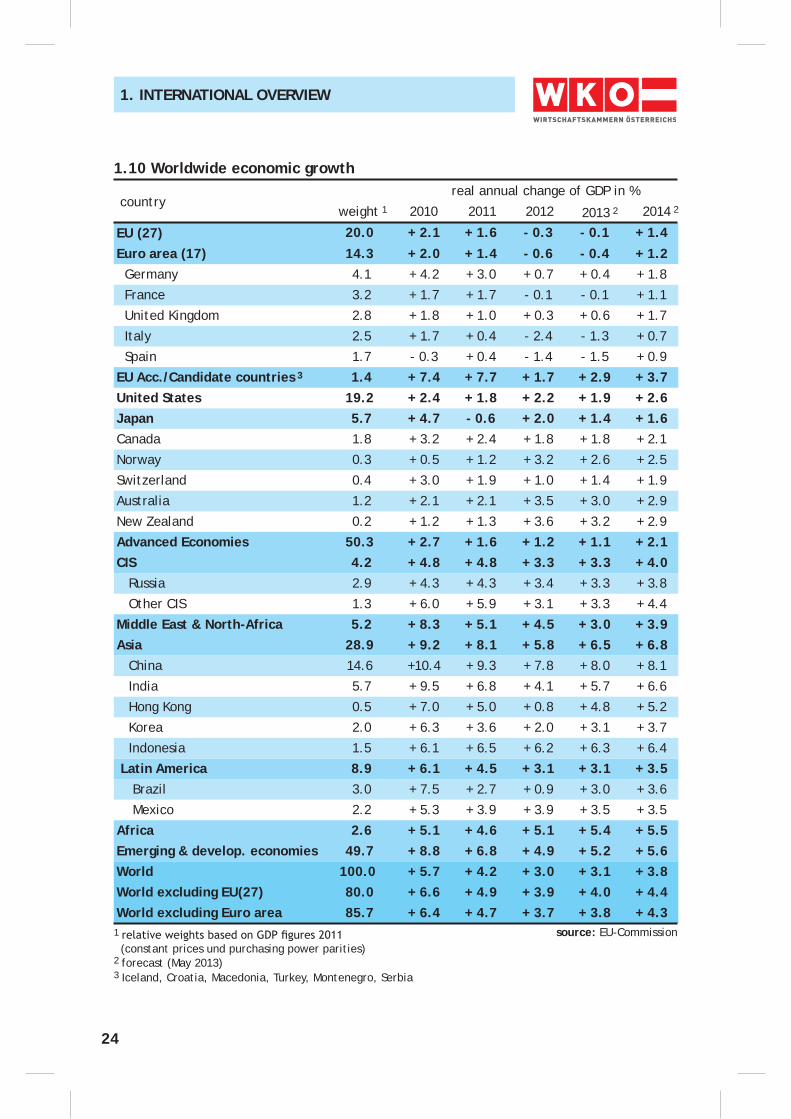
1.10 Worldwide economic growth
country 2011 2012
1
(constant prices und purchasing power parities)
EU (27) 20.0 + 2.1 + 1.6 - 0.3 - 0.1 + 1.4
Euro area (17) 14.3 + 2.0 + 1.4 - 0.6 - 0.4 + 1.2 Germany 4.1 + 4.2 + 3.0 + 0.7 + 0.4 + 1.8
France 3.2 + 1.7 + 1.7 - 0.1 - 0.1 + 1.1
United Kingdom 2.8 + 1.8 + 1.0 + 0.3 + 0.6 + 1.7
Italy 2.5 + 1.7 + 0.4 - 2.4 - 1.3 + 0.7
Spain 1.7 - 0.3 + 0.4 - 1.4 - 1.5 + 0.9
EU Acc./Candidate countries 3 1.4 + 7.4 + 7.7 + 1.7 + 2.9 + 3.7United States 19.2 + 2.4 + 1.8 + 2.2 + 1.9 + 2.6Japan 5.7 + 4.7 - 0.6 + 2.0 + 1.4 + 1.6Canada 1.8 + 3.2 + 2.4 + 1.8 + 1.8 + 2.1
Norway 0.3 + 0.5 + 1.2 + 3.2 + 2.6 + 2.5
Switzerland 0.4 + 3.0 + 1.9 + 1.0 + 1.4 + 1.9
Australia 1.2 + 2.1 + 2.1 + 3.5 + 3.0 + 2.9
New Zealand 0.2 + 1.2 + 1.3 + 3.6 + 3.2 + 2.9
Advanced Economies 50.3 + 2.7 + 1.6 + 1.2 + 1.1 + 2.1CIS 4.2 + 4.8 + 4.8 + 3.3 + 3.3 + 4.0 Russia 2.9 + 4.3 + 4.3 + 3.4 + 3.3 + 3.8
Other CIS 1.3 + 6.0 + 5.9 + 3.1 + 3.3 + 4.4
Middle East & North-Africa 5.2 + 8.3 + 5.1 + 4.5 + 3.0 + 3.9Asia 28.9 + 9.2 + 8.1 + 5.8 + 6.5 + 6.8 China 14.6 +10.4 + 9.3 + 7.8 + 8.0 + 8.1
India 5.7 + 9.5 + 6.8 + 4.1 + 5.7 + 6.6
Hong Kong 0.5 + 7.0 + 5.0 + 0.8 + 4.8 + 5.2
Korea 2.0 + 6.3 + 3.6 + 2.0 + 3.1 + 3.7
Indonesia 1.5 + 6.1 + 6.5 + 6.2 + 6.3 + 6.4
Latin America 8.9 + 6.1 + 4.5 + 3.1 + 3.1 + 3.5 Brazil 3.0 + 7.5 + 2.7 + 0.9 + 3.0 + 3.6
Mexico 2.2 + 5.3 + 3.9 + 3.9 + 3.5 + 3.5
Africa 2.6 + 5.1 + 4.6 + 5.1 + 5.4 + 5.5Emerging & develop. economies 49.7 + 8.8 + 6.8 + 4.9 + 5.2 + 5.6World 100.0 + 5.7 + 4.2 + 3.0 + 3.1 + 3.8World excluding EU(27) 80.0 + 6.6 + 4.9 + 3.9 + 4.0 + 4.4World excluding Euro area 85.7 + 6.4 + 4.7 + 3.7 + 3.8 + 4.3
2013 2 2014 2 weight 1
3 Iceland, Croatia, Macedonia, Turkey, Montenegro, Serbia
2010
25
1. INTERNATIONAL OVERVIEW
2 forecast (May 2013)
real annual change in %
source: EU-Commission
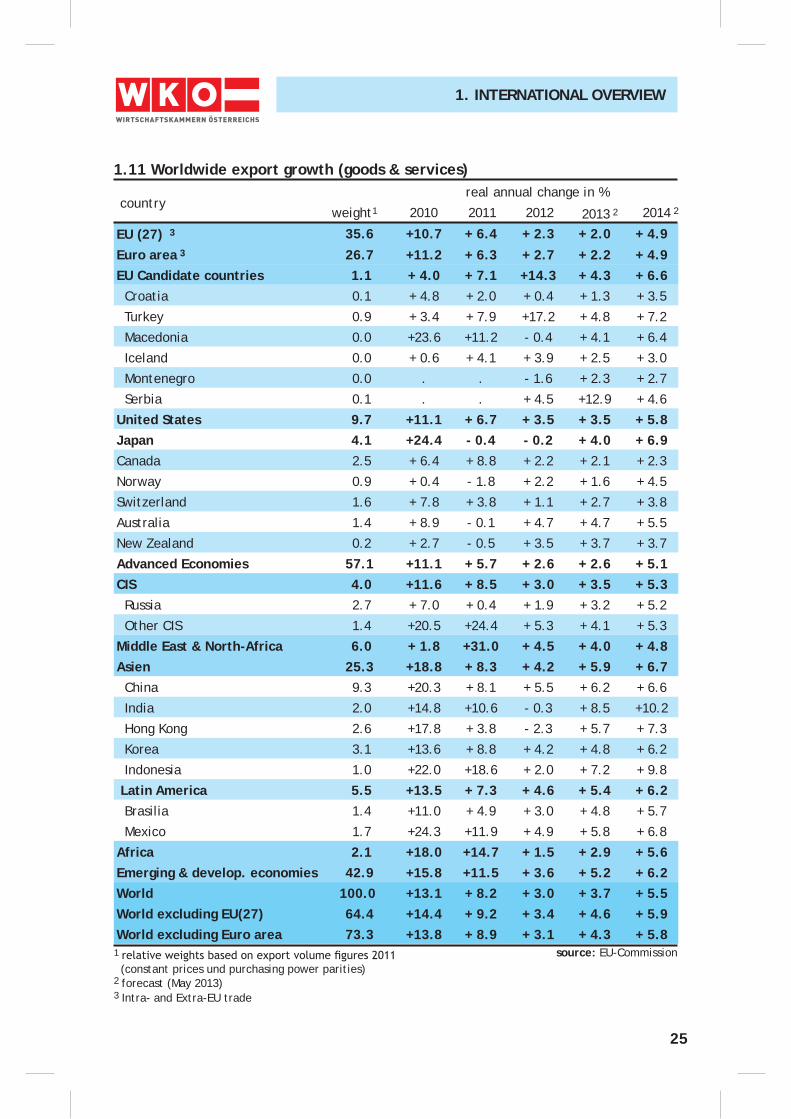
1.11 Worldwide export growth (goods & services)
country 2011 2012
1
(constant prices und purchasing power parities)
EU (27) 3 35.6 +10.7 + 6.4 + 2.3 + 2.0 + 4.9
Euro area 3 26.7 +11.2 + 6.3 + 2.7 + 2.2 + 4.9EU Candidate countries 1.1 + 4.0 + 7.1 +14.3 + 4.3 + 6.6 Croatia 0.1 + 4.8 + 2.0 + 0.4 + 1.3 + 3.5
Turkey 0.9 + 3.4 + 7.9 +17.2 + 4.8 + 7.2
Macedonia 0.0 +23.6 +11.2 - 0.4 + 4.1 + 6.4
Iceland 0.0 + 0.6 + 4.1 + 3.9 + 2.5 + 3.0
Montenegro 0.0 . . - 1.6 + 2.3 + 2.7
Serbia 0.1 . . + 4.5 +12.9 + 4.6
United States 9.7 +11.1 + 6.7 + 3.5 + 3.5 + 5.8Japan 4.1 +24.4 - 0.4 - 0.2 + 4.0 + 6.9Canada 2.5 + 6.4 + 8.8 + 2.2 + 2.1 + 2.3
Norway 0.9 + 0.4 - 1.8 + 2.2 + 1.6 + 4.5
Switzerland 1.6 + 7.8 + 3.8 + 1.1 + 2.7 + 3.8
Australia 1.4 + 8.9 - 0.1 + 4.7 + 4.7 + 5.5
New Zealand 0.2 + 2.7 - 0.5 + 3.5 + 3.7 + 3.7
Advanced Economies 57.1 +11.1 + 5.7 + 2.6 + 2.6 + 5.1CIS 4.0 +11.6 + 8.5 + 3.0 + 3.5 + 5.3 Russia 2.7 + 7.0 + 0.4 + 1.9 + 3.2 + 5.2
Other CIS 1.4 +20.5 +24.4 + 5.3 + 4.1 + 5.3
Middle East & North-Africa 6.0 + 1.8 +31.0 + 4.5 + 4.0 + 4.8Asien 25.3 +18.8 + 8.3 + 4.2 + 5.9 + 6.7 China 9.3 +20.3 + 8.1 + 5.5 + 6.2 + 6.6
India 2.0 +14.8 +10.6 - 0.3 + 8.5 +10.2
Hong Kong 2.6 +17.8 + 3.8 - 2.3 + 5.7 + 7.3
Korea 3.1 +13.6 + 8.8 + 4.2 + 4.8 + 6.2
Indonesia 1.0 +22.0 +18.6 + 2.0 + 7.2 + 9.8
Latin America 5.5 +13.5 + 7.3 + 4.6 + 5.4 + 6.2 Brasilia 1.4 +11.0 + 4.9 + 3.0 + 4.8 + 5.7
Mexico 1.7 +24.3 +11.9 + 4.9 + 5.8 + 6.8
Africa 2.1 +18.0 +14.7 + 1.5 + 2.9 + 5.6Emerging & develop. economies 42.9 +15.8 +11.5 + 3.6 + 5.2 + 6.2World 100.0 +13.1 + 8.2 + 3.0 + 3.7 + 5.5World excluding EU(27) 64.4 +14.4 + 9.2 + 3.4 + 4.6 + 5.9World excluding Euro area 73.3 +13.8 + 8.9 + 3.1 + 4.3 + 5.8
2013 2 2014 2 weight1
3 Intra- and Extra-EU trade
2010
26
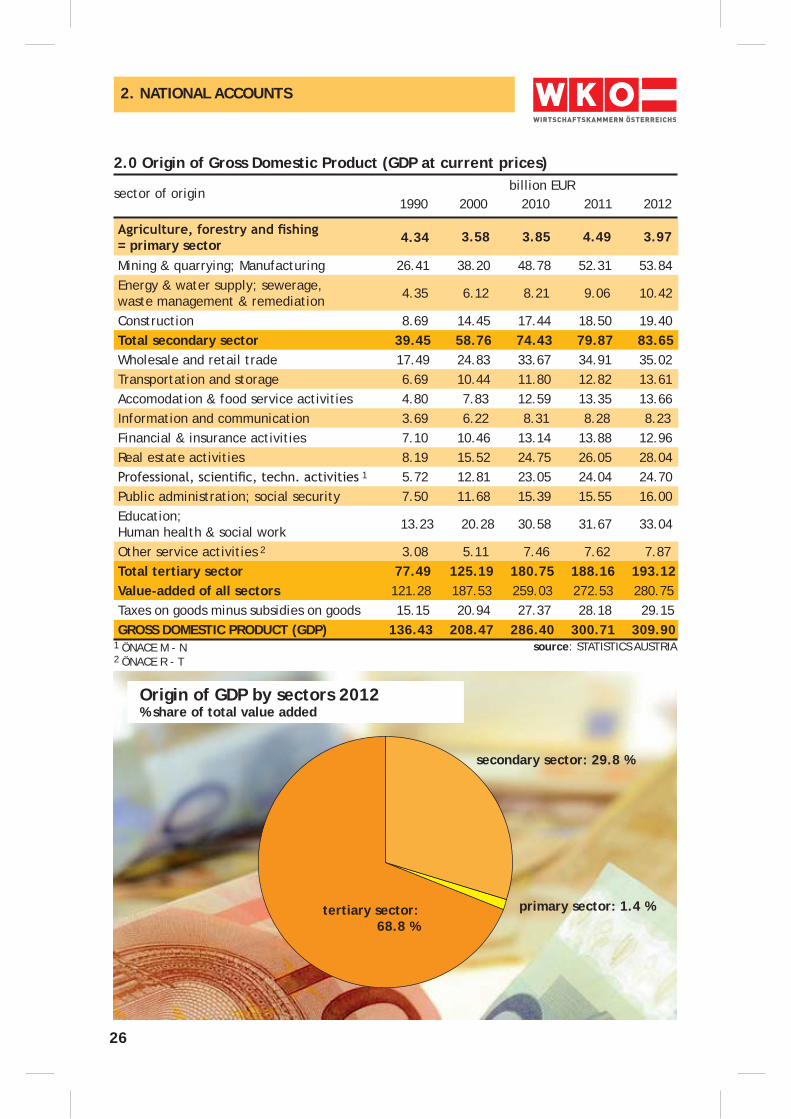
2.0 Origin of Gross Domestic Product (GDP at current prices)
2. NATIONAL ACCOUNTS
sector of originbillion EUR
Origin of GDP by sectors 2012% share of total value added
tertiary sector: 68.8 %
primary sector: 1.4 %
secondary sector: 29.8 %
source: STATISTICS AUSTRIA1 ÖNACE M - N
1990 2010 2000 2011 2012
= primary sector 4.34 3.58 3.85 4.49 3.97
Mining & quarrying; Manufacturing 26.41 38.20 48.78 52.31 53.84Energy & water supply; sewerage, waste management & remediation 4.35 6.12 8.21 9.06 10.42
Construction 8.69 14.45 17.44 18.50 19.40Total secondary sector 39.45 58.76 74.43 79.87 83.65Wholesale and retail trade 17.49 24.83 33.67 34.91 35.02Transportation and storage 6.69 10.44 11.80 12.82 13.61Accomodation & food service activities 4.80 7.83 12.59 13.35 13.66Information and communication 3.69 6.22 8.31 8.28 8.23Financial & insurance activities 7.10 10.46 13.14 13.88 12.96Real estate activities 8.19 15.52 24.75 26.05 28.04
1 5.72 12.81 23.05 24.04 24.70Public administration; social security 7.50 11.68 15.39 15.55 16.00Education; Human health & social work 13.23 20.28 30.58 31.67 33.04
Other service activities 2 3.08 5.11 7.46 7.62 7.87Total tertiary sector 77.49 125.19 180.75 188.16 193.12Value-added of all sectors 121.28 187.53 259.03 272.53 280.75Taxes on goods minus subsidies on goods 15.15 20.94 27.37 28.18 29.15GROSS DOMESTIC PRODUCT (GDP) 136.43 208.47 286.40 300.71 309.90
2 ÖNACE R - T
27
2. NATIONAL ACCOUNTS
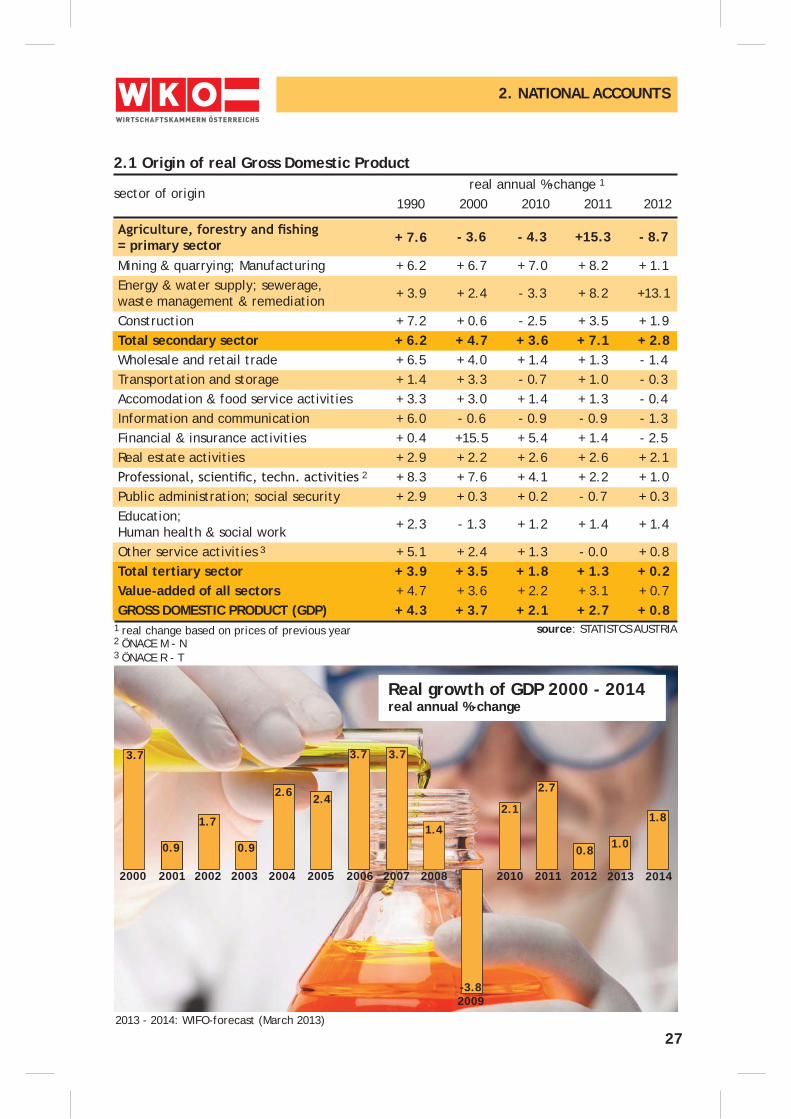
2.1 Origin of real Gross Domestic Product
sector of origin 1990 2010 2000 2011
real annual %-change 1
2012
Real growth of GDP 2000 - 2014real annual %-change
2013 - 2014: WIFO-forecast (March 2013)
source: STATISTCS AUSTRIA2 ÖNACE M - N
= primary sector + 7.6 - 3.6 - 4.3 +15.3 - 8.7
Mining & quarrying; Manufacturing + 6.2 + 6.7 + 7.0 + 8.2 + 1.1Energy & water supply; sewerage, waste management & remediation + 3.9 + 2.4 - 3.3 + 8.2 +13.1
Construction + 7.2 + 0.6 - 2.5 + 3.5 + 1.9Total secondary sector + 6.2 + 4.7 + 3.6 + 7.1 + 2.8Wholesale and retail trade + 6.5 + 4.0 + 1.4 + 1.3 - 1.4Transportation and storage + 1.4 + 3.3 - 0.7 + 1.0 - 0.3Accomodation & food service activities + 3.3 + 3.0 + 1.4 + 1.3 - 0.4Information and communication + 6.0 - 0.6 - 0.9 - 0.9 - 1.3Financial & insurance activities + 0.4 +15.5 + 5.4 + 1.4 - 2.5Real estate activities + 2.9 + 2.2 + 2.6 + 2.6 + 2.1
2 + 8.3 + 7.6 + 4.1 + 2.2 + 1.0Public administration; social security + 2.9 + 0.3 + 0.2 - 0.7 + 0.3Education; Human health & social work + 2.3 - 1.3 + 1.2 + 1.4 + 1.4
Other service activities 3 + 5.1 + 2.4 + 1.3 - 0.0 + 0.8Total tertiary sector + 3.9 + 3.5 + 1.8 + 1.3 + 0.2Value-added of all sectors + 4.7 + 3.6 + 2.2 + 3.1 + 0.7GROSS DOMESTIC PRODUCT (GDP) + 4.3 + 3.7 + 2.1 + 2.7 + 0.8
3 ÖNACE R - T
1 real change based on prices of previous year
3.7
0.9
1.7
0.9
2.6 2.4
3.7 3.7
1.4
-3.8
2.1
2001 2002 2003 2004 2005 2006 2007 2008 2010 2011
2.7
2012
1.0
2013
0.8
2014 2000
1.8
2009
28
2. NATIONAL ACCOUNTS
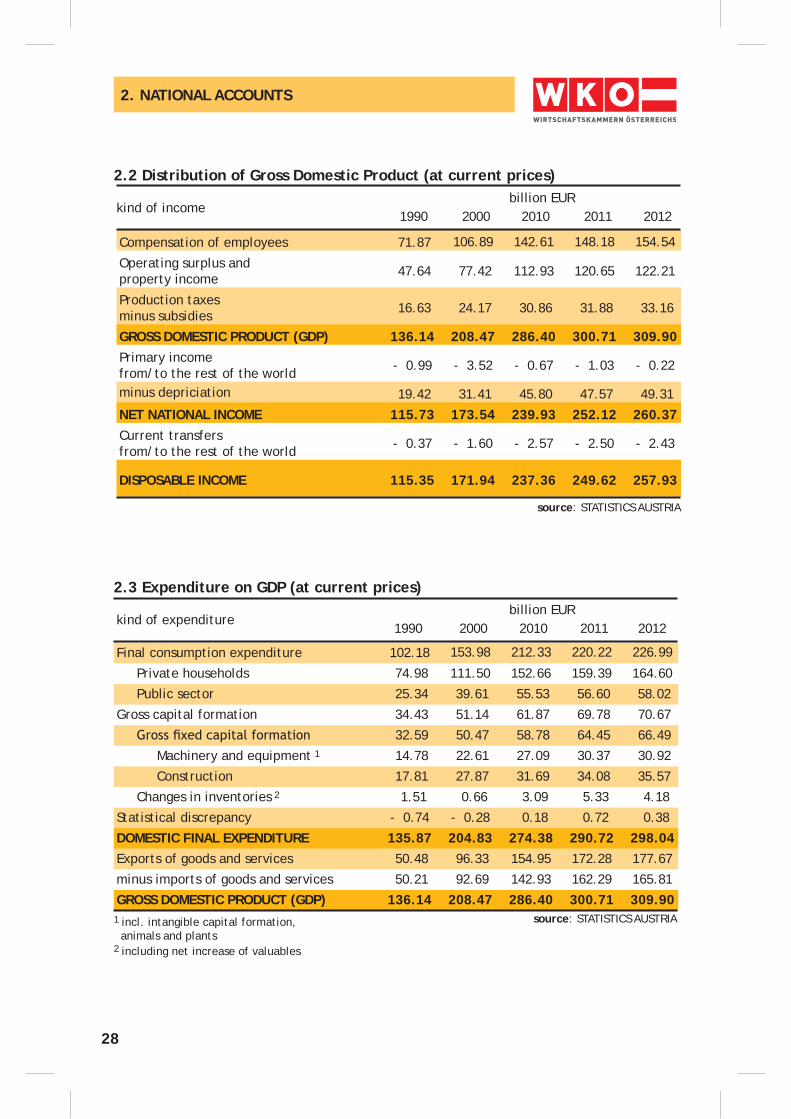
2.2 Distribution of Gross Domestic Product (at current prices)
source: STATISTICS AUSTRIA
1 incl. intangible capital formation, animals and plants
kind of incomebillion EUR
1990 2010 2000 2011 2012
Compensation of employees 71.87 106.89 142.61 148.18 154.54
Operating surplus andproperty income 47.64 77.42 112.93 120.65 122.21
Production taxesminus subsidies 16.63 24.17 30.86 31.88 33.16
GROSS DOMESTIC PRODUCT (GDP) 136.14 208.47 286.40 300.71 309.90Primary income from/to the rest of the world - 0.99 - 3.52 - 0.67 - 1.03 - 0.22
minus depriciation 19.42 31.41 45.80 47.57 49.31
NET NATIONAL INCOME 115.73 173.54 239.93 252.12 260.37Current transfers from/to the rest of the world - 0.37 - 1.60 - 2.57 - 2.50 - 2.43
DISPOSABLE INCOME 115.35 171.94 237.36 249.62 257.93
2 including net increase of valuables
2.3 Expenditure on GDP (at current prices)
source: STATISTICS AUSTRIA
kind of expenditurebillion EUR
1990 2010 2000 2011 2012
Final consumption expenditure 102.18 153.98 212.33 220.22 226.99
Private households 74.98 111.50 152.66 159.39 164.60
Public sector 25.34 39.61 55.53 56.60 58.02
Gross capital formation 34.43 51.14 61.87 69.78 70.67
32.59 50.47 58.78 64.45 66.49 Machinery and equipment 1 14.78 22.61 27.09 30.37 30.92
Construction 17.81 27.87 31.69 34.08 35.57 Changes in inventories 2 1.51 0.66 3.09 5.33 4.18
Statistical discrepancy - 0.74 - 0.28 0.18 0.72 0.38
DOMESTIC FINAL EXPENDITURE 135.87 204.83 274.38 290.72 298.04Exports of goods and services 50.48 96.33 154.95 172.28 177.67
minus imports of goods and services 50.21 92.69 142.93 162.29 165.81
GROSS DOMESTIC PRODUCT (GDP) 136.14 208.47 286.40 300.71 309.90
29
2. NATIONAL ACCOUNTS
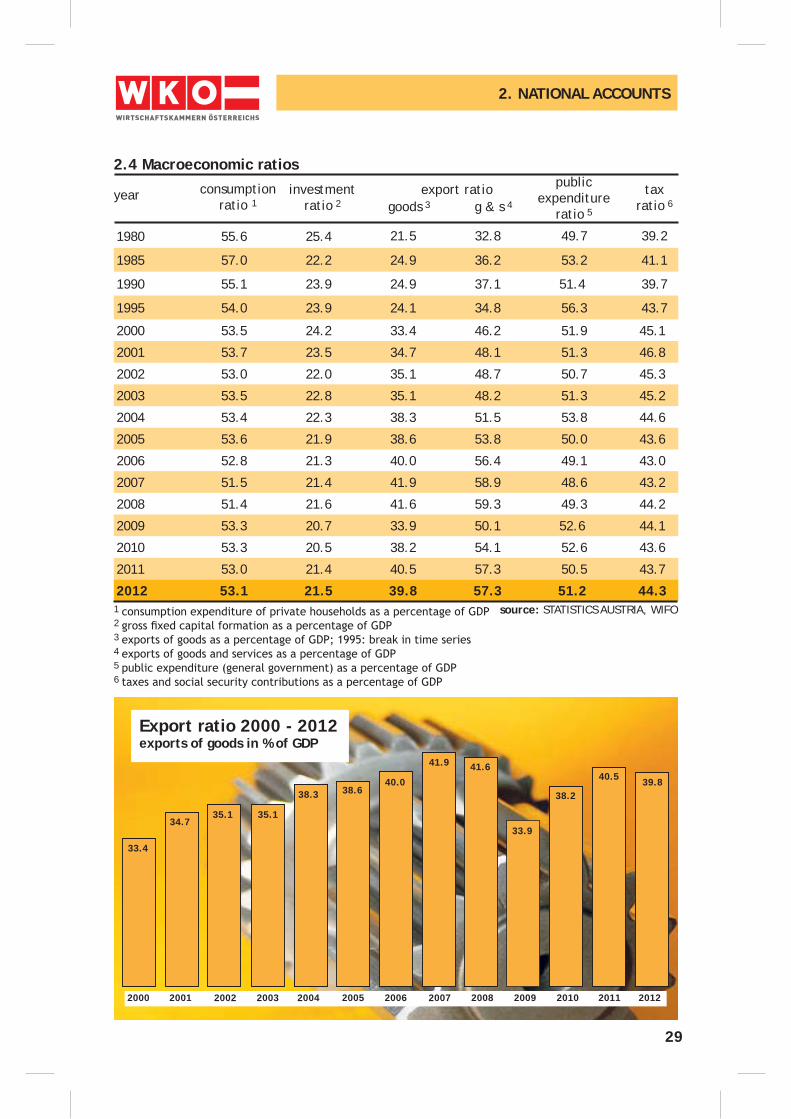
2.4 Macroeconomic ratios
source: STATISTICS AUSTRIA, WIFO
1980 55.6 25.4 21.5 32.8 49.7 39.2
1985 57.0 22.2 24.9 36.2 53.2 41.1
1990 55.1 23.9 24.9 37.1 51.4 39.7
1995 54.0 23.9 24.1 34.8 56.3 43.7
2000 53.5 24.2 33.4 46.2 51.9 45.1
2001 53.7 23.5 34.7 48.1 51.3 46.8
2002 53.0 22.0 35.1 48.7 50.7 45.3
2003 53.5 22.8 35.1 48.2 51.3 45.2
2004 53.4 22.3 38.3 51.5 53.8 44.6
2005 53.6 21.9 38.6 53.8 50.0 43.6
2006 52.8 21.3 40.0 56.4 49.1 43.0
2007 51.5 21.4 41.9 58.9 48.6 43.2
2008 51.4 21.6 41.6 59.3 49.3 44.2
2009 53.3 20.7 33.9 50.1 52.6 44.1
2010 53.3 20.5 38.2 54.1 52.6 43.6
2011 53.0 21.4 40.5 57.3 50.5 43.7
2012 53.1 21.5 39.8 57.3 51.2 44.3
2
year consumptionratio 1
3 4 5
1
investmentratio 2
export ratio publicexpenditure
ratio 5
taxratio 6goods 3 g & s 4
6
Export ratio 2000 - 2012 exports of goods in % of GDP
34.7
33.4
35.1 35.1
38.3 38.640.0
41.9 41.6
2000 2001 2002 2003 2004 2005 2006 2007 2008 2009
33.9
2010
38.2
2011
40.5
2012
39.8
30
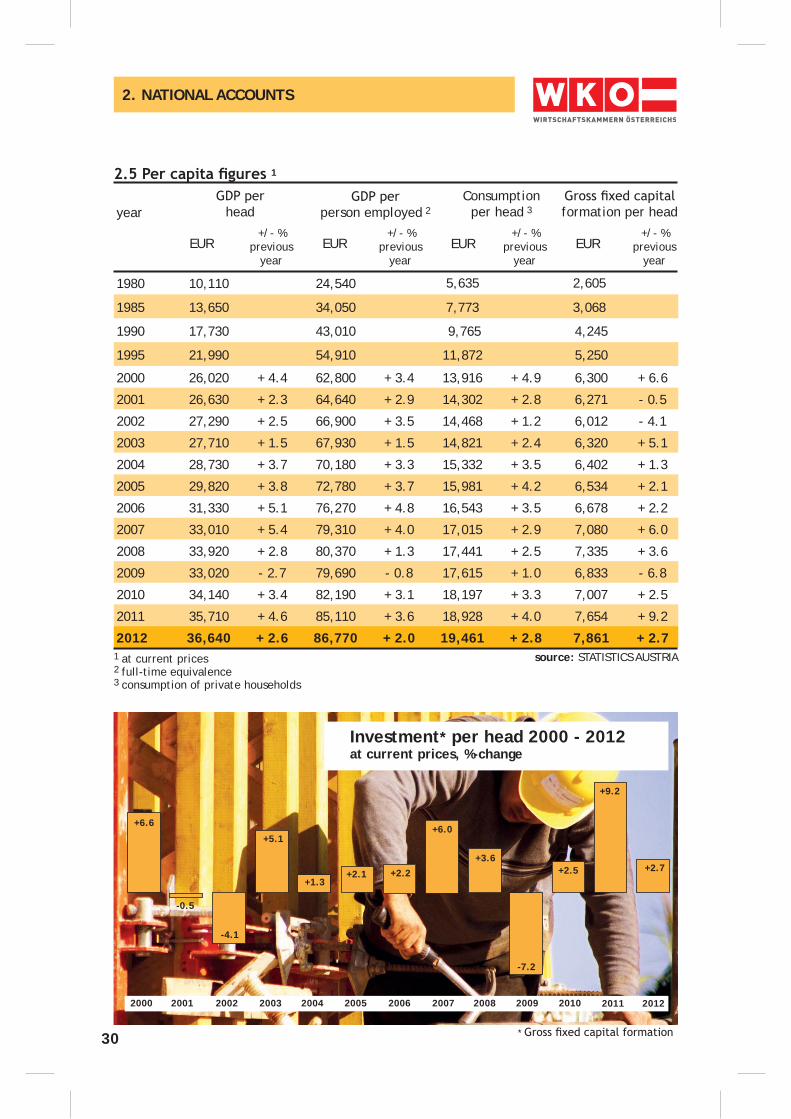
source: STATISTICS AUSTRIA
Consumption per head 3year
1
formation per head
EUR
2 full-time equivalence1 at current prices
3 consumption of private households
head
EUR
person employed 2
EUR+/- %
previous year
EUR+/- %
previous year
+/- %previous
year
+/- %previous
year
1980 10,110 24,540 5,635 2,605
1985 13,650 34,050 7,773 3,068
1990 17,730 43,010 9,765 4,245
1995 21,990 54,910 11,872 5,250
2000 26,020 + 4.4 62,800 + 3.4 13,916 + 4.9 6,300 + 6.6
2001 26,630 + 2.3 64,640 + 2.9 14,302 + 2.8 6,271 - 0.5
2002 27,290 + 2.5 66,900 + 3.5 14,468 + 1.2 6,012 - 4.1
2003 27,710 + 1.5 67,930 + 1.5 14,821 + 2.4 6,320 + 5.1
2004 28,730 + 3.7 70,180 + 3.3 15,332 + 3.5 6,402 + 1.3
2005 29,820 + 3.8 72,780 + 3.7 15,981 + 4.2 6,534 + 2.1
2006 31,330 + 5.1 76,270 + 4.8 16,543 + 3.5 6,678 + 2.2
2007 33,010 + 5.4 79,310 + 4.0 17,015 + 2.9 7,080 + 6.0
2008 33,920 + 2.8 80,370 + 1.3 17,441 + 2.5 7,335 + 3.6
2009 33,020 - 2.7 79,690 - 0.8 17,615 + 1.0 6,833 - 6.8
2010 34,140 + 3.4 82,190 + 3.1 18,197 + 3.3 7,007 + 2.5
2011 35,710 + 4.6 85,110 + 3.6 18,928 + 4.0 7,654 + 9.2
2012 36,640 + 2.6 86,770 + 2.0 19,461 + 2.8 7,861 + 2.7
2. NATIONAL ACCOUNTS
Investment* per head 2000 - 2012at current prices, %-change
*
2000 2001 2002 2003 2004 2005 2006 2007 2008 2009 2010 2011 2012
+6.6
-4.1
-0.5
+5.1
+1.3+2.1 +2.2
+6.0
+3.6
-7.2
+2.5
+9.2
+2.7
31
province
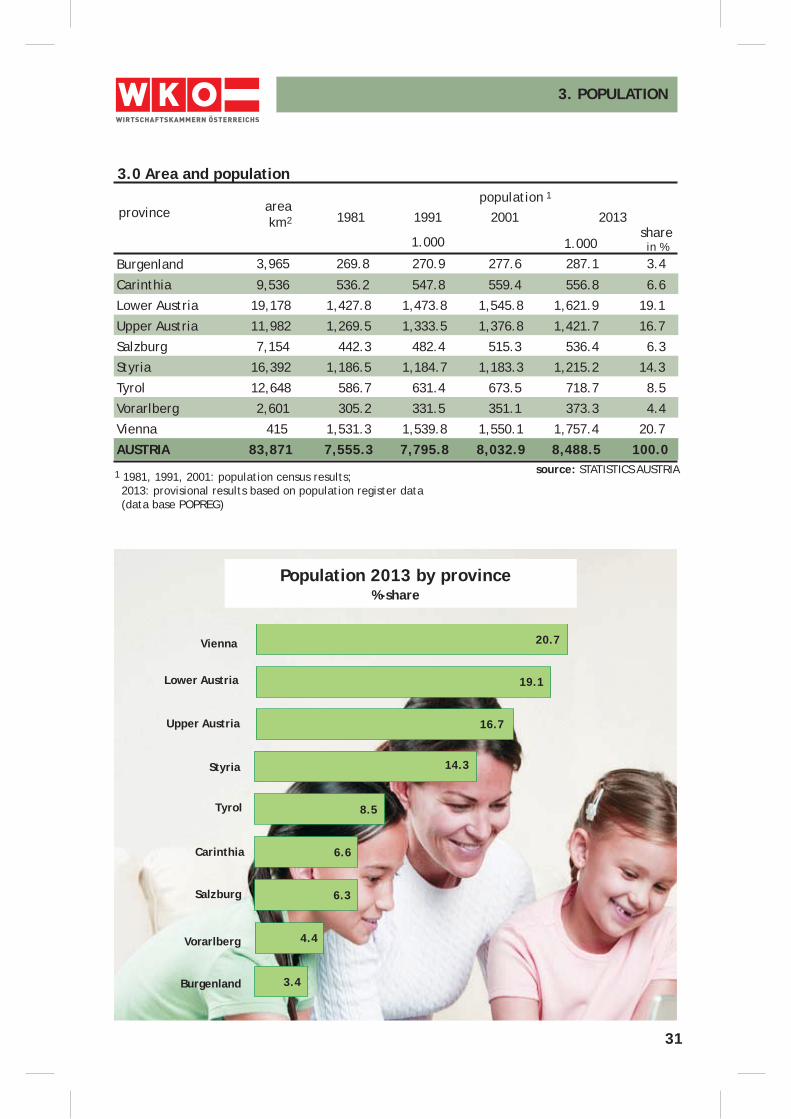
3.0 Area and population
1.000sharein %
1 1981, 1991, 2001: population census results; 2013: provisional results based on population register data (data base POPREG)
2001
3. POPULATION
Burgenland 3,965 269.8 270.9 277.6 287.1 3.4
Carinthia 9,536 536.2 547.8 559.4 556.8 6.6
Lower Austria 19,178 1,427.8 1,473.8 1,545.8 1,621.9 19.1
Upper Austria 11,982 1,269.5 1,333.5 1,376.8 1,421.7 16.7
Salzburg 7,154 442.3 482.4 515.3 536.4 6.3
Styria 16,392 1,186.5 1,184.7 1,183.3 1,215.2 14.3
Tyrol 12,648 586.7 631.4 673.5 718.7 8.5
Vorarlberg 2,601 305.2 331.5 351.1 373.3 4.4
Vienna 415 1,531.3 1,539.8 1,550.1 1,757.4 20.7
AUSTRIA 83,871 7,555.3 7,795.8 8,032.9 8,488.5 100.0
area km2
source: STATISTICS AUSTRIA
Population 2013 by province %-share
Vienna
Burgenland
Vorarlberg
Tyrol
Salzburg
Carinthia
Styria
Upper Austria
Lower Austria
population 1
1981 1991
1.000
2013
3.4
4.4
6.3
6.6
8.5
14.3
16.7
19.1
20.7
32
3. POPULATION
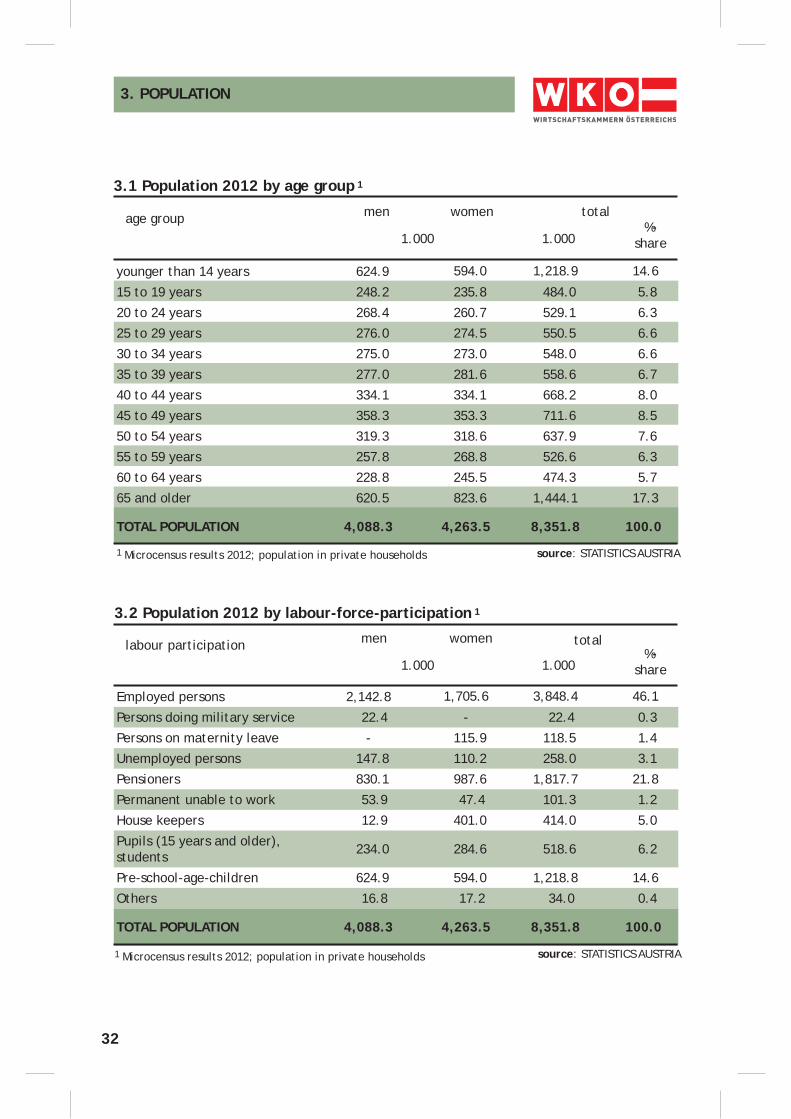
3.1 Population 2012 by age group 1
source: STATISTICS AUSTRIA1 Microcensus results 2012; population in private households
age group totalmen
1.000%-
share
younger than 14 years 624.9 594.0 1,218.9 14.6
15 to 19 years 248.2 235.8 484.0 5.8
20 to 24 years 268.4 260.7 529.1 6.3
25 to 29 years 276.0 274.5 550.5 6.6
30 to 34 years 275.0 273.0 548.0 6.6
35 to 39 years 277.0 281.6 558.6 6.7
40 to 44 years 334.1 334.1 668.2 8.0
45 to 49 years 358.3 353.3 711.6 8.5
50 to 54 years 319.3 318.6 637.9 7.6
55 to 59 years 257.8 268.8 526.6 6.3
60 to 64 years 228.8 245.5 474.3 5.7
65 and older 620.5 823.6 1,444.1 17.3
TOTAL POPULATION 4,088.3 4,263.5 8,351.8 100.0
3.2 Population 2012 by labour-force-participation 1
women
1.000
women total
source: STATISTICS AUSTRIA1 Microcensus results 2012; population in private households
labour participation men
1.000%-
share
Employed persons 2,142.8 1,705.6 3,848.4 46.1
Persons doing military service 22.4 - 22.4 0.3
Persons on maternity leave - 115.9 118.5 1.4
Unemployed persons 147.8 110.2 258.0 3.1
Pensioners 830.1 987.6 1,817.7 21.8
Permanent unable to work 53.9 47.4 101.3 1.2
House keepers 12.9 401.0 414.0 5.0
Pupils (15 years and older),students 234.0 284.6 518.6 6.2
Pre-school-age-children 624.9 594.0 1,218.8 14.6
Others 16.8 17.2 34.0 0.4
TOTAL POPULATION 4,088.3 4,263.5 8,351.8 100.0
1.000
33
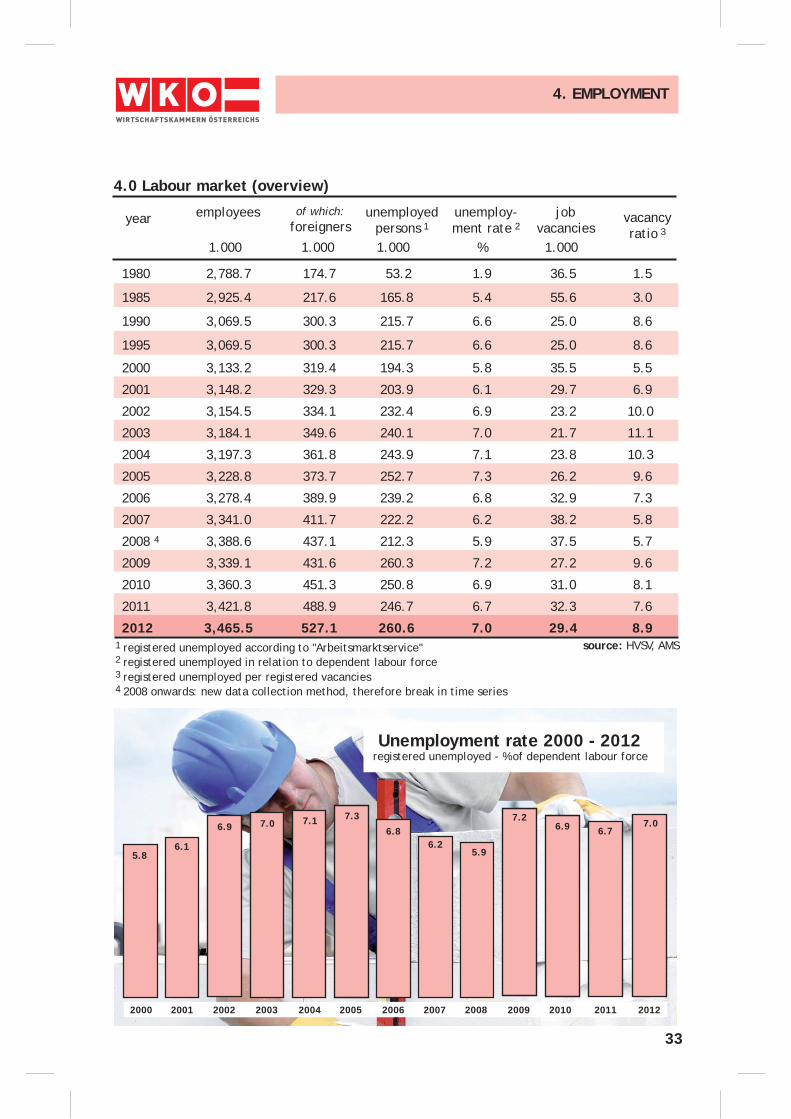
1980 2,788.7 174.7 53.2 1.9 36.5 1.5
1985 2,925.4 217.6 165.8 5.4 55.6 3.0
1990 3,069.5 300.3 215.7 6.6 25.0 8.6
1995 3,069.5 300.3 215.7 6.6 25.0 8.6
2000 3,133.2 319.4 194.3 5.8 35.5 5.5
2001 3,148.2 329.3 203.9 6.1 29.7 6.9
2002 3,154.5 334.1 232.4 6.9 23.2 10.0
2003 3,184.1 349.6 240.1 7.0 21.7 11.1
2004 3,197.3 361.8 243.9 7.1 23.8 10.3
2005 3,228.8 373.7 252.7 7.3 26.2 9.6
2006 3,278.4 389.9 239.2 6.8 32.9 7.3
2007 3,341.0 411.7 222.2 6.2 38.2 5.8
2008 4 3,388.6 437.1 212.3 5.9 37.5 5.7
2009 3,339.1 431.6 260.3 7.2 27.2 9.6
2010 3,360.3 451.3 250.8 6.9 31.0 8.1
2011 3,421.8 488.9 246.7 6.7 32.3 7.6
2012 3,465.5 527.1 260.6 7.0 29.4 8.9
4. EMPLOYMENT
4.0 Labour market (overview)
year employees
1.000 % 1.000
of which:foreigners
unemployedpersons 1
unemploy-ment rate 2
jobvacancies
vacancyratio 3
1.0001.000
2 registered unemployed in relation to dependent labour force
1 registered unemployed according to "Arbeitsmarktservice"
3 registered unemployed per registered vacancies
source: HVSV, AMS
Unemployment rate 2000 - 2012 registered unemployed - % of dependent labour force
4 2008 onwards: new data collection method, therefore break in time series
2000 2001 2002 2003 2004 2005 2006 2007 2008 2009 2010
5.86.1
6.9 7.0 7.1 7.3
6.25.9
7.26.9 6.76.8
2011 2012
7.0
34
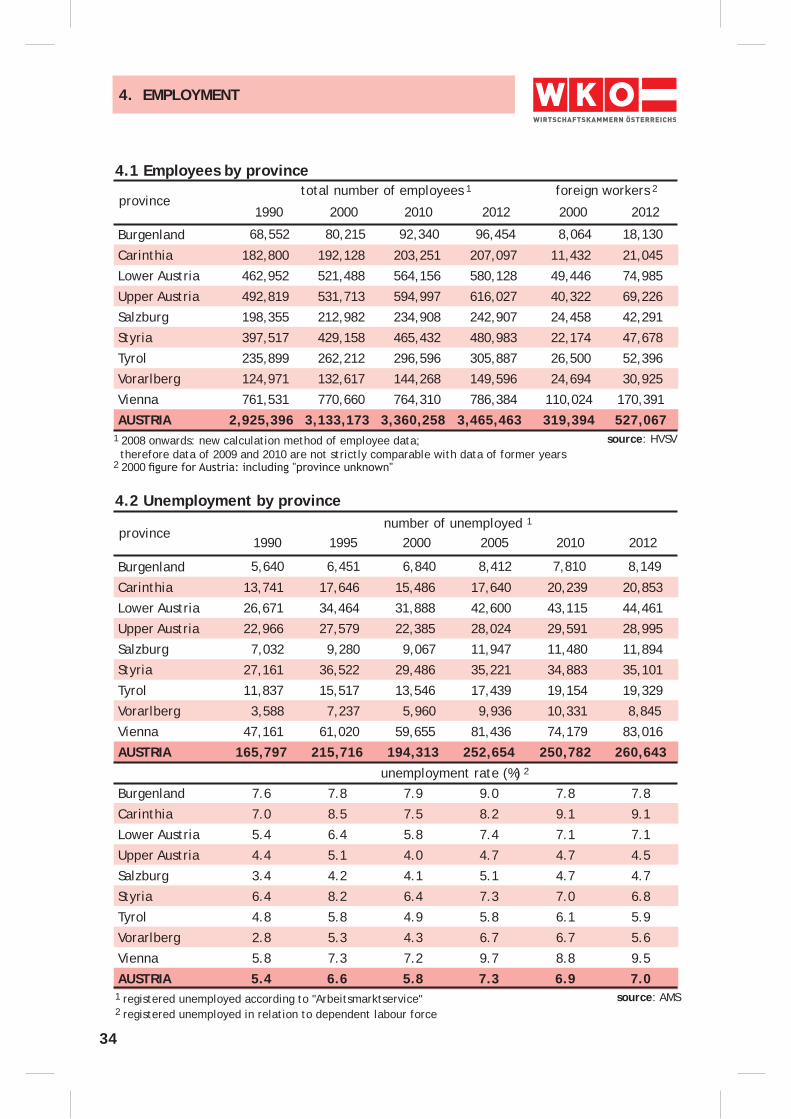
Burgenland 68,552 80,215 92,340 96,454 8,064 18,130
Carinthia 182,800 192,128 203,251 207,097 11,432 21,045
Lower Austria 462,952 521,488 564,156 580,128 49,446 74,985
Upper Austria 492,819 531,713 594,997 616,027 40,322 69,226
Salzburg 198,355 212,982 234,908 242,907 24,458 42,291
Styria 397,517 429,158 465,432 480,983 22,174 47,678
Tyrol 235,899 262,212 296,596 305,887 26,500 52,396
Vorarlberg 124,971 132,617 144,268 149,596 24,694 30,925
Vienna 761,531 770,660 764,310 786,384 110,024 170,391
AUSTRIA 2,925,396 3,133,173 3,360,258 3,465,463 319,394 527,067
4.1 Employees by province
provincetotal number of employees 1
2000 2012
4. EMPLOYMENT
1990 2010
source: HVSV
2000 2012
foreign workers 2
Burgenland 5,640 6,451 6,840 8,412 7,810 8,149
Carinthia 13,741 17,646 15,486 17,640 20,239 20,853
Lower Austria 26,671 34,464 31,888 42,600 43,115 44,461
Upper Austria 22,966 27,579 22,385 28,024 29,591 28,995
Salzburg 7,032 9,280 9,067 11,947 11,480 11,894
Styria 27,161 36,522 29,486 35,221 34,883 35,101
Tyrol 11,837 15,517 13,546 17,439 19,154 19,329
Vorarlberg 3,588 7,237 5,960 9,936 10,331 8,845
Vienna 47,161 61,020 59,655 81,436 74,179 83,016
AUSTRIA 165,797 215,716 194,313 252,654 250,782 260,643
Burgenland 7.6 7.8 7.9 9.0 7.8 7.8
Carinthia 7.0 8.5 7.5 8.2 9.1 9.1
Lower Austria 5.4 6.4 5.8 7.4 7.1 7.1
Upper Austria 4.4 5.1 4.0 4.7 4.7 4.5
Salzburg 3.4 4.2 4.1 5.1 4.7 4.7
Styria 6.4 8.2 6.4 7.3 7.0 6.8
Tyrol 4.8 5.8 4.9 5.8 6.1 5.9
Vorarlberg 2.8 5.3 4.3 6.7 6.7 5.6
Vienna 5.8 7.3 7.2 9.7 8.8 9.5
AUSTRIA 5.4 6.6 5.8 7.3 6.9 7.01 registered unemployed according to "Arbeitsmarktservice"2 registered unemployed in relation to dependent labour force
source: AMS
4.2 Unemployment by provincenumber of unemployed 1
1995 2005 1990 2000 2010 2012
unemployment rate (%) 2
1 2008 onwards: new calculation method of employee data; therefore data of 2009 and 2010 are not strictly comparable with data of former years2 2000
province
35
4. EMPLOYMENT
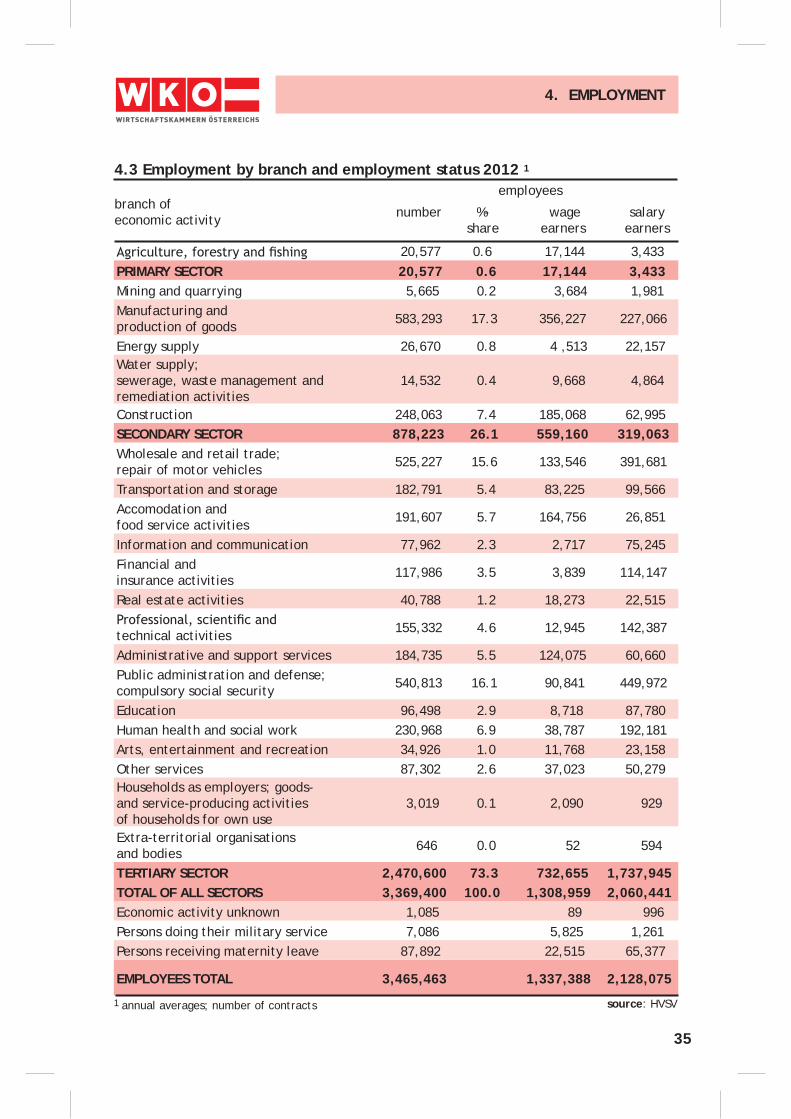
4.3 Employment by branch and employment status 2012 1
branch of economic activity %-
sharenumber
employees
wageearners
salaryearners
1 annual averages; number of contracts source: HVSV
20,577 0.6 17,144 3,433PRIMARY SECTOR 20,577 0.6 17,144 3,433Mining and quarrying 5,665 0.2 3,684 1,981Manufacturing and production of goods 583,293 17.3 356,227 227,066
Energy supply 26,670 0.8 4 ,513 22,157Water supply; sewerage, waste management andremediation activities
14,532 0.4 9,668 4,864
Construction 248,063 7.4 185,068 62,995SECONDARY SECTOR 878,223 26.1 559,160 319,063Wholesale and retail trade;repair of motor vehicles 525,227 15.6 133,546 391,681
Transportation and storage 182,791 5.4 83,225 99,566Accomodation and food service activities 191,607 5.7 164,756 26,851
Information and communication 77,962 2.3 2,717 75,245Financial andinsurance activities 117,986 3.5 3,839 114,147
Real estate activities 40,788 1.2 18,273 22,515
technical activities 155,332 4.6 12,945 142,387
Administrative and support services 184,735 5.5 124,075 60,660Public administration and defense;compulsory social security 540,813 16.1 90,841 449,972
Education 96,498 2.9 8,718 87,780Human health and social work 230,968 6.9 38,787 192,181Arts, entertainment and recreation 34,926 1.0 11,768 23,158Other services 87,302 2.6 37,023 50,279Households as employers; goods- and service-producing activitiesof households for own use
3,019 0.1 2,090 929
Extra-territorial organisationsand bodies 646 0.0 52 594
TERTIARY SECTOR 2,470,600 73.3 732,655 1,737,945TOTAL OF ALL SECTORS 3,369,400 100.0 1,308,959 2,060,441Economic activity unknown 1,085 89 996Persons doing their military service 7,086 5,825 1,261Persons receiving maternity leave 87,892 22,515 65,377
EMPLOYEES TOTAL 3,465,463 1,337,388 2,128,075
36
4. EMPLOYMENT
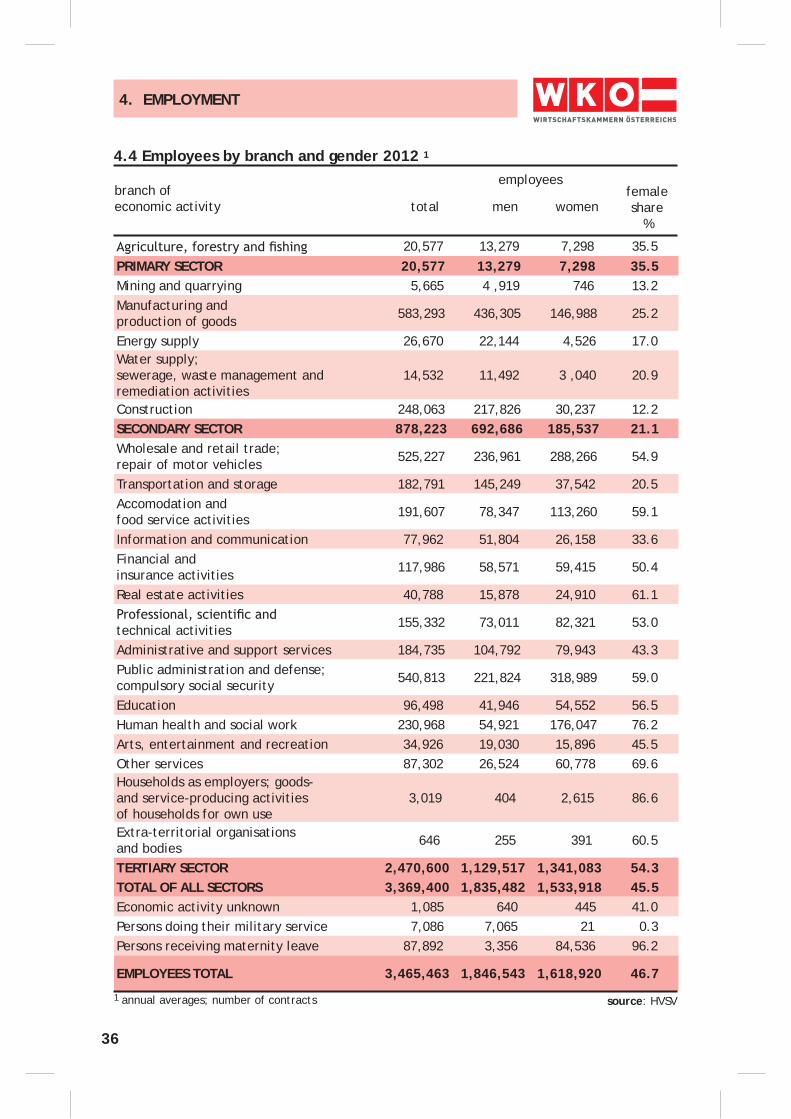
4.4 Employees by branch and gender 2012 1
branch of economic activity men total
employees
womenfemaleshare
%
source: HVSV
20,577 13,279 7,298 35.5PRIMARY SECTOR 20,577 13,279 7,298 35.5Mining and quarrying 5,665 4 ,919 746 13.2Manufacturing and production of goods 583,293 436,305 146,988 25.2
Energy supply 26,670 22,144 4,526 17.0Water supply; sewerage, waste management andremediation activities
14,532 11,492 3 ,040 20.9
Construction 248,063 217,826 30,237 12.2SECONDARY SECTOR 878,223 692,686 185,537 21.1Wholesale and retail trade;repair of motor vehicles 525,227 236,961 288,266 54.9
Transportation and storage 182,791 145,249 37,542 20.5Accomodation and food service activities 191,607 78,347 113,260 59.1
Information and communication 77,962 51,804 26,158 33.6Financial andinsurance activities 117,986 58,571 59,415 50.4
Real estate activities 40,788 15,878 24,910 61.1
technical activities 155,332 73,011 82,321 53.0
Administrative and support services 184,735 104,792 79,943 43.3Public administration and defense;compulsory social security 540,813 221,824 318,989 59.0
Education 96,498 41,946 54,552 56.5Human health and social work 230,968 54,921 176,047 76.2Arts, entertainment and recreation 34,926 19,030 15,896 45.5Other services 87,302 26,524 60,778 69.6Households as employers; goods- and service-producing activitiesof households for own use
3,019 404 2,615 86.6
Extra-territorial organisationsand bodies 646 255 391 60.5
TERTIARY SECTOR 2,470,600 1,129,517 1,341,083 54.3TOTAL OF ALL SECTORS 3,369,400 1,835,482 1,533,918 45.5Economic activity unknown 1,085 640 445 41.0Persons doing their military service 7,086 7,065 21 0.3Persons receiving maternity leave 87,892 3,356 84,536 96.2
EMPLOYEES TOTAL 3,465,463 1,846,543 1,618,920 46.7
1 annual averages; number of contracts
37
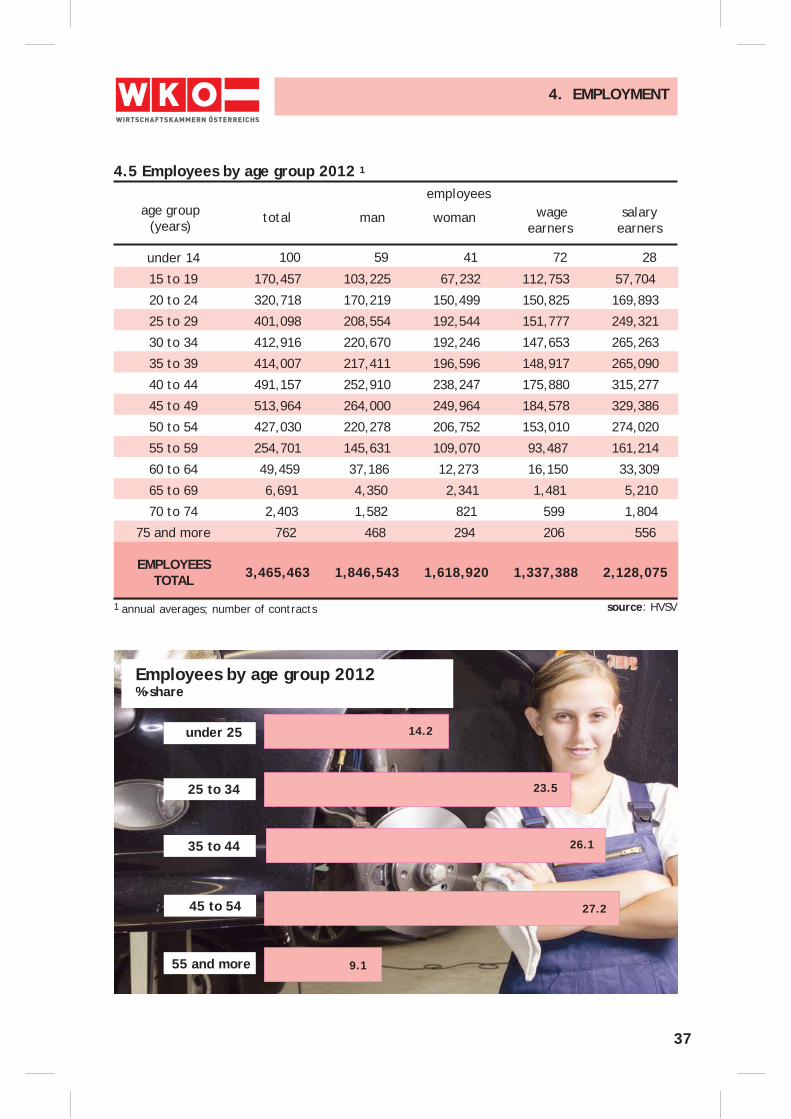
4. EMPLOYMENT
under 14 100 59 41 72 28
15 to 19 170,457 103,225 67,232 112,753 57,704
20 to 24 320,718 170,219 150,499 150,825 169,893
25 to 29 401,098 208,554 192,544 151,777 249,321
30 to 34 412,916 220,670 192,246 147,653 265,263
35 to 39 414,007 217,411 196,596 148,917 265,090
40 to 44 491,157 252,910 238,247 175,880 315,277
45 to 49 513,964 264,000 249,964 184,578 329,386
50 to 54 427,030 220,278 206,752 153,010 274,020
55 to 59 254,701 145,631 109,070 93,487 161,214
60 to 64 49,459 37,186 12,273 16,150 33,309
65 to 69 6,691 4,350 2,341 1,481 5,210
70 to 74 2,403 1,582 821 599 1,804
75 and more 762 468 294 206 556
EMPLOYEESTOTAL 3,465,463 1,846,543 1,618,920 1,337,388 2,128,075
4.5 Employees by age group 2012 1
employees
total man woman wageearners
salary earners
1 annual averages; number of contracts source: HVSV
Employees by age group 2012 %-share
under 25
55 and more
45 to 54
35 to 44
25 to 34
age group (years)
14.2
9.1
27.2
26.1
23.5
38
4. EMPLOYMENT
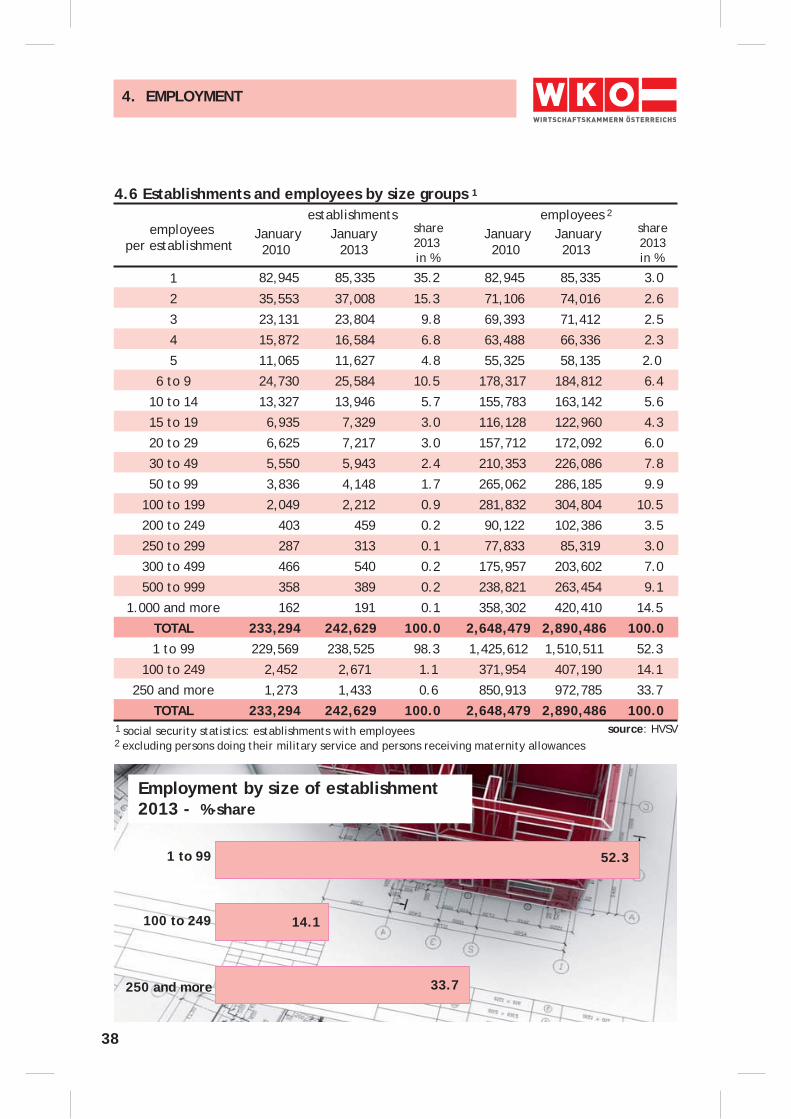
1 82,945 85,335 35.2 82,945 85,335 3.0
2 35,553 37,008 15.3 71,106 74,016 2.6
3 23,131 23,804 9.8 69,393 71,412 2.5
4 15,872 16,584 6.8 63,488 66,336 2.3
5 11,065 11,627 4.8 55,325 58,135 2.0
6 to 9 24,730 25,584 10.5 178,317 184,812 6.4
10 to 14 13,327 13,946 5.7 155,783 163,142 5.6
15 to 19 6,935 7,329 3.0 116,128 122,960 4.3
20 to 29 6,625 7,217 3.0 157,712 172,092 6.0
30 to 49 5,550 5,943 2.4 210,353 226,086 7.8
50 to 99 3,836 4,148 1.7 265,062 286,185 9.9
100 to 199 2,049 2,212 0.9 281,832 304,804 10.5
200 to 249 403 459 0.2 90,122 102,386 3.5
250 to 299 287 313 0.1 77,833 85,319 3.0
300 to 499 466 540 0.2 175,957 203,602 7.0
500 to 999 358 389 0.2 238,821 263,454 9.1
1.000 and more 162 191 0.1 358,302 420,410 14.5
TOTAL 233,294 242,629 100.0 2,648,479 2,890,486 100.01 to 99 229,569 238,525 98.3 1,425,612 1,510,511 52.3
100 to 249 2,452 2,671 1.1 371,954 407,190 14.1
250 and more 1,273 1,433 0.6 850,913 972,785 33.7
TOTAL 233,294 242,629 100.0 2,648,479 2,890,486 100.0
4.6 Establishments and employees by size groups 1establishments
January2010
share2013in %
1 social security statistics: establishments with employees source: HVSV2 excluding persons doing their military service and persons receiving maternity allowances
employeesper establishment
employees 2
January2013
January2010
January2013
share 2013in %
Employment by size of establishment2013 - %-share
1 to 99
100 to 249
250 and more
52.3
14.1
33.7
39
4. EMPLOYMENT
1980 256,000 227,600 3,262,800 14.8 7.7
1985 230,800 211,300 3,201,800 13.8 7.2
1990 185,700 224,600 3,344,600 12.3 7.2
1991 174,400 225,300 3,407,100 11.7 7.1
1992 162,200 228,900 3,457,000 11.3 7.0
1993 152,100 229,900 3,446,000 11.1 7.1
1994 142,800 230,600 3,451,800 10.8 7.1
1995 133,800 230,800 3,432,800 10.6 7.1
1996 126,100 234,100 3,407,500 10.6 7.2
1997 121,900 239,900 3,417,400 10.6 7.3
1998 118,300 246,800 3,441,000 10.6 7.5
1999 114,600 254,600 3,475,300 10.6 7.6
2000 110,200 262,800 3,506,200 10.6 7.8
2001 4 135,800 245,300 3,529,277 10.8 7.3
2002 132,800 252,300 3,539,612 10.9 7.5
2003 129,900 261,100 3,575,117 10.9 7.6
2004 126,500 269,900 3,593,650 11.0 7.8
2005 122,800 279,100 3,630,677 11.1 8.0
2006 119,200 287,300 3,684,944 11.0 8.1
2007 115,600 290,100 3,746,699 10.8 8.1
2008 112,100 304,000 3,804,732 10.9 8.3
2009 108,600 312,000 3,759,664 11.2 8.6
2010 105,200 322,300 3,787,758 11.3 8.8
2011 101,800 332,800 3,856,355 11.3 8.9
2012 98,400 341,100 3,904,963 11.3 9.0
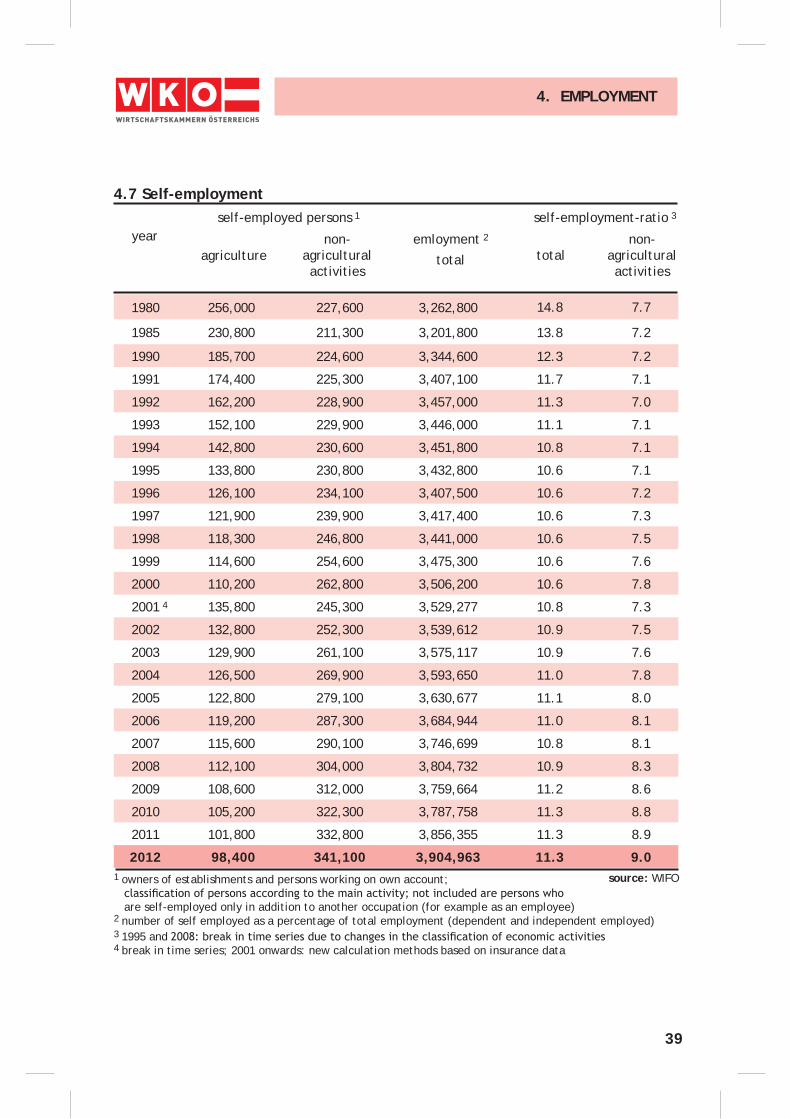
4.7 Self-employment
yearagriculture
non-agriculturalactivities
total total
2 number of self employed as a percentage of total employment (dependent and independent employed)
1 owners of establishments and persons working on own account;
are self-employed only in addition to another occupation (for example as an employee)
4 break in time series; 2001 onwards: new calculation methods based on insurance data
source: WIFO
self-employed persons 1 self-employment-ratio 3
emloyment 2 non-agriculturalactivities
3 1995 and
40
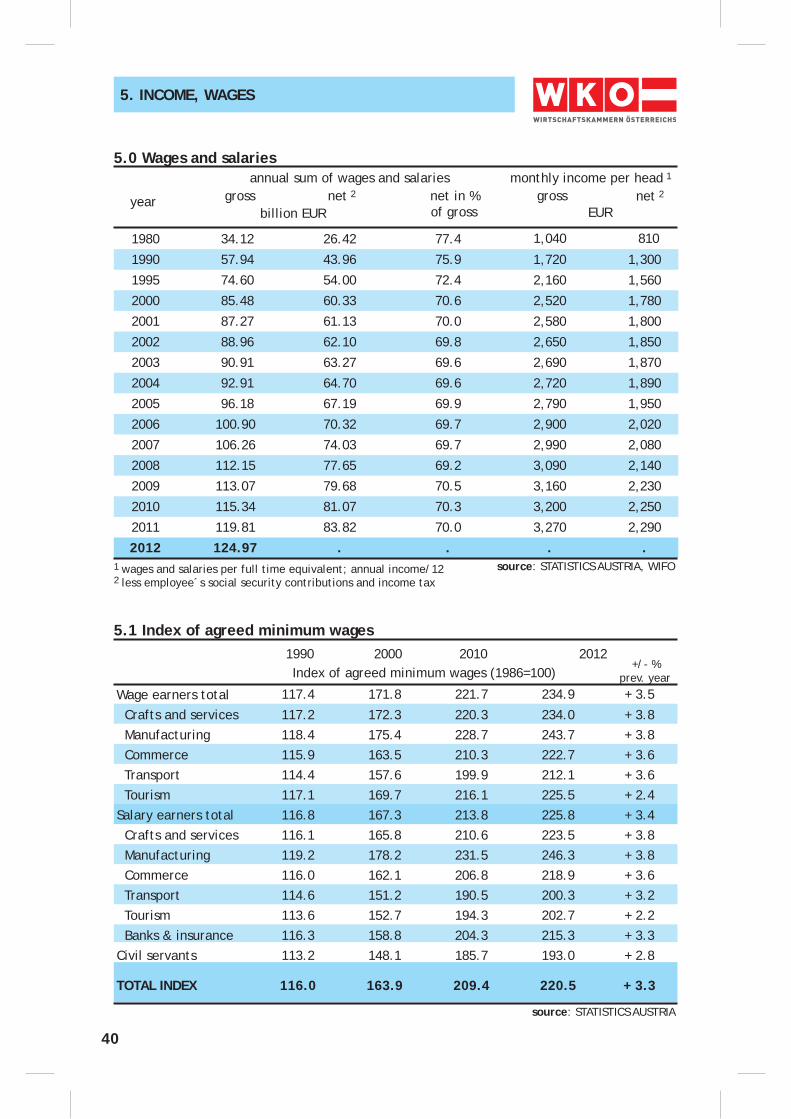
5. INCOME, WAGES
5.0 Wages and salaries
year
annual sum of wages and salaries gross net 2
5.1 Index of agreed minimum wages
Index of agreed minimum wages (1986=100) 2000 2010 1990 2012
+/- % prev. year
source: STATISTICS AUSTRIA
net in %of gross EURbillion EUR
gross net 2
monthly income per head 1
1980 34.12 26.42 77.4 1,040 810
1990 57.94 43.96 75.9 1,720 1,300
1995 74.60 54.00 72.4 2,160 1,560
2000 85.48 60.33 70.6 2,520 1,780
2001 87.27 61.13 70.0 2,580 1,800
2002 88.96 62.10 69.8 2,650 1,850
2003 90.91 63.27 69.6 2,690 1,870
2004 92.91 64.70 69.6 2,720 1,890
2005 96.18 67.19 69.9 2,790 1,950
2006 100.90 70.32 69.7 2,900 2,020
2007 106.26 74.03 69.7 2,990 2,080
2008 112.15 77.65 69.2 3,090 2,140
2009 113.07 79.68 70.5 3,160 2,230
2010 115.34 81.07 70.3 3,200 2,250
2011 119.81 83.82 70.0 3,270 2,290
2012 124.97 . . . .1 wages and salaries per full time equivalent; annual income/12 source: STATISTICS AUSTRIA, WIFO2 less employee´s social security contributions and income tax
Wage earners total 117.4 171.8 221.7 234.9 + 3.5
Crafts and services 117.2 172.3 220.3 234.0 + 3.8 Manufacturing 118.4 175.4 228.7 243.7 + 3.8 Commerce 115.9 163.5 210.3 222.7 + 3.6 Transport 114.4 157.6 199.9 212.1 + 3.6 Tourism 117.1 169.7 216.1 225.5 + 2.4Salary earners total 116.8 167.3 213.8 225.8 + 3.4 Crafts and services 116.1 165.8 210.6 223.5 + 3.8 Manufacturing 119.2 178.2 231.5 246.3 + 3.8 Commerce 116.0 162.1 206.8 218.9 + 3.6 Transport 114.6 151.2 190.5 200.3 + 3.2 Tourism 113.6 152.7 194.3 202.7 + 2.2 Banks & insurance 116.3 158.8 204.3 215.3 + 3.3Civil servants 113.2 148.1 185.7 193.0 + 2.8
TOTAL INDEX 116.0 163.9 209.4 220.5 + 3.3
41
5. INCOME, WAGES
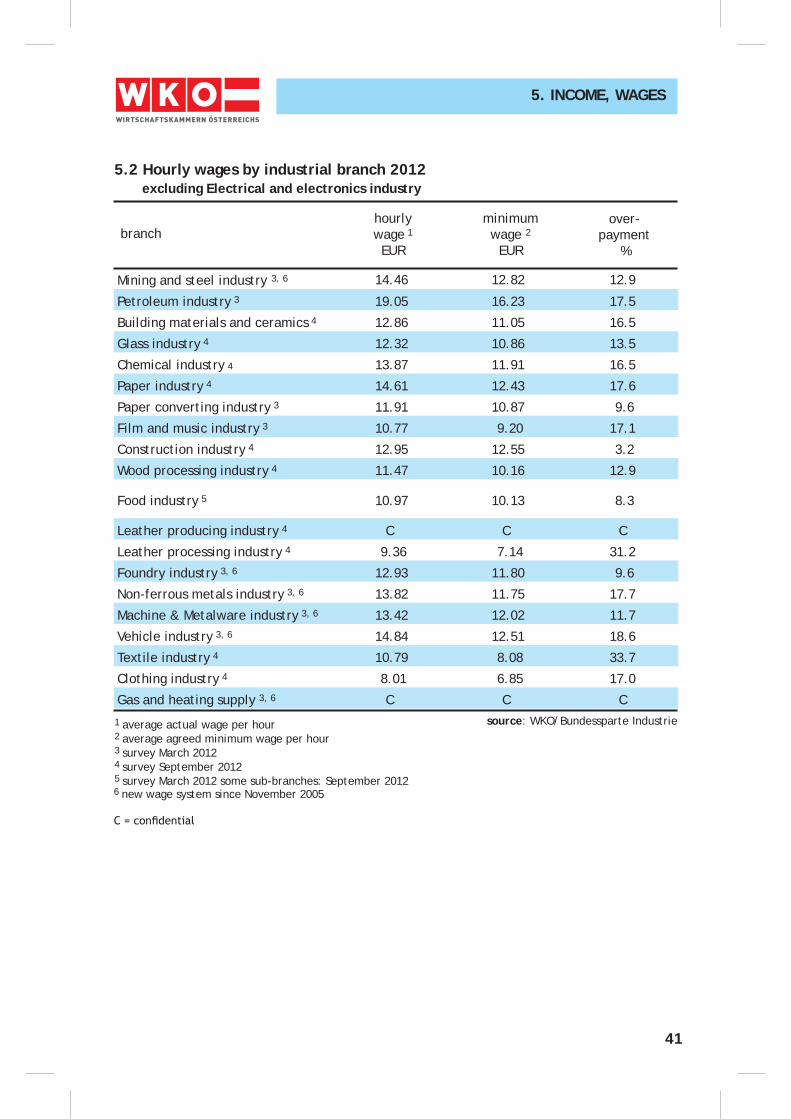
5.2 Hourly wages by industrial branch 2012 excluding Electrical and electronics industry
branch
source: WKO/Bundessparte Industrie
Mining and steel industry 3, 6 14.46 12.82 12.9
Petroleum industry 3 19.05 16.23 17.5
Building materials and ceramics 4 12.86 11.05 16.5
Glass industry 4 12.32 10.86 13.5
Chemical industry 4 13.87 11.91 16.5
Paper industry 4 14.61 12.43 17.6
Paper converting industry 3 11.91 10.87 9.6
Film and music industry 3 10.77 9.20 17.1
Construction industry 4 12.95 12.55 3.2
Wood processing industry 4 11.47 10.16 12.9
Food industry 5 10.97 10.13 8.3
Leather producing industry 4 C C C
Leather processing industry 4 9.36 7.14 31.2
Foundry industry 3, 6 12.93 11.80 9.6
Non-ferrous metals industry 3, 6 13.82 11.75 17.7
Machine & Metalware industry 3, 6 13.42 12.02 11.7
Vehicle industry 3, 6 14.84 12.51 18.6
Textile industry 4 10.79 8.08 33.7
Clothing industry 4 8.01 6.85 17.0
Gas and heating supply 3, 6 C C C
2 average agreed minimum wage per hour3 survey March 20124 survey September 20125 survey March 2012 some sub-branches: September 2012
1 average actual wage per hour
6 new wage system since November 2005
minimum wage 2
EUR
hourlywage 1
EUR
over-payment
%
42
5. INCOME, WAGES
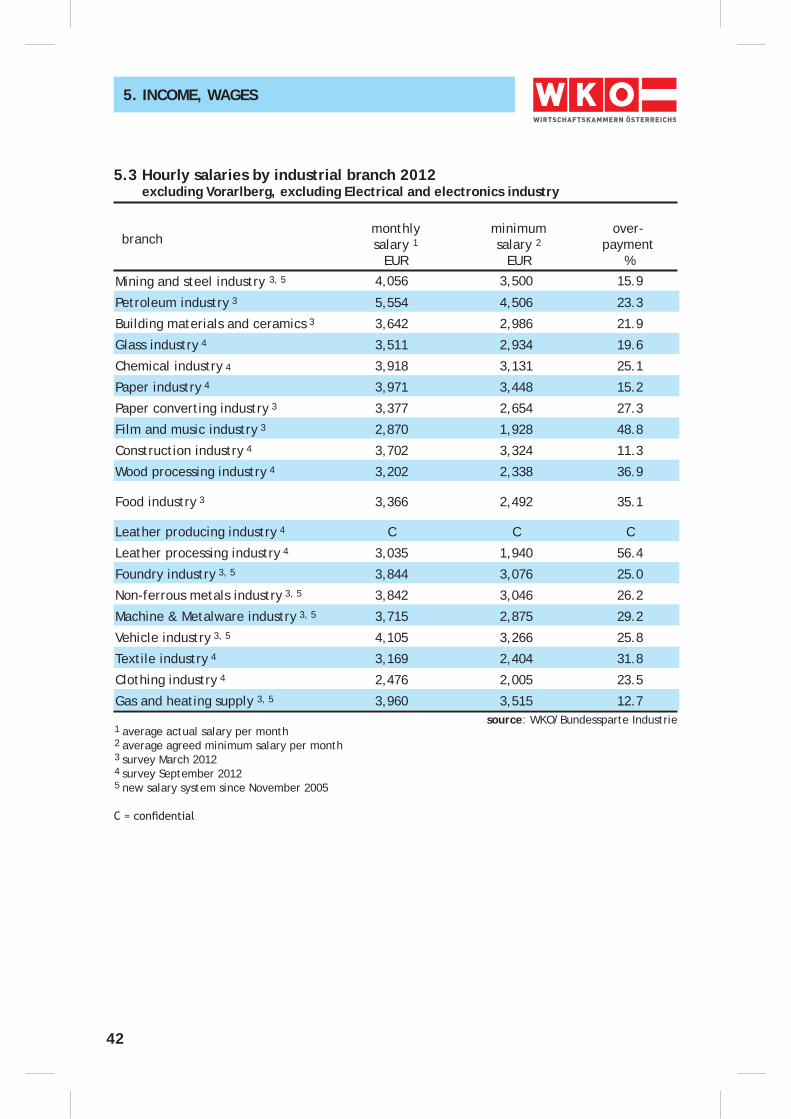
5.3 Hourly salaries by industrial branch 2012 excluding Vorarlberg, excluding Electrical and electronics industry
Mining and steel industry 3, 5 4,056 3,500 15.9
Petroleum industry 3 5,554 4,506 23.3
Building materials and ceramics 3 3,642 2,986 21.9
Glass industry 4 3,511 2,934 19.6
Chemical industry 4 3,918 3,131 25.1
Paper industry 4 3,971 3,448 15.2
Paper converting industry 3 3,377 2,654 27.3
Film and music industry 3 2,870 1,928 48.8
Construction industry 4 3,702 3,324 11.3
Wood processing industry 4 3,202 2,338 36.9
Food industry 3 3,366 2,492 35.1
Leather producing industry 4 C C C
Leather processing industry 4 3,035 1,940 56.4
Foundry industry 3, 5 3,844 3,076 25.0
Non-ferrous metals industry 3, 5 3,842 3,046 26.2
Machine & Metalware industry 3, 5 3,715 2,875 29.2
Vehicle industry 3, 5 4,105 3,266 25.8
Textile industry 4 3,169 2,404 31.8
Clothing industry 4 2,476 2,005 23.5
Gas and heating supply 3, 5 3,960 3,515 12.7
branchminimum salary 2
EUR
monthlysalary 1
EUR
over-payment
%
source: WKO/Bundessparte Industrie
2 average agreed minimum salary per month3 survey March 20124 survey September 20125 new salary system since November 2005
1 average actual salary per month
43
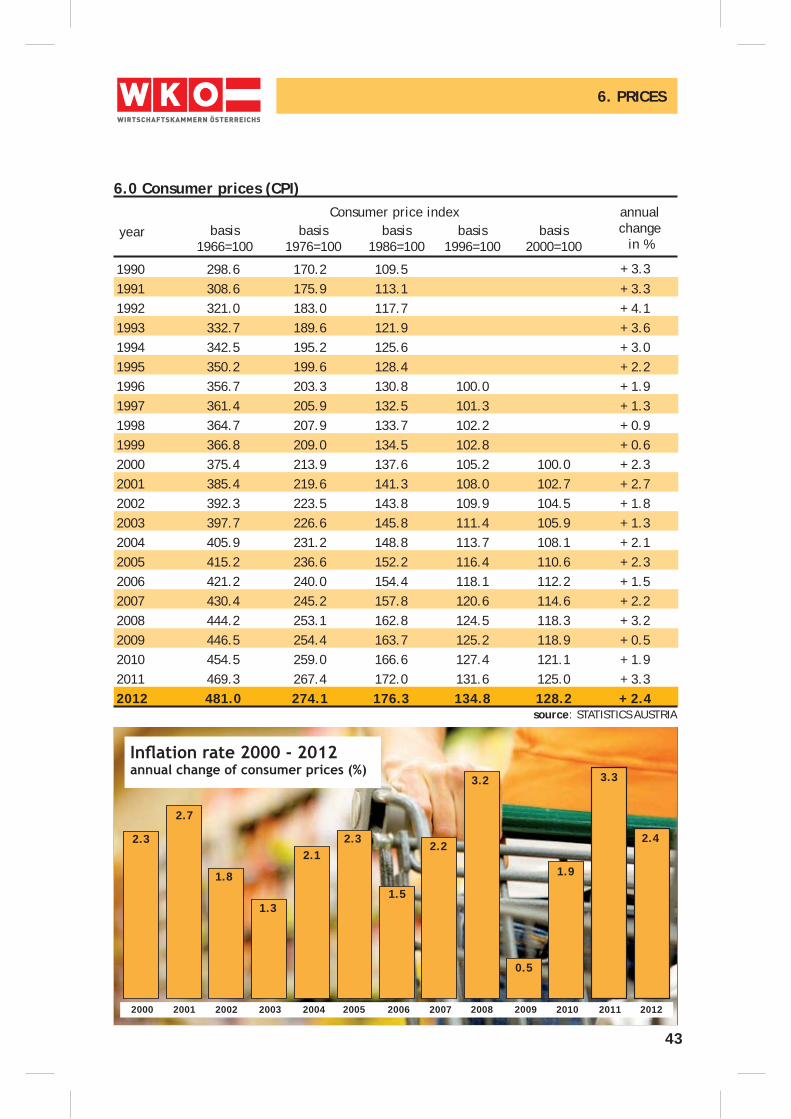
1990 298.6 170.2 109.5 + 3.31991 308.6 175.9 113.1 + 3.31992 321.0 183.0 117.7 + 4.11993 332.7 189.6 121.9 + 3.61994 342.5 195.2 125.6 + 3.01995 350.2 199.6 128.4 + 2.21996 356.7 203.3 130.8 100.0 + 1.91997 361.4 205.9 132.5 101.3 + 1.31998 364.7 207.9 133.7 102.2 + 0.91999 366.8 209.0 134.5 102.8 + 0.62000 375.4 213.9 137.6 105.2 100.0 + 2.32001 385.4 219.6 141.3 108.0 102.7 + 2.72002 392.3 223.5 143.8 109.9 104.5 + 1.82003 397.7 226.6 145.8 111.4 105.9 + 1.32004 405.9 231.2 148.8 113.7 108.1 + 2.12005 415.2 236.6 152.2 116.4 110.6 + 2.32006 421.2 240.0 154.4 118.1 112.2 + 1.52007 430.4 245.2 157.8 120.6 114.6 + 2.22008 444.2 253.1 162.8 124.5 118.3 + 3.22009 446.5 254.4 163.7 125.2 118.9 + 0.52010 454.5 259.0 166.6 127.4 121.1 + 1.92011 469.3 267.4 172.0 131.6 125.0 + 3.32012 481.0 274.1 176.3 134.8 128.2 + 2.4
6.0 Consumer prices (CPI)
year basis1966=100
basis1976=100
basis1986=100
basis1996=100
basis2000=100
annualchange
in %
source: STATISTICS AUSTRIA
6. PRICES
Consumer price index
2000 2001 2002 2003 2004 2005 2006 2007 2008 2009
2.3
2.7
1.8
2.12.3
1.5
2.2
3.2
0.5
1.3
1.9
2010 2011
3.3
2012
2.4
44
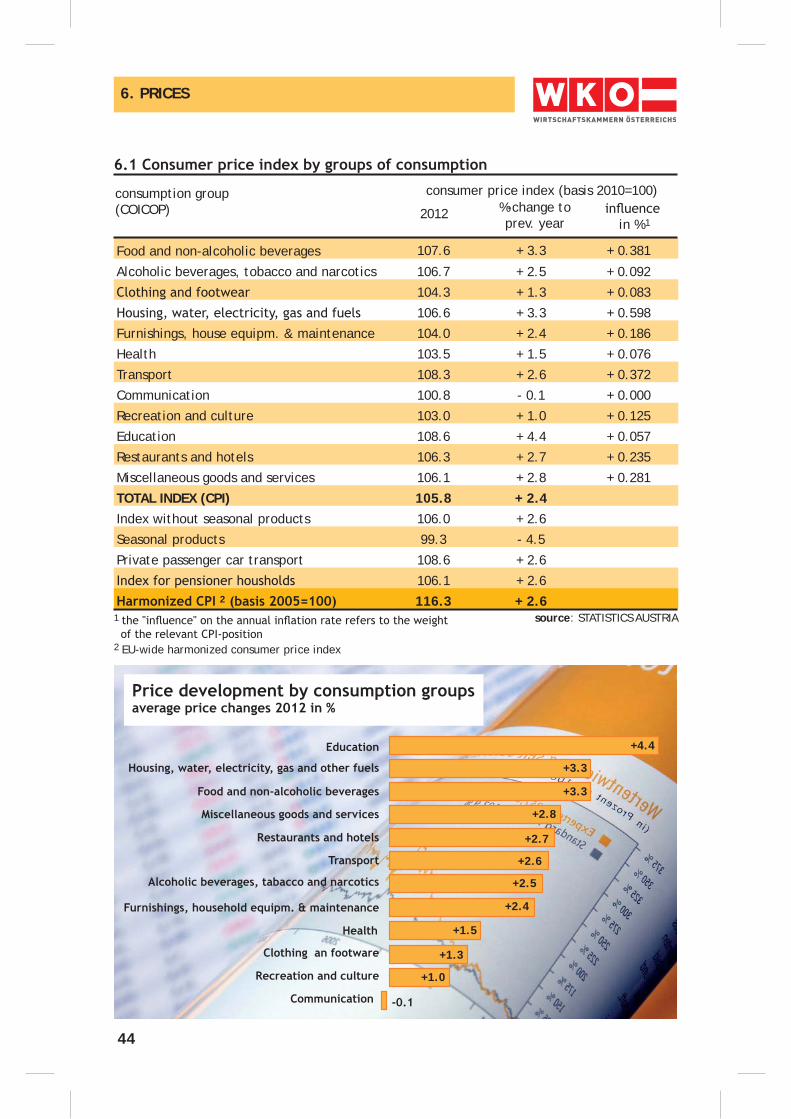
consumption group(COICOP)
consumer price index (basis 2010=100)
source: STATISTICS AUSTRIA
2 EU-wide harmonized consumer price index
2012 %-change toprev. year in % 1
6. PRICES
1
Food and non-alcoholic beverages 107.6 + 3.3 + 0.381
Alcoholic beverages, tobacco and narcotics 106.7 + 2.5 + 0.092
104.3 + 1.3 + 0.083
106.6 + 3.3 + 0.598
Furnishings, house equipm. & maintenance 104.0 + 2.4 + 0.186
Health 103.5 + 1.5 + 0.076
Transport 108.3 + 2.6 + 0.372
Communication 100.8 - 0.1 + 0.000
Recreation and culture 103.0 + 1.0 + 0.125
Education 108.6 + 4.4 + 0.057
Restaurants and hotels 106.3 + 2.7 + 0.235
Miscellaneous goods and services 106.1 + 2.8 + 0.281
TOTAL INDEX (CPI) 105.8 + 2.4Index without seasonal products 106.0 + 2.6
Seasonal products 99.3 - 4.5
Private passenger car transport 108.6 + 2.6
106.1 + 2.6 2 116.3 + 2.6
+4.4
+1.0
+1.5
+2.5
+2.4
+2.6
+2.7
+2.8
+3.3
+3.3
+1.3
45
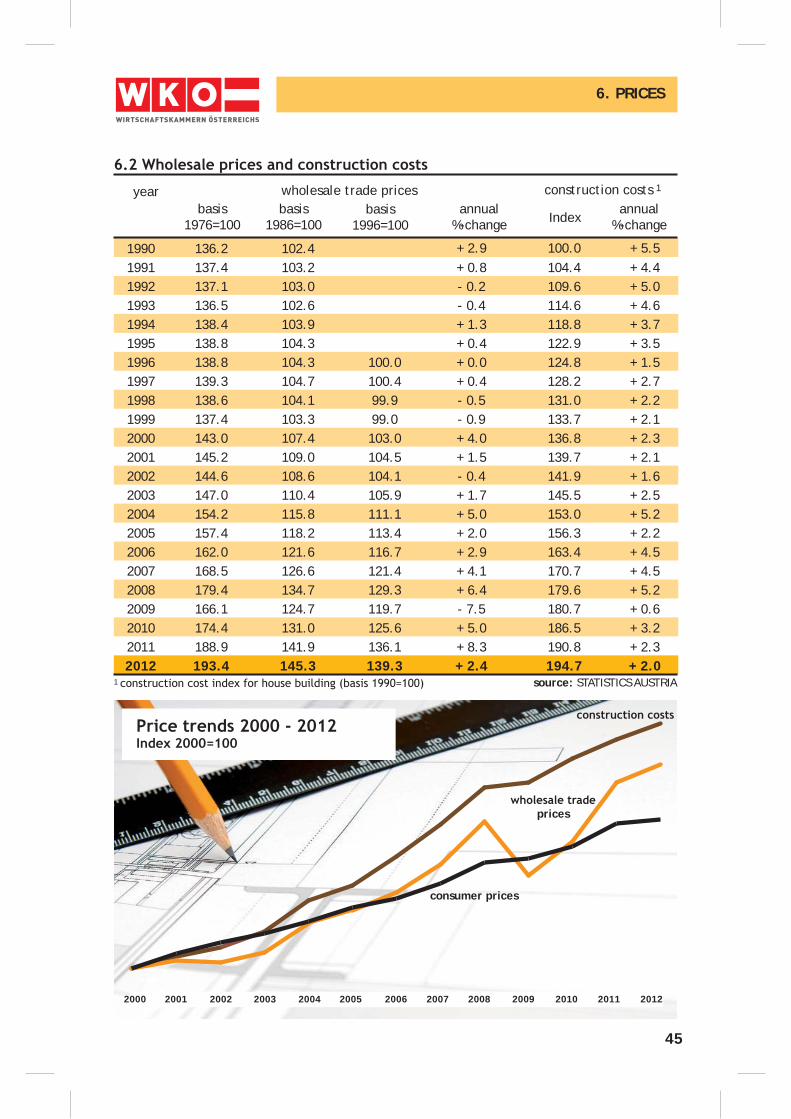
1990 136.2 102.4 + 2.9 100.0 + 5.51991 137.4 103.2 + 0.8 104.4 + 4.41992 137.1 103.0 - 0.2 109.6 + 5.01993 136.5 102.6 - 0.4 114.6 + 4.61994 138.4 103.9 + 1.3 118.8 + 3.71995 138.8 104.3 + 0.4 122.9 + 3.51996 138.8 104.3 100.0 + 0.0 124.8 + 1.51997 139.3 104.7 100.4 + 0.4 128.2 + 2.71998 138.6 104.1 99.9 - 0.5 131.0 + 2.21999 137.4 103.3 99.0 - 0.9 133.7 + 2.12000 143.0 107.4 103.0 + 4.0 136.8 + 2.32001 145.2 109.0 104.5 + 1.5 139.7 + 2.12002 144.6 108.6 104.1 - 0.4 141.9 + 1.62003 147.0 110.4 105.9 + 1.7 145.5 + 2.52004 154.2 115.8 111.1 + 5.0 153.0 + 5.22005 157.4 118.2 113.4 + 2.0 156.3 + 2.22006 162.0 121.6 116.7 + 2.9 163.4 + 4.52007 168.5 126.6 121.4 + 4.1 170.7 + 4.52008 179.4 134.7 129.3 + 6.4 179.6 + 5.22009 166.1 124.7 119.7 - 7.5 180.7 + 0.62010 174.4 131.0 125.6 + 5.0 186.5 + 3.22011 188.9 141.9 136.1 + 8.3 190.8 + 2.32012 193.4 145.3 139.3 + 2.4 194.7 + 2.0
year
source: STATISTICS AUSTRIA
6. PRICES
1
basis1976=100
basis1986=100
basis1996=100 Index
annual%-change
wholesale trade prices construction costs 1
annual%-change
prices
consumer prices
20112000 2001 2002 2003 2004 2005 2006 2007 2008 2009 2010 2012
46
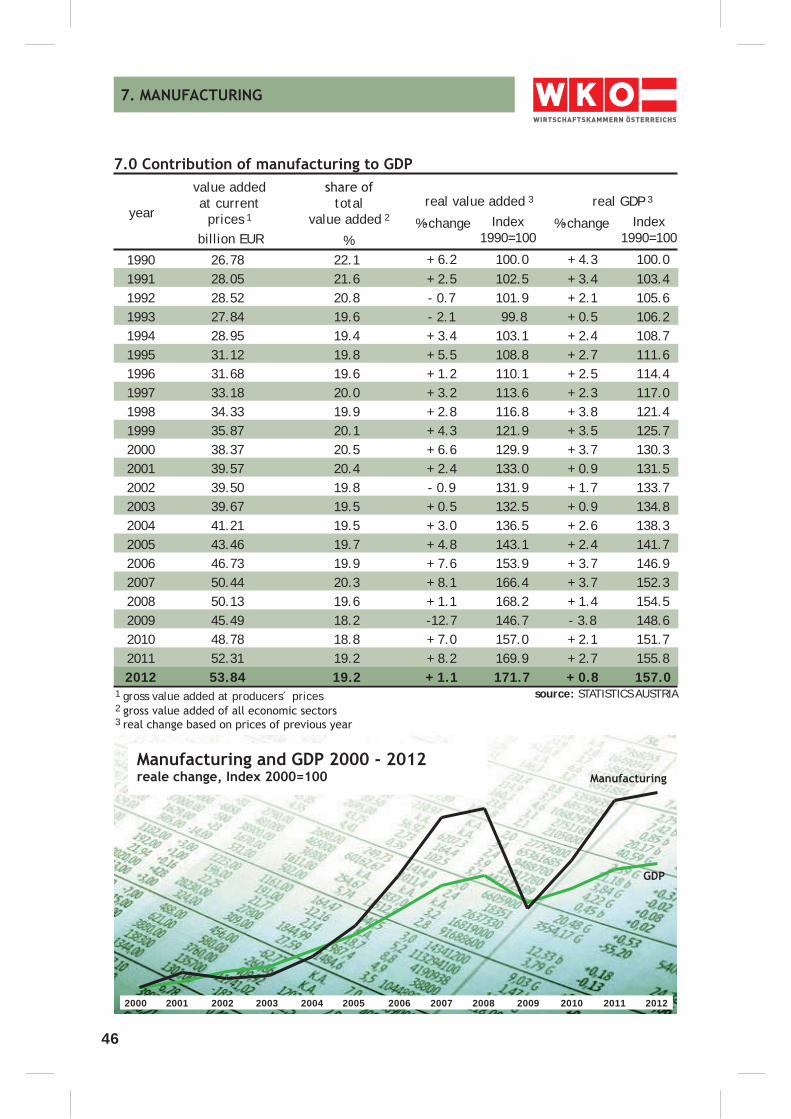
yearreal value added 3
source: STATISTICS AUSTRIA2
billion EUR%-change Index
1990=100
1 gross value added at producers´ prices
3
value added at current
prices 1total
value added 2
%Index
1990=100%-change
real GDP 3
1990 26.78 22.1 + 6.2 100.0 + 4.3 100.01991 28.05 21.6 + 2.5 102.5 + 3.4 103.41992 28.52 20.8 - 0.7 101.9 + 2.1 105.61993 27.84 19.6 - 2.1 99.8 + 0.5 106.21994 28.95 19.4 + 3.4 103.1 + 2.4 108.71995 31.12 19.8 + 5.5 108.8 + 2.7 111.61996 31.68 19.6 + 1.2 110.1 + 2.5 114.41997 33.18 20.0 + 3.2 113.6 + 2.3 117.01998 34.33 19.9 + 2.8 116.8 + 3.8 121.41999 35.87 20.1 + 4.3 121.9 + 3.5 125.72000 38.37 20.5 + 6.6 129.9 + 3.7 130.32001 39.57 20.4 + 2.4 133.0 + 0.9 131.52002 39.50 19.8 - 0.9 131.9 + 1.7 133.72003 39.67 19.5 + 0.5 132.5 + 0.9 134.82004 41.21 19.5 + 3.0 136.5 + 2.6 138.32005 43.46 19.7 + 4.8 143.1 + 2.4 141.72006 46.73 19.9 + 7.6 153.9 + 3.7 146.92007 50.44 20.3 + 8.1 166.4 + 3.7 152.32008 50.13 19.6 + 1.1 168.2 + 1.4 154.52009 45.49 18.2 -12.7 146.7 - 3.8 148.62010 48.78 18.8 + 7.0 157.0 + 2.1 151.72011 52.31 19.2 + 8.2 169.9 + 2.7 155.82012 53.84 19.2 + 1.1 171.7 + 0.8 157.0
20112000 2001 2002 2003 2004 2005 2006 2007 2008 2009 2010 2012
47
NACE-section totalEmployees 1
wageearners
salaryearners
1 source: HVSV
1,108 368 740 192 137 55
other quarrying 4,320 3,162 1,158
Mining support service activities 45 17 28
62,575 47,496 15,079 8,493 4,783 3,710 497 75 422 8,276 5,007 3,269 6,337 3,342 2,995 3,927 2,853 1,074
30,682 23,403 7,279
16,755 11,600 5,155Printing and reproduction 12,188 6,868 5,320
1,215 468 747 17,142 8,050 9,092 12,068 3,357 8,711 29,146 19,716 9,430
mineral products 30,864 20,588 10,276
34,433 24,619 9,814 68,422 46,289 22,133
and optical products 20,038 6,709 13,329
44,878 21,741 23,137 75,117 39,528 35,589 32,462 21,470 10,992 5,701 2,794 2,907 25,559 18,780 6,779 16,010 8,666 7,344
and equipment 20,508 8,025 12,483
Energy supply 26,670 4,513 22,157Water supply 1,462 549 913Sewerage 2,374 1,529 845Waste collection, treatment anddisposal activities; materials recovery 10,593 7,554 3,039
Remediation activities and otherwaste management services 103 36 67
48
1
NACE-sectiontotal
turnoverturnover
per emp.2 turnover abroad
exportratio
1 source: STATISTICS AUSTRIA
C C C C C C C C
other quarrying 953 237 24.9 231
Mining support service activities 17 1 5.9 1,497
14,689 4,961 33.8 2674,984 2,616 52.5 641
G G G G1,374 945 68.8 179780 500 64.0 139798 624 78.2 218
7,057 3,279 46.5 250
6,235 4,719 75.7 380Printing and reproduction 2,195 681 31.0 197
C C C C7,919 5,091 64.3 4783,664 3,042 83.0 3065,753 3,710 64.5 211
mineral products 6,680 1,686 25.2 226
15,858 10,611 66.9 46113,435 7,045 52.4 208
and optical products 4,293 3,608 84.0 228
11,600 8,422 72.6 26019,804 15,956 80.6 27412,980 11,811 91.0 4292,254 1,708 75.8 3942,421 763 31.5 1284,155 1,949 46.9 356
and equipment 4,093 1,415 34.6 202
Energy supply 47,815 22,858 47.8 1,801Water supply 500 1 0.0 244Sewerage 280 0 0.0 262Waste collection, treatment anddisposal activities; materials recovery 3,088 651 21.1 300
Remediation activities and otherwaste management services 33 0 0.0 343
54.9 370
billion EUR % 1,000 EUR
2 total turnover per employee
49
province
1
2
2012: preliminarily
1
(ÖNACE-2-digit-level);-
1.34 1.61 1.49 1.92 2.20 2.23
Carinthia 4.63 5.68 5.45 6.51 6.93 6.68
Lower Austria 19.49 23.12 25.00 26.36 30.82 31.81
Upper Austria 19.85 25.29 27.21 31.17 35.11 35.82
Salzburg 4.18 5.16 5.11 5.83 6.12 5.92
Styria 14.10 19.37 17.01 20.52 23.19 22.90
Tyrol 5.24 6.85 7.37 8.39 9.06 9.45
Vorarlberg 4.20 5.23 6.05 6.42 6.87 6.98
Vienna 12.85 12.50 15.02 15.17 18.94 22.46
AUSTRIA 85.88 104.81 109.70 122.29 139.24 144.25
2005 2010 2000 2009 2011 2012
production sold, billion EUR 2
province
1
7,959 6,921 6,984 7,008 7,318 7,487
Carinthia 24,285 23,867 22,931 22,750 23,654 24,028
Lower Austria 69,839 65,242 65,992 63,881 65,630 65,927
Upper Austria 98,402 96,236 96,861 94,977 97,077 100,466
Salzburg 19,861 18,896 18,185 17,864 18,436 18,395
Styria 74,522 74,361 70,409 68,443 70,076 70,762
Tyrol 29,512 31,615 30,935 30,802 32,334 32,889
Vorarlberg 26,008 24,551 24,828 25,074 25,767 25,900
Vienna 58,944 45,536 41,823 40,036 38,490 37,290
AUSTRIA
2005 2010 2000 2009 2011 2012
2
source: STATISTICS AUSTRIA
source: STATISTICS AUSTRIA
50
branch 2
1
2005 2010 2000 2009 2011 2012
production sold, billion EUR
source: STATISTICS AUSTRIA2
1
3 including construction industry
Machine and metalware industry
16.62 22.53 27.43 29.38 33.69 34.59
Chemical industry 10.26 11.38 12.84 13.03 14.45 15.21
Gas and district heatingsupply companies 2.31 4.05 5.13 6.41 8.98 13.45
Electrical & electronics industry 12.23 11.79 11.92 13.41 13.86 12.96
Petroleum industry 6.22 6.86 7.22 8.98 11.42 12.05
Vehicle Industry 6.83 11.72 8.37 10.55 12.24 11.96
Food industry 6.61 7.40 9.05 8.68 9.53 9.70
Mining and steel industry 3.65 6.16 5.89 6.63 8.01 7.72
Wood industry 5.37 6.23 6.21 7.06 7.62 7.52
Construction industry 4.01 4.63 5.60 5.03 5.60 5.97
1.98 2.03 2.34 3.74 4.24 3.89
Paper industry 3.62 3.30 3.02 3.55 3.73 3.70
2.80 3.18 3.24 3.18 3.32 3.14
Textile, clothing, shoe and leather industry 3.78 3.77 2.72 2.94 3.10 2.94
Paper converting industry 1.61 1.82 2.03 2.17 2.30 2.32
Glass industry 1.07 1.34 1.24 1.29 1.33 1.70
Foundry industry 0.94 1.26 1.05 1.28 1.41 1.40
TOTAL INDUSTRY 3 89.88 109.43 115.30 127.32 144.84 150.22
34.59
12.96
13.45
15.21
12.05
51
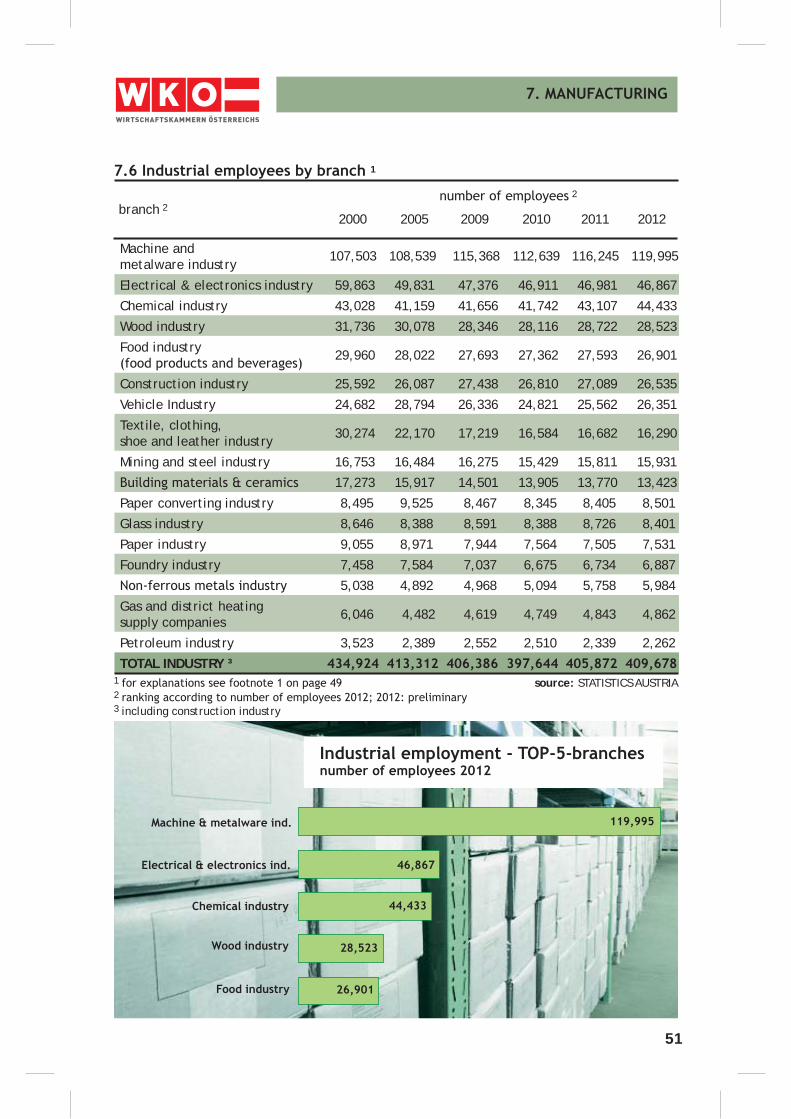
branch 2
1
2005 2010 2000 2009 2011 2012
2
source: STATISTICS AUSTRIA2
1
3 including construction industry
Machine and metalware industry
107,503 108,539 115,368 112,639 116,245 119,995
Electrical & electronics industry 59,863 49,831 47,376 46,911 46,981 46,867
Chemical industry 43,028 41,159 41,656 41,742 43,107 44,433
Wood industry 31,736 30,078 28,346 28,116 28,722 28,523
Food industry 29,960 28,022 27,693 27,362 27,593 26,901
Construction industry 25,592 26,087 27,438 26,810 27,089 26,535
Vehicle Industry 24,682 28,794 26,336 24,821 25,562 26,351
Textile, clothing, shoe and leather industry 30,274 22,170 17,219 16,584 16,682 16,290
Mining and steel industry 16,753 16,484 16,275 15,429 15,811 15,931
17,273 15,917 14,501 13,905 13,770 13,423
Paper converting industry 8,495 9,525 8,467 8,345 8,405 8,501
Glass industry 8,646 8,388 8,591 8,388 8,726 8,401
Paper industry 9,055 8,971 7,944 7,564 7,505 7,531
Foundry industry 7,458 7,584 7,037 6,675 6,734 6,887
5,038 4,892 4,968 5,094 5,758 5,984
Gas and district heating supply companies 6,046 4,482 4,619 4,749 4,843 4,862
Petroleum industry 3,523 2,389 2,552 2,510 2,339 2,262
TOTAL INDUSTRY ³
52
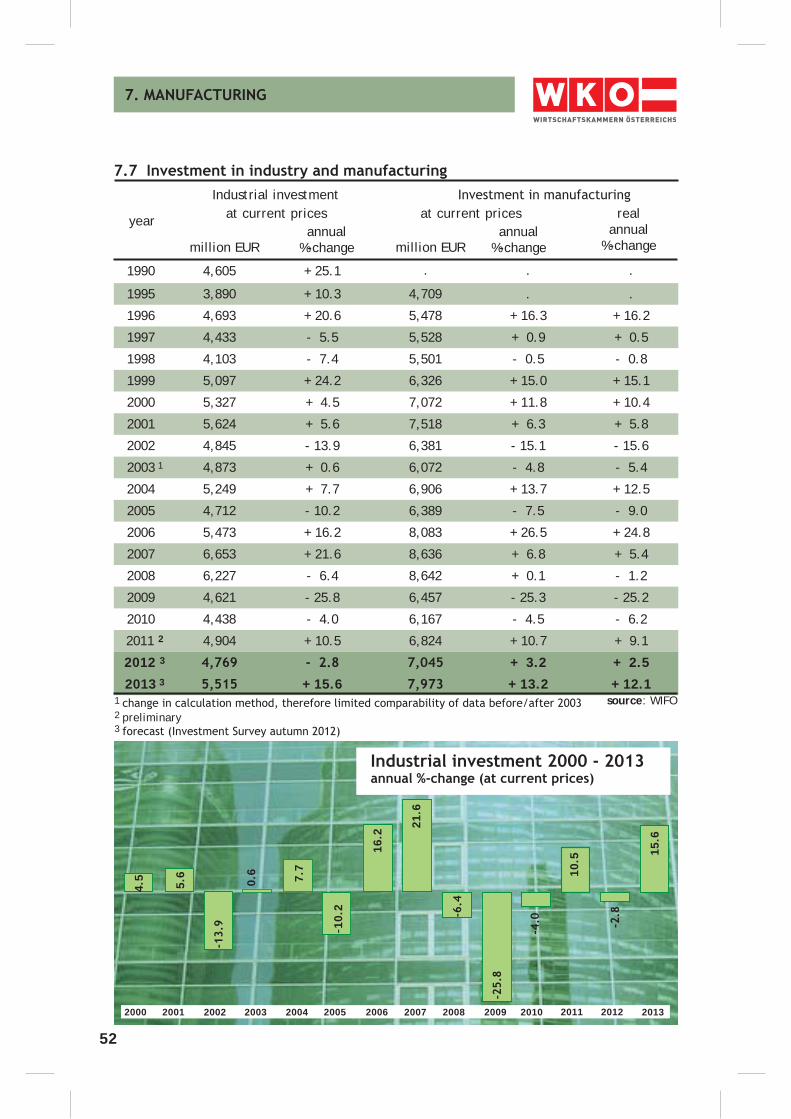
year
Industrial investment
source: WIFO2 preliminary
million EURannual
%-change
1
3
at current pricesannual
%-change
1990 4,605 + 25.1 . . .
1995 3,890 + 10.3 4,709 . .
1996 4,693 + 20.6 5,478 + 16.3 + 16.2
1997 4,433 - 5.5 5,528 + 0.9 + 0.5
1998 4,103 - 7.4 5,501 - 0.5 - 0.8
1999 5,097 + 24.2 6,326 + 15.0 + 15.1
2000 5,327 + 4.5 7,072 + 11.8 + 10.4
2001 5,624 + 5.6 7,518 + 6.3 + 5.8
2002 4,845 - 13.9 6,381 - 15.1 - 15.6
2003 1 4,873 + 0.6 6,072 - 4.8 - 5.4
2004 5,249 + 7.7 6,906 + 13.7 + 12.5
2005 4,712 - 10.2 6,389 - 7.5 - 9.0
2006 5,473 + 16.2 8,083 + 26.5 + 24.8
2007 6,653 + 21.6 8,636 + 6.8 + 5.4
2008 6,227 - 6.4 8,642 + 0.1 - 1.2
2009 4,621 - 25.8 6,457 - 25.3 - 25.2
2010 4,438 - 4.0 6,167 - 4.5 - 6.2
2011 2 4,904 + 10.5 6,824 + 10.7 + 9.1
2012 3 + 3.2 + 2.5
2013 3 + 15.6 + 13.2 + 12.1
million EUR
at current prices realannual
%-change
2000 2001 2002 2003 2004 2005 2006 2007 2008 2009 2010
21.
6
16.
2
-10
.2
7.7
0.6
4.5
2011
2012
5.6 1
0.5
2013
15.
6
53
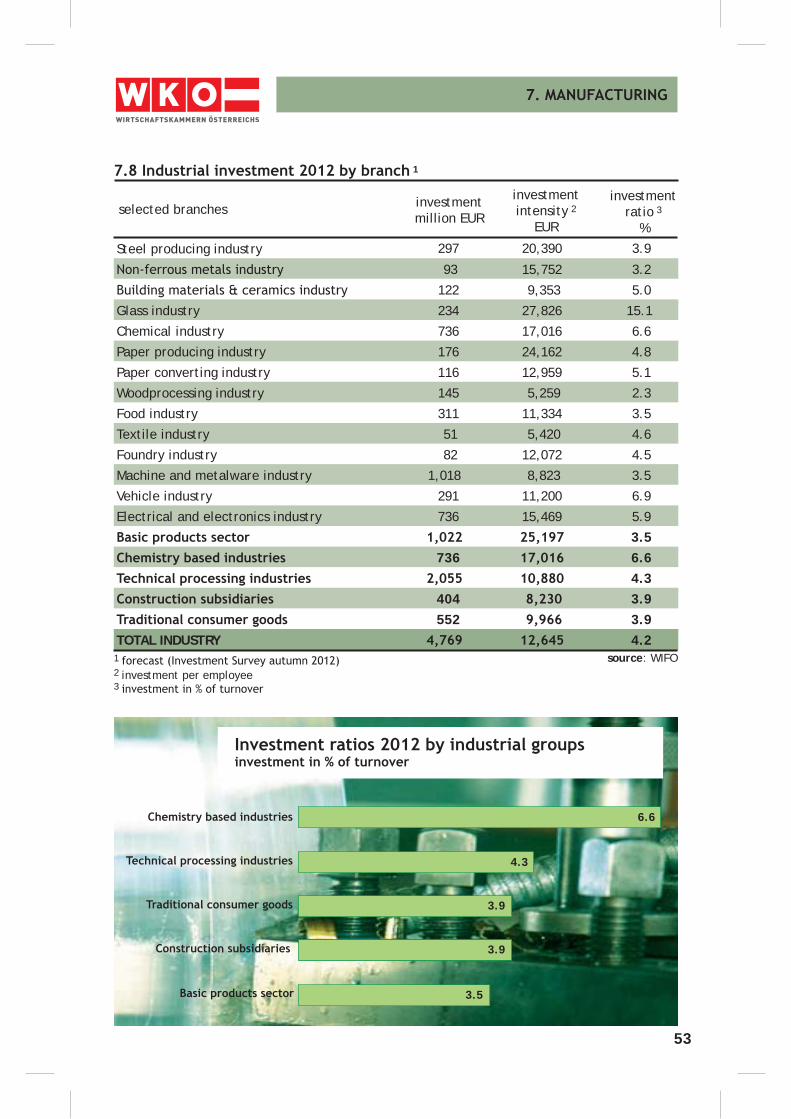
selected branches
1
Steel producing industry 297 20,390 3.9
93 15,752 3.2
122 9,353 5.0
Glass industry 234 27,826 15.1
Chemical industry 736 17,016 6.6
Paper producing industry 176 24,162 4.8
Paper converting industry 116 12,959 5.1
Woodprocessing industry 145 5,259 2.3
Food industry 311 11,334 3.5
Textile industry 51 5,420 4.6
Foundry industry 82 12,072 4.5
Machine and metalware industry 1,018 8,823 3.5
Vehicle industry 291 11,200 6.9
Electrical and electronics industry 736 15,469 5.9
3.5 736 6.6
4.3 404 3.9 552 3.9
TOTAL INDUSTRY 4.2source: WIFO
2 investment per employee
1
3
investmentmillion EUR
investment
intensity 2
EUR
investmentratio 3
%
6.6
3.9
3.9
4.3
3.5
54
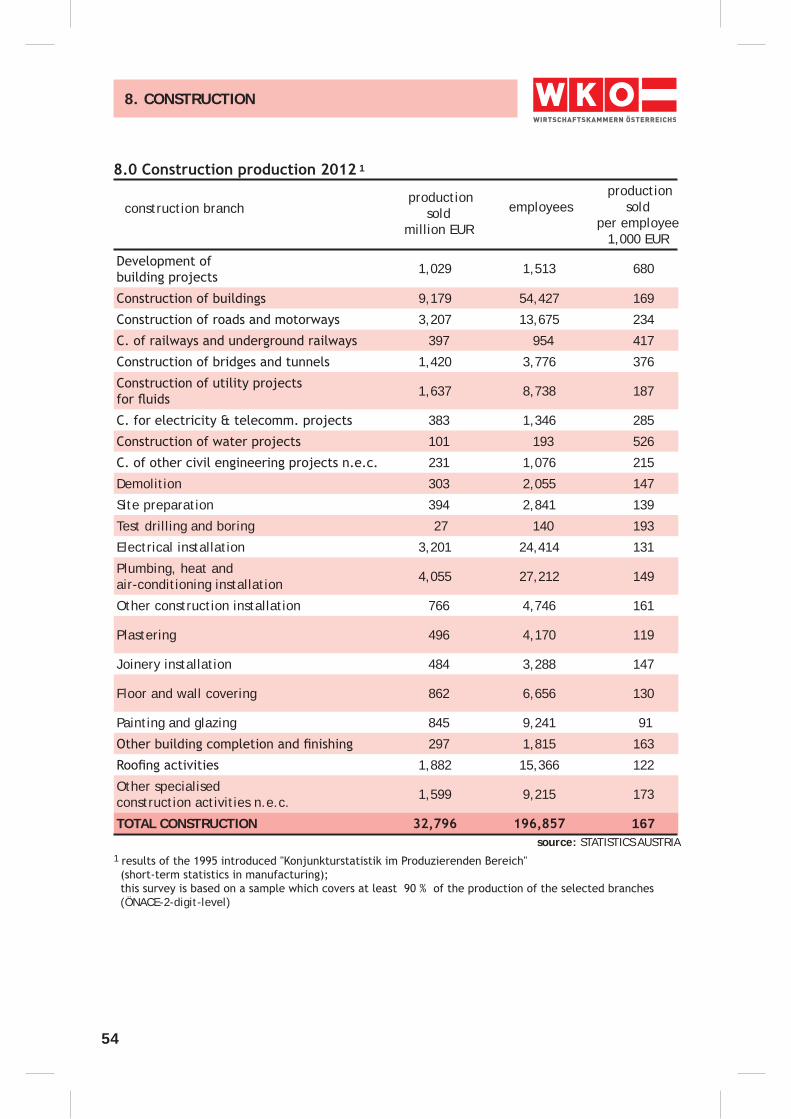
productionsold
per employee1,000 EUR
1
(ÖNACE-2-digit-level)
source: STATISTICS AUSTRIA
1
productionsold
million EUR
employees
8. CONSTRUCTION
1,029 1,513 680
9,179 54,427 169
3,207 13,675 234
397 954 417
1,420 3,776 376
1,637 8,738 187
383 1,346 285
101 193 526
231 1,076 215
Demolition 303 2,055 147
Site preparation 394 2,841 139
Test drilling and boring 27 140 193
Electrical installation 3,201 24,414 131
Plumbing, heat and air-conditioning installation 4,055 27,212 149
Other construction installation 766 4,746 161
Plastering 496 4,170 119
Joinery installation 484 3,288 147
Floor and wall covering 862 6,656 130
Painting and glazing 845 9,241 91
297 1,815 163
1,882 15,366 122
Other specialised construction activities n.e.c. 1,599 9,215 173
TOTAL CONSTRUCTION 167
construction branch
55
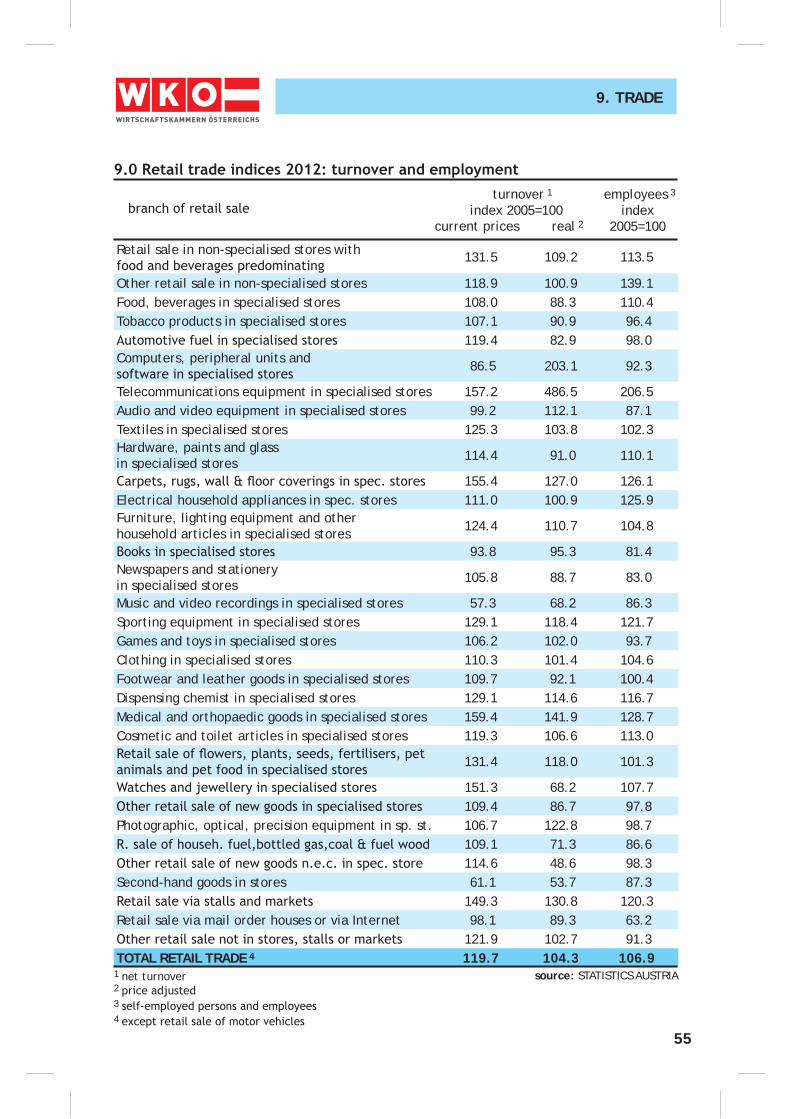
9. TRADE
1 net turnover source: STATISTICS AUSTRIA2
Retail sale in non-specialised stores with 131.5 109.2 113.5
Other retail sale in non-specialised stores 118.9 100.9 139.1Food, beverages in specialised stores 108.0 88.3 110.4Tobacco products in specialised stores 107.1 90.9 96.4
119.4 82.9 98.0Computers, peripheral units and 86.5 203.1 92.3
Telecommunications equipment in specialised stores 157.2 486.5 206.5Audio and video equipment in specialised stores 99.2 112.1 87.1Textiles in specialised stores 125.3 103.8 102.3Hardware, paints and glassin specialised stores 114.4 91.0 110.1
155.4 127.0 126.1Electrical household appliances in spec. stores 111.0 100.9 125.9Furniture, lighting equipment and other household articles in specialised stores 124.4 110.7 104.8
93.8 95.3 81.4Newspapers and stationery in specialised stores 105.8 88.7 83.0
Music and video recordings in specialised stores 57.3 68.2 86.3Sporting equipment in specialised stores 129.1 118.4 121.7Games and toys in specialised stores 106.2 102.0 93.7Clothing in specialised stores 110.3 101.4 104.6Footwear and leather goods in specialised stores 109.7 92.1 100.4Dispensing chemist in specialised stores 129.1 114.6 116.7Medical and orthopaedic goods in specialised stores 159.4 141.9 128.7Cosmetic and toilet articles in specialised stores 119.3 106.6 113.0
131.4 118.0 101.3
151.3 68.2 107.7109.4 86.7 97.8
Photographic, optical, precision equipment in sp. st. 106.7 122.8 98.7109.1 71.3 86.6114.6 48.6 98.3
Second-hand goods in stores 61.1 53.7 87.3149.3 130.8 120.3
Retail sale via mail order houses or via Internet 98.1 89.3 63.2121.9 102.7 91.3
TOTAL RETAIL TRADE 4 119.7 104.3 106.9
employees 3
index2005=100
turnover 1
index 2005=100current prices real 2
3
4
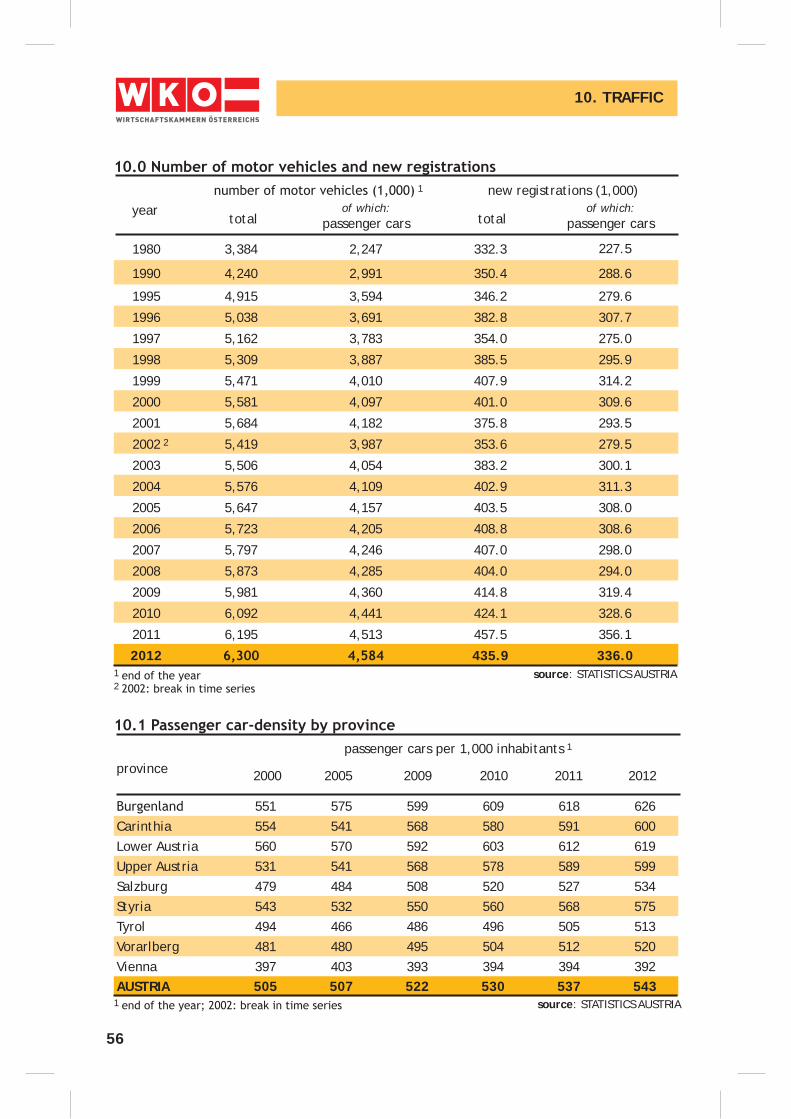
56
10. TRAFFIC
1980 3,384 2,247 332.3 227.5
1990 4,240 2,991 350.4 288.6
1995 4,915 3,594 346.2 279.6
1996 5,038 3,691 382.8 307.7
1997 5,162 3,783 354.0 275.0
1998 5,309 3,887 385.5 295.9
1999 5,471 4,010 407.9 314.2
2000 5,581 4,097 401.0 309.6
2001 5,684 4,182 375.8 293.5
2002 2 5,419 3,987 353.6 279.5
2003 5,506 4,054 383.2 300.1
2004 5,576 4,109 402.9 311.3
2005 5,647 4,157 403.5 308.0
2006 5,723 4,205 408.8 308.6
2007 5,797 4,246 407.0 298.0
2008 5,873 4,285 404.0 294.0
2009 5,981 4,360 414.8 319.4
2010 6,092 4,441 424.1 328.6
2011 6,195 4,513 457.5 356.1
2012 435.9 336.0
yeartotal
of which:passenger cars
source: STATISTICS AUSTRIA
1 new registrations (1,000)
totalof which:
passenger cars
1
551 575 599 609 618 626Carinthia 554 541 568 580 591 600Lower Austria 560 570 592 603 612 619Upper Austria 531 541 568 578 589 599Salzburg 479 484 508 520 527 534Styria 543 532 550 560 568 575Tyrol 494 466 486 496 505 513Vorarlberg 481 480 495 504 512 520Vienna 397 403 393 394 394 392AUSTRIA 505 507 522 530 537 543
provincepassenger cars per 1,000 inhabitants 1
2005 2010 2000 2009 2011 2012
1 source: STATISTICS AUSTRIA
2
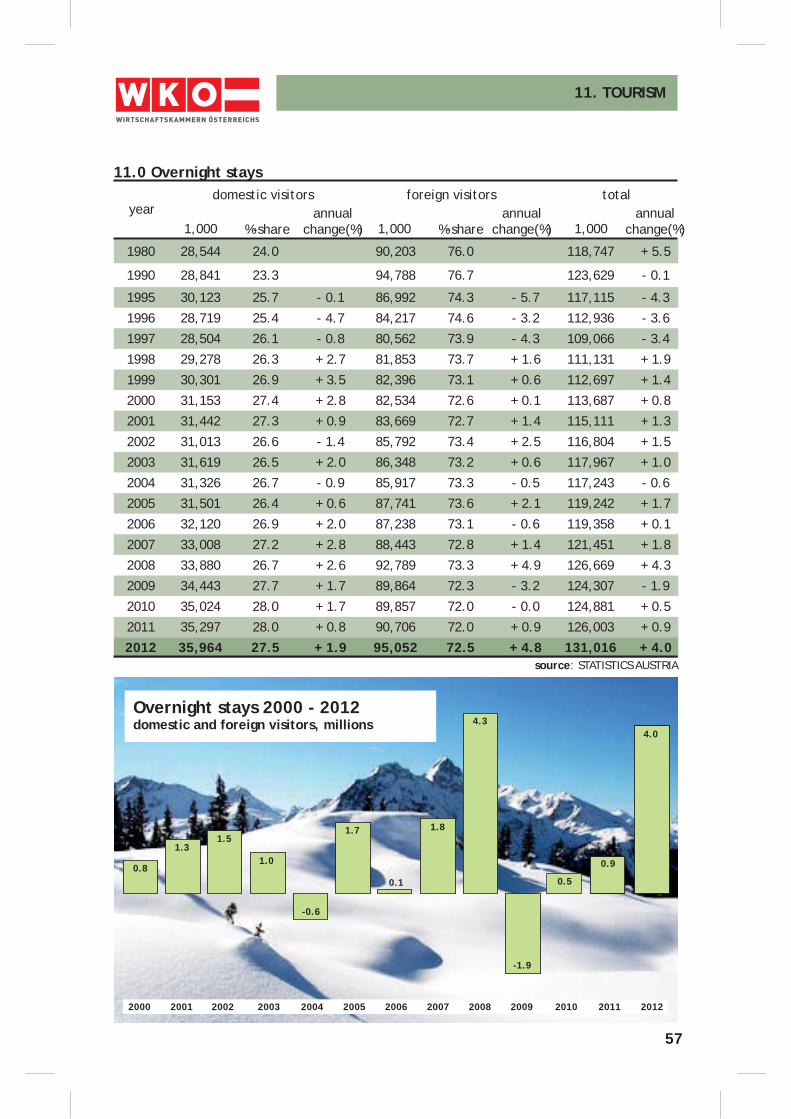
57
11.0 Overnight stays
yeardomestic visitors
source: STATISTICS AUSTRIA
1,000 %-share
total
1980 28,544 24.0 90,203 76.0 118,747 + 5.5
1990 28,841 23.3 94,788 76.7 123,629 - 0.1
1995 30,123 25.7 - 0.1 86,992 74.3 - 5.7 117,115 - 4.3
1996 28,719 25.4 - 4.7 84,217 74.6 - 3.2 112,936 - 3.6
1997 28,504 26.1 - 0.8 80,562 73.9 - 4.3 109,066 - 3.4
1998 29,278 26.3 + 2.7 81,853 73.7 + 1.6 111,131 + 1.9
1999 30,301 26.9 + 3.5 82,396 73.1 + 0.6 112,697 + 1.4
2000 31,153 27.4 + 2.8 82,534 72.6 + 0.1 113,687 + 0.8
2001 31,442 27.3 + 0.9 83,669 72.7 + 1.4 115,111 + 1.3
2002 31,013 26.6 - 1.4 85,792 73.4 + 2.5 116,804 + 1.5
2003 31,619 26.5 + 2.0 86,348 73.2 + 0.6 117,967 + 1.0
2004 31,326 26.7 - 0.9 85,917 73.3 - 0.5 117,243 - 0.6
2005 31,501 26.4 + 0.6 87,741 73.6 + 2.1 119,242 + 1.7
2006 32,120 26.9 + 2.0 87,238 73.1 - 0.6 119,358 + 0.1
2007 33,008 27.2 + 2.8 88,443 72.8 + 1.4 121,451 + 1.8
2008 33,880 26.7 + 2.6 92,789 73.3 + 4.9 126,669 + 4.3
2009 34,443 27.7 + 1.7 89,864 72.3 - 3.2 124,307 - 1.9
2010 35,024 28.0 + 1.7 89,857 72.0 - 0.0 124,881 + 0.5
2011 35,297 28.0 + 0.8 90,706 72.0 + 0.9 126,003 + 0.9
2012 35,964 27.5 + 1.9 95,052 72.5 + 4.8 131,016 + 4.0
11. TOURISM
foreign visitorsannual
change(%) 1,000 %-shareannual
change(%) 1,000annual
change(%)
Overnight stays 2000 - 2012 domestic and foreign visitors, millions
2000 2001 2002 2003 2004 2005 2006 2007 2008 2009
0.8
1.31.0
1.5
-0.6
1.7
0.1
1.8
4.3
-1.9
2010
0.5
2011
0.9
2012
4.0
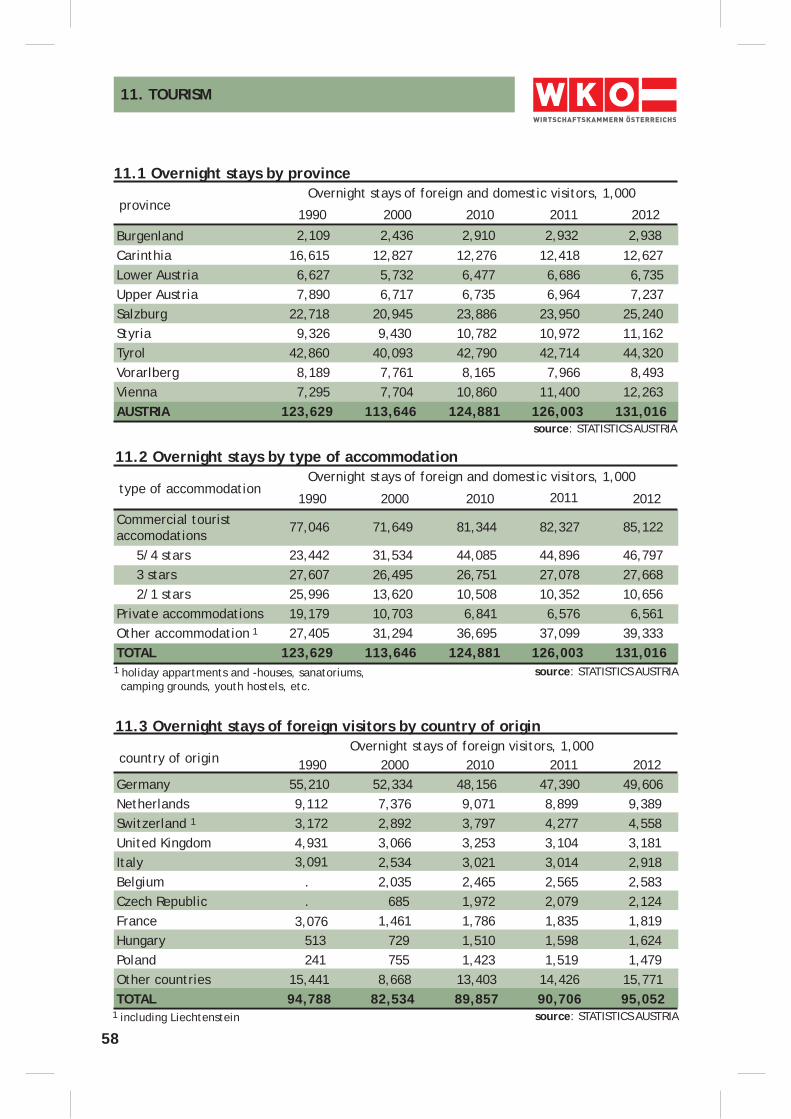
58
11. TOURISM
province
Burgenland 2,109 2,436 2,910 2,932 2,938Carinthia 16,615 12,827 12,276 12,418 12,627Lower Austria 6,627 5,732 6,477 6,686 6,735Upper Austria 7,890 6,717 6,735 6,964 7,237Salzburg 22,718 20,945 23,886 23,950 25,240Styria 9,326 9,430 10,782 10,972 11,162Tyrol 42,860 40,093 42,790 42,714 44,320Vorarlberg 8,189 7,761 8,165 7,966 8,493Vienna 7,295 7,704 10,860 11,400 12,263AUSTRIA 123,629 113,646 124,881 126,003 131,016
Overnight stays of foreign and domestic visitors, 1,000
source: STATISTICS AUSTRIA
11.1 Overnight stays by province
type of accommodation
Commercial tourist accomodations
77,046 71,649 81,344 82,327 85,122
5/4 stars 23,442 31,534 44,085 44,896 46,797 3 stars 27,607 26,495 26,751 27,078 27,668 2/1 stars 25,996 13,620 10,508 10,352 10,656Private accommodations 19,179 10,703 6,841 6,576 6,561Other accommodation 1 27,405 31,294 36,695 37,099 39,333TOTAL 123,629 113,646 124,881 126,003 131,016
Overnight stays of foreign and domestic visitors, 1,000
source: STATISTICS AUSTRIA
11.2 Overnight stays by type of accommodation
country of origin
Germany 55,210 52,334 48,156 47,390 49,606Netherlands 9,112 7,376 9,071 8,899 9,389Switzerland 1 3,172 2,892 3,797 4,277 4,558United Kingdom 4,931 3,066 3,253 3,104 3,181Italy 3,091 2,534 3,021 3,014 2,918Belgium . 2,035 2,465 2,565 2,583Czech Republic . 685 1,972 2,079 2,124France 3,076 1,461 1,786 1,835 1,819Hungary 513 729 1,510 1,598 1,624Poland 241 755 1,423 1,519 1,479Other countries 15,441 8,668 13,403 14,426 15,771TOTAL 94,788 82,534 89,857 90,706 95,052
2000 1990 2010 2011 2012Overnight stays of foreign visitors, 1,000
source: STATISTICS AUSTRIA
11.3 Overnight stays of foreign visitors by country of origin
1 holiday appartments and -houses, sanatoriums, camping grounds, youth hostels, etc.
2000 1990 2010 2011 2012
2000 1990 2010 2011 2012
1 including Liechtenstein
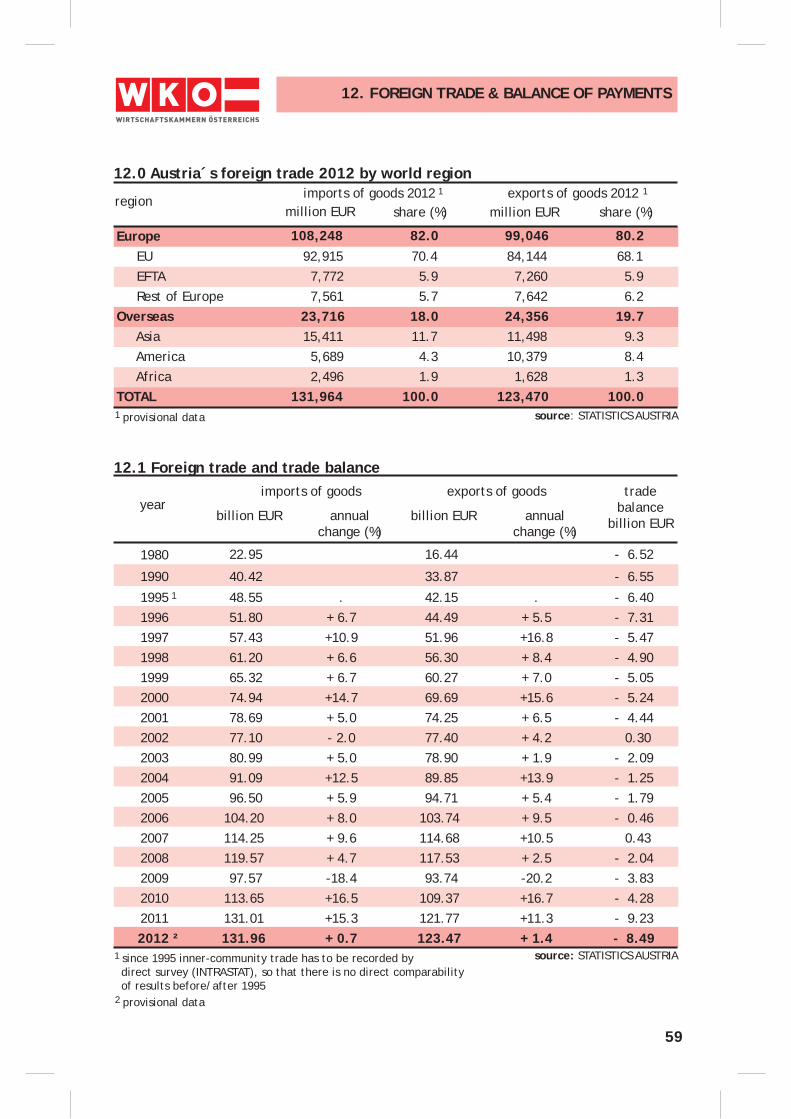
59
source: STATISTICS AUSTRIA
region
12.0 Austria´s foreign trade 2012 by world region
million EURexports of goods 2012 1
2 provisional data
1 since 1995 inner-community trade has to be recorded by direct survey (INTRASTAT), so that there is no direct comparability of results before/after 1995
imports of goods 2012 1
12. FOREIGN TRADE & BALANCE OF PAYMENTS
million EURshare (%) share (%)
1 provisional data source: STATISTICS AUSTRIA
Europe 108,248 82.0 99,046 80.2 EU 92,915 70.4 84,144 68.1 EFTA 7,772 5.9 7,260 5.9 Rest of Europe 7,561 5.7 7,642 6.2Overseas 23,716 18.0 24,356 19.7 Asia 15,411 11.7 11,498 9.3 America 5,689 4.3 10,379 8.4 Africa 2,496 1.9 1,628 1.3TOTAL 131,964 100.0 123,470 100.0
1980 22.95 16.44 - 6.52
1990 40.42 33.87 - 6.55
1995 1 48.55 . 42.15 . - 6.401996 51.80 + 6.7 44.49 + 5.5 - 7.311997 57.43 +10.9 51.96 +16.8 - 5.471998 61.20 + 6.6 56.30 + 8.4 - 4.901999 65.32 + 6.7 60.27 + 7.0 - 5.052000 74.94 +14.7 69.69 +15.6 - 5.242001 78.69 + 5.0 74.25 + 6.5 - 4.442002 77.10 - 2.0 77.40 + 4.2 0.302003 80.99 + 5.0 78.90 + 1.9 - 2.092004 91.09 +12.5 89.85 +13.9 - 1.252005 96.50 + 5.9 94.71 + 5.4 - 1.792006 104.20 + 8.0 103.74 + 9.5 - 0.462007 114.25 + 9.6 114.68 +10.5 0.432008 119.57 + 4.7 117.53 + 2.5 - 2.042009 97.57 -18.4 93.74 -20.2 - 3.832010 113.65 +16.5 109.37 +16.7 - 4.282011 131.01 +15.3 121.77 +11.3 - 9.23
2012 ² 131.96 + 0.7 123.47 + 1.4 - 8.49
year
12.1 Foreign trade and trade balance
billion EUR
exports of goodsimports of goods
billion EURannualchange (%)
annualchange (%)
trade balance
billion EUR
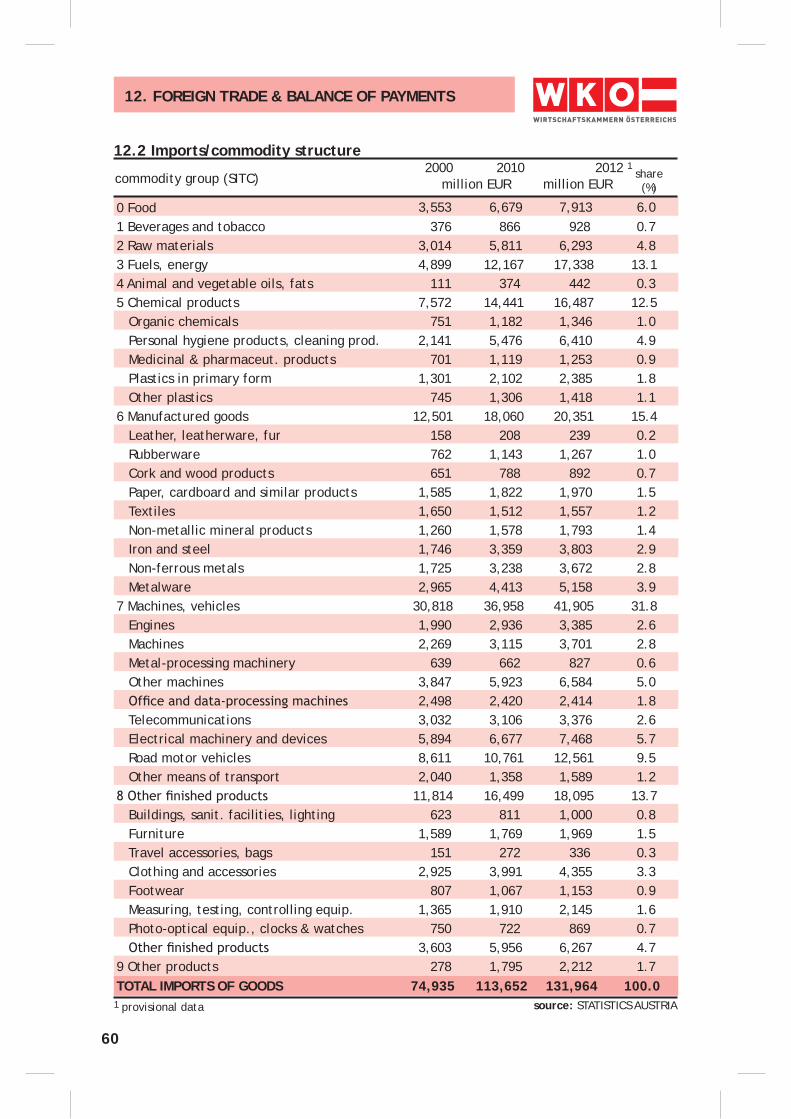
60
commodity group (SITC)
12.2 Imports/commodity structure
million EUR2012 12010
million EURshare(%)
1 provisional data source: STATISTICS AUSTRIA
0 Food 3,553 6,679 7,913 6.01 Beverages and tobacco 376 866 928 0.72 Raw materials 3,014 5,811 6,293 4.83 Fuels, energy 4,899 12,167 17,338 13.14 Animal and vegetable oils, fats 111 374 442 0.35 Chemical products 7,572 14,441 16,487 12.5 Organic chemicals 751 1,182 1,346 1.0 Personal hygiene products, cleaning prod. 2,141 5,476 6,410 4.9 Medicinal & pharmaceut. products 701 1,119 1,253 0.9 Plastics in primary form 1,301 2,102 2,385 1.8 Other plastics 745 1,306 1,418 1.16 Manufactured goods 12,501 18,060 20,351 15.4 Leather, leatherware, fur 158 208 239 0.2 Rubberware 762 1,143 1,267 1.0 Cork and wood products 651 788 892 0.7 Paper, cardboard and similar products 1,585 1,822 1,970 1.5 Textiles 1,650 1,512 1,557 1.2 Non-metallic mineral products 1,260 1,578 1,793 1.4 Iron and steel 1,746 3,359 3,803 2.9 Non-ferrous metals 1,725 3,238 3,672 2.8 Metalware 2,965 4,413 5,158 3.97 Machines, vehicles 30,818 36,958 41,905 31.8 Engines 1,990 2,936 3,385 2.6 Machines 2,269 3,115 3,701 2.8 Metal-processing machinery 639 662 827 0.6 Other machines 3,847 5,923 6,584 5.0
2,498 2,420 2,414 1.8 Telecommunications 3,032 3,106 3,376 2.6 Electrical machinery and devices 5,894 6,677 7,468 5.7 Road motor vehicles 8,611 10,761 12,561 9.5 Other means of transport 2,040 1,358 1,589 1.2
11,814 16,499 18,095 13.7 Buildings, sanit. facilities, lighting 623 811 1,000 0.8 Furniture 1,589 1,769 1,969 1.5 Travel accessories, bags 151 272 336 0.3 Clothing and accessories 2,925 3,991 4,355 3.3 Footwear 807 1,067 1,153 0.9 Measuring, testing, controlling equip. 1,365 1,910 2,145 1.6 Photo-optical equip., clocks & watches 750 722 869 0.7
3,603 5,956 6,267 4.79 Other products 278 1,795 2,212 1.7TOTAL IMPORTS OF GOODS 74,935 113,652 131,964 100.0
12. FOREIGN TRADE & BALANCE OF PAYMENTS
2000
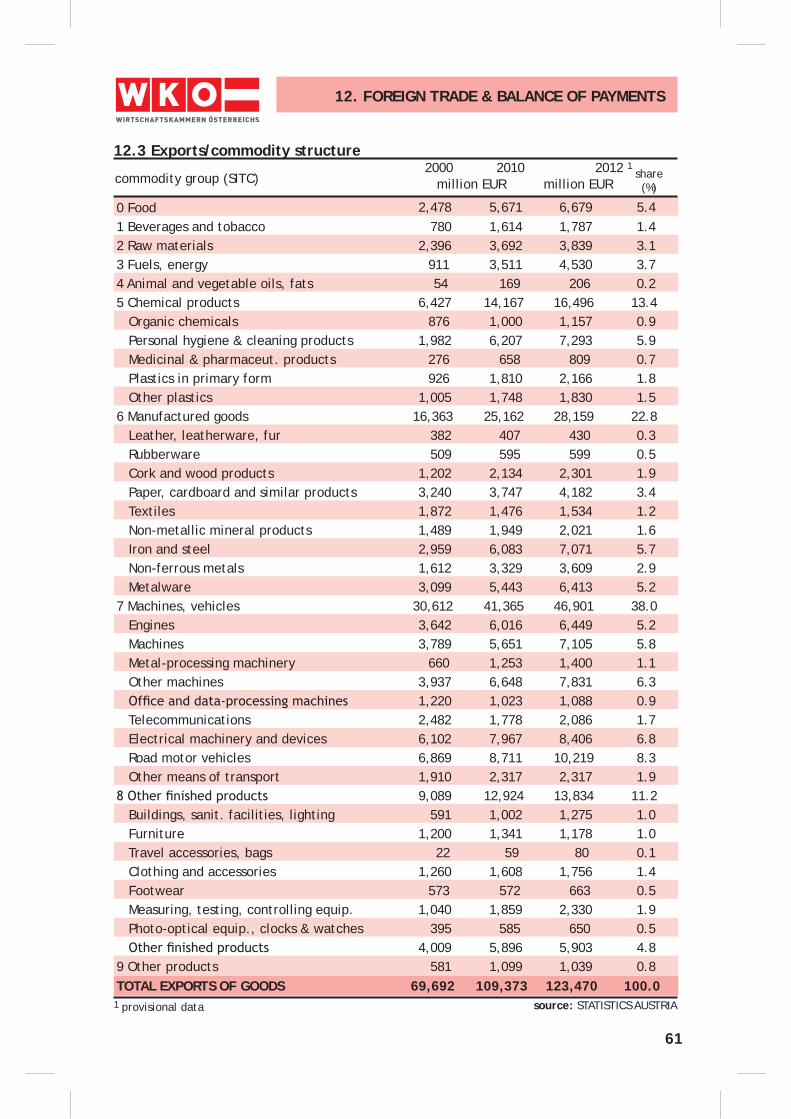
61
12. FOREIGN TRADE & BALANCE OF PAYMENTS
commodity group (SITC)
12.3 Exports/commodity structure
million EUR2012 12010
million EURshare(%)
1 provisional data source: STATISTICS AUSTRIA
0 Food 2,478 5,671 6,679 5.41 Beverages and tobacco 780 1,614 1,787 1.42 Raw materials 2,396 3,692 3,839 3.13 Fuels, energy 911 3,511 4,530 3.74 Animal and vegetable oils, fats 54 169 206 0.25 Chemical products 6,427 14,167 16,496 13.4 Organic chemicals 876 1,000 1,157 0.9 Personal hygiene & cleaning products 1,982 6,207 7,293 5.9 Medicinal & pharmaceut. products 276 658 809 0.7 Plastics in primary form 926 1,810 2,166 1.8 Other plastics 1,005 1,748 1,830 1.56 Manufactured goods 16,363 25,162 28,159 22.8 Leather, leatherware, fur 382 407 430 0.3 Rubberware 509 595 599 0.5 Cork and wood products 1,202 2,134 2,301 1.9 Paper, cardboard and similar products 3,240 3,747 4,182 3.4 Textiles 1,872 1,476 1,534 1.2 Non-metallic mineral products 1,489 1,949 2,021 1.6 Iron and steel 2,959 6,083 7,071 5.7 Non-ferrous metals 1,612 3,329 3,609 2.9 Metalware 3,099 5,443 6,413 5.27 Machines, vehicles 30,612 41,365 46,901 38.0 Engines 3,642 6,016 6,449 5.2 Machines 3,789 5,651 7,105 5.8 Metal-processing machinery 660 1,253 1,400 1.1 Other machines 3,937 6,648 7,831 6.3
1,220 1,023 1,088 0.9 Telecommunications 2,482 1,778 2,086 1.7 Electrical machinery and devices 6,102 7,967 8,406 6.8 Road motor vehicles 6,869 8,711 10,219 8.3 Other means of transport 1,910 2,317 2,317 1.9
9,089 12,924 13,834 11.2 Buildings, sanit. facilities, lighting 591 1,002 1,275 1.0 Furniture 1,200 1,341 1,178 1.0 Travel accessories, bags 22 59 80 0.1 Clothing and accessories 1,260 1,608 1,756 1.4 Footwear 573 572 663 0.5 Measuring, testing, controlling equip. 1,040 1,859 2,330 1.9 Photo-optical equip., clocks & watches 395 585 650 0.5
4,009 5,896 5,903 4.89 Other products 581 1,099 1,039 0.8TOTAL EXPORTS OF GOODS 69,692 109,373 123,470 100.0
2000
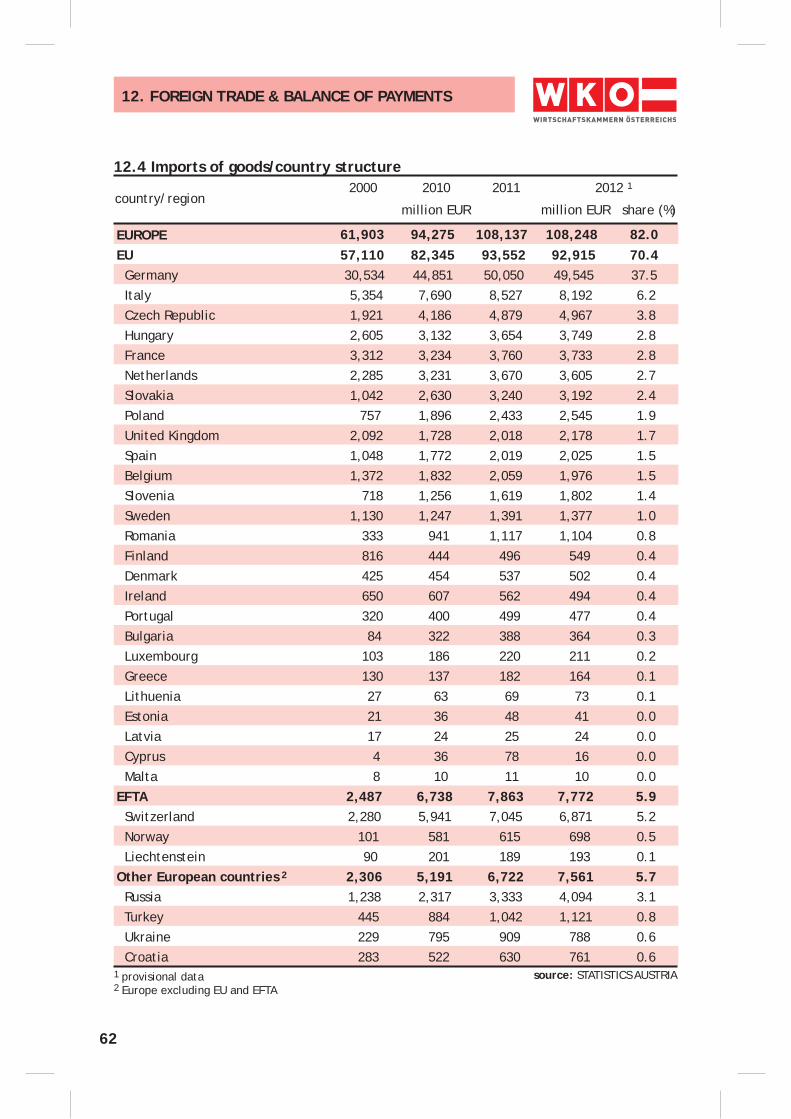
62
12.4 Imports of goods/country structure
2 Europe excluding EU and EFTA
12. FOREIGN TRADE & BALANCE OF PAYMENTS
country/regionmillion EUR
2012 12011
million EUR share (%)
1 provisional data source: STATISTICS AUSTRIA
EUROPE 61,903 94,275 108,137 108,248 82.0EU 57,110 82,345 93,552 92,915 70.4 Germany 30,534 44,851 50,050 49,545 37.5 Italy 5,354 7,690 8,527 8,192 6.2 Czech Republic 1,921 4,186 4,879 4,967 3.8 Hungary 2,605 3,132 3,654 3,749 2.8 France 3,312 3,234 3,760 3,733 2.8 Netherlands 2,285 3,231 3,670 3,605 2.7 Slovakia 1,042 2,630 3,240 3,192 2.4 Poland 757 1,896 2,433 2,545 1.9 United Kingdom 2,092 1,728 2,018 2,178 1.7 Spain 1,048 1,772 2,019 2,025 1.5 Belgium 1,372 1,832 2,059 1,976 1.5 Slovenia 718 1,256 1,619 1,802 1.4 Sweden 1,130 1,247 1,391 1,377 1.0 Romania 333 941 1,117 1,104 0.8 Finland 816 444 496 549 0.4 Denmark 425 454 537 502 0.4 Ireland 650 607 562 494 0.4 Portugal 320 400 499 477 0.4 Bulgaria 84 322 388 364 0.3 Luxembourg 103 186 220 211 0.2 Greece 130 137 182 164 0.1 Lithuenia 27 63 69 73 0.1 Estonia 21 36 48 41 0.0 Latvia 17 24 25 24 0.0 Cyprus 4 36 78 16 0.0 Malta 8 10 11 10 0.0EFTA 2,487 6,738 7,863 7,772 5.9 Switzerland 2,280 5,941 7,045 6,871 5.2 Norway 101 581 615 698 0.5 Liechtenstein 90 201 189 193 0.1Other European countries 2 2,306 5,191 6,722 7,561 5.7 Russia 1,238 2,317 3,333 4,094 3.1 Turkey 445 884 1,042 1,121 0.8 Ukraine 229 795 909 788 0.6 Croatia 283 522 630 761 0.6
20102000
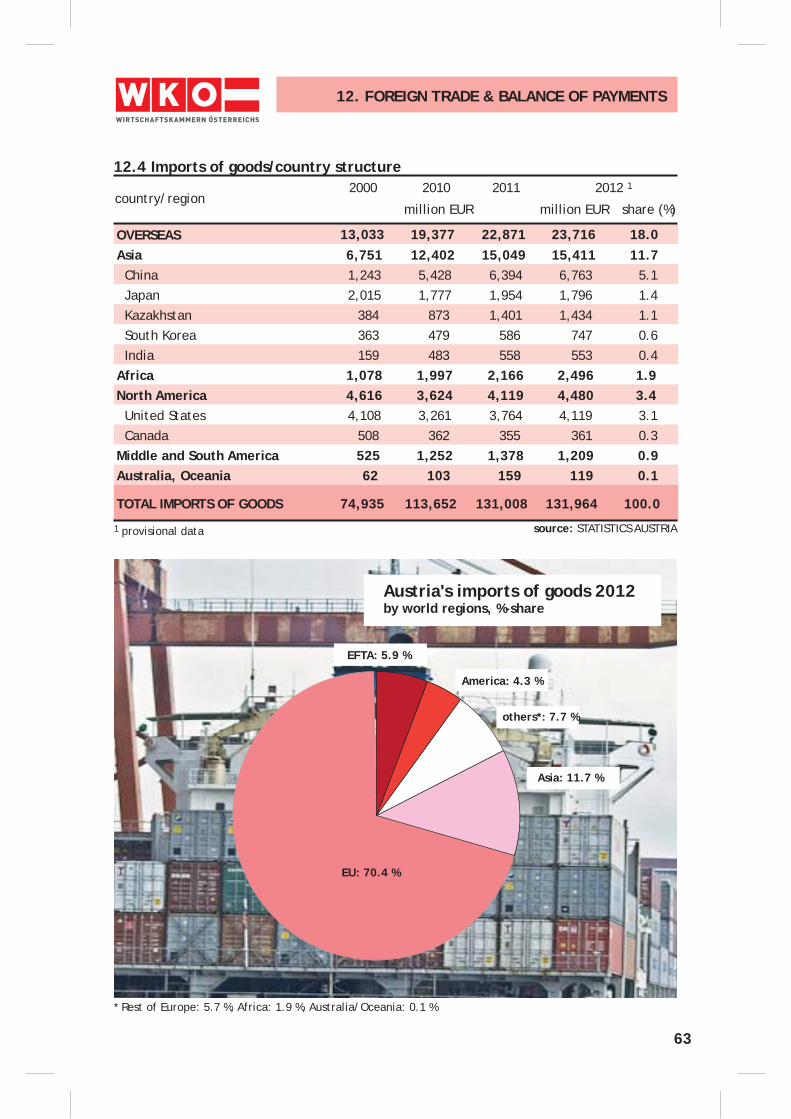
63
12.4 Imports of goods/country structure
country/regionmillion EUR
2012 12011
million EUR share (%)
1 provisional data source: STATISTICS AUSTRIA
OVERSEAS 13,033 19,377 22,871 23,716 18.0Asia 6,751 12,402 15,049 15,411 11.7 China 1,243 5,428 6,394 6,763 5.1 Japan 2,015 1,777 1,954 1,796 1.4 Kazakhstan 384 873 1,401 1,434 1.1 South Korea 363 479 586 747 0.6 India 159 483 558 553 0.4Africa 1,078 1,997 2,166 2,496 1.9North America 4,616 3,624 4,119 4,480 3.4 United States 4,108 3,261 3,764 4,119 3.1 Canada 508 362 355 361 0.3Middle and South America 525 1,252 1,378 1,209 0.9Australia, Oceania 62 103 159 119 0.1
TOTAL IMPORTS OF GOODS 74,935 113,652 131,008 131,964 100.0
20102000
12. FOREIGN TRADE & BALANCE OF PAYMENTS
Austria's imports of goods 2012 by world regions, %-share
EFTA: 5.9 %
EU: 70.4 %
Asia: 11.7 %
others*: 7.7 %
America: 4.3 %
* Rest of Europe: 5.7 %, Africa: 1.9 %, Australia/Oceania: 0.1 %
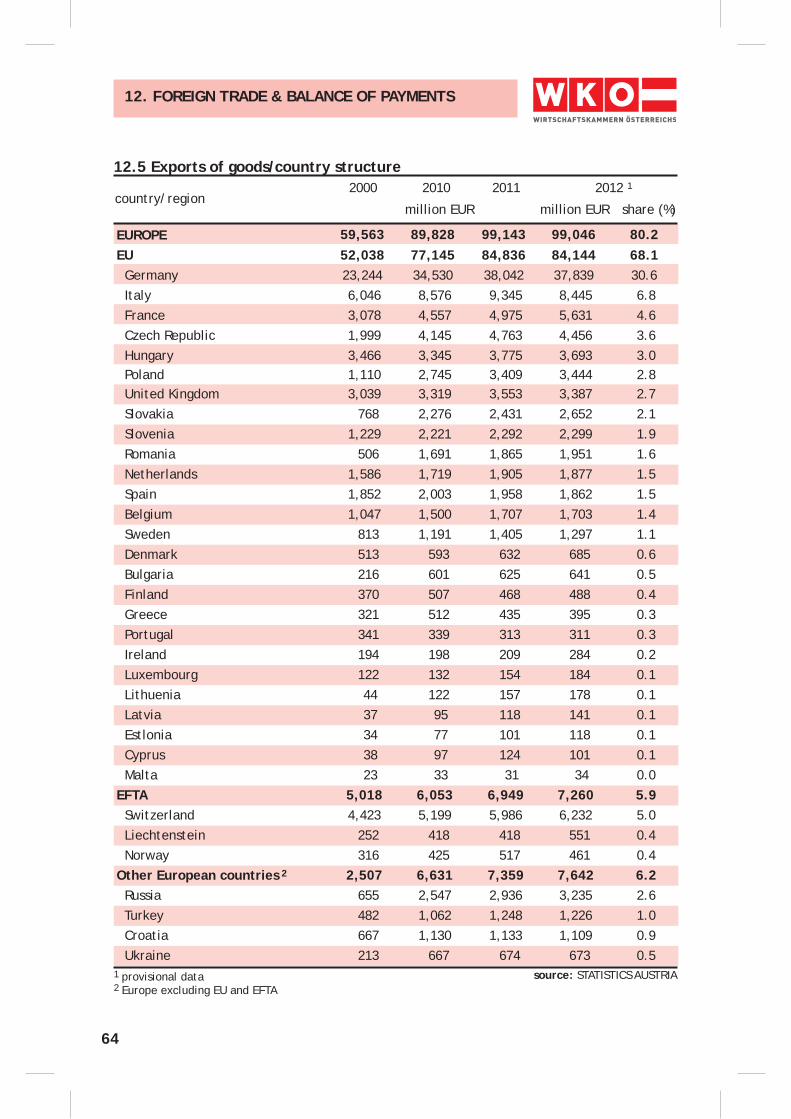
64
12.5 Exports of goods/country structure
2 Europe excluding EU and EFTA
12. FOREIGN TRADE & BALANCE OF PAYMENTS
country/regionmillion EUR
2012 12011
million EUR share (%)
1 provisional data source: STATISTICS AUSTRIA
EUROPE 59,563 89,828 99,143 99,046 80.2EU 52,038 77,145 84,836 84,144 68.1 Germany 23,244 34,530 38,042 37,839 30.6 Italy 6,046 8,576 9,345 8,445 6.8 France 3,078 4,557 4,975 5,631 4.6 Czech Republic 1,999 4,145 4,763 4,456 3.6 Hungary 3,466 3,345 3,775 3,693 3.0 Poland 1,110 2,745 3,409 3,444 2.8 United Kingdom 3,039 3,319 3,553 3,387 2.7 Slovakia 768 2,276 2,431 2,652 2.1 Slovenia 1,229 2,221 2,292 2,299 1.9 Romania 506 1,691 1,865 1,951 1.6 Netherlands 1,586 1,719 1,905 1,877 1.5 Spain 1,852 2,003 1,958 1,862 1.5 Belgium 1,047 1,500 1,707 1,703 1.4 Sweden 813 1,191 1,405 1,297 1.1 Denmark 513 593 632 685 0.6 Bulgaria 216 601 625 641 0.5 Finland 370 507 468 488 0.4 Greece 321 512 435 395 0.3 Portugal 341 339 313 311 0.3 Ireland 194 198 209 284 0.2 Luxembourg 122 132 154 184 0.1 Lithuenia 44 122 157 178 0.1 Latvia 37 95 118 141 0.1 Estlonia 34 77 101 118 0.1 Cyprus 38 97 124 101 0.1 Malta 23 33 31 34 0.0EFTA 5,018 6,053 6,949 7,260 5.9 Switzerland 4,423 5,199 5,986 6,232 5.0 Liechtenstein 252 418 418 551 0.4 Norway 316 425 517 461 0.4Other European countries 2 2,507 6,631 7,359 7,642 6.2 Russia 655 2,547 2,936 3,235 2.6 Turkey 482 1,062 1,248 1,226 1.0 Croatia 667 1,130 1,133 1,109 0.9 Ukraine 213 667 674 673 0.5
20102000
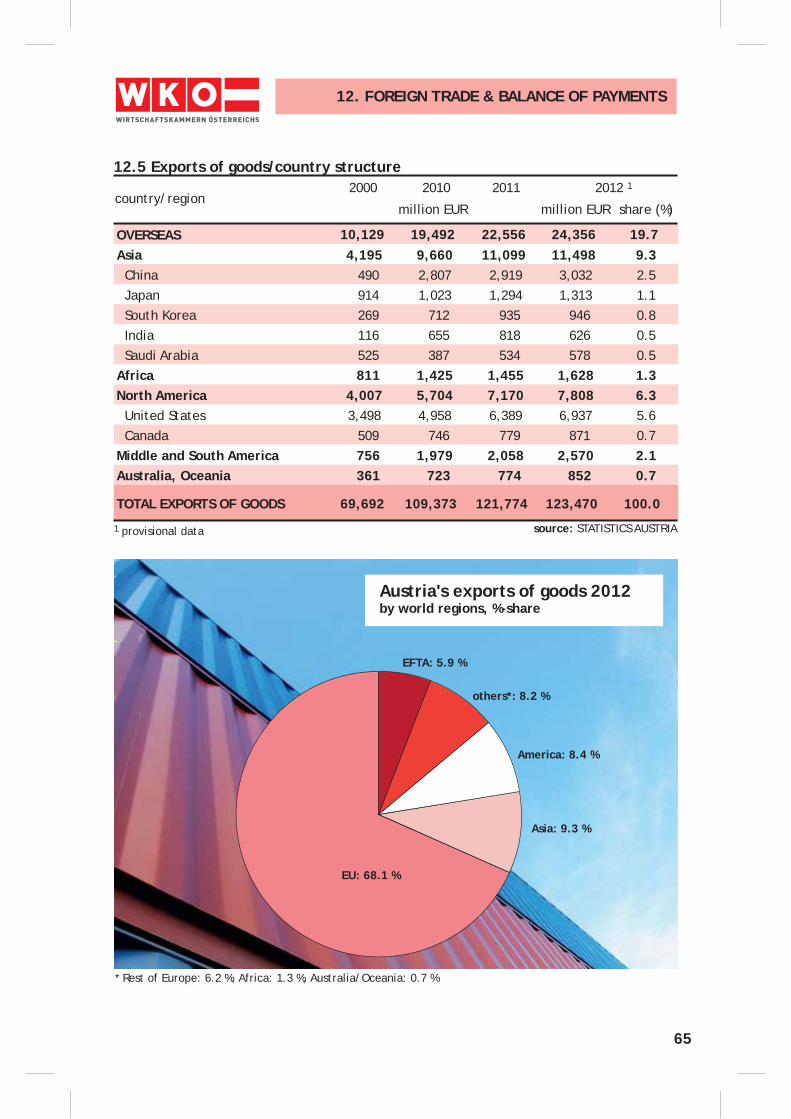
65
12.5 Exports of goods/country structure
country/regionmillion EUR
2012 12011
million EUR
1 provisional data source: STATISTICS AUSTRIA
OVERSEAS 10,129 19,492 22,556 24,356 19.7Asia 4,195 9,660 11,099 11,498 9.3 China 490 2,807 2,919 3,032 2.5 Japan 914 1,023 1,294 1,313 1.1 South Korea 269 712 935 946 0.8 India 116 655 818 626 0.5 Saudi Arabia 525 387 534 578 0.5Africa 811 1,425 1,455 1,628 1.3North America 4,007 5,704 7,170 7,808 6.3 United States 3,498 4,958 6,389 6,937 5.6 Canada 509 746 779 871 0.7Middle and South America 756 1,979 2,058 2,570 2.1Australia, Oceania 361 723 774 852 0.7
TOTAL EXPORTS OF GOODS 69,692 109,373 121,774 123,470 100.0
20102000
12. FOREIGN TRADE & BALANCE OF PAYMENTS
share (%)
Austria's exports of goods 2012 by world regions, %-share
EFTA: 5.9 %
EU: 68.1 %
Asia: 9.3 %
others*: 8.2 %
America: 8.4 %
* Rest of Europe: 6.2 %, Africa: 1.3 %, Australia/Oceania: 0.7 %
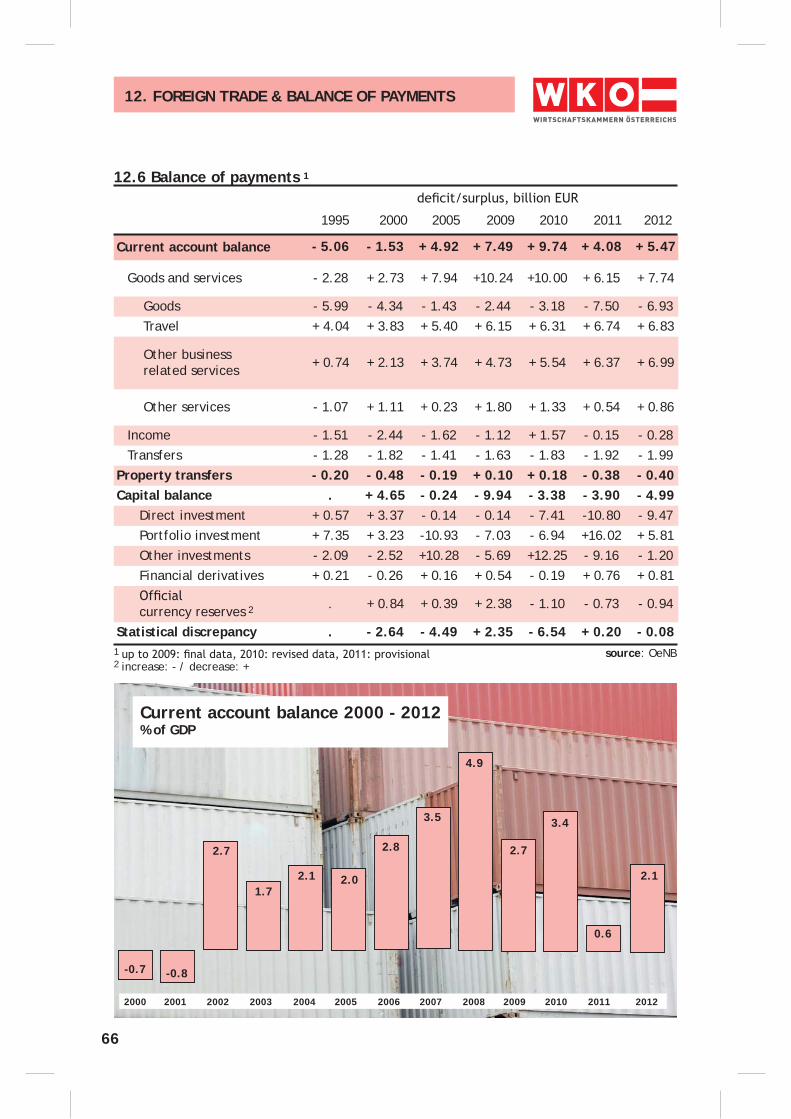
66
12.6 Balance of payments 1
12. FOREIGN TRADE & BALANCE OF PAYMENTS
1 source: OeNB
Current account balance - 5.06 - 1.53 + 4.92 + 7.49 + 9.74 + 4.08 + 5.47
Goods and services - 2.28 + 2.73 + 7.94 +10.24 +10.00 + 6.15 + 7.74
Goods - 5.99 - 4.34 - 1.43 - 2.44 - 3.18 - 7.50 - 6.93 Travel + 4.04 + 3.83 + 5.40 + 6.15 + 6.31 + 6.74 + 6.83
Other business related services + 0.74 + 2.13 + 3.74 + 4.73 + 5.54 + 6.37 + 6.99
Other services - 1.07 + 1.11 + 0.23 + 1.80 + 1.33 + 0.54 + 0.86
Income - 1.51 - 2.44 - 1.62 - 1.12 + 1.57 - 0.15 - 0.28Transfers - 1.28 - 1.82 - 1.41 - 1.63 - 1.83 - 1.92 - 1.99
Property transfers - 0.20 - 0.48 - 0.19 + 0.10 + 0.18 - 0.38 - 0.40Capital balance . + 4.65 - 0.24 - 9.94 - 3.38 - 3.90 - 4.99
Direct investment + 0.57 + 3.37 - 0.14 - 0.14 - 7.41 -10.80 - 9.47 Portfolio investment + 7.35 + 3.23 -10.93 - 7.03 - 6.94 +16.02 + 5.81 Other investments - 2.09 - 2.52 +10.28 - 5.69 +12.25 - 9.16 - 1.20 Financial derivatives + 0.21 - 0.26 + 0.16 + 0.54 - 0.19 + 0.76 + 0.81 currency reserves 2 . + 0.84 + 0.39 + 2.38 - 1.10 - 0.73 - 0.94
Statistical discrepancy . - 2.64 - 4.49 + 2.35 - 6.54 + 0.20 - 0.08
2000 1995 2005 2011 2012 2009 2010
Current account balance 2000 - 2012 % of GDP
2 increase: - / decrease: +
2000 2001 2002 2003 2004 2005 2006 2007 2008 2009
2.7
3.5
2.8
2.02.11.7
2.7
-0.8-0.7
4.9
3.4
2010
0.6
2011
2.1
2012
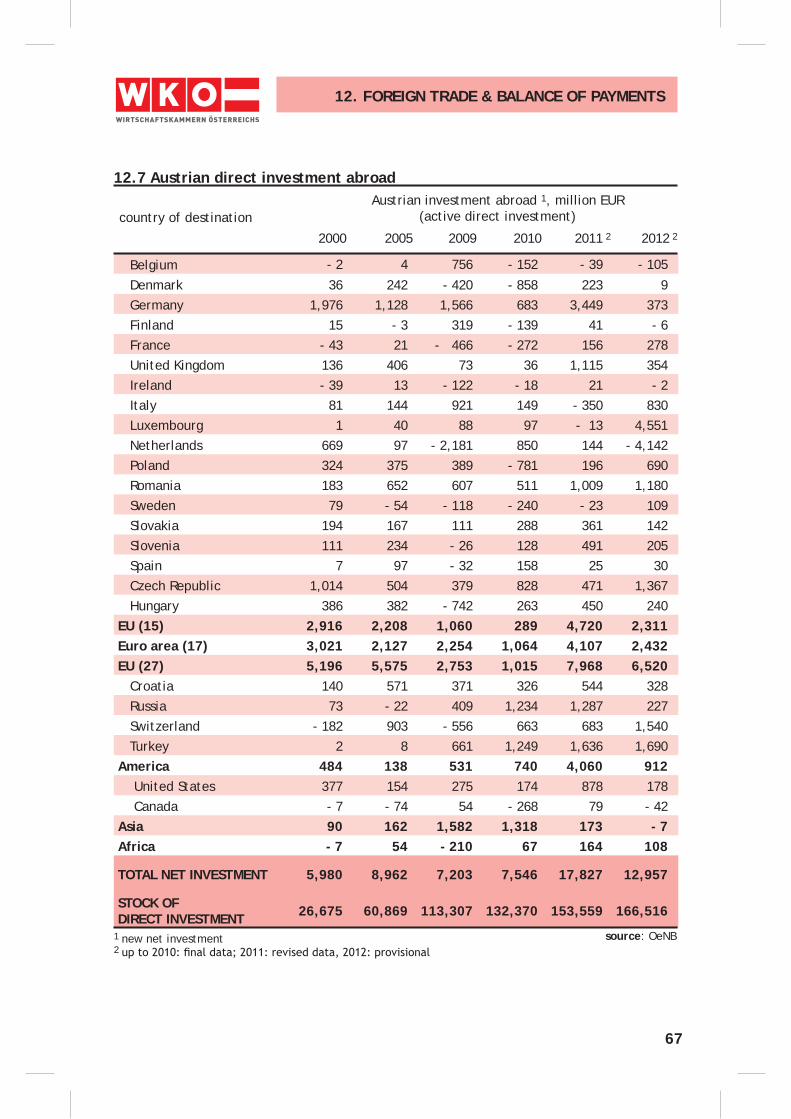
67
12.7 Austrian direct investment abroadAustrian investment abroad 1, million EUR
(active direct investment)
12. FOREIGN TRADE & BALANCE OF PAYMENTS
1 new net investment source: OeNB
Belgium - 2 4 756 - 152 - 39 - 105
Denmark 36 242 - 420 - 858 223 9 Germany 1,976 1,128 1,566 683 3,449 373 Finland 15 - 3 319 - 139 41 - 6 France - 43 21 - 466 - 272 156 278 United Kingdom 136 406 73 36 1,115 354 Ireland - 39 13 - 122 - 18 21 - 2 Italy 81 144 921 149 - 350 830 Luxembourg 1 40 88 97 - 13 4,551 Netherlands 669 97 - 2,181 850 144 - 4,142 Poland 324 375 389 - 781 196 690 Romania 183 652 607 511 1,009 1,180 Sweden 79 - 54 - 118 - 240 - 23 109 Slovakia 194 167 111 288 361 142 Slovenia 111 234 - 26 128 491 205 Spain 7 97 - 32 158 25 30 Czech Republic 1,014 504 379 828 471 1,367 Hungary 386 382 - 742 263 450 240EU (15) 2,916 2,208 1,060 289 4,720 2,311Euro area (17) 3,021 2,127 2,254 1,064 4,107 2,432EU (27) 5,196 5,575 2,753 1,015 7,968 6,520 Croatia 140 571 371 326 544 328 Russia 73 - 22 409 1,234 1,287 227 Switzerland - 182 903 - 556 663 683 1,540 Turkey 2 8 661 1,249 1,636 1,690America 484 138 531 740 4,060 912 United States 377 154 275 174 878 178 Canada - 7 - 74 54 - 268 79 - 42Asia 90 162 1,582 1,318 173 - 7Africa - 7 54 - 210 67 164 108
TOTAL NET INVESTMENT 5,980 8,962 7,203 7,546 17,827 12,957
STOCK OF DIRECT INVESTMENT 26,675 60,869 113,307 132,370 153,559 166,516
2000 2005 2011 2 2012 2 2009 2010
country of destination
2
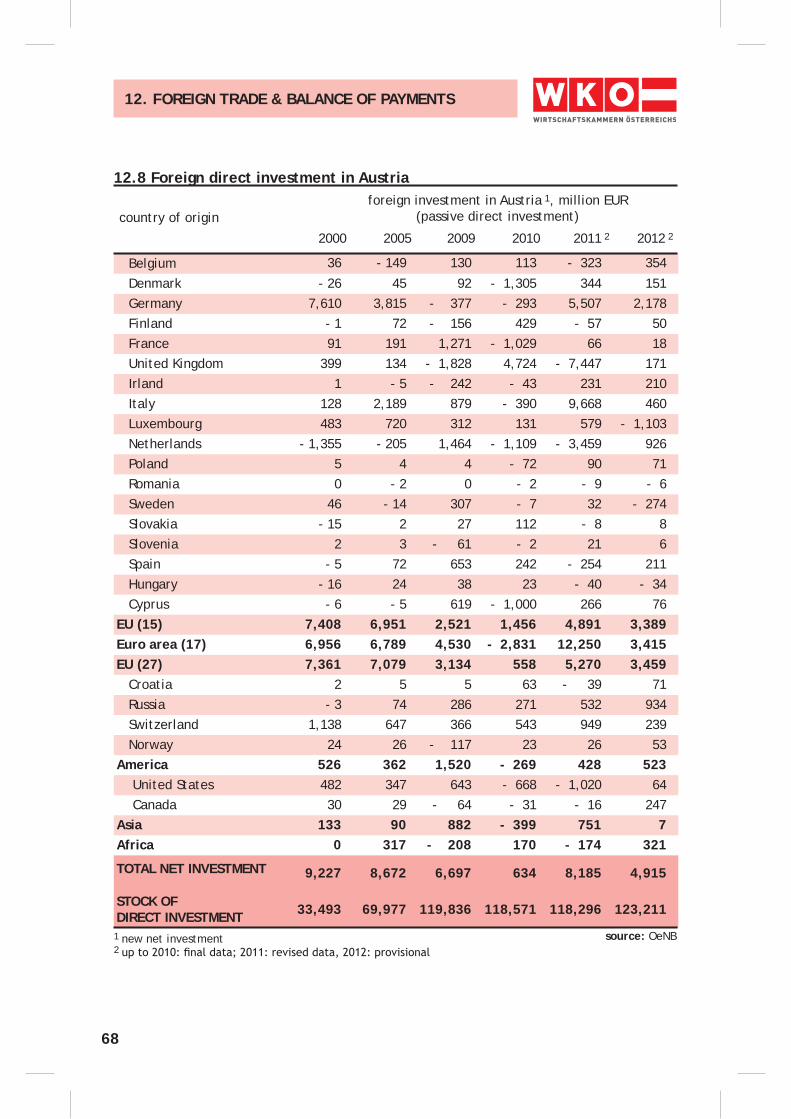
68
12.8 Foreign direct investment in Austriaforeign investment in Austria 1, million EUR
(passive direct investment)
12. FOREIGN TRADE & BALANCE OF PAYMENTS
source: OeNB
Belgium 36 - 149 130 113 - 323 354
Denmark - 26 45 92 - 1,305 344 151 Germany 7,610 3,815 - 377 - 293 5,507 2,178 Finland - 1 72 - 156 429 - 57 50 France 91 191 1,271 - 1,029 66 18 United Kingdom 399 134 - 1,828 4,724 - 7,447 171 Irland 1 - 5 - 242 - 43 231 210 Italy 128 2,189 879 - 390 9,668 460 Luxembourg 483 720 312 131 579 - 1,103 Netherlands - 1,355 - 205 1,464 - 1,109 - 3,459 926 Poland 5 4 4 - 72 90 71 Romania 0 - 2 0 - 2 - 9 - 6 Sweden 46 - 14 307 - 7 32 - 274 Slovakia - 15 2 27 112 - 8 8 Slovenia 2 3 - 61 - 2 21 6 Spain - 5 72 653 242 - 254 211 Hungary - 16 24 38 23 - 40 - 34 Cyprus - 6 - 5 619 - 1,000 266 76EU (15) 7,408 6,951 2,521 1,456 4,891 3,389Euro area (17) 6,956 6,789 4,530 - 2,831 12,250 3,415EU (27) 7,361 7,079 3,134 558 5,270 3,459 Croatia 2 5 5 63 - 39 71 Russia - 3 74 286 271 532 934 Switzerland 1,138 647 366 543 949 239 Norway 24 26 - 117 23 26 53America 526 362 1,520 - 269 428 523 United States 482 347 643 - 668 - 1,020 64 Canada 30 29 - 64 - 31 - 16 247Asia 133 90 882 - 399 751 7Africa 0 317 - 208 170 - 174 321
TOTAL NET INVESTMENT 9,227 8,672 6,697 634 8,185 4,915
STOCK OF DIRECT INVESTMENT 33,493 69,977 119,836 118,571 118,296 123,211
2000 2005 2009 2010
country of origin
2011 2 2012 2
1 new net investment2
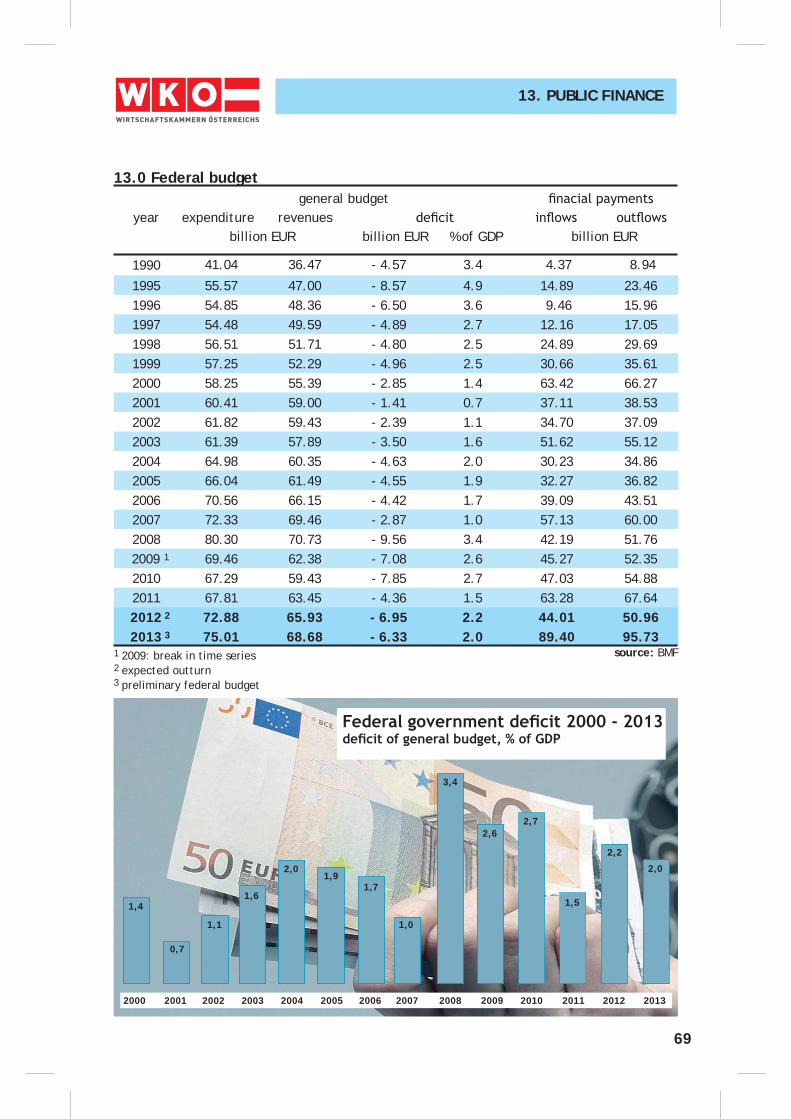
69
13. PUBLIC FINANCE
source: BMF
13.0 Federal budget
1990 41.04 36.47 - 4.57 3.4 4.37 8.94
1995 55.57 47.00 - 8.57 4.9 14.89 23.461996 54.85 48.36 - 6.50 3.6 9.46 15.961997 54.48 49.59 - 4.89 2.7 12.16 17.051998 56.51 51.71 - 4.80 2.5 24.89 29.691999 57.25 52.29 - 4.96 2.5 30.66 35.612000 58.25 55.39 - 2.85 1.4 63.42 66.272001 60.41 59.00 - 1.41 0.7 37.11 38.532002 61.82 59.43 - 2.39 1.1 34.70 37.092003 61.39 57.89 - 3.50 1.6 51.62 55.122004 64.98 60.35 - 4.63 2.0 30.23 34.862005 66.04 61.49 - 4.55 1.9 32.27 36.822006 70.56 66.15 - 4.42 1.7 39.09 43.512007 72.33 69.46 - 2.87 1.0 57.13 60.002008 80.30 70.73 - 9.56 3.4 42.19 51.76
2009 1 69.46 62.38 - 7.08 2.6 45.27 52.352010 67.29 59.43 - 7.85 2.7 47.03 54.882011 67.81 63.45 - 4.36 1.5 63.28 67.64
2012 2 72.88 65.93 - 6.95 2.2 44.01 50.96 2013 3 75.01 68.68 - 6.33 2.0 89.40 95.73
expenditureyear revenuesgeneral budget
billion EUR billion EUR % of GDP billion EUR
1 2009: break in time series 2 expected outturn3 preliminary federal budget
2000 2001 2002 2003 2004 2005 2006 2007 2008 2009 2010 2011 2012 2013
2,6
3,4
1,0
1,71,9
2,0
1,6
1,1
0,7
1,4
2,7
1,5
2,2
2,0
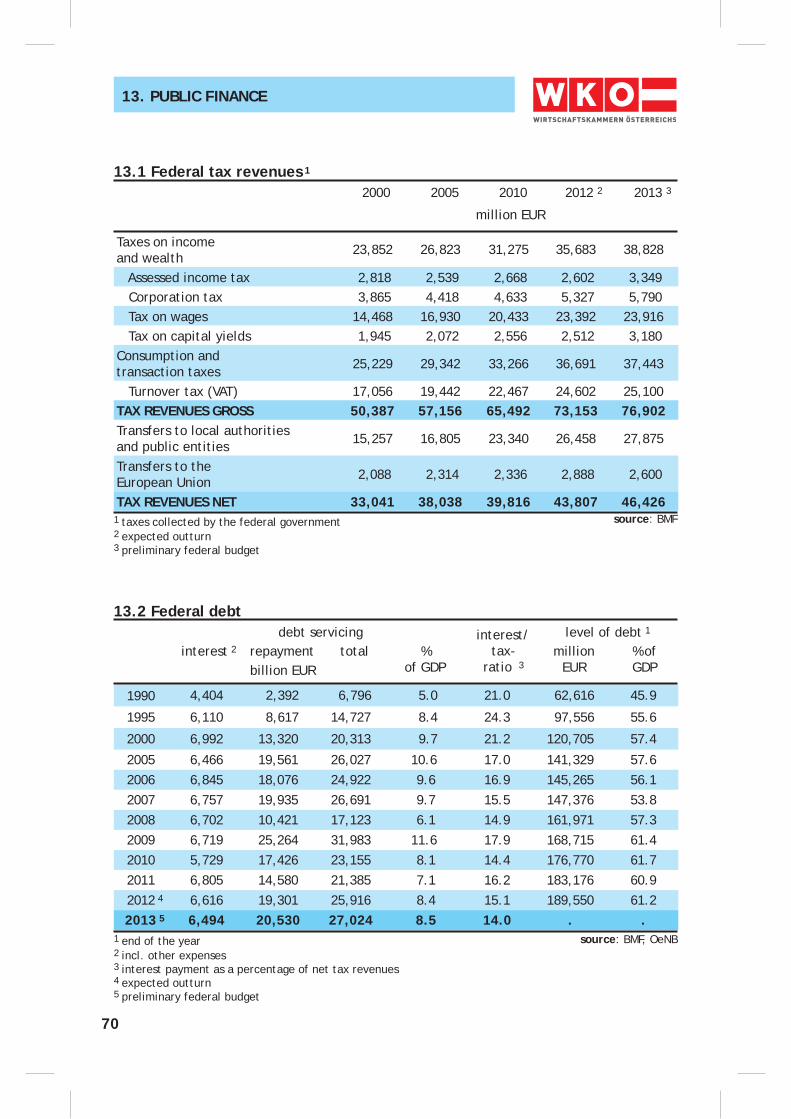
70
13.1 Federal tax revenues 1
million EUR
2012 22010
source: BMF
Taxes on income and wealth
23,852 26,823 31,275 35,683 38,828
Assessed income tax 2,818 2,539 2,668 2,602 3,349 Corporation tax 3,865 4,418 4,633 5,327 5,790 Tax on wages 14,468 16,930 20,433 23,392 23,916 Tax on capital yields 1,945 2,072 2,556 2,512 3,180Consumption andtransaction taxes 25,229 29,342 33,266 36,691 37,443
Turnover tax (VAT) 17,056 19,442 22,467 24,602 25,100TAX REVENUES GROSS 50,387 57,156 65,492 73,153 76,902Transfers to local authoritiesand public entities 15,257 16,805 23,340 26,458 27,875
Transfers to the European Union 2,088 2,314 2,336 2,888 2,600
TAX REVENUES NET 33,041 38,038 39,816 43,807 46,426
20052000
13. PUBLIC FINANCE
2013 3
2 expected outturn
1 taxes collected by the federal government
3 preliminary federal budget
13.2 Federal debtdebt servicing
1990 4,404 2,392 6,796 5.0 21.0 62,616 45.9
1995 6,110 8,617 14,727 8.4 24.3 97,556 55.6
2000 6,992 13,320 20,313 9.7 21.2 120,705 57.4
2005 6,466 19,561 26,027 10.6 17.0 141,329 57.62006 6,845 18,076 24,922 9.6 16.9 145,265 56.12007 6,757 19,935 26,691 9.7 15.5 147,376 53.82008 6,702 10,421 17,123 6.1 14.9 161,971 57.32009 6,719 25,264 31,983 11.6 17.9 168,715 61.42010 5,729 17,426 23,155 8.1 14.4 176,770 61.72011 6,805 14,580 21,385 7.1 16.2 183,176 60.9
2012 4 6,616 19,301 25,916 8.4 15.1 189,550 61.2 2013 5 6,494 20,530 27,024 8.5 14.0 . .
totalbillion EURrepaymentinterest 2
level of debt 1interest/tax-
ratio 3million
EUR% ofGDP
%of GDP
source: BMF, OeNB2 incl. other expenses
1 end of the year
3 interest payment as a percentage of net tax revenues4 expected outturn5 preliminary federal budget
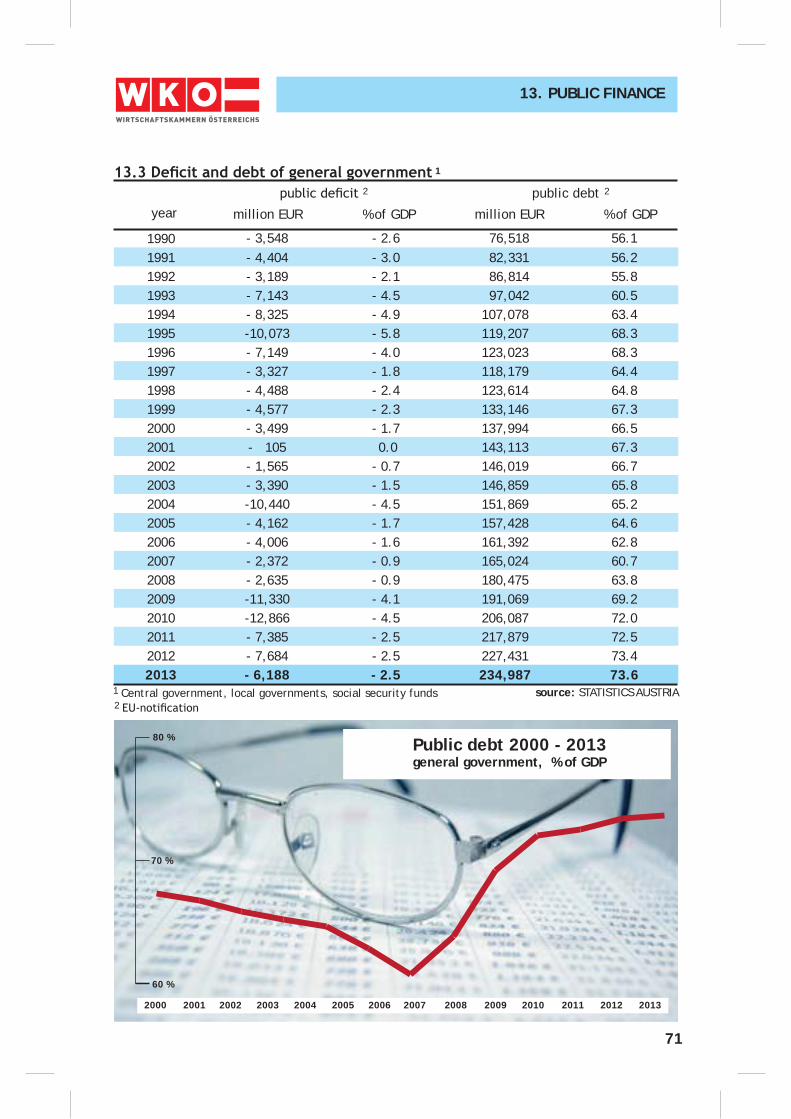
71
1 Central government, local governments, social security funds source: STATISTICS AUSTRIA2
1
1990 - 3,548 - 2.6 76,518 56.11991 - 4,404 - 3.0 82,331 56.21992 - 3,189 - 2.1 86,814 55.81993 - 7,143 - 4.5 97,042 60.51994 - 8,325 - 4.9 107,078 63.41995 -10,073 - 5.8 119,207 68.31996 - 7,149 - 4.0 123,023 68.31997 - 3,327 - 1.8 118,179 64.41998 - 4,488 - 2.4 123,614 64.81999 - 4,577 - 2.3 133,146 67.32000 - 3,499 - 1.7 137,994 66.52001 - 105 0.0 143,113 67.32002 - 1,565 - 0.7 146,019 66.72003 - 3,390 - 1.5 146,859 65.82004 -10,440 - 4.5 151,869 65.22005 - 4,162 - 1.7 157,428 64.62006 - 4,006 - 1.6 161,392 62.82007 - 2,372 - 0.9 165,024 60.72008 - 2,635 - 0.9 180,475 63.82009 -11,330 - 4.1 191,069 69.22010 -12,866 - 4.5 206,087 72.02011 - 7,385 - 2.5 217,879 72.52012 - 7,684 - 2.5 227,431 73.42013 - 6,188 - 2.5 234,987 73.6
year
2 public debt 2
million EUR million EUR % of GDP % of GDP
Public debt 2000 - 2013 general government, % of GDP
13. PUBLIC FINANCE
60 %
70 %
80 %
2000 2001 2002 2003 2004 2005 2006 2007 2008 2009 2010 2011 2012 2013
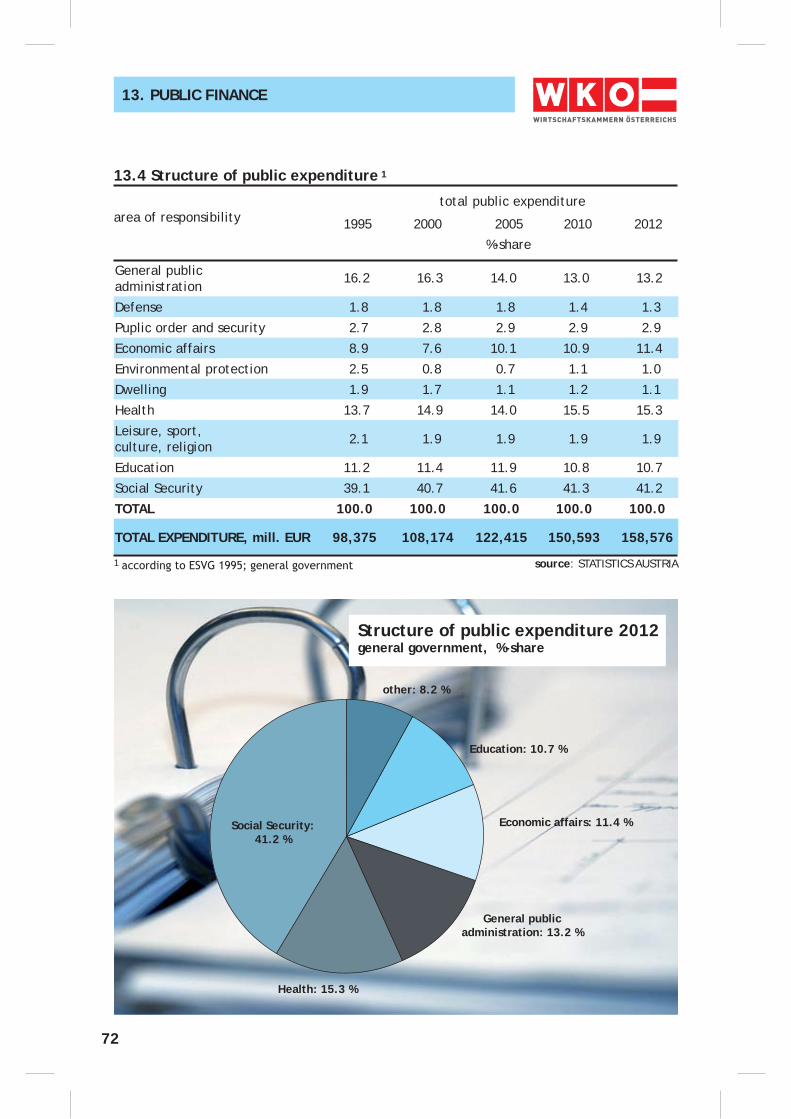
72
13.4 Structure of public expenditure 1
area of responsibilitytotal public expenditure
20102005
source: STATISTICS AUSTRIA
General publicadministration
16.2 16.3 14.0 13.0 13.2
Defense 1.8 1.8 1.8 1.4 1.3
Puplic order and security 2.7 2.8 2.9 2.9 2.9
Economic affairs 8.9 7.6 10.1 10.9 11.4
Environmental protection 2.5 0.8 0.7 1.1 1.0
Dwelling 1.9 1.7 1.1 1.2 1.1
Health 13.7 14.9 14.0 15.5 15.3
Leisure, sport,culture, religion 2.1 1.9 1.9 1.9 1.9
Education 11.2 11.4 11.9 10.8 10.7
Social Security 39.1 40.7 41.6 41.3 41.2
TOTAL 100.0 100.0 100.0 100.0 100.0
TOTAL EXPENDITURE, mill. EUR 98,375 108,174 122,415 150,593 158,576
20001995
13. PUBLIC FINANCE
2012
1
%-share
Structure of public expenditure 2012general government, %-share
Social Security:41.2 %
Education: 10.7 %
Economic affairs: 11.4 %
General public administration: 13.2 %
Health: 15.3 %
other: 8.2 %
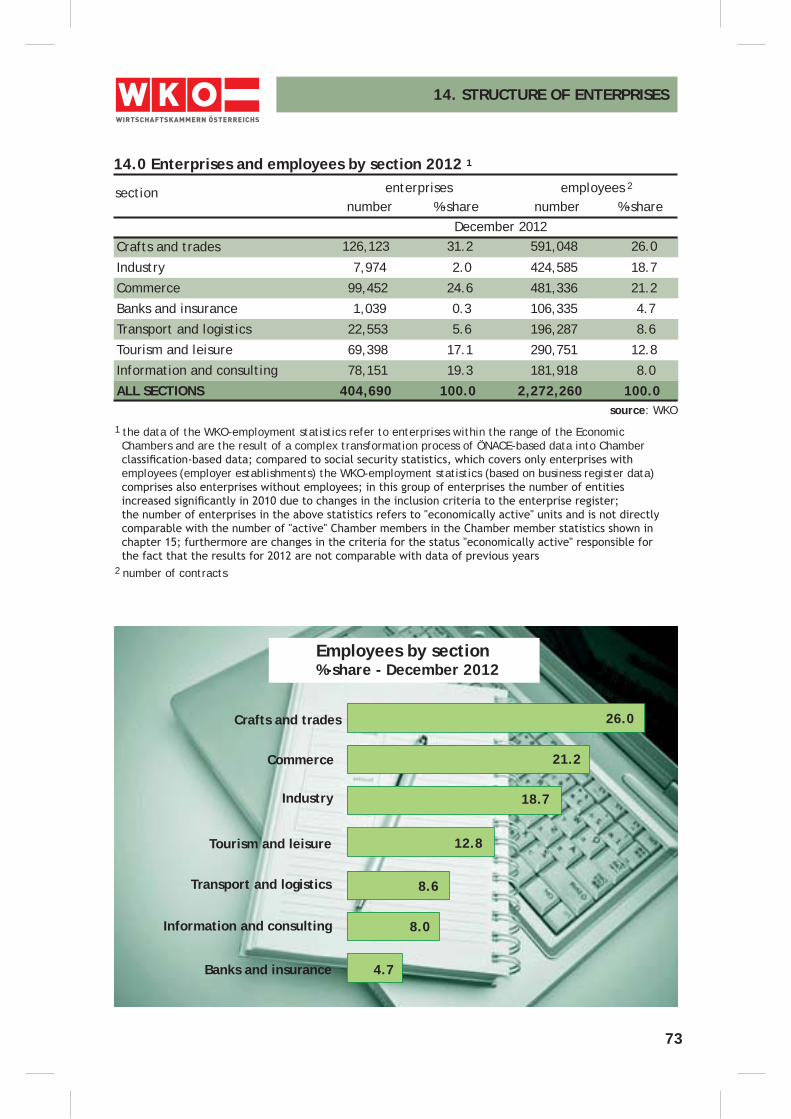
73
Crafts and trades 126,123 31.2 591,048 26.0
Industry 7,974 2.0 424,585 18.7
Commerce 99,452 24.6 481,336 21.2
Banks and insurance 1,039 0.3 106,335 4.7
Transport and logistics 22,553 5.6 196,287 8.6
Tourism and leisure 69,398 17.1 290,751 12.8
Information and consulting 78,151 19.3 181,918 8.0
ALL SECTIONS 404,690 100.0 2,272,260 100.0
14.0 Enterprises and employees by section 2012 1
section enterprises employees 2
1 the data of the WKO-employment statistics refer to enterprises within the range of the Economic Chambers and are the result of a complex transformation process of ÖNACE-based data into Chamber
employees (employer establishments) the WKO-employment statistics (based on business register data)
source: WKO
2 number of contracts
number %-share number %-shareDecember 2012
14. STRUCTURE OF ENTERPRISES
Employees by section%-share - December 2012
Crafts and trades
Information and consulting
Banks and insurance
Transport and logistics
Tourism and leisure
Industry
Commerce
26.0
4.7
8.0
8.6
12.8
18.7
21.2
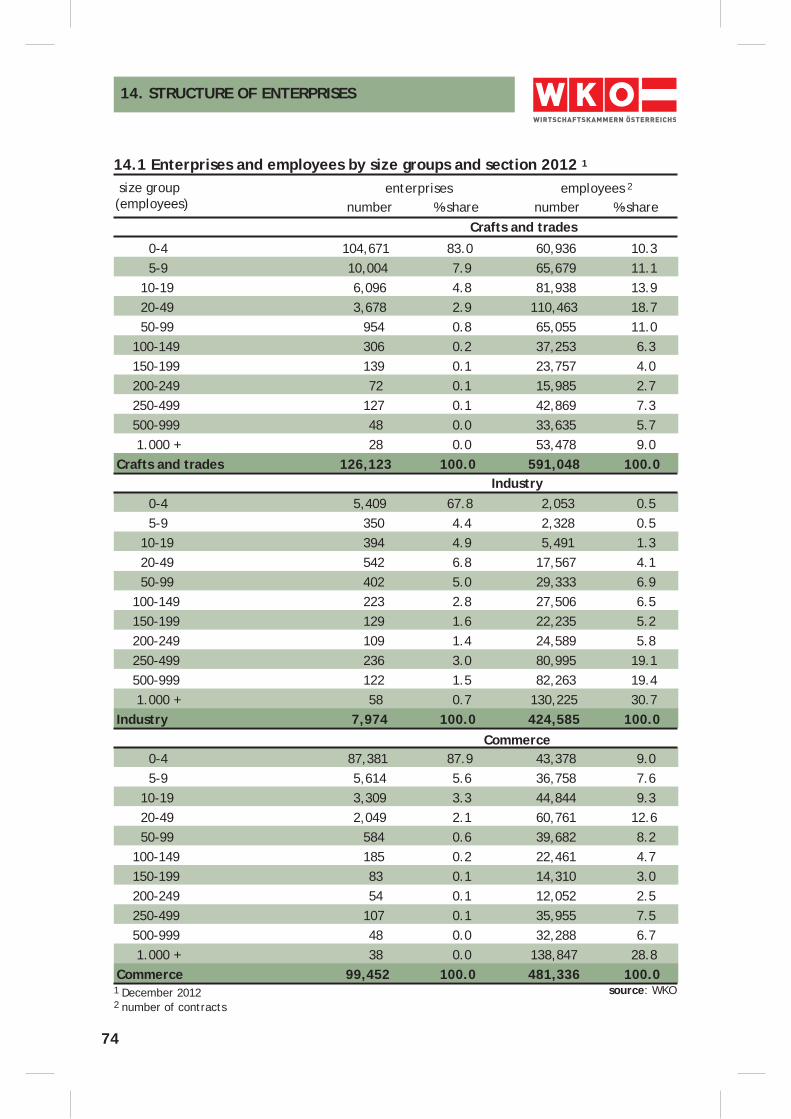
74
0-4 104,671 83.0 60,936 10.3 5-9 10,004 7.9 65,679 11.1 10-19 6,096 4.8 81,938 13.9 20-49 3,678 2.9 110,463 18.7 50-99 954 0.8 65,055 11.0 100-149 306 0.2 37,253 6.3 150-199 139 0.1 23,757 4.0 200-249 72 0.1 15,985 2.7 250-499 127 0.1 42,869 7.3 500-999 48 0.0 33,635 5.7 1.000 + 28 0.0 53,478 9.0Crafts and trades 126,123 100.0 591,048 100.0
0-4 5,409 67.8 2,053 0.5 5-9 350 4.4 2,328 0.5 10-19 394 4.9 5,491 1.3 20-49 542 6.8 17,567 4.1 50-99 402 5.0 29,333 6.9 100-149 223 2.8 27,506 6.5 150-199 129 1.6 22,235 5.2 200-249 109 1.4 24,589 5.8 250-499 236 3.0 80,995 19.1 500-999 122 1.5 82,263 19.4 1.000 + 58 0.7 130,225 30.7Industry 7,974 100.0 424,585 100.0
0-4 87,381 87.9 43,378 9.0 5-9 5,614 5.6 36,758 7.6 10-19 3,309 3.3 44,844 9.3 20-49 2,049 2.1 60,761 12.6 50-99 584 0.6 39,682 8.2 100-149 185 0.2 22,461 4.7 150-199 83 0.1 14,310 3.0 200-249 54 0.1 12,052 2.5 250-499 107 0.1 35,955 7.5 500-999 48 0.0 32,288 6.7 1.000 + 38 0.0 138,847 28.8Commerce 99,452 100.0 481,336 100.0
14.1 Enterprises and employees by size groups and section 2012 1
size group(employees)
enterprises employees 2
source: WKO2 number of contracts
number %-share number %-shareCrafts and trades
14. STRUCTURE OF ENTERPRISES
Industry
Commerce
1 December 2012
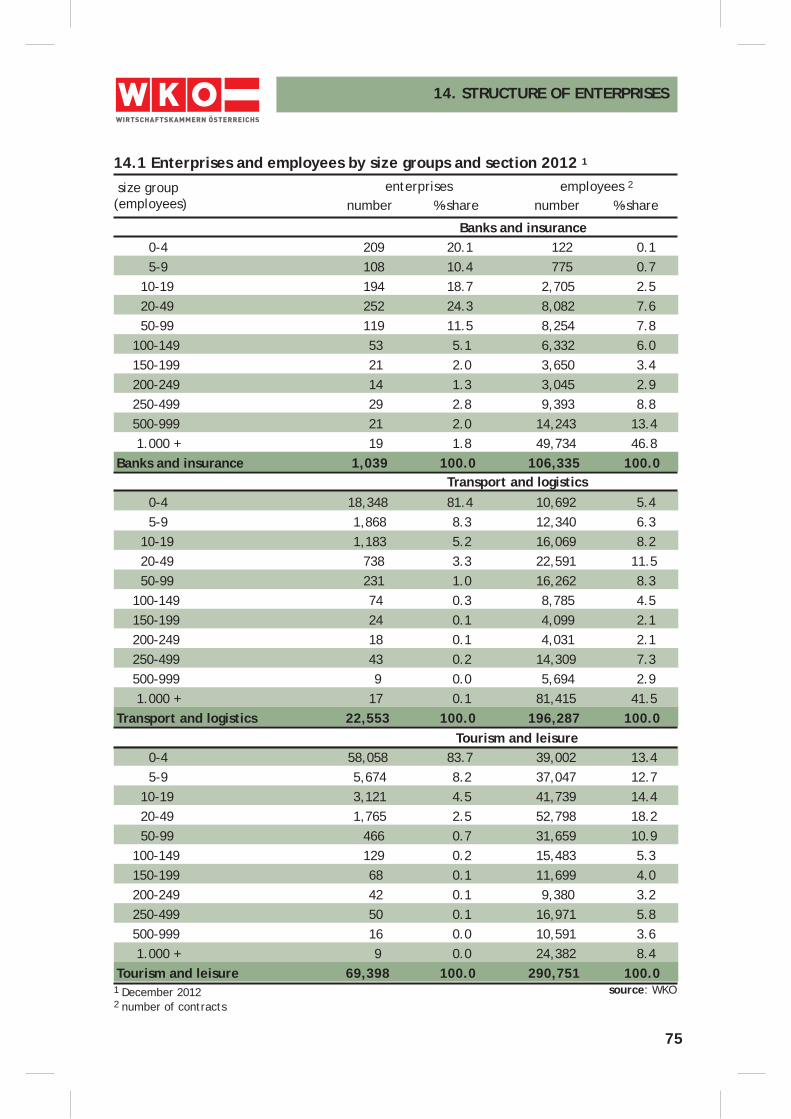
75
0-4 209 20.1 122 0.1 5-9 108 10.4 775 0.7 10-19 194 18.7 2,705 2.5 20-49 252 24.3 8,082 7.6 50-99 119 11.5 8,254 7.8 100-149 53 5.1 6,332 6.0 150-199 21 2.0 3,650 3.4 200-249 14 1.3 3,045 2.9 250-499 29 2.8 9,393 8.8 500-999 21 2.0 14,243 13.4 1.000 + 19 1.8 49,734 46.8Banks and insurance 1,039 100.0 106,335 100.0
0-4 18,348 81.4 10,692 5.4 5-9 1,868 8.3 12,340 6.3 10-19 1,183 5.2 16,069 8.2 20-49 738 3.3 22,591 11.5 50-99 231 1.0 16,262 8.3 100-149 74 0.3 8,785 4.5 150-199 24 0.1 4,099 2.1 200-249 18 0.1 4,031 2.1 250-499 43 0.2 14,309 7.3 500-999 9 0.0 5,694 2.9 1.000 + 17 0.1 81,415 41.5Transport and logistics 22,553 100.0 196,287 100.0
0-4 58,058 83.7 39,002 13.4 5-9 5,674 8.2 37,047 12.7 10-19 3,121 4.5 41,739 14.4 20-49 1,765 2.5 52,798 18.2 50-99 466 0.7 31,659 10.9 100-149 129 0.2 15,483 5.3 150-199 68 0.1 11,699 4.0 200-249 42 0.1 9,380 3.2 250-499 50 0.1 16,971 5.8 500-999 16 0.0 10,591 3.6 1.000 + 9 0.0 24,382 8.4Tourism and leisure 69,398 100.0 290,751 100.0
14.1 Enterprises and employees by size groups and section 2012 1
enterprises employees 2
source: WKO2 number of contracts
number %-share number %-share
Banks and insurance
14. STRUCTURE OF ENTERPRISES
Transport and logistics
Tourism and leisure
1 December 2012
size group(employees)
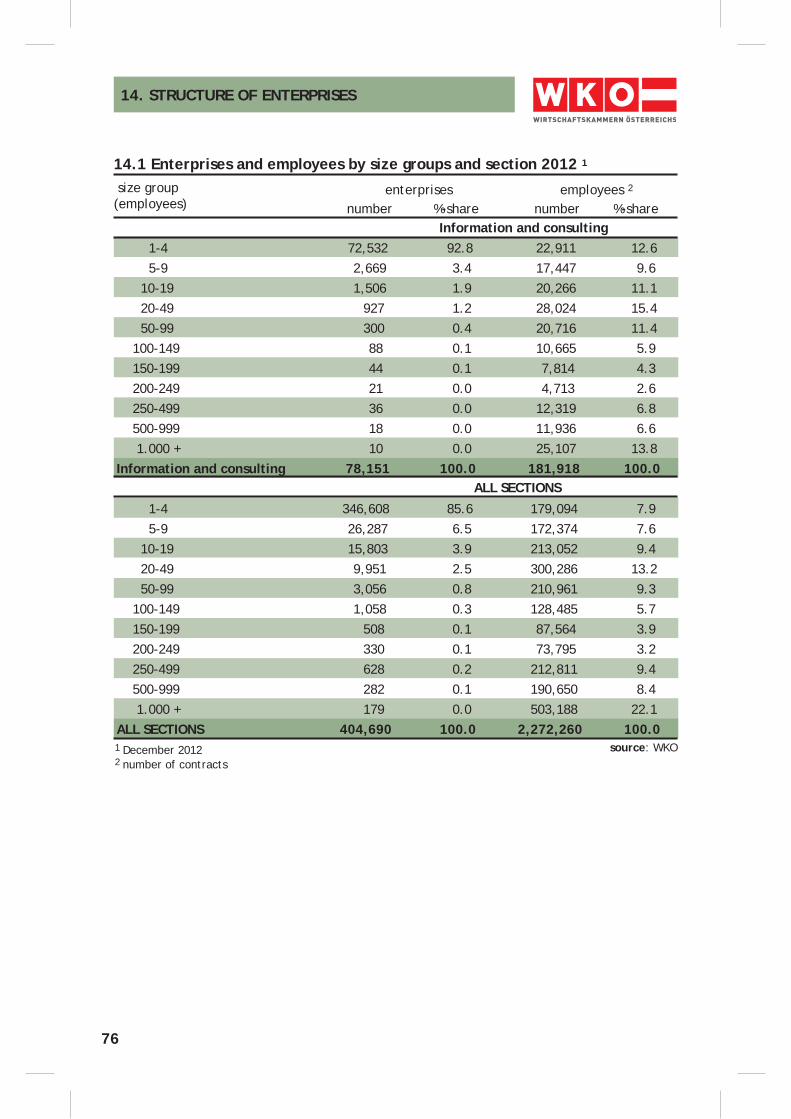
76
1-4 72,532 92.8 22,911 12.6 5-9 2,669 3.4 17,447 9.6 10-19 1,506 1.9 20,266 11.1 20-49 927 1.2 28,024 15.4 50-99 300 0.4 20,716 11.4 100-149 88 0.1 10,665 5.9 150-199 44 0.1 7,814 4.3 200-249 21 0.0 4,713 2.6 250-499 36 0.0 12,319 6.8 500-999 18 0.0 11,936 6.6 1.000 + 10 0.0 25,107 13.8Information and consulting 78,151 100.0 181,918 100.0
1-4 346,608 85.6 179,094 7.9 5-9 26,287 6.5 172,374 7.6 10-19 15,803 3.9 213,052 9.4 20-49 9,951 2.5 300,286 13.2 50-99 3,056 0.8 210,961 9.3 100-149 1,058 0.3 128,485 5.7 150-199 508 0.1 87,564 3.9 200-249 330 0.1 73,795 3.2 250-499 628 0.2 212,811 9.4 500-999 282 0.1 190,650 8.4 1.000 + 179 0.0 503,188 22.1ALL SECTIONS 404,690 100.0 2,272,260 100.0
14.1 Enterprises and employees by size groups and section 2012 1
enterprises employees 2
source: WKO2 number of contracts
number %-share number %-shareInformation and consulting
14. STRUCTURE OF ENTERPRISES
ALL SECTIONS
1 December 2012
size group(employees)
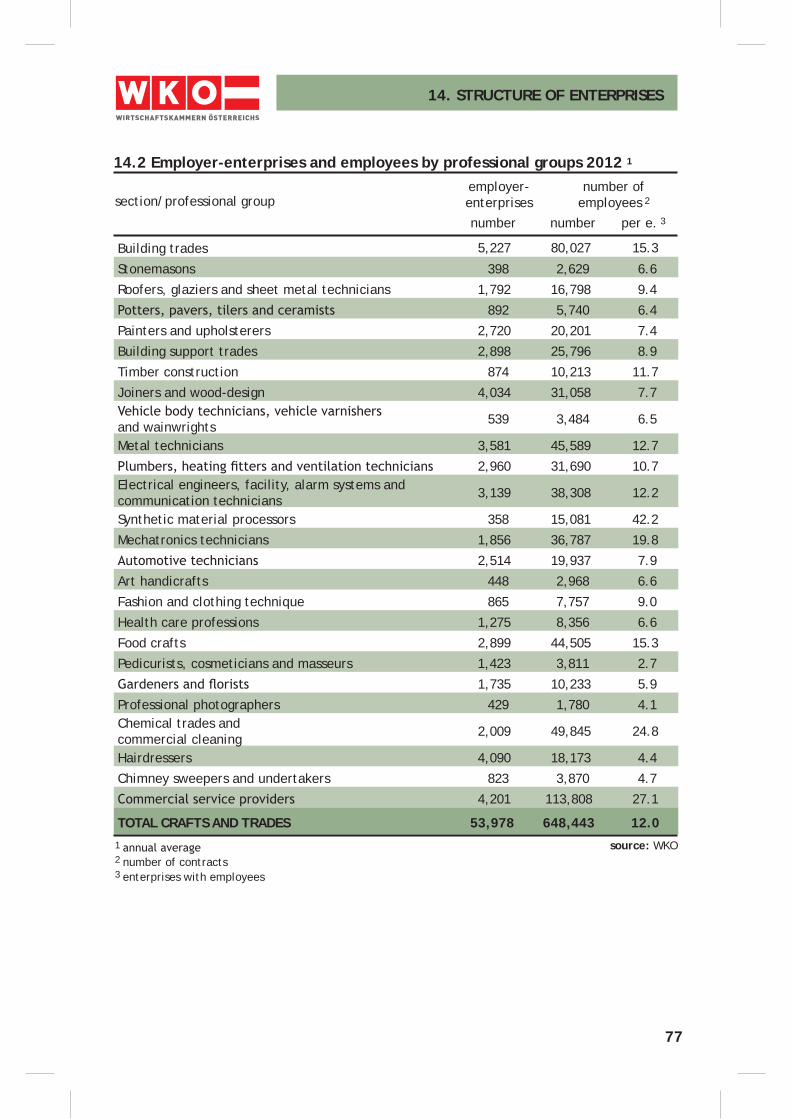
77
source: WKO
employer-enterprisessection/professional group
14.2 Employer-enterprises and employees by professional groups 2012 1
number of employees 2
number per e. 3number
14. STRUCTURE OF ENTERPRISES
2 number of contracts
1
3 enterprises with employees
Building trades 5,227 80,027 15.3
Stonemasons 398 2,629 6.6
Roofers, glaziers and sheet metal technicians 1,792 16,798 9.4
892 5,740 6.4
Painters and upholsterers 2,720 20,201 7.4
Building support trades 2,898 25,796 8.9
Timber construction 874 10,213 11.7
Joiners and wood-design 4,034 31,058 7.7
and wainwrights 539 3,484 6.5
Metal technicians 3,581 45,589 12.7
2,960 31,690 10.7Electrical engineers, facility, alarm systems and communication technicians 3,139 38,308 12.2
Synthetic material processors 358 15,081 42.2
Mechatronics technicians 1,856 36,787 19.8
2,514 19,937 7.9
Art handicrafts 448 2,968 6.6
Fashion and clothing technique 865 7,757 9.0
Health care professions 1,275 8,356 6.6
Food crafts 2,899 44,505 15.3
Pedicurists, cosmeticians and masseurs 1,423 3,811 2.7
1,735 10,233 5.9
Professional photographers 429 1,780 4.1Chemical trades and commercial cleaning 2,009 49,845 24.8
Hairdressers 4,090 18,173 4.4
Chimney sweepers and undertakers 823 3,870 4.7
4,201 113,808 27.1
TOTAL CRAFTS AND TRADES 53,978 648,443 12.0
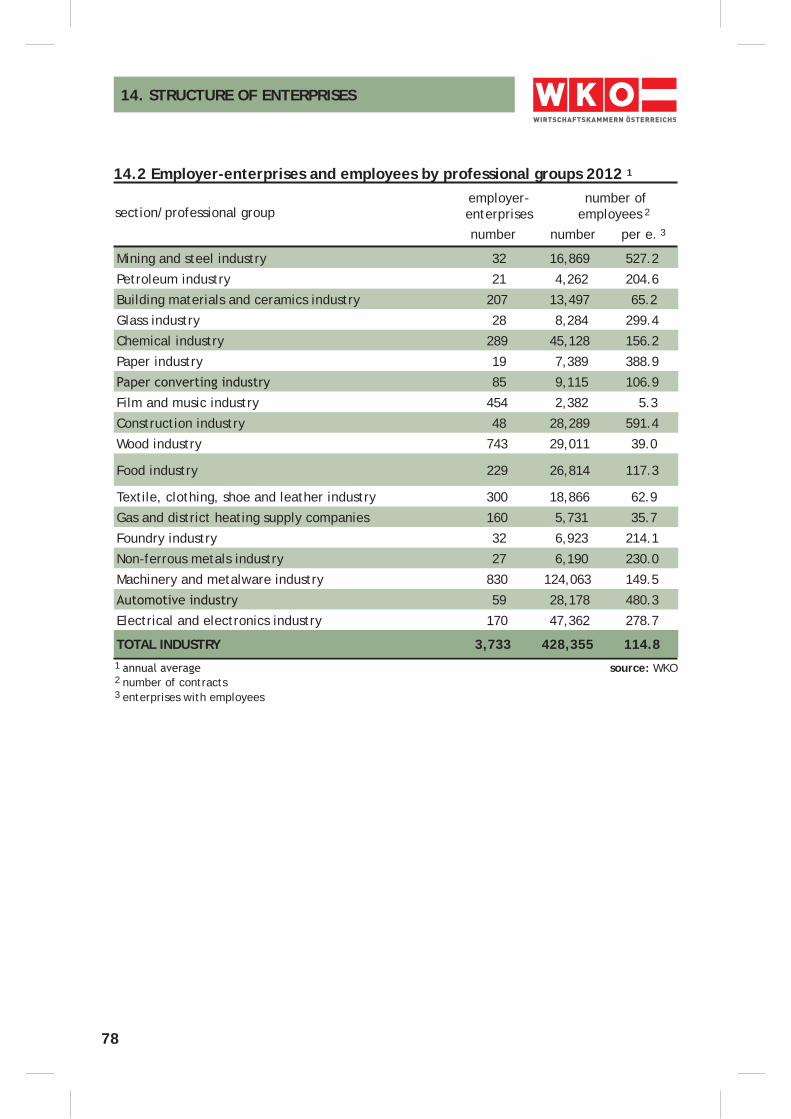
78
source: WKO
employer-enterprisessection/professional group
14.2 Employer-enterprises and employees by professional groups 2012 1
number of employees 2
number per e. 3number
14. STRUCTURE OF ENTERPRISES
2 number of contracts
1
3 enterprises with employees
Mining and steel industry 32 16,869 527.2
Petroleum industry 21 4,262 204.6
Building materials and ceramics industry 207 13,497 65.2
Glass industry 28 8,284 299.4
Chemical industry 289 45,128 156.2
Paper industry 19 7,389 388.9
85 9,115 106.9
Film and music industry 454 2,382 5.3
Construction industry 48 28,289 591.4
Wood industry 743 29,011 39.0
Food industry 229 26,814 117.3
Textile, clothing, shoe and leather industry 300 18,866 62.9
Gas and district heating supply companies 160 5,731 35.7
Foundry industry 32 6,923 214.1
Non-ferrous metals industry 27 6,190 230.0
Machinery and metalware industry 830 124,063 149.5
59 28,178 480.3
Electrical and electronics industry 170 47,362 278.7
TOTAL INDUSTRY 3,733 428,355 114.8
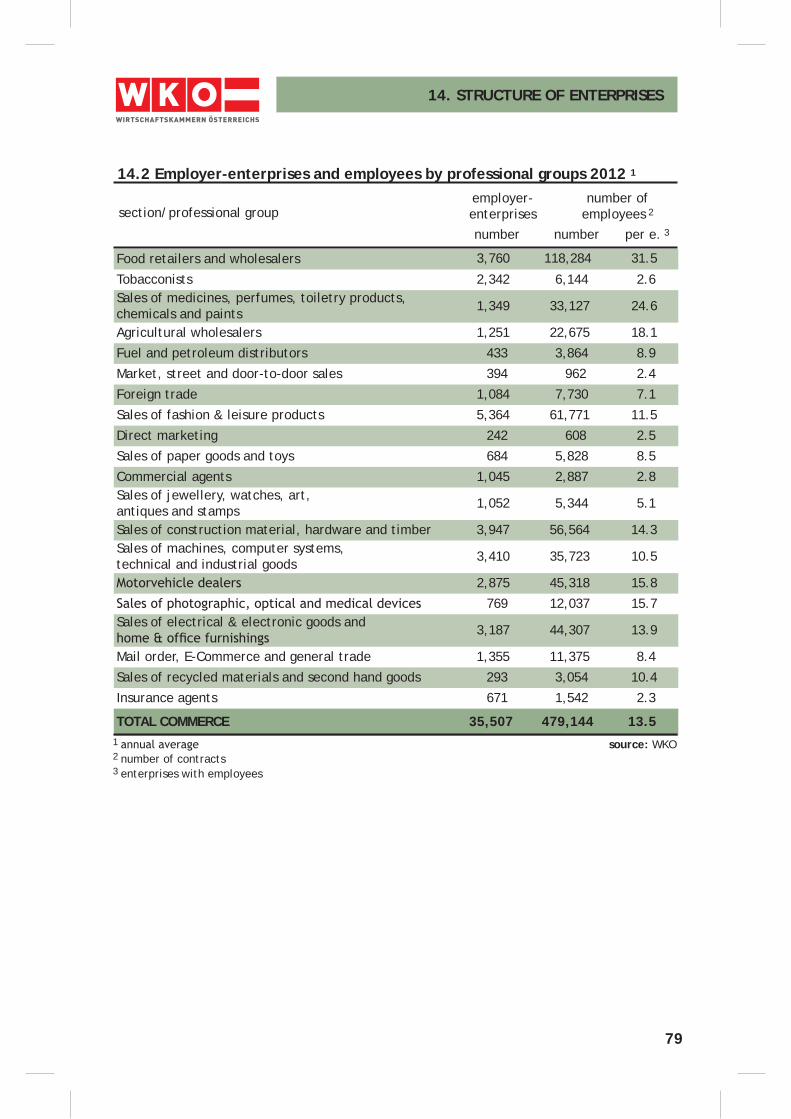
79
source: WKO
employer-enterprisessection/professional group
14.2 Employer-enterprises and employees by professional groups 2012 1
number of employees 2
number per e. 3number
14. STRUCTURE OF ENTERPRISES
2 number of contracts
1
3 enterprises with employees
Food retailers and wholesalers 3,760 118,284 31.5
Tobacconists 2,342 6,144 2.6Sales of medicines, perfumes, toiletry products, chemicals and paints 1,349 33,127 24.6
Agricultural wholesalers 1,251 22,675 18.1
Fuel and petroleum distributors 433 3,864 8.9
Market, street and door-to-door sales 394 962 2.4
Foreign trade 1,084 7,730 7.1
Sales of fashion & leisure products 5,364 61,771 11.5
Direct marketing 242 608 2.5
Sales of paper goods and toys 684 5,828 8.5
Commercial agents 1,045 2,887 2.8Sales of jewellery, watches, art, antiques and stamps 1,052 5,344 5.1
Sales of construction material, hardware and timber 3,947 56,564 14.3Sales of machines, computer systems, technical and industrial goods 3,410 35,723 10.5
2,875 45,318 15.8
769 12,037 15.7Sales of electrical & electronic goods and 3,187 44,307 13.9
Mail order, E-Commerce and general trade 1,355 11,375 8.4
Sales of recycled materials and second hand goods 293 3,054 10.4
Insurance agents 671 1,542 2.3
TOTAL COMMERCE 35,507 479,144 13.5
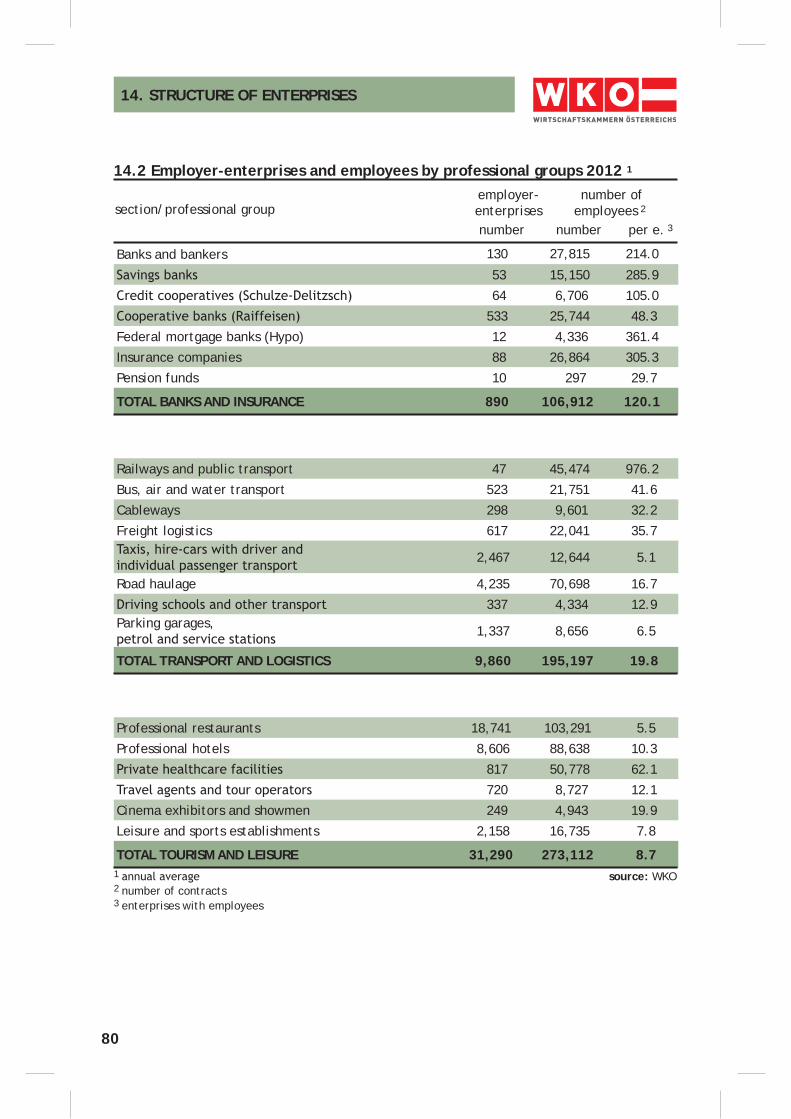
80
source: WKO
employer-enterprisessection/professional group
14.2 Employer-enterprises and employees by professional groups 2012 1
number of employees 2
14. STRUCTURE OF ENTERPRISES
2 number of contracts
1
3 enterprises with employees
Banks and bankers 130 27,815 214.0
53 15,150 285.9
64 6,706 105.0
533 25,744 48.3
Federal mortgage banks (Hypo) 12 4,336 361.4
Insurance companies 88 26,864 305.3
Pension funds 10 297 29.7
TOTAL BANKS AND INSURANCE 890 106,912 120.1
Railways and public transport 47 45,474 976.2
Bus, air and water transport 523 21,751 41.6
Cableways 298 9,601 32.2
Freight logistics 617 22,041 35.7
2,467 12,644 5.1
Road haulage 4,235 70,698 16.7
337 4,334 12.9Parking garages, 1,337 8,656 6.5
TOTAL TRANSPORT AND LOGISTICS 9,860 195,197 19.8
Professional restaurants 18,741 103,291 5.5
Professional hotels 8,606 88,638 10.3
817 50,778 62.1
720 8,727 12.1
Cinema exhibitors and showmen 249 4,943 19.9
Leisure and sports establishments 2,158 16,735 7.8
TOTAL TOURISM AND LEISURE 31,290 273,112 8.7
number per e. 3number
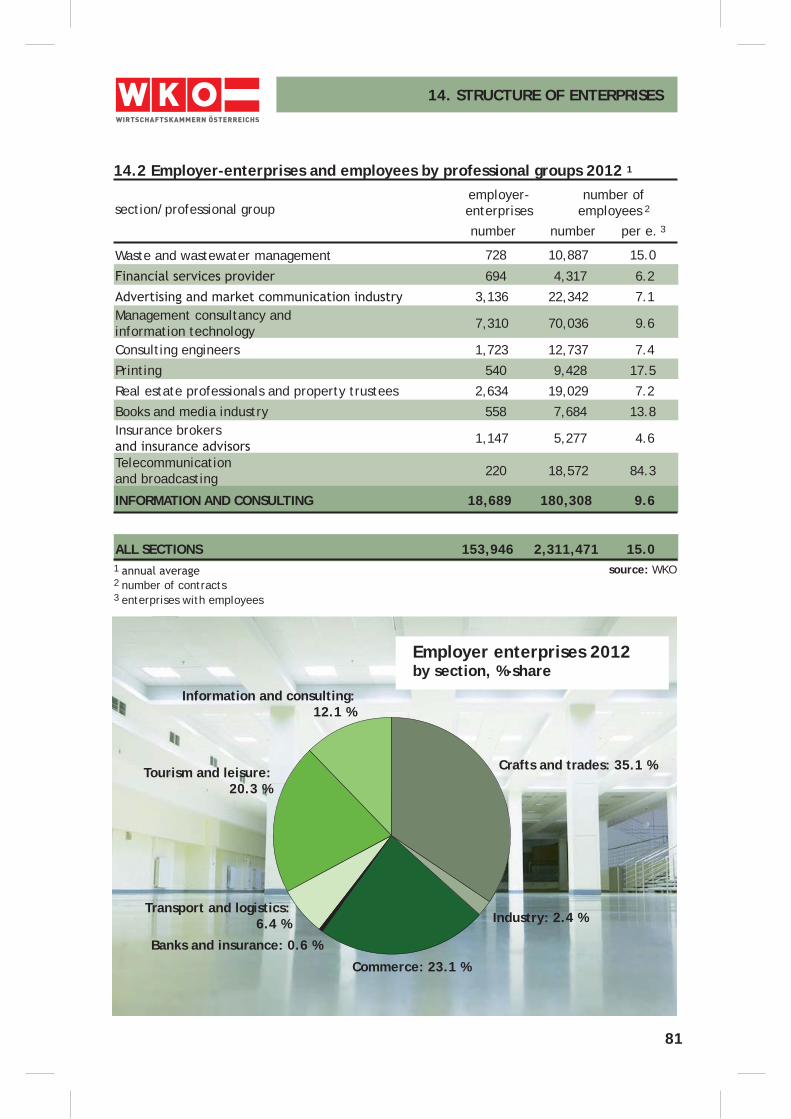
81
14. STRUCTURE OF ENTERPRISES
employer-enterprisessection/professional group
14.2 Employer-enterprises and employees by professional groups 2012 1
number of employees 2
number per e. 3number
source: WKO2 number of contracts
1
3 enterprises with employees
Commerce: 23.1 %
Crafts and trades: 35.1 %
Banks and insurance: 0.6 %
Industry: 2.4 %
Information and consulting: 12.1 %
Tourism and leisure: 20.3 %
Transport and logistics: 6.4 %
Employer enterprises 2012by section, %-share
Waste and wastewater management 728 10,887 15.0
694 4,317 6.2
3,136 22,342 7.1Management consultancy and information technology 7,310 70,036 9.6
Consulting engineers 1,723 12,737 7.4
Printing 540 9,428 17.5
Real estate professionals and property trustees 2,634 19,029 7.2
Books and media industry 558 7,684 13.8Insurance brokers 1,147 5,277 4.6
Telecommunication and broadcasting 220 18,572 84.3
INFORMATION AND CONSULTING 18,689 180,308 9.6
ALL SECTIONS 153,946 2,311,471 15.0
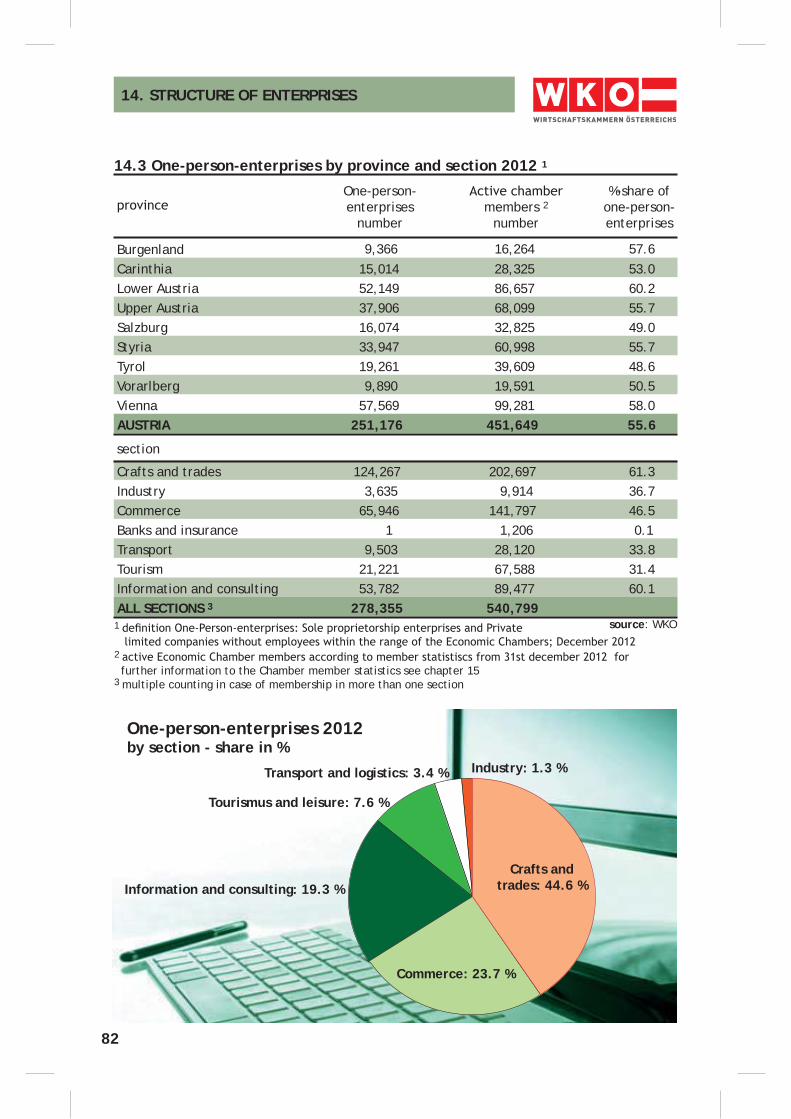
82
14. STRUCTURE OF ENTERPRISES
14.3 One-person-enterprises by province and section 2012 1
One-person-enterprises
numbermembers 2
number
%-share of one-person-enterprises
Burgenland 9,366 16,264 57.6Carinthia 15,014 28,325 53.0Lower Austria 52,149 86,657 60.2Upper Austria 37,906 68,099 55.7Salzburg 16,074 32,825 49.0Styria 33,947 60,998 55.7Tyrol 19,261 39,609 48.6Vorarlberg 9,890 19,591 50.5Vienna 57,569 99,281 58.0AUSTRIA 251,176 451,649 55.6
Crafts and trades 124,267 202,697 61.3Industry 3,635 9,914 36.7Commerce 65,946 141,797 46.5Banks and insurance 1 1,206 0.1Transport 9,503 28,120 33.8Tourism 21,221 67,588 31.4Information and consulting 53,782 89,477 60.1ALL SECTIONS 3 278,355 540,799
section
1
2
further information to the Chamber member statistics see chapter 15
source: WKO
3 multiple counting in case of membership in more than one section
Commerce: 23.7 %
Crafts and trades: 44.6 %
Industry: 1.3 %
Information and consulting: 19.3 %
Tourismus and leisure: 7.6 %
Transport and logistics: 3.4 %
One-person-enterprises 2012by section - share in %
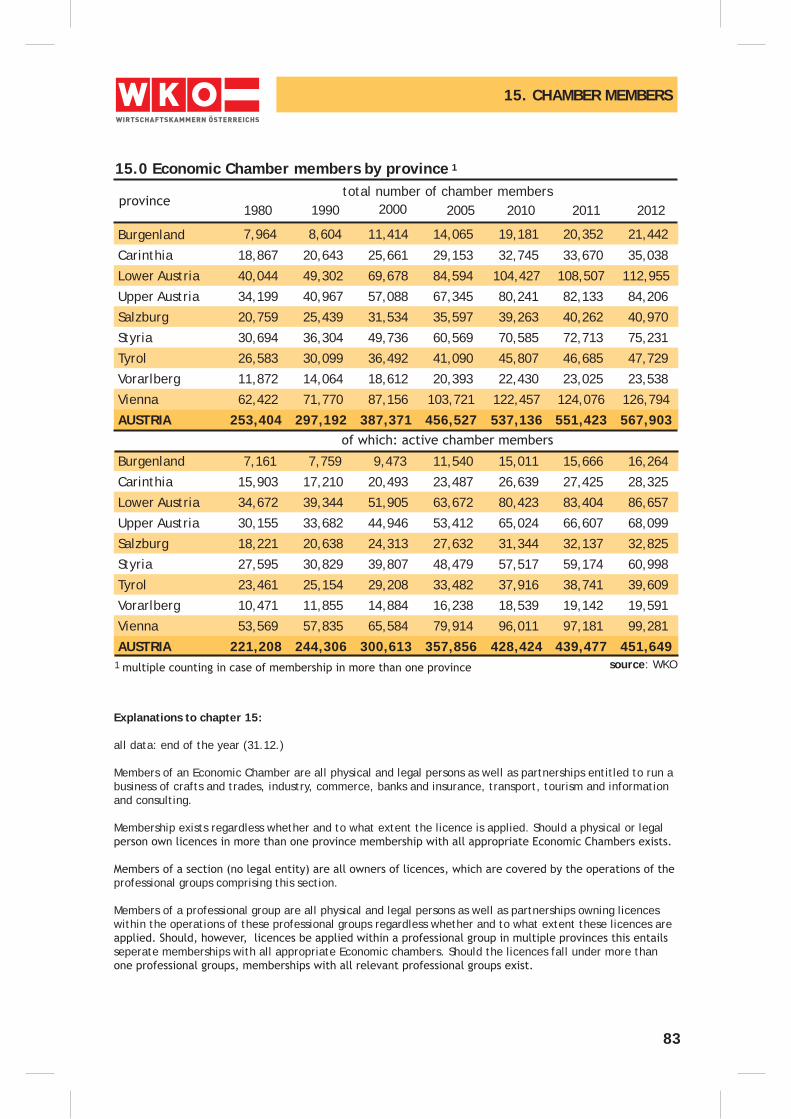
83
Burgenland 7,964 8,604 11,414 14,065 19,181 20,352 21,442
Carinthia 18,867 20,643 25,661 29,153 32,745 33,670 35,038
Lower Austria 40,044 49,302 69,678 84,594 104,427 108,507 112,955
Upper Austria 34,199 40,967 57,088 67,345 80,241 82,133 84,206
Salzburg 20,759 25,439 31,534 35,597 39,263 40,262 40,970
Styria 30,694 36,304 49,736 60,569 70,585 72,713 75,231
Tyrol 26,583 30,099 36,492 41,090 45,807 46,685 47,729
Vorarlberg 11,872 14,064 18,612 20,393 22,430 23,025 23,538
Vienna 62,422 71,770 87,156 103,721 122,457 124,076 126,794
AUSTRIA 253,404 297,192 387,371 456,527 537,136 551,423 567,903
Burgenland 7,161 7,759 9,473 11,540 15,011 15,666 16,264
Carinthia 15,903 17,210 20,493 23,487 26,639 27,425 28,325
Lower Austria 34,672 39,344 51,905 63,672 80,423 83,404 86,657
Upper Austria 30,155 33,682 44,946 53,412 65,024 66,607 68,099
Salzburg 18,221 20,638 24,313 27,632 31,344 32,137 32,825
Styria 27,595 30,829 39,807 48,479 57,517 59,174 60,998
Tyrol 23,461 25,154 29,208 33,482 37,916 38,741 39,609
Vorarlberg 10,471 11,855 14,884 16,238 18,539 19,142 19,591
Vienna 53,569 57,835 65,584 79,914 96,011 97,181 99,281
AUSTRIA 221,208 244,306 300,613 357,856 428,424 439,477 451,649
15.0 Economic Chamber members by province 1
total number of chamber members 1990 2000
15. CHAMBER MEMBERS
1980 2010
1
2005 2011 2012
Explanations to chapter 15:
all data: end of the year (31.12.)
Members of an Economic Chamber are all physical and legal persons as well as partnerships entitled to run a business of crafts and trades, industry, commerce, banks and insurance, transport, tourism and information and consulting.
Membership exists regardless whether and to what extent the licence is applied. Should a physical or legal
professional groups comprising this section.
Members of a professional group are all physical and legal persons as well as partnerships owning licences within the operations of these professional groups regardless whether and to what extent these licences are
seperate memberships with all appropriate Economic chambers. Should the licences fall under more than
source: WKO
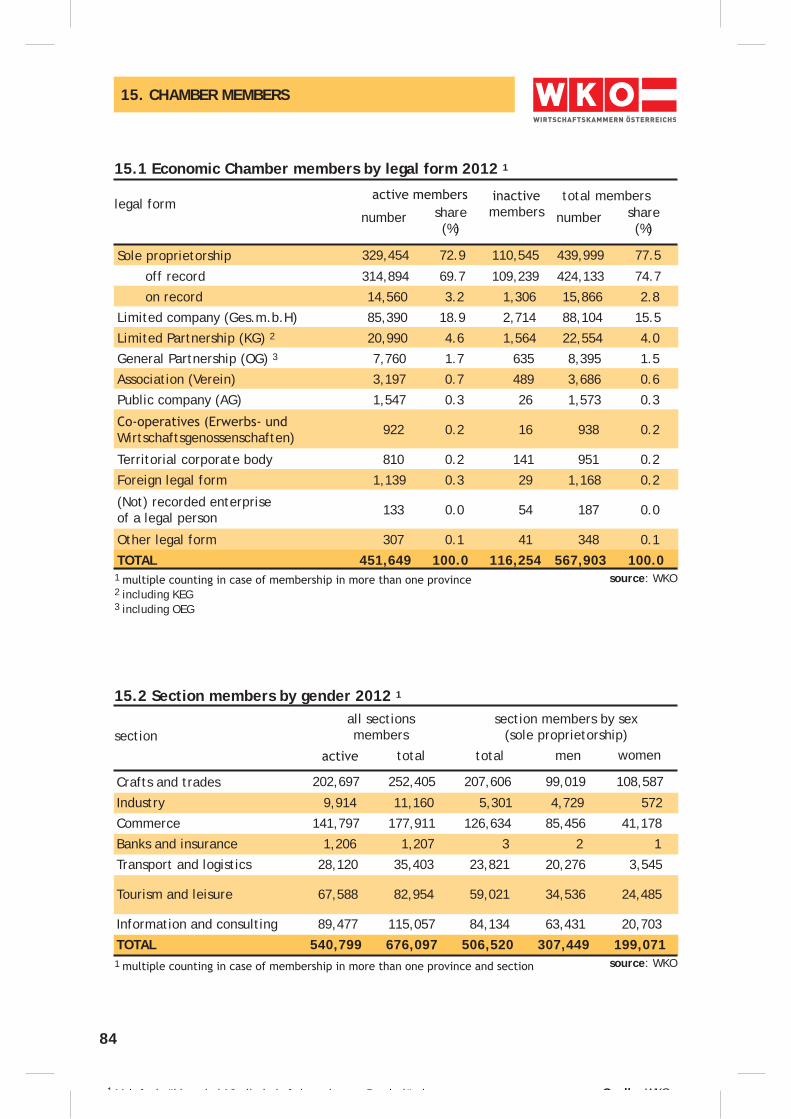
84
15. CHAMBER MEMBERS
Sole proprietorship 329,454 72.9 110,545 439,999 77.5
off record 314,894 69.7 109,239 424,133 74.7
on record 14,560 3.2 1,306 15,866 2.8
Limited company (Ges.m.b.H) 85,390 18.9 2,714 88,104 15.5
Limited Partnership (KG) 2 20,990 4.6 1,564 22,554 4.0
General Partnership (OG) 3 7,760 1.7 635 8,395 1.5
Association (Verein) 3,197 0.7 489 3,686 0.6
Public company (AG) 1,547 0.3 26 1,573 0.3
Wirtschaftsgenossenschaften) 922 0.2 16 938 0.2
Territorial corporate body 810 0.2 141 951 0.2
Foreign legal form 1,139 0.3 29 1,168 0.2
(Not) recorded enterpriseof a legal person 133 0.0 54 187 0.0
Other legal form 307 0.1 41 348 0.1
TOTAL 451,649 100.0 116,254 567,903 100.0
15.1 Economic Chamber members by legal form 2012 1
legal formshare(%)
number
1 source: WKO
total membersmembers number share
(%)
Crafts and trades 202,697 252,405 207,606 99,019 108,587
Industry 9,914 11,160 5,301 4,729 572
Commerce 141,797 177,911 126,634 85,456 41,178
Banks and insurance 1,206 1,207 3 2 1
Transport and logistics 28,120 35,403 23,821 20,276 3,545
Tourism and leisure 67,588 82,954 59,021 34,536 24,485
Information and consulting 89,477 115,057 84,134 63,431 20,703
TOTAL 540,799 676,097 506,520 307,449 199,071
15.2 Section members by gender 2012 1
sectionall sectionsmembers
1 M h f h ähl b i Mit li d h ft i h B d lä d Q ll WKO
section members by sex(sole proprietorship)
men
1 source: WKO
total women total
2 including KEG3 including OEG
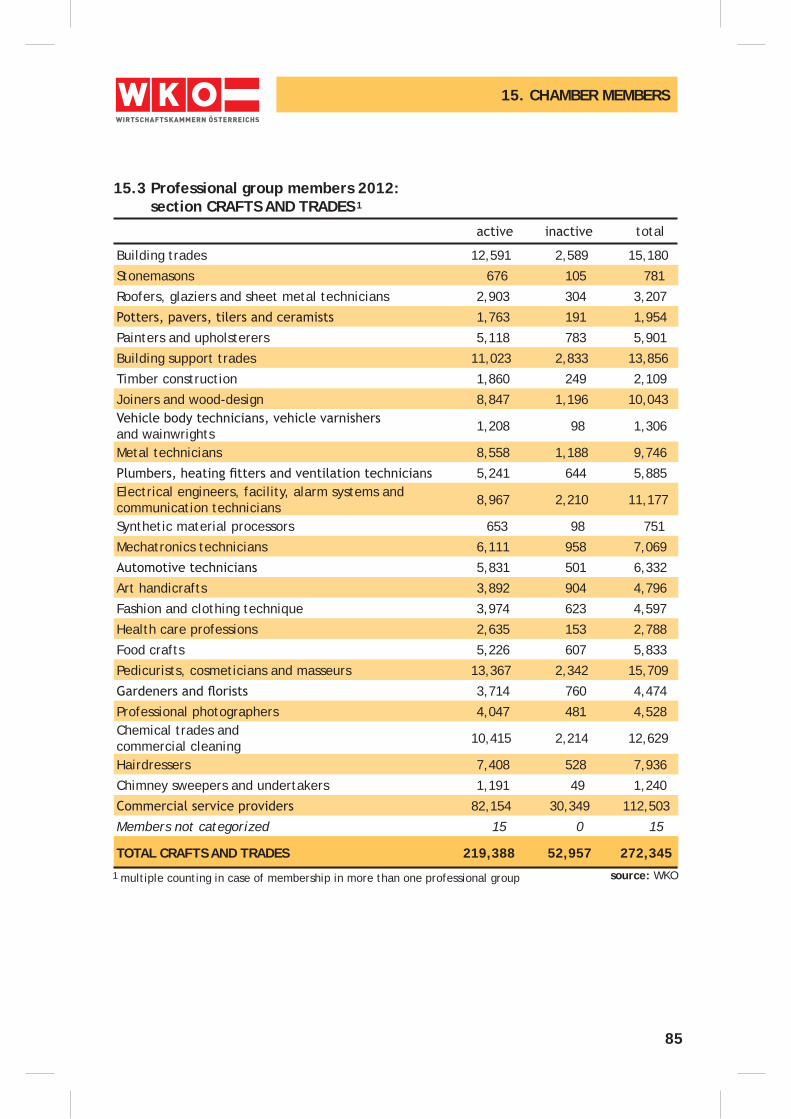
85
total
1 multiple counting in case of membership in more than one professional group source: WKO
15.3 Professional group members 2012: section CRAFTS AND TRADES 1
15. CHAMBER MEMBERS
Building trades 12,591 2,589 15,180
Stonemasons 676 105 781
Roofers, glaziers and sheet metal technicians 2,903 304 3,207
1,763 191 1,954
Painters and upholsterers 5,118 783 5,901
Building support trades 11,023 2,833 13,856
Timber construction 1,860 249 2,109
Joiners and wood-design 8,847 1,196 10,043
and wainwrights 1,208 98 1,306
Metal technicians 8,558 1,188 9,746
5,241 644 5,885Electrical engineers, facility, alarm systems and communication technicians 8,967 2,210 11,177
Synthetic material processors 653 98 751
Mechatronics technicians 6,111 958 7,069
5,831 501 6,332
Art handicrafts 3,892 904 4,796
Fashion and clothing technique 3,974 623 4,597
Health care professions 2,635 153 2,788
Food crafts 5,226 607 5,833
Pedicurists, cosmeticians and masseurs 13,367 2,342 15,709
3,714 760 4,474
Professional photographers 4,047 481 4,528Chemical trades and commercial cleaning 10,415 2,214 12,629
Hairdressers 7,408 528 7,936
Chimney sweepers and undertakers 1,191 49 1,240
82,154 30,349 112,503
Members not categorized 15 0 15
TOTAL CRAFTS AND TRADES 219,388 52,957 272,345
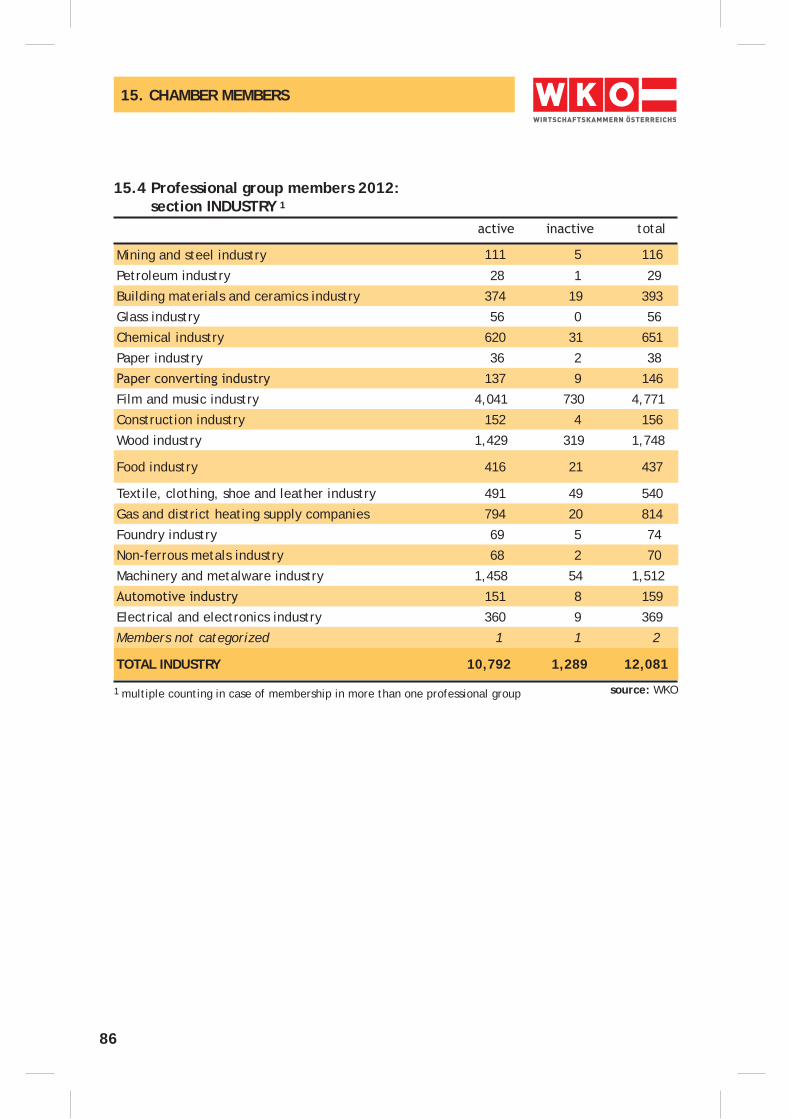
86
15. CHAMBER MEMBERS
15.4 Professional group members 2012: section INDUSTRY 1
1 multiple counting in case of membership in more than one professional group source: WKO
total
Mining and steel industry 111 5 116
Petroleum industry 28 1 29
Building materials and ceramics industry 374 19 393
Glass industry 56 0 56
Chemical industry 620 31 651
Paper industry 36 2 38
137 9 146
Film and music industry 4,041 730 4,771
Construction industry 152 4 156
Wood industry 1,429 319 1,748
Food industry 416 21 437
Textile, clothing, shoe and leather industry 491 49 540
Gas and district heating supply companies 794 20 814
Foundry industry 69 5 74
Non-ferrous metals industry 68 2 70
Machinery and metalware industry 1,458 54 1,512
151 8 159
Electrical and electronics industry 360 9 369
Members not categorized 1 1 2
TOTAL INDUSTRY 10,792 1,289 12,081
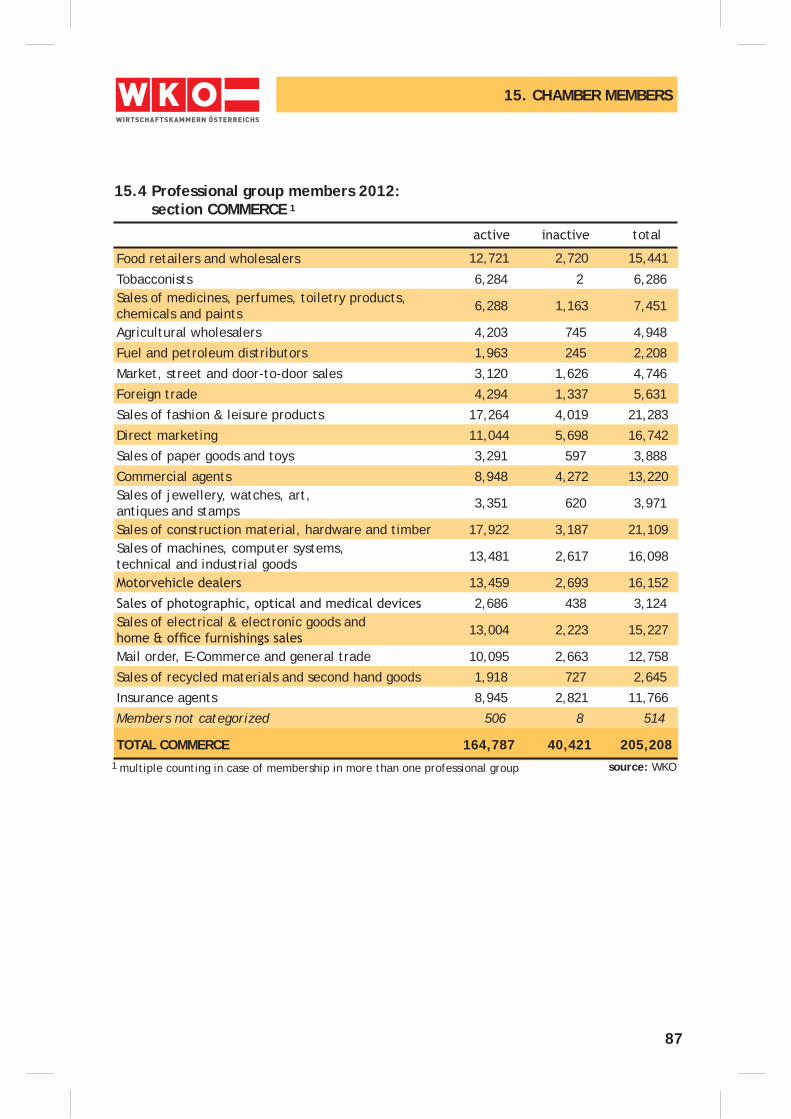
87
15. CHAMBER MEMBERS
15.4 Professional group members 2012: section COMMERCE 1
1 multiple counting in case of membership in more than one professional group source: WKO
total
Food retailers and wholesalers 12,721 2,720 15,441
Tobacconists 6,284 2 6,286Sales of medicines, perfumes, toiletry products, chemicals and paints 6,288 1,163 7,451
Agricultural wholesalers 4,203 745 4,948
Fuel and petroleum distributors 1,963 245 2,208
Market, street and door-to-door sales 3,120 1,626 4,746
Foreign trade 4,294 1,337 5,631
Sales of fashion & leisure products 17,264 4,019 21,283
Direct marketing 11,044 5,698 16,742
Sales of paper goods and toys 3,291 597 3,888
Commercial agents 8,948 4,272 13,220Sales of jewellery, watches, art, antiques and stamps 3,351 620 3,971
Sales of construction material, hardware and timber 17,922 3,187 21,109Sales of machines, computer systems, technical and industrial goods 13,481 2,617 16,098
13,459 2,693 16,152
2,686 438 3,124Sales of electrical & electronic goods and 13,004 2,223 15,227
Mail order, E-Commerce and general trade 10,095 2,663 12,758
Sales of recycled materials and second hand goods 1,918 727 2,645
Insurance agents 8,945 2,821 11,766
Members not categorized 506 8 514
TOTAL COMMERCE 164,787 40,421 205,208
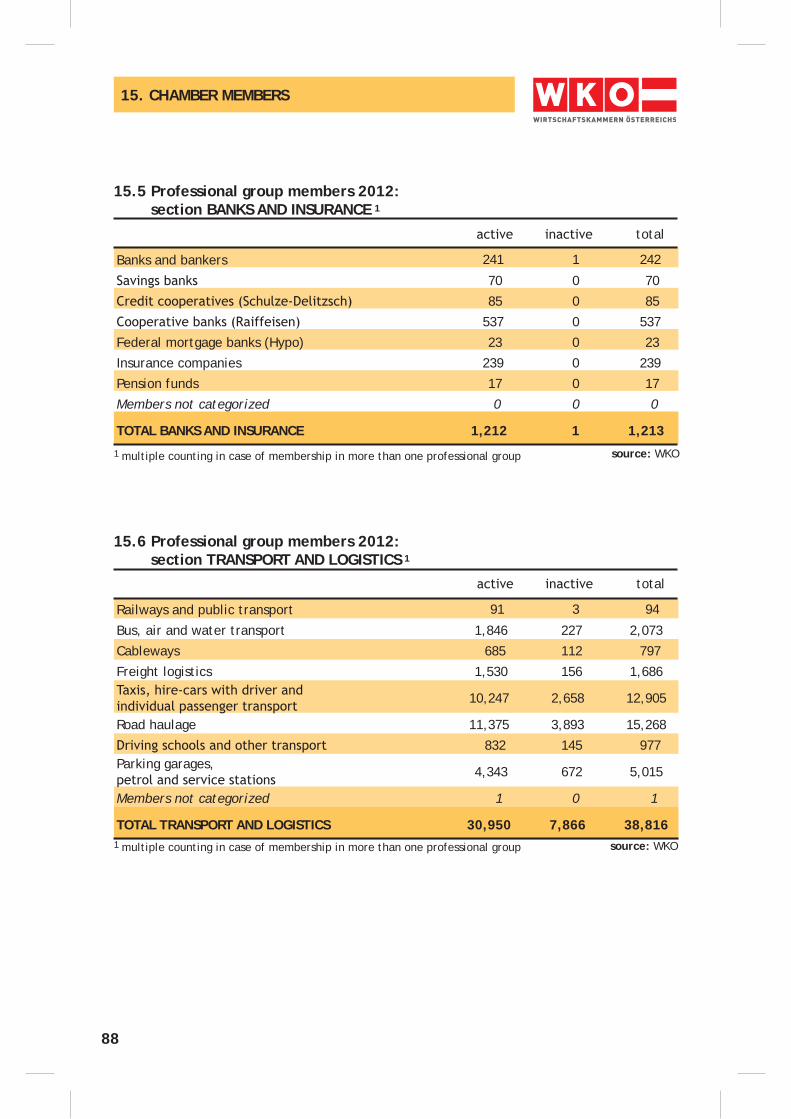
88
15. CHAMBER MEMBERS
15.5 Professional group members 2012: section BANKS AND INSURANCE 1
Banks and bankers 241 1 242
70 0 70
85 0 85
537 0 537
Federal mortgage banks (Hypo) 23 0 23
Insurance companies 239 0 239
Pension funds 17 0 17
Members not categorized 0 0 0
TOTAL BANKS AND INSURANCE 1,212 1 1,213
1 multiple counting in case of membership in more than one professional group source: WKO
15.6 Professional group members 2012: section TRANSPORT AND LOGISTICS 1
Railways and public transport 91 3 94
Bus, air and water transport 1,846 227 2,073
Cableways 685 112 797
Freight logistics 1,530 156 1,686
10,247 2,658 12,905
Road haulage 11,375 3,893 15,268
832 145 977Parking garages, 4,343 672 5,015
Members not categorized 1 0 1
TOTAL TRANSPORT AND LOGISTICS 30,950 7,866 38,816
total
total
1 multiple counting in case of membership in more than one professional group source: WKO
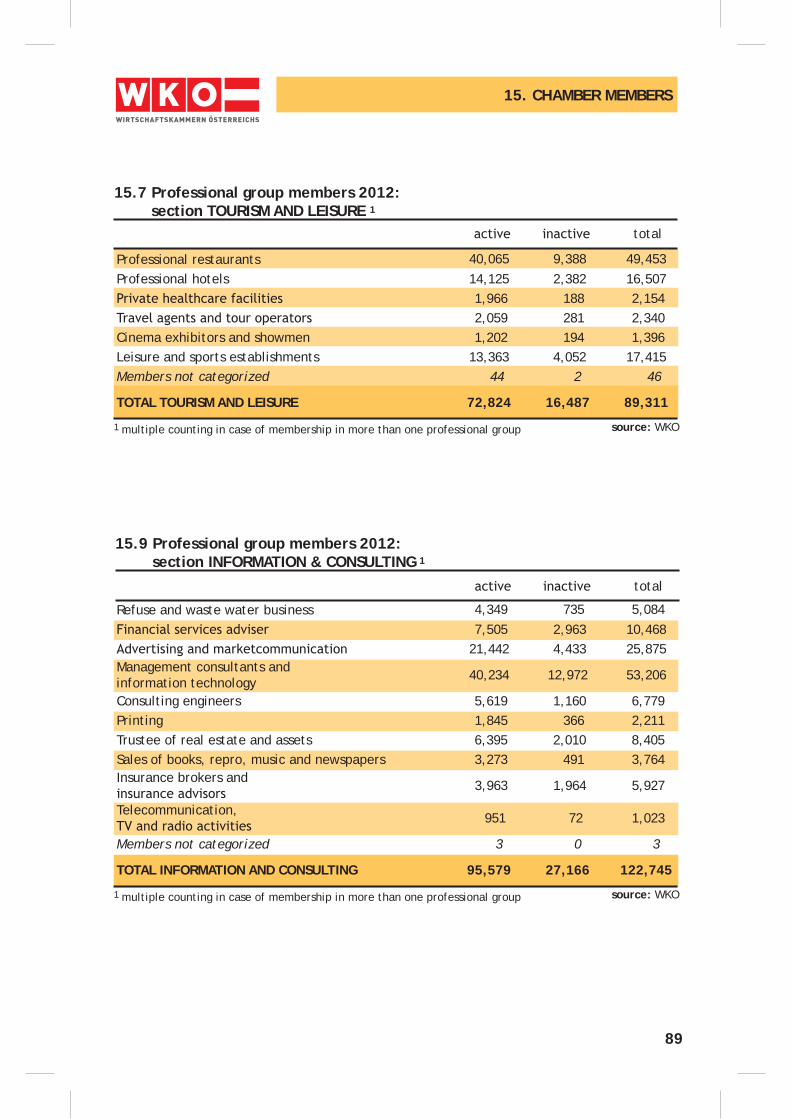
89
15. CHAMBER MEMBERS
15.7 Professional group members 2012: section TOURISM AND LEISURE 1
1 multiple counting in case of membership in more than one professional group source: WKO
Professional restaurants 40,065 9,388 49,453Professional hotels 14,125 2,382 16,507
1,966 188 2,154 2,059 281 2,340
Cinema exhibitors and showmen 1,202 194 1,396Leisure and sports establishments 13,363 4,052 17,415Members not categorized 44 2 46
TOTAL TOURISM AND LEISURE 72,824 16,487 89,311
15.9 Professional group members 2012: section INFORMATION & CONSULTING 1
1 multiple counting in case of membership in more than one professional group source: WKO
Refuse and waste water business 4,349 735 5,084 7,505 2,963 10,46821,442 4,433 25,875
Management consultants and information technology 40,234 12,972 53,206
Consulting engineers 5,619 1,160 6,779Printing 1,845 366 2,211Trustee of real estate and assets 6,395 2,010 8,405Sales of books, repro, music and newspapers 3,273 491 3,764Insurance brokers and 3,963 1,964 5,927
Telecommunication, 951 72 1,023
Members not categorized 3 0 3
TOTAL INFORMATION AND CONSULTING 95,579 27,166 122,745
total
total
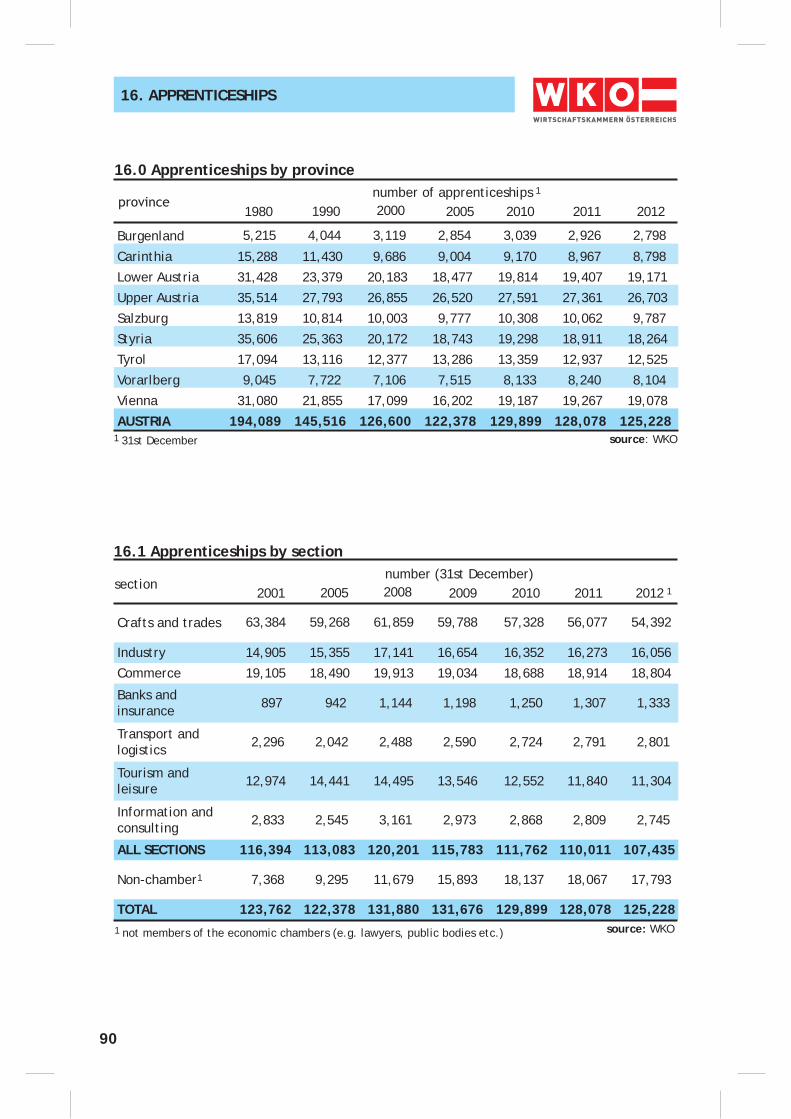
90
16. APPRENTICESHIPS
Burgenland 5,215 4,044 3,119 2,854 3,039 2,926 2,798
Carinthia 15,288 11,430 9,686 9,004 9,170 8,967 8,798
Lower Austria 31,428 23,379 20,183 18,477 19,814 19,407 19,171
Upper Austria 35,514 27,793 26,855 26,520 27,591 27,361 26,703
Salzburg 13,819 10,814 10,003 9,777 10,308 10,062 9,787
Styria 35,606 25,363 20,172 18,743 19,298 18,911 18,264
Tyrol 17,094 13,116 12,377 13,286 13,359 12,937 12,525
Vorarlberg 9,045 7,722 7,106 7,515 8,133 8,240 8,104
Vienna 31,080 21,855 17,099 16,202 19,187 19,267 19,078
AUSTRIA 194,089 145,516 126,600 122,378 129,899 128,078 125,228
16.0 Apprenticeships by provincenumber of apprenticeships 1
1990 2000 1980 2010
source: WKO
2005 2011 2012
16.1 Apprenticeships by section
sectionnumber (31st December)
2005 2008 2001 2010 2009 2011 2012 1
1 not members of the economic chambers (e.g. lawyers, public bodies etc.)
Crafts and trades 63,384 59,268 61,859 59,788 57,328 56,077 54,392
Industry 14,905 15,355 17,141 16,654 16,352 16,273 16,056
Commerce 19,105 18,490 19,913 19,034 18,688 18,914 18,804
Banks andinsurance 897 942 1,144 1,198 1,250 1,307 1,333
Transport andlogistics 2,296 2,042 2,488 2,590 2,724 2,791 2,801
Tourism andleisure 12,974 14,441 14,495 13,546 12,552 11,840 11,304
Information and consulting 2,833 2,545 3,161 2,973 2,868 2,809 2,745
ALL SECTIONS 116,394 113,083 120,201 115,783 111,762 110,011 107,435
Non-chamber1 7,368 9,295 11,679 15,893 18,137 18,067 17,793
TOTAL 123,762 122,378 131,880 131,676 129,899 128,078 125,228 source: WKO
1 31st December
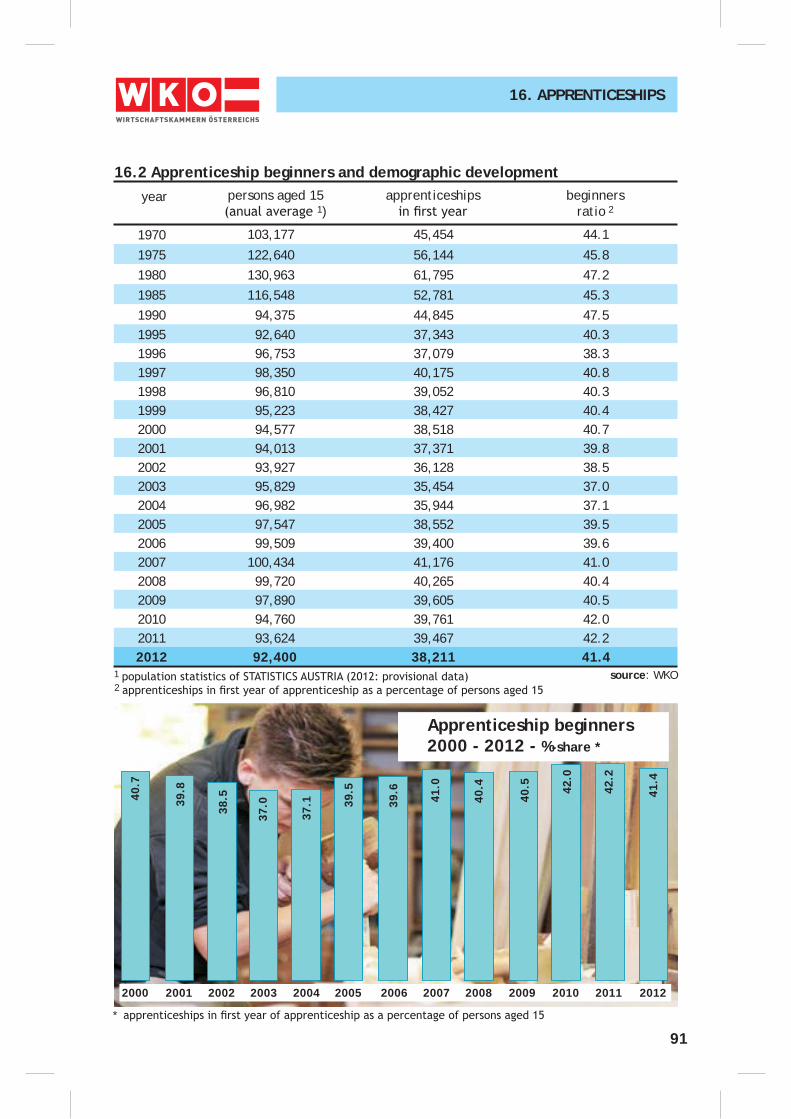
91
16. APPRENTICESHIPS
16.2 Apprenticeship beginners and demographic developmentyear persons aged 15
1)apprenticeships beginners
ratio 2
source: WKO
*
1970 103,177 45,454 44.1
1975 122,640 56,144 45.81980 130,963 61,795 47.21985 116,548 52,781 45.31990 94,375 44,845 47.51995 92,640 37,343 40.31996 96,753 37,079 38.31997 98,350 40,175 40.81998 96,810 39,052 40.31999 95,223 38,427 40.42000 94,577 38,518 40.72001 94,013 37,371 39.82002 93,927 36,128 38.52003 95,829 35,454 37.02004 96,982 35,944 37.12005 97,547 38,552 39.52006 99,509 39,400 39.62007 100,434 41,176 41.02008 99,720 40,265 40.42009 97,890 39,605 40.52010 94,760 39,761 42.02011 93,624 39,467 42.22012 92,400 38,211 41.4
Apprenticeship beginners 2000 - 2012 - %-share *
1
2000 2001 2002 2003 2004 2005 2006 2007 2008 2009
38.5 39.6
39.5
37.1
37.039
.8
40.7
40.5
40.4
41.0
2010
42.0
2011
42.2
41.4
2012
2
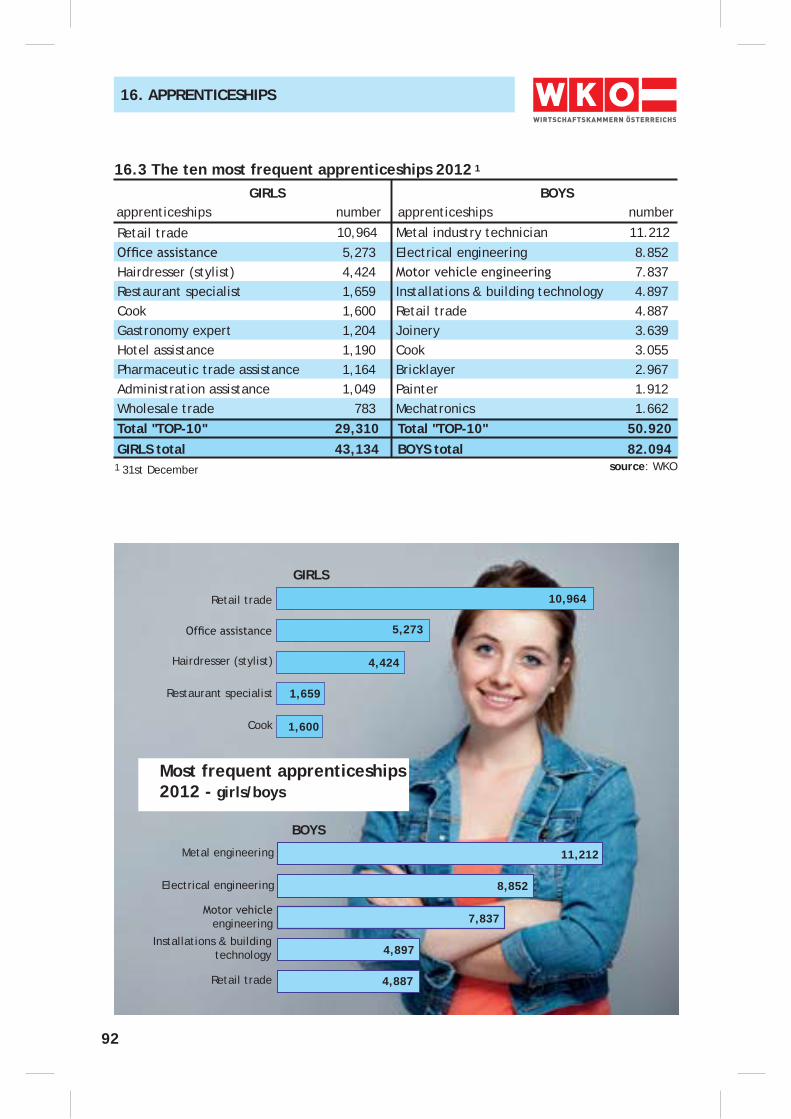
92
16. APPRENTICESHIPS
16.3 The ten most frequent apprenticeships 2012 1
GIRLS BOYS
Retail trade 10,964 Metal industry technician 11.212 5,273 Electrical engineering 8.852
Hairdresser (stylist) 4,424 7.837Restaurant specialist 1,659 Installations & building technology 4.897Cook 1,600 Retail trade 4.887Gastronomy expert 1,204 Joinery 3.639Hotel assistance 1,190 Cook 3.055Pharmaceutic trade assistance 1,164 Bricklayer 2.967Administration assistance 1,049 Painter 1.912Wholesale trade 783 Mechatronics 1.662Total "TOP-10" 29,310 Total "TOP-10" 50.920GIRLS total 43,134 BOYS total 82.094
apprenticeships
source: WKO
apprenticeshipsnumber number
GIRLS
BOYS
Retail trade
Retail trade
Installations & building technology
engineering
Metal engineering
Cook
Restaurant specialist
Hairdresser (stylist)
1 31st December
Electrical engineering
1,600
1,659
4,424
5,273
10,964
4,887
4,897
7,837
8,852
11,212
Most frequent apprenticeships 2012 - girls/boys
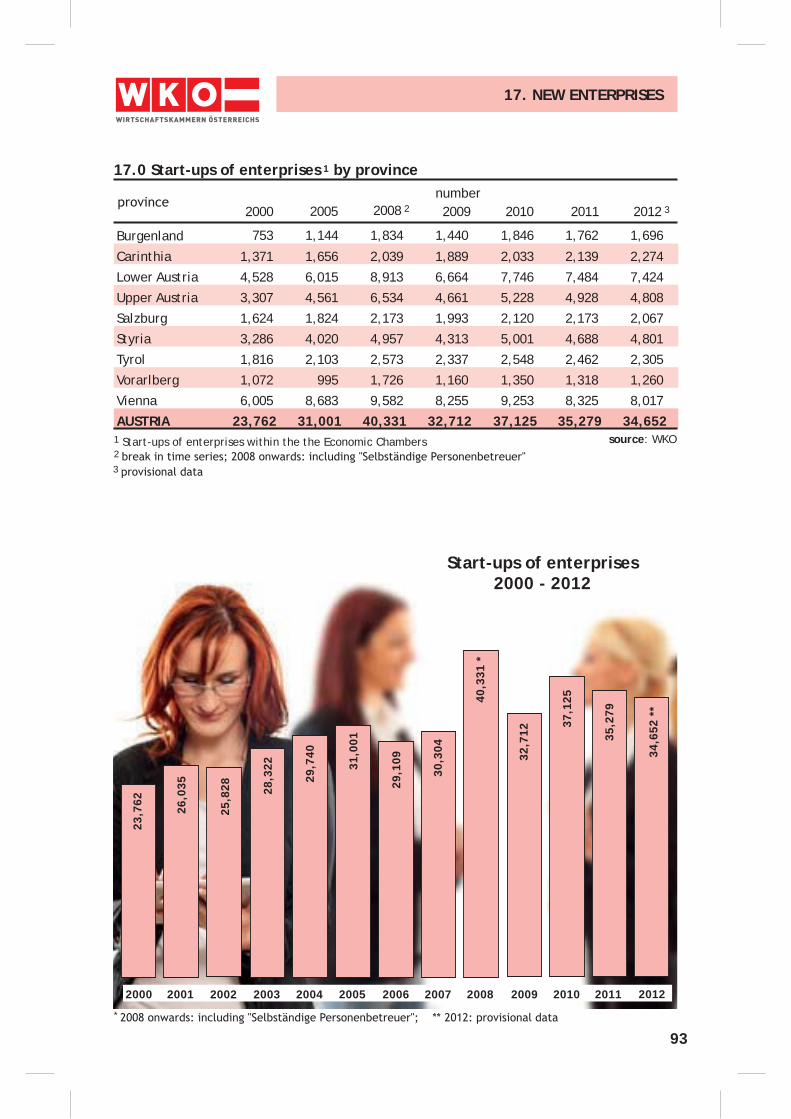
93
17. NEW ENTERPRISES
Burgenland 753 1,144 1,834 1,440 1,846 1,762 1,696
Carinthia 1,371 1,656 2,039 1,889 2,033 2,139 2,274
Lower Austria 4,528 6,015 8,913 6,664 7,746 7,484 7,424
Upper Austria 3,307 4,561 6,534 4,661 5,228 4,928 4,808
Salzburg 1,624 1,824 2,173 1,993 2,120 2,173 2,067
Styria 3,286 4,020 4,957 4,313 5,001 4,688 4,801
Tyrol 1,816 2,103 2,573 2,337 2,548 2,462 2,305
Vorarlberg 1,072 995 1,726 1,160 1,350 1,318 1,260
Vienna 6,005 8,683 9,582 8,255 9,253 8,325 8,017
AUSTRIA 23,762 31,001 40,331 32,712 37,125 35,279 34,652
17.0 Start-ups of enterprises 1 by provincenumber
2005 2008 2 2000 2010
1 Start-ups of enterprises within the the Economic Chambers source: WKO
2009 2011 2012 3
2
Start-ups of enterprises2000 - 2012
*
3
2000 2001 2002 2003 2004 2005 2006 2007 2008 2009
32,7
12
40,3
31 *
30,3
04
29,1
0931,0
01
29,7
40
28,3
22
25,8
28
26,0
35
23,7
62
2010
37,1
25
35,2
79
2011 2012
34,6
52 *
*
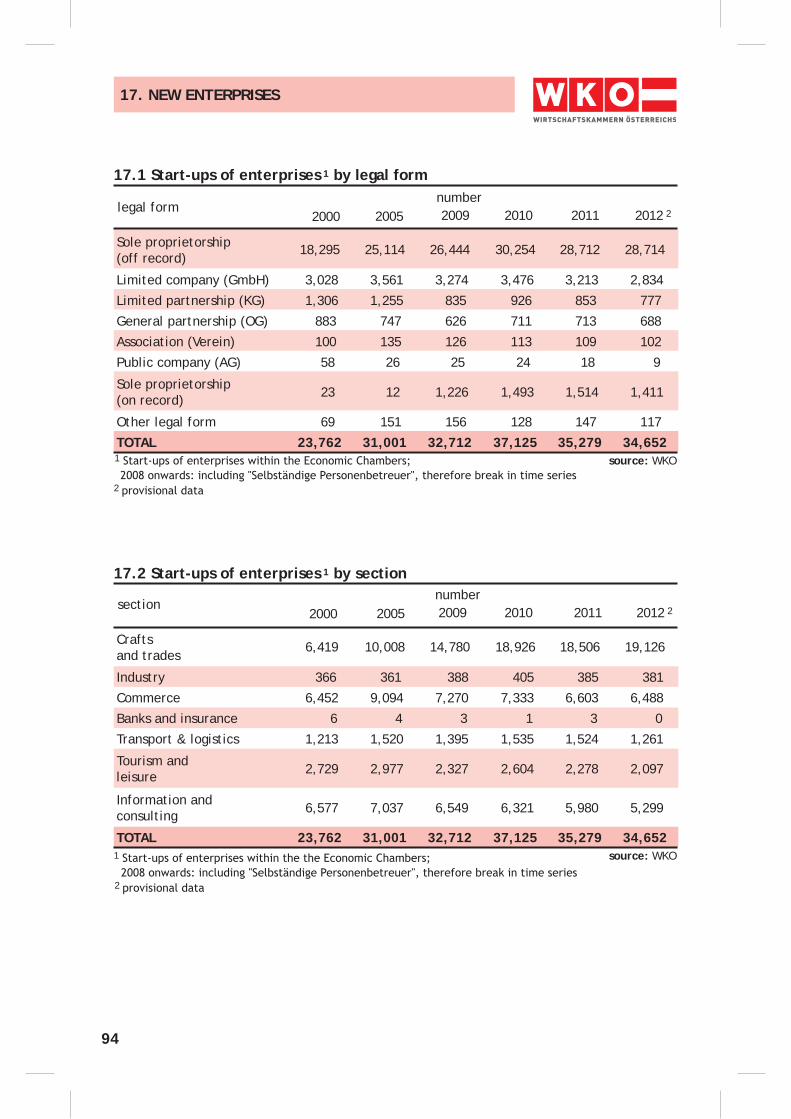
94
17. NEW ENTERPRISES
Sole proprietorship(off record)
18,295 25,114 26,444 30,254 28,712 28,714
Limited company (GmbH) 3,028 3,561 3,274 3,476 3,213 2,834
Limited partnership (KG) 1,306 1,255 835 926 853 777
General partnership (OG) 883 747 626 711 713 688
Association (Verein) 100 135 126 113 109 102
Public company (AG) 58 26 25 24 18 9
Sole proprietorship(on record) 23 12 1,226 1,493 1,514 1,411
Other legal form 69 151 156 128 147 117
TOTAL 23,762 31,001 32,712 37,125 35,279 34,652
17.1 Start-ups of enterprises 1 by legal form
legal formnumber
2005 2009 2000 2010
source: WKO
2011 2012 2
Crafts and trades
6,419 10,008 14,780 18,926 18,506 19,126
Industry 366 361 388 405 385 381
Commerce 6,452 9,094 7,270 7,333 6,603 6,488
Banks and insurance 6 4 3 1 3 0
Transport & logistics 1,213 1,520 1,395 1,535 1,524 1,261
Tourism and leisure 2,729 2,977 2,327 2,604 2,278 2,097
Information andconsulting 6,577 7,037 6,549 6,321 5,980 5,299
TOTAL 23,762 31,001 32,712 37,125 35,279 34,652
17.2 Start-ups of enterprises 1 by section
sectionnumber
2005 2009 2000 2010
source: WKO
2011 2012 2
1
2
1
2
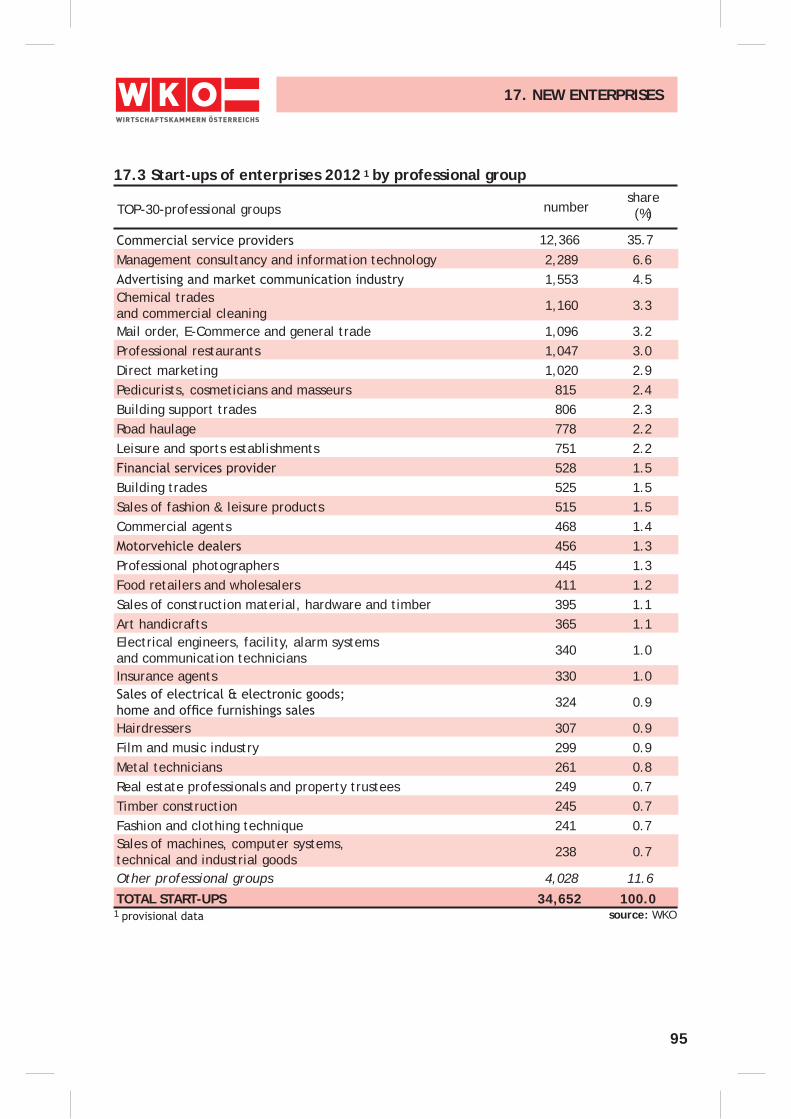
95
17. NEW ENTERPRISES
12,366 35.7Management consultancy and information technology 2,289 6.6
1,553 4.5Chemical trades and commercial cleaning 1,160 3.3
Mail order, E-Commerce and general trade 1,096 3.2Professional restaurants 1,047 3.0Direct marketing 1,020 2.9Pedicurists, cosmeticians and masseurs 815 2.4Building support trades 806 2.3Road haulage 778 2.2Leisure and sports establishments 751 2.2
528 1.5Building trades 525 1.5Sales of fashion & leisure products 515 1.5Commercial agents 468 1.4
456 1.3Professional photographers 445 1.3Food retailers and wholesalers 411 1.2Sales of construction material, hardware and timber 395 1.1Art handicrafts 365 1.1Electrical engineers, facility, alarm systems and communication technicians 340 1.0
Insurance agents 330 1.0
324 0.9
Hairdressers 307 0.9Film and music industry 299 0.9Metal technicians 261 0.8Real estate professionals and property trustees 249 0.7Timber construction 245 0.7Fashion and clothing technique 241 0.7Sales of machines, computer systems, technical and industrial goods 238 0.7
Other professional groups 4,028 11.6
TOTAL START-UPS 34,652 100.0
numbershare (%)TOP-30-professional groups
17.3 Start-ups of enterprises 2012 1 by professional group
source: WKO1
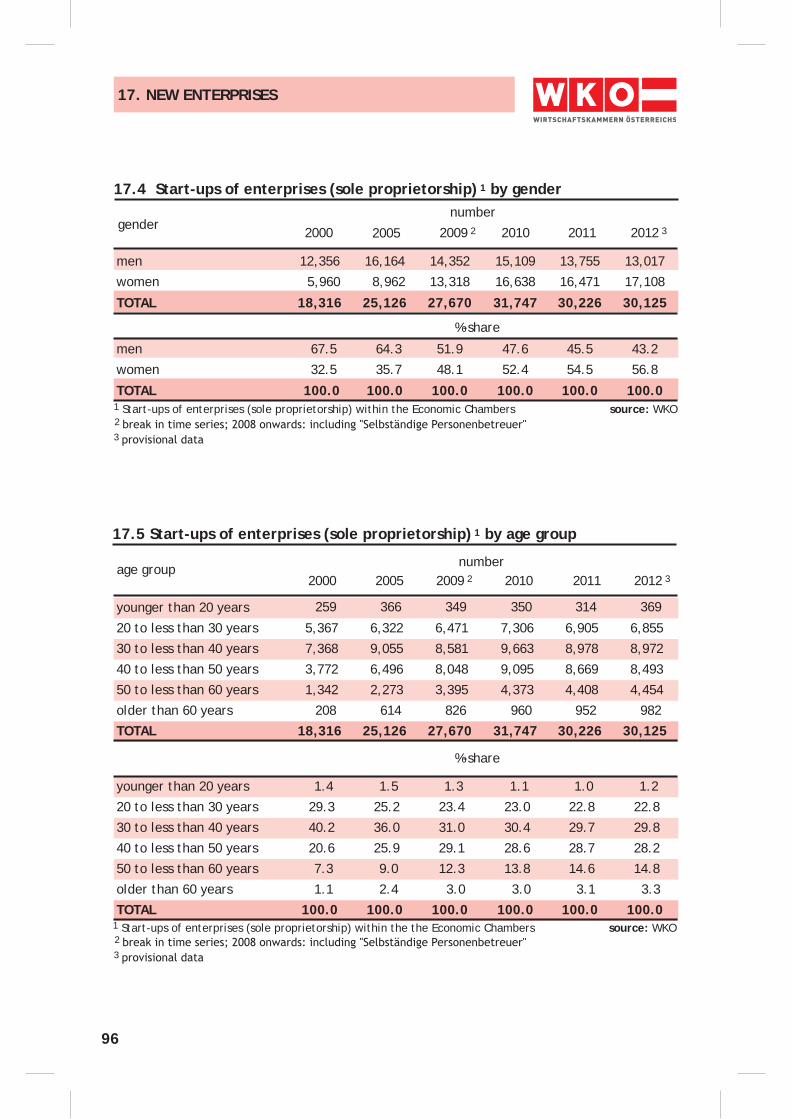
96
17. NEW ENTERPRISES
men 12,356 16,164 14,352 15,109 13,755 13,017
women 5,960 8,962 13,318 16,638 16,471 17,108
TOTAL 18,316 25,126 27,670 31,747 30,226 30,125
men 67.5 64.3 51.9 47.6 45.5 43.2
women 32.5 35.7 48.1 52.4 54.5 56.8
TOTAL 100.0 100.0 100.0 100.0 100.0 100.0
17.4 Start-ups of enterprises (sole proprietorship) 1 by gender
gendernumber
17.5 Start-ups of enterprises (sole proprietorship) 1 by age group
age group number 2005 2009 2 2000 2010 2011 2012 3
%-share
%-share
younger than 20 years 259 366 349 350 314 369
20 to less than 30 years 5,367 6,322 6,471 7,306 6,905 6,855
30 to less than 40 years 7,368 9,055 8,581 9,663 8,978 8,972
40 to less than 50 years 3,772 6,496 8,048 9,095 8,669 8,493
50 to less than 60 years 1,342 2,273 3,395 4,373 4,408 4,454
older than 60 years 208 614 826 960 952 982
TOTAL 18,316 25,126 27,670 31,747 30,226 30,125
younger than 20 years 1.4 1.5 1.3 1.1 1.0 1.2
20 to less than 30 years 29.3 25.2 23.4 23.0 22.8 22.8
30 to less than 40 years 40.2 36.0 31.0 30.4 29.7 29.8
40 to less than 50 years 20.6 25.9 29.1 28.6 28.7 28.2
50 to less than 60 years 7.3 9.0 12.3 13.8 14.6 14.8
older than 60 years 1.1 2.4 3.0 3.0 3.1 3.3
TOTAL 100.0 100.0 100.0 100.0 100.0 100.0
1 Start-ups of enterprises (sole proprietorship) within the Economic Chambers source: WKO
1 Start-ups of enterprises (sole proprietorship) within the the Economic Chambers source: WKO
2
3
2
3
2005 2009 2 2000 2010 2011 2012 3
Data sources:
AMS: Arbeitsmarktservice Österreich, Vienna
BMF: Federal Ministery of Finance, Vienna
EU-Commission: European Commission, Brussels
EUROSTAT: Statistical Office of the European Communities, Luxembourg
HVSV: Hauptverband der österreichischen Sozialversicherungsträger, Vienna
OECD: Organisation for Economic Cooperation and Development, Paris
OeNB: Austrian Central Bank, Vienna
STATISTICS AUSTRIA: Statistics Austria, Vienna
UN: United Nations, Geneva
WIFO: Austrian Institute of Economic Research, Vienna
WKO: Austrian Economic Chambers (Wirtschaftskammern Österreichs)
SOURCES