Embed Size (px)
Citation preview

Statistics for AP Biology
Understanding Trends in Data
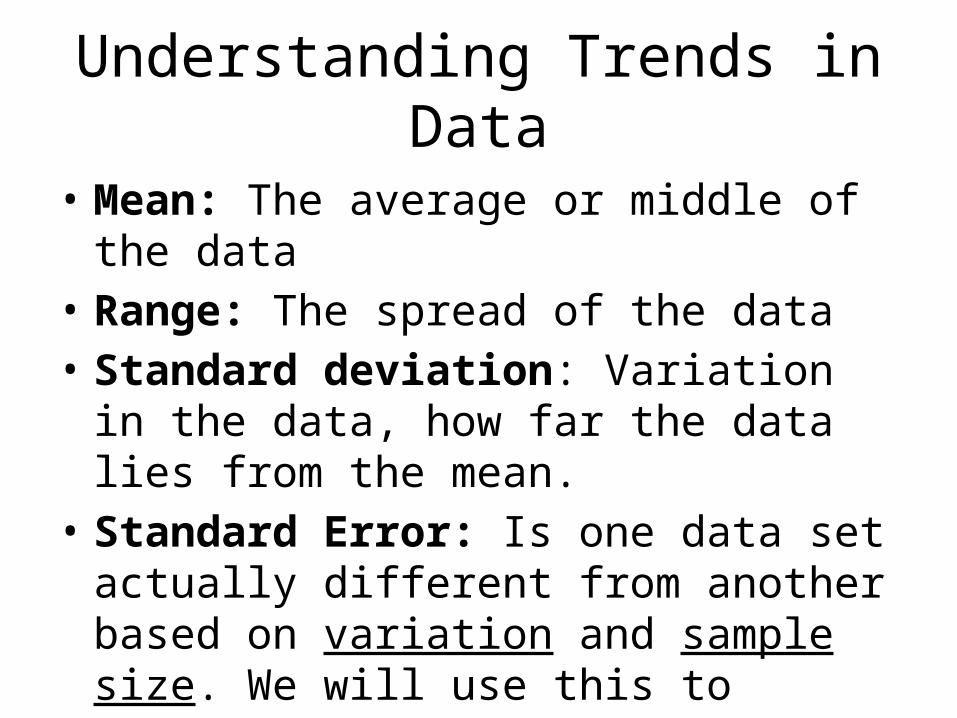
• Mean: The average or middle of the data• Range: The spread of the data• Standard deviation: Variation in the data, how
far the data lies from the mean.• Standard Error: Is one data set actually
different from another based on variation and sample size. We will use this to compare experimental groups.
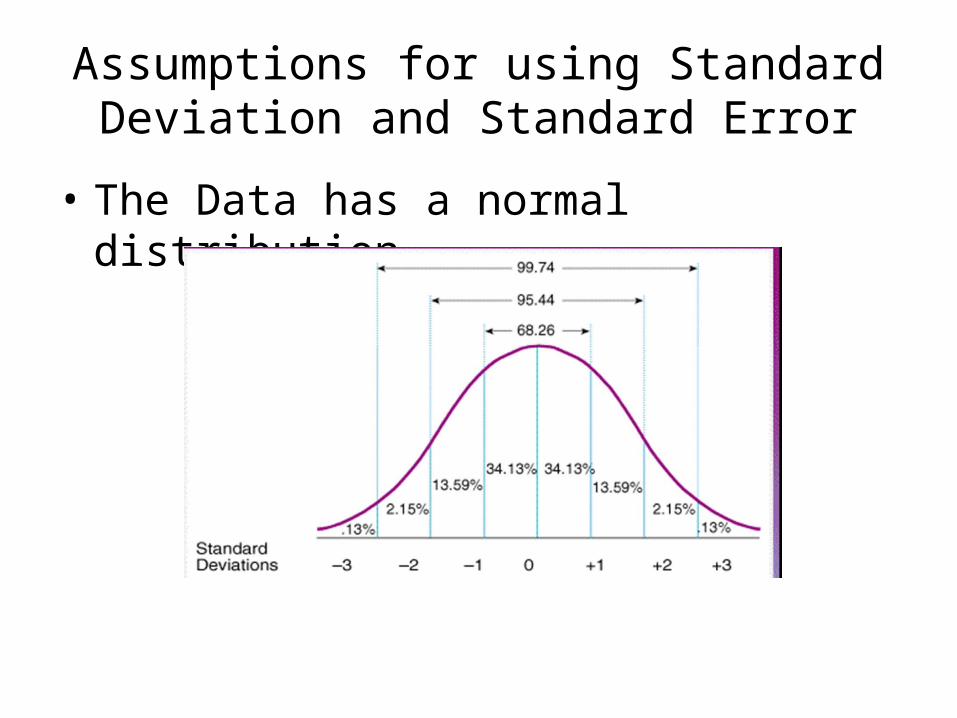
Assumptions for using Standard Deviation and Standard Error
• The Data has a normal distribution
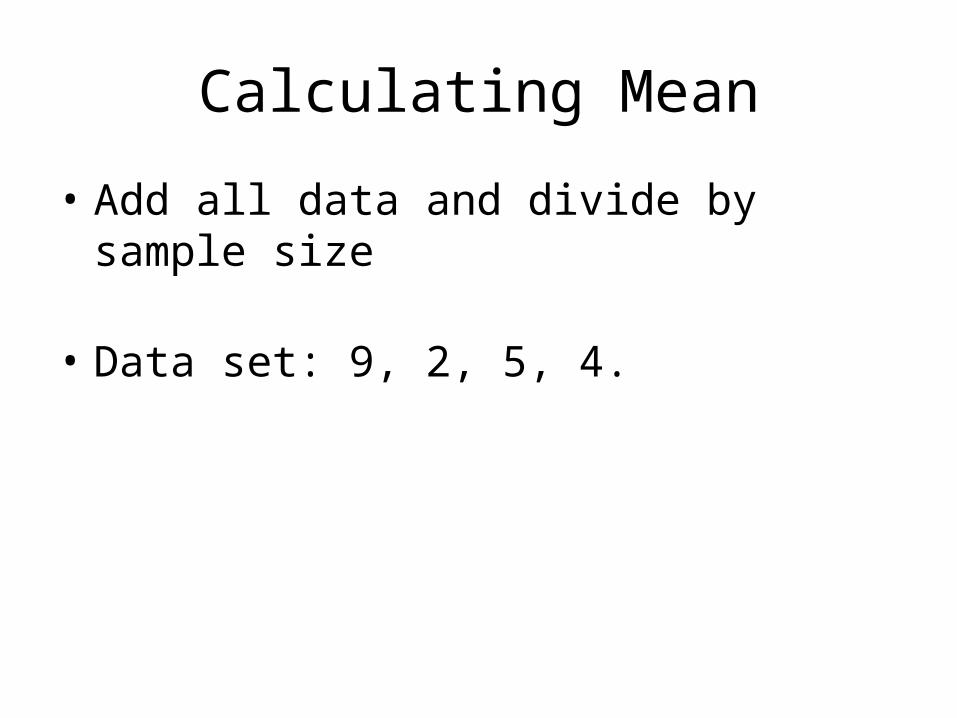
Calculating Mean
• Add all data and divide by sample size
• Data set: 9, 2, 5, 4.

S =
Standard Deviation
1. Work out the Mean2. Then for each number: subtract the Mean and square the result.3. Add the squared result and divide by n-1.4. Take the square root of that and you are done!
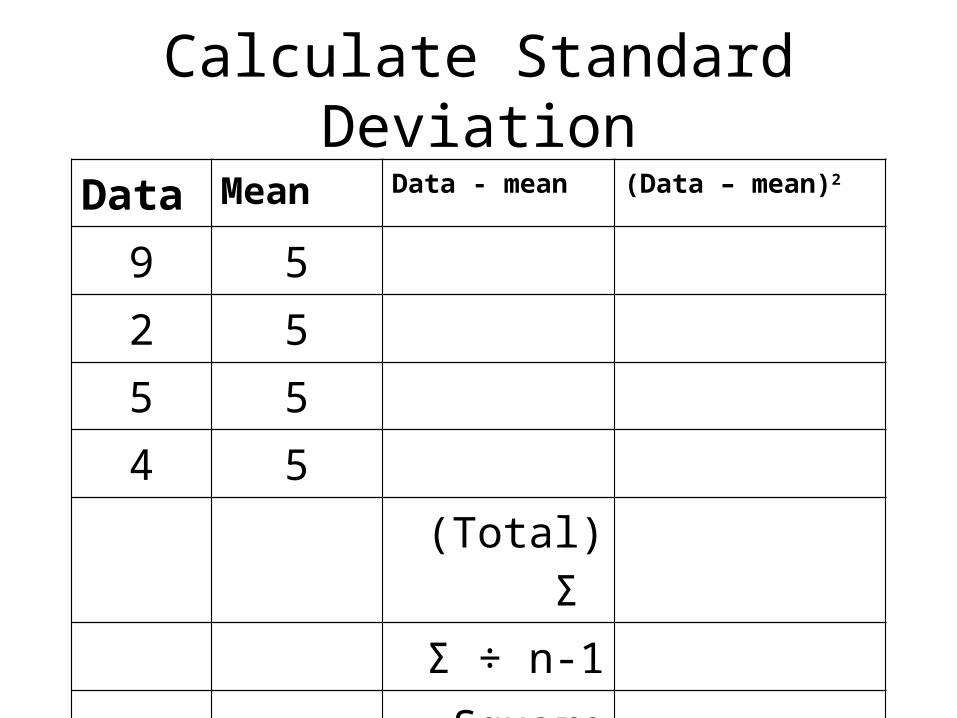
Calculate Standard DeviationData Mean Data - mean (Data – mean)2
9 52 55 54 5
(Total) Ʃ Ʃ ÷ n-1
Square root

Calculate Standard DeviationData Mean Data - mean (Data – mean)2
9 5 4 162 5 -3 95 5 0 04 5 1 1
(Total) Ʃ 26Ʃ ÷ n-1 8.67
Square root 2.94

Standard Error of the Mean
• Divide the standard deviation by the square root of the sample size
2.94√ 4
= 1.47
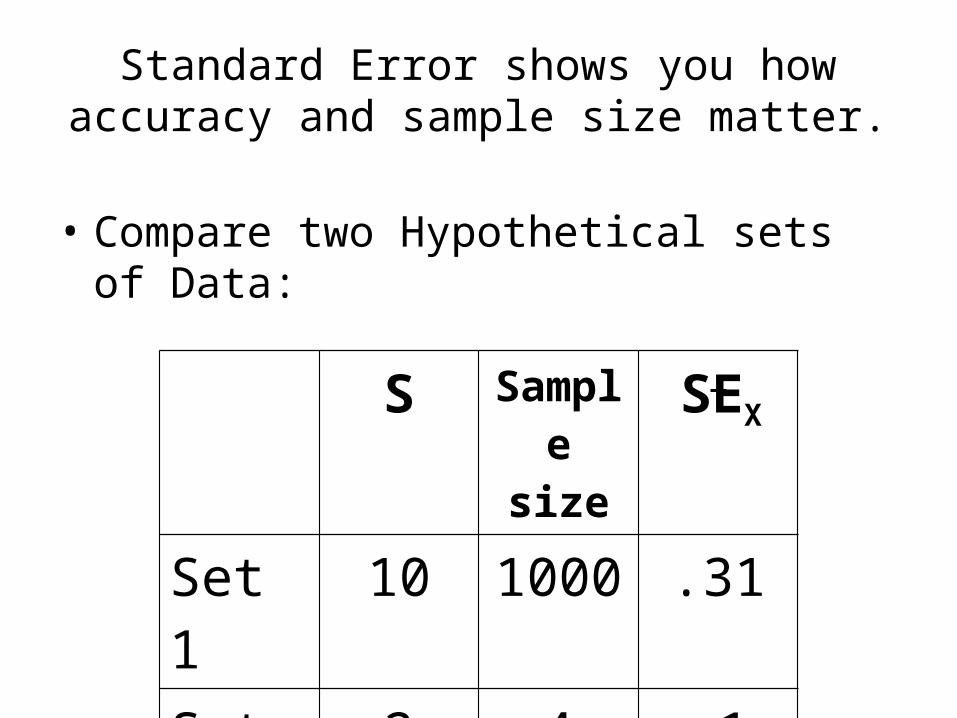
Standard Error shows you how accuracy and sample size matter.
• Compare two Hypothetical sets of Data:
S Sample size
SEX
Set 1 10 1000 .31Set 2 2 4 1
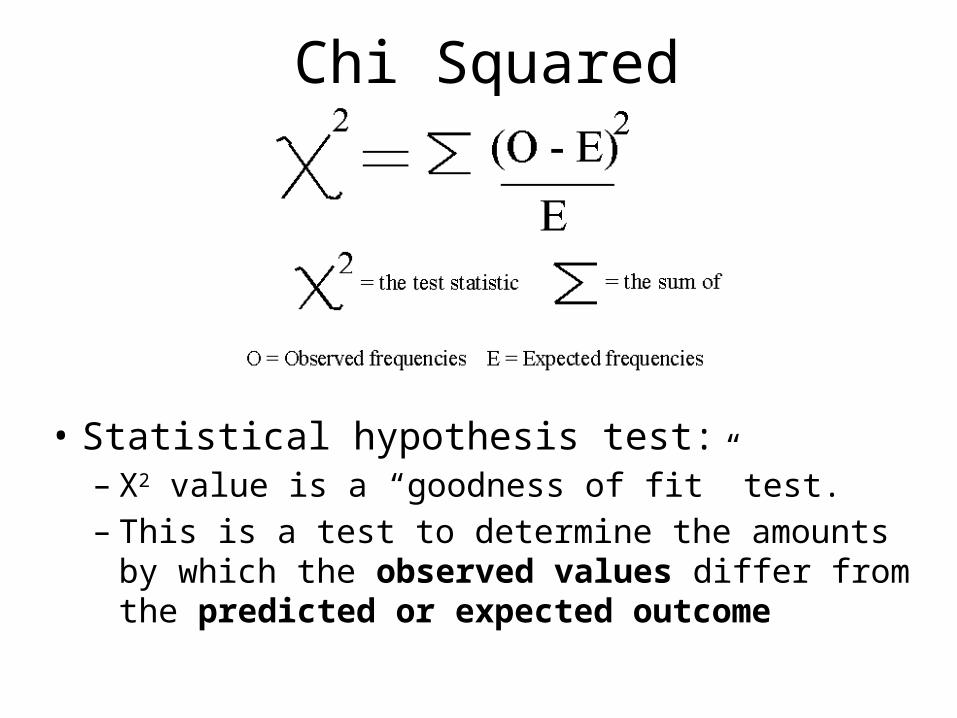
Chi Squared
• Statistical hypothesis test: – X2 value is a “goodness of fit” test.– This is a test to determine the amounts by which
the observed values differ from the predicted or expected outcome

What is the predicted or expected outcome of an experiment?
• In general the expected outcome is called the null hypothesis (Ho)
• In the null hypothesis you expect that there is no difference between the control group and the experimental group.
• No relationship between the manipulated and responding variable.
• The smaller Chi-squared, the closer your data fits the expected outcome based on Ho.
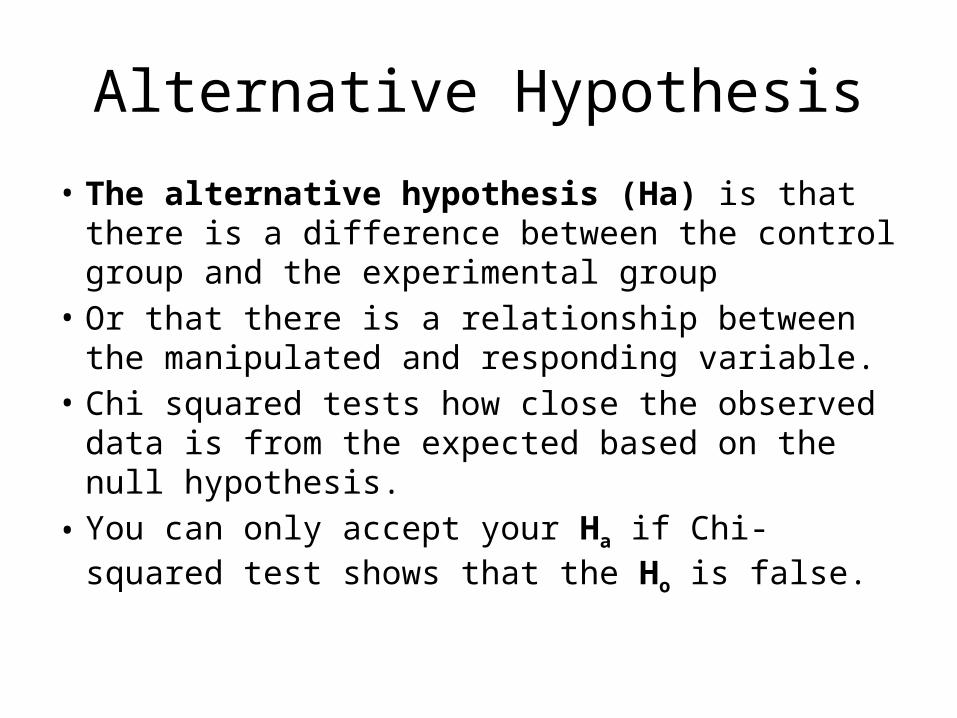
Alternative Hypothesis
• The alternative hypothesis (Ha) is that there is a difference between the control group and the experimental group
• Or that there is a relationship between the manipulated and responding variable.
• Chi squared tests how close the observed data is from the expected based on the null hypothesis.
• You can only accept your Ha if Chi-squared test shows that the Ho is false.
Example question
• Are the genes A and B linked?• Null hypotheisis Ho: the genes are not linked.
• Alternative hypothesis (Ha): the genes are linked.
• Perform a test cross and collect data:

When testing whether two genes are linked what is the expected outcome of the null hypothesis?
• The null hypothesis is that the genes are not linked.
• What does this mean?
• It means that the genes will assort independently because they are on different chromosomes.
• So what will be the expected values of each phenotype? DO A PUNNETT SQUARE!
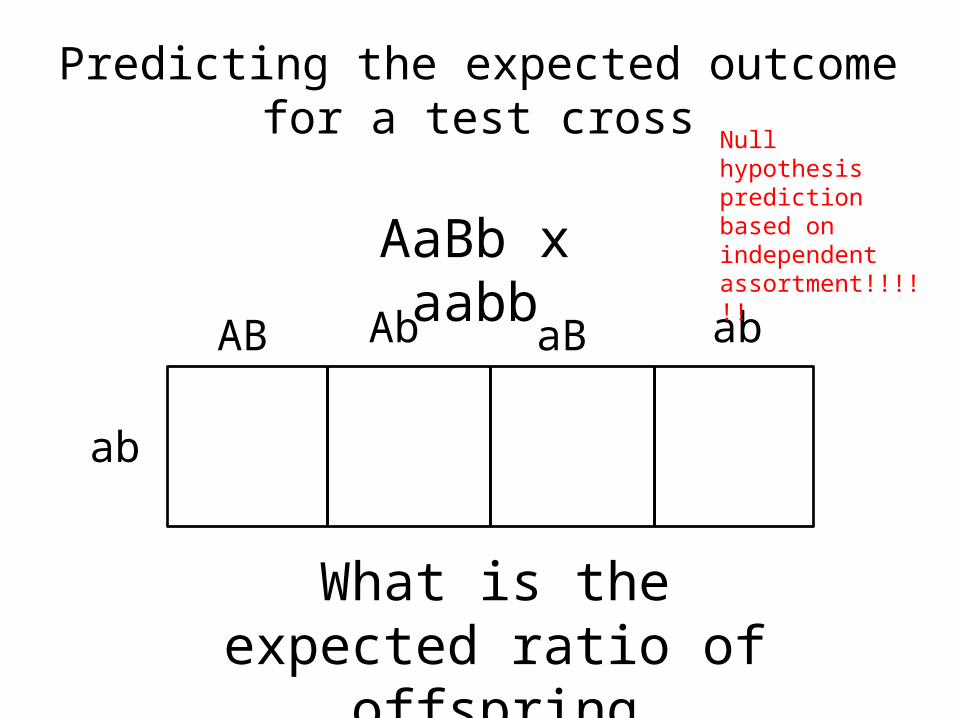
Predicting the expected outcome for a test cross
AaBb x aabb
ab
abaBAB Ab
Null hypothesis prediction based on independent assortment!!!!!!
What is the expected ratio of offspring phenotypes?
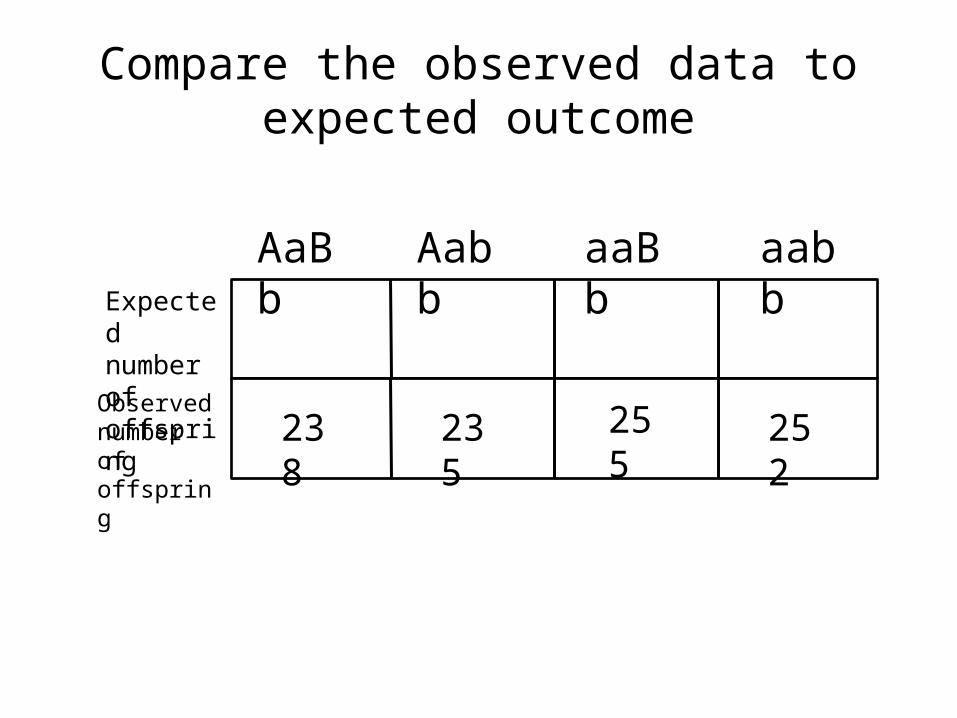
Compare the observed data to expected outcome
AaBbExpectednumber of offspring
Observed number of offspring
Aabb aaBb aabb
238 235 255 252

Compare the observed data to expected outcome
AaBbExpectednumber of offspring
Observed number of offspring
Aabb aaBb aabb
238 235 255 252
245 245 245 245
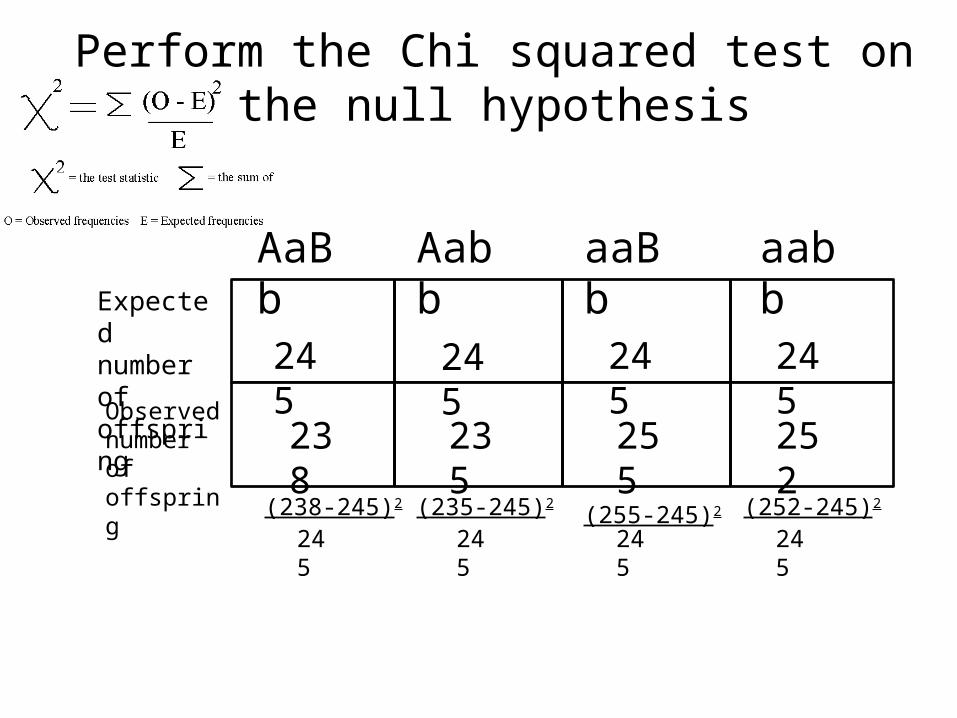
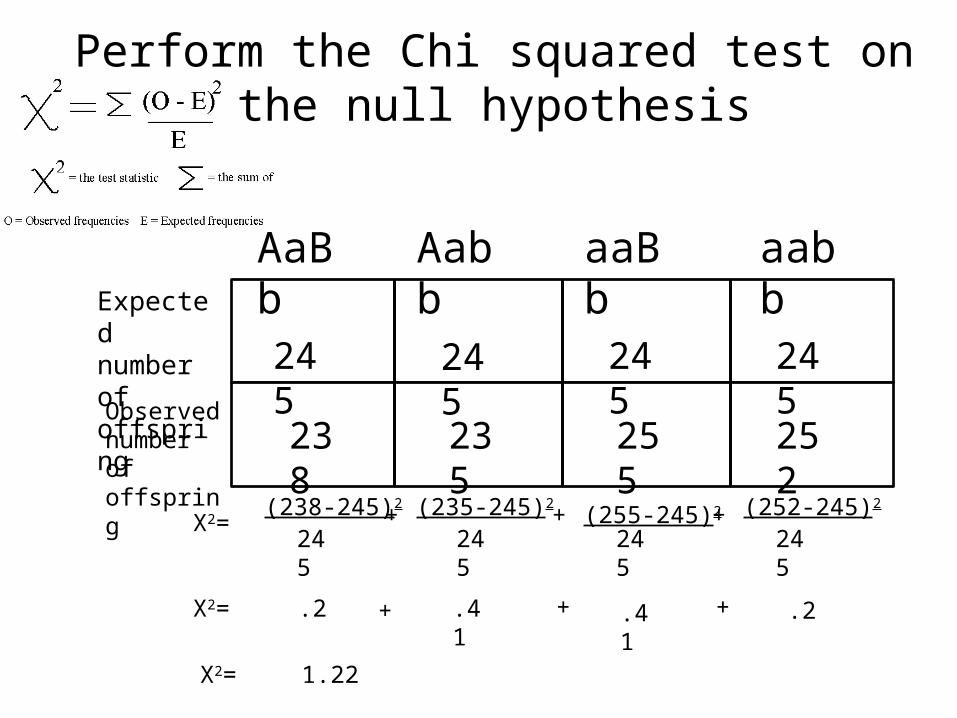
Perform the Chi squared test on the null hypothesis
AaBbExpectednumber of offspring
Observed number of offspring
Aabb aaBb aabb
245 245 245 245
238 235 255 252
(238-245)2 (235-245)2(255-245)2 (252-245)2
245 245 245 245
Perform the Chi squared test on the null hypothesis
AaBbExpectednumber of offspring
Observed number of offspring
Aabb aaBb aabb
245 245 245 245
238 235 255 252
(238-245)2 (235-245)2(255-245)2 (252-245)2
245 245 245 245X2=
X2=
+ + +
.2 .41+ .41 .2+ +
X2= 1.22
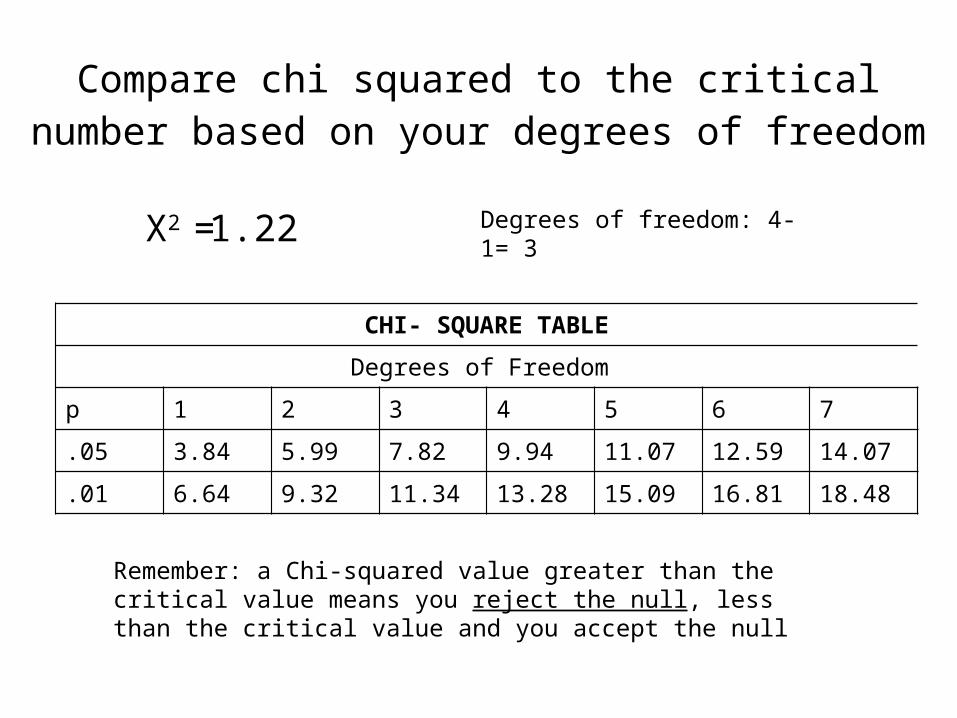
CHI- SQUARE TABLE
Degrees of Freedom
p 1 2 3 4 5 6 7
.05 3.84 5.99 7.82 9.94 11.07 12.59 14.07
.01 6.64 9.32 11.34 13.28 15.09 16.81 18.48
Compare chi squared to the critical number based on your degrees of freedom
Degrees of freedom: 4-1= 3
Remember: a Chi-squared value greater than the critical value means you reject the null, less than the critical value and you accept the null
X2 = 1.22

Use the chi squared test to determine whether the genes G and F are linked?
• Null hypothesis:• Alternative hypothesis:• Expected outcome based on the null hypothesis?• Observed outcome of crossing GgFf x ggff
GgFfExpectednumber of offspringObserved number of offspring
Ggff ggFf ggff
223 225 275 277
250 250 250 250