Embed Size (px)
Citation preview
© 1999 Prentice-Hall, Inc. Chap. 14 - 1
Statistics for Managers
Using Microsoft Excel
Chapter 14
Multiple Regression Models
© 1999 Prentice-Hall, Inc. Chap. 14 - 2
Chapter Topics
• The Multiple Regression Model
• Contribution of Individual Independent
Variables
• Coefficient of Determination
• Categorical Explanatory Variables
• Transformation of Variables
• Model Building
© 1999 Prentice-Hall, Inc. Chap. 14 - 3
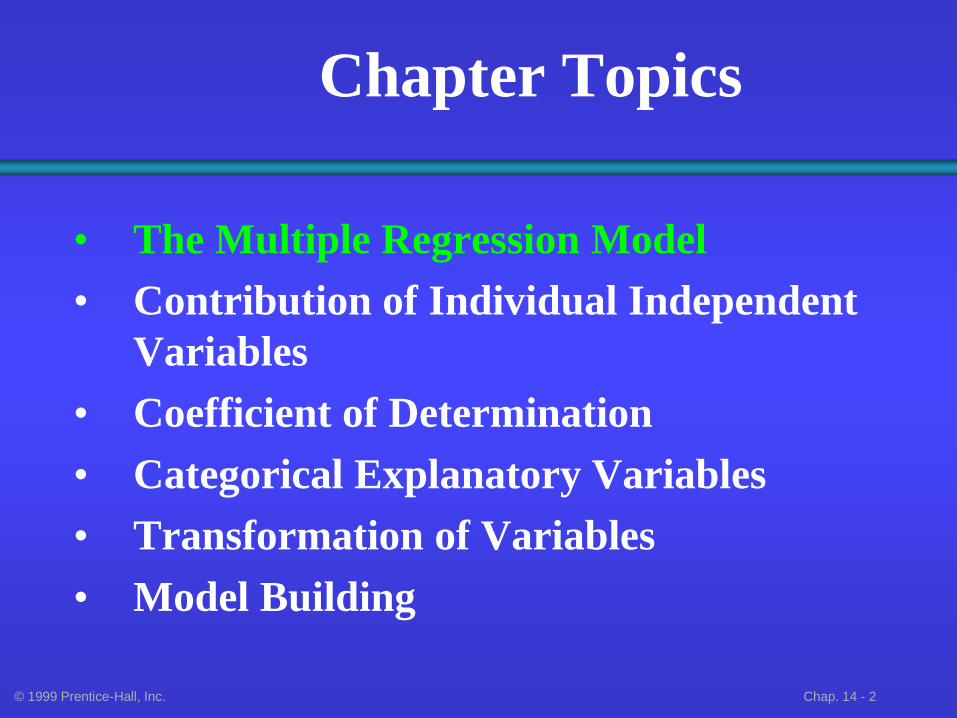
The Multiple Regression Model
ipipiii XXXY 22110
Relationship between 1 dependent & 2 or more
independent variables is a linear function Population
Y-intercept Population slopes
Dependent (Response)
variable for sample
Independent (Explanatory)
variables for sample model
Random
Error
ipipiii eXbXbXbbY 22110
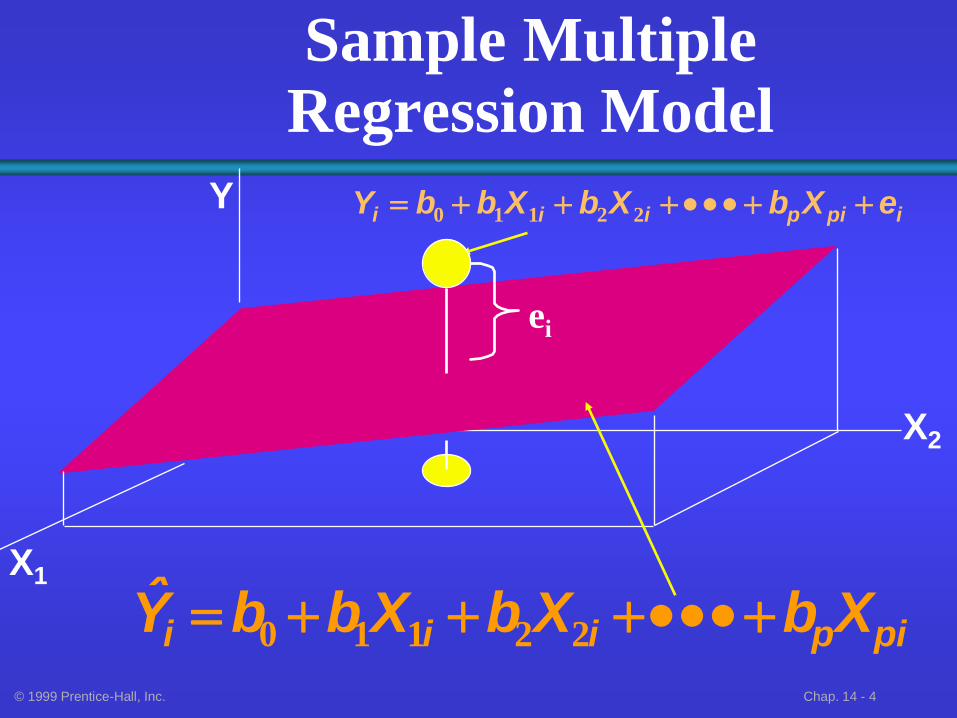
© 1999 Prentice-Hall, Inc. Chap. 14 - 4
Sample Multiple Regression Model
X2
X1
Y
pipiii XbXbXbbY 22110
ipipiii eXbXbXbbY 22110
ei
© 1999 Prentice-Hall, Inc. Chap. 14 - 5
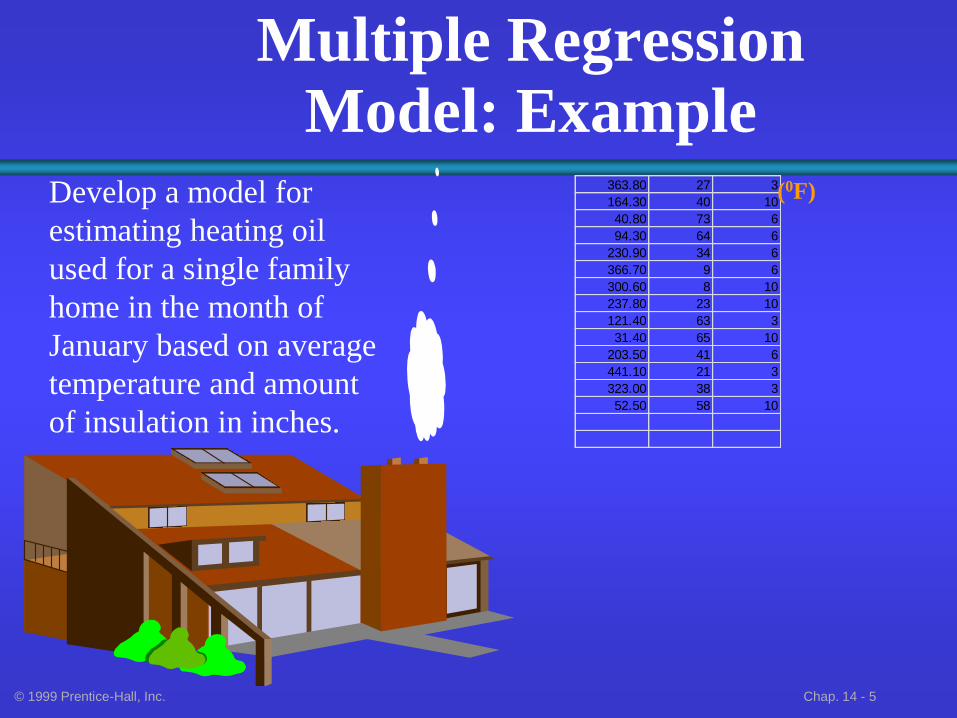
363.80 27 3
164.30 40 10
40.80 73 6
94.30 64 6
230.90 34 6
366.70 9 6
300.60 8 10
237.80 23 10
121.40 63 3
31.40 65 10
203.50 41 6
441.10 21 3
323.00 38 3
52.50 58 10
Multiple Regression Model: Example
(0F) Develop a model for
estimating heating oil
used for a single family
home in the month of
January based on average
temperature and amount
of insulation in inches.
© 1999 Prentice-Hall, Inc. Chap. 14 - 6
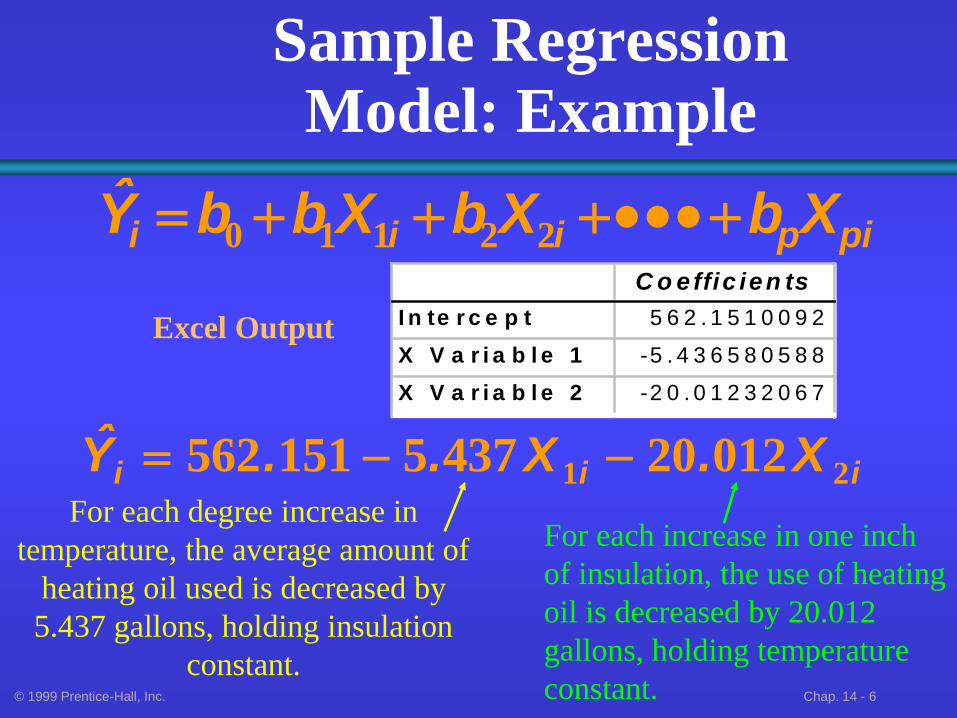
Sample Regression Model: Example
pipiii XbXbXbbY 22110
C o effic ien ts
I n te r c e p t 5 6 2 . 1 5 1 0 0 9 2
X V a r i a b l e 1 -5 . 4 3 6 5 8 0 5 8 8
X V a r i a b l e 2 -2 0 . 0 1 2 3 2 0 6 7
Excel Output
iii X.X..Y 21 012204375151562 For each degree increase in
temperature, the average amount of
heating oil used is decreased by
5.437 gallons, holding insulation
constant.
For each increase in one inch
of insulation, the use of heating
oil is decreased by 20.012
gallons, holding temperature
constant.
© 1999 Prentice-Hall, Inc. Chap. 14 - 7
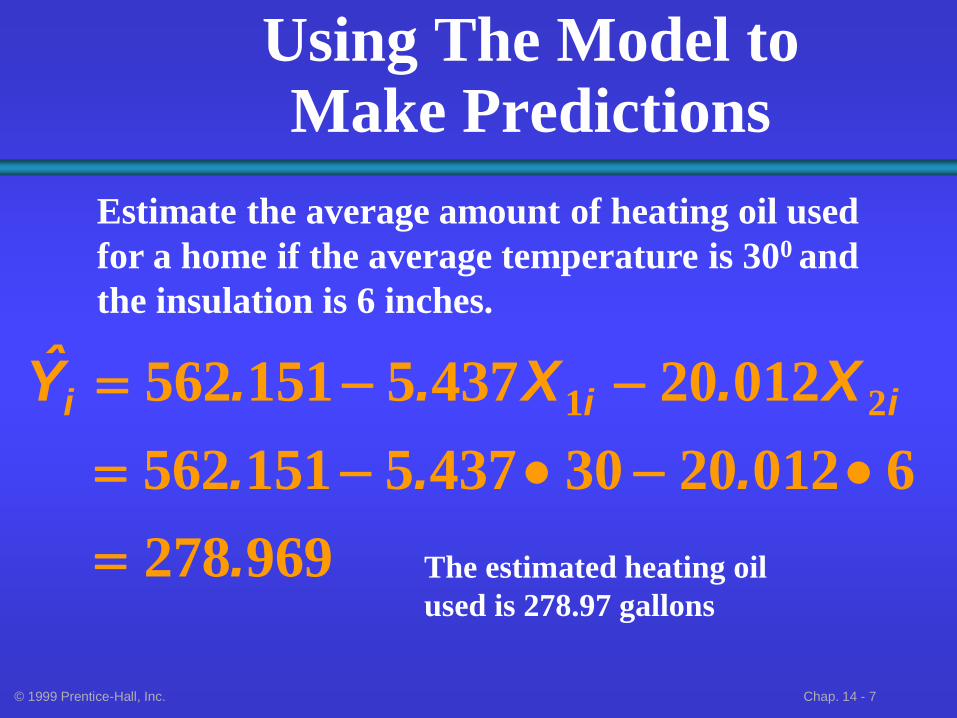
Using The Model to Make Predictions
969278
601220304375151562
012204375151562 21
.
...
X.X..Y iii
Estimate the average amount of heating oil used
for a home if the average temperature is 300 and
the insulation is 6 inches.
The estimated heating oil
used is 278.97 gallons
© 1999 Prentice-Hall, Inc. Chap. 14 - 8
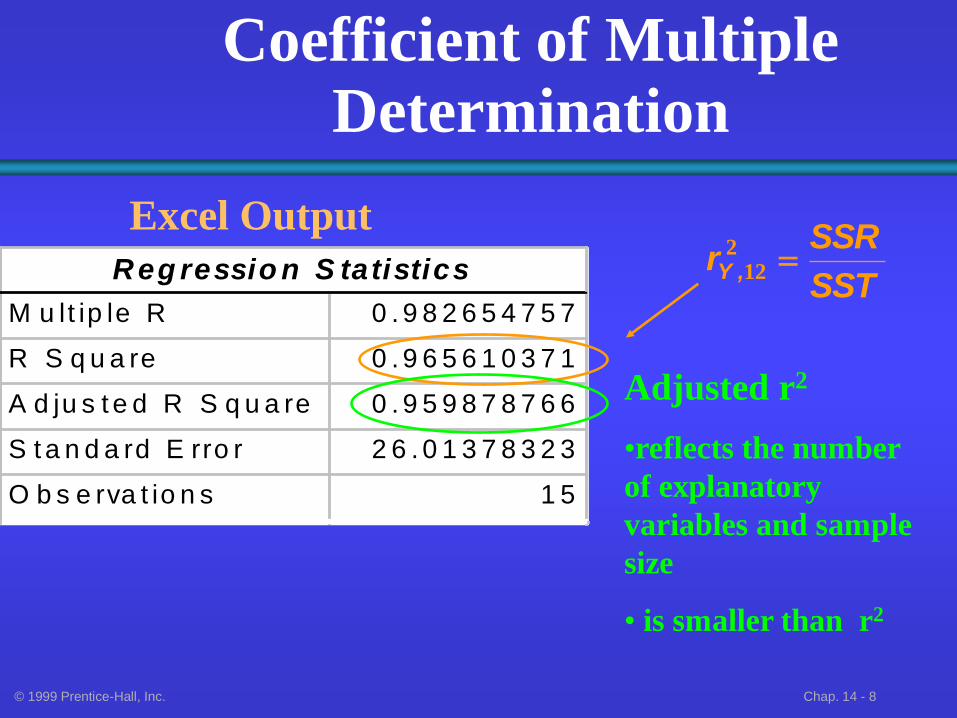
Coefficient of Multiple Determination
Reg ressio n S tatistics
M u lt ip le R 0 . 9 8 2 6 5 4 7 5 7
R S q u a re 0 . 9 6 5 6 1 0 3 7 1
A d ju s t e d R S q u a re 0 . 9 5 9 8 7 8 7 6 6
S t a n d a rd E rro r 2 6 . 0 1 3 7 8 3 2 3
O b s e rva t io n s 1 5
Excel Output
SST
SSRr ,Y 2
12
Adjusted r2
•reflects the number
of explanatory
variables and sample
size
• is smaller than r2
© 1999 Prentice-Hall, Inc. Chap. 14 - 9
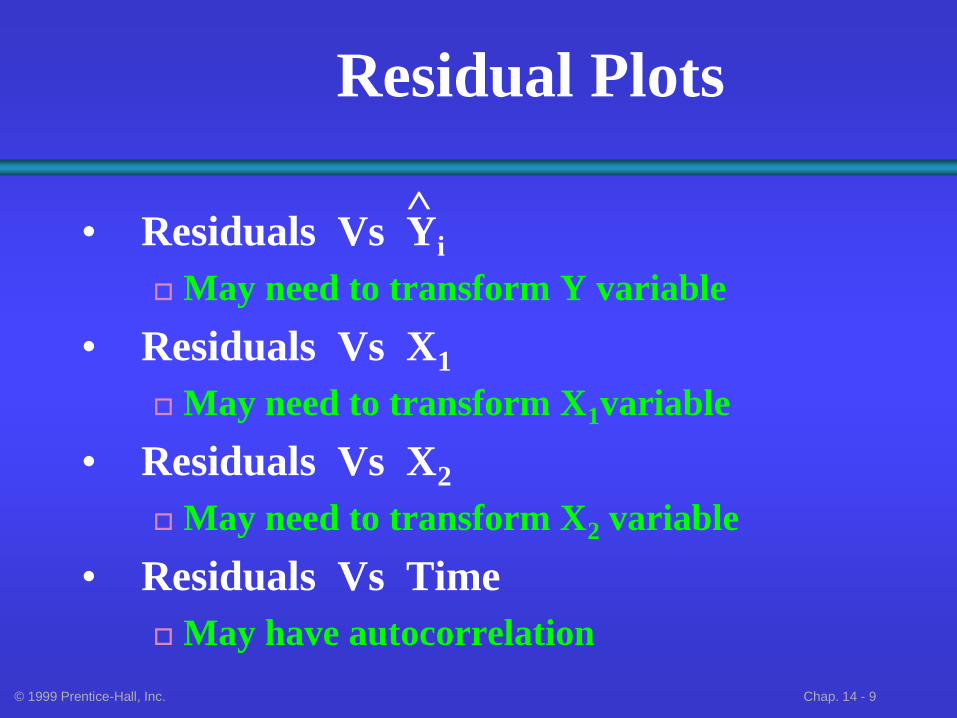
Residual Plots
• Residuals Vs Yi
May need to transform Y variable
• Residuals Vs X1
May need to transform X1variable
• Residuals Vs X2
May need to transform X2 variable
• Residuals Vs Time
May have autocorrelation
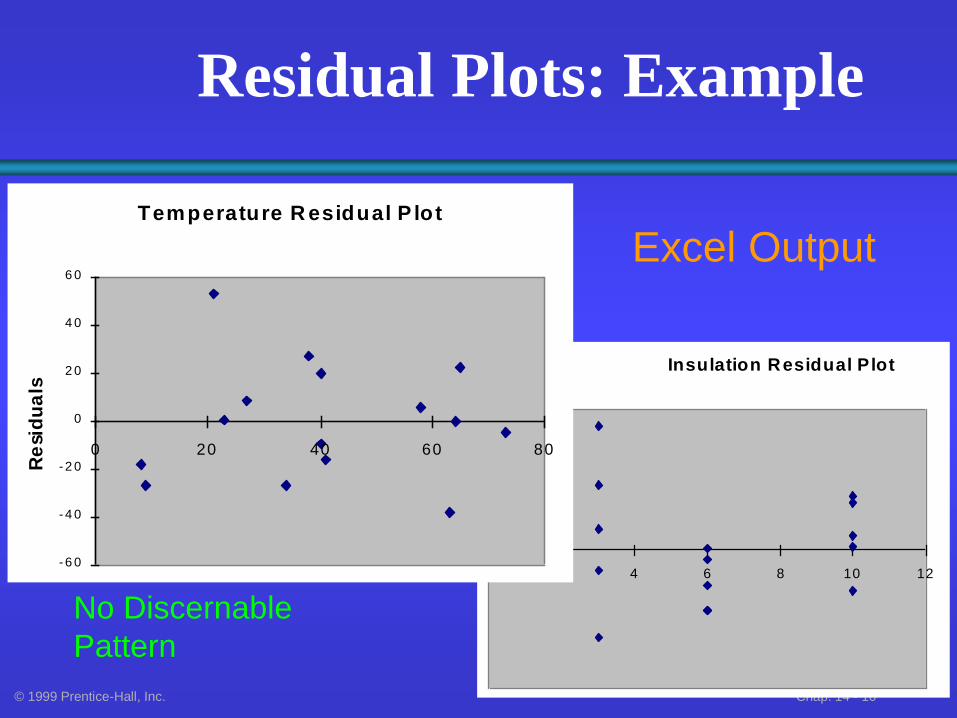
© 1999 Prentice-Hall, Inc. Chap. 14 - 10
Insulation Residual Plot
0 2 4 6 8 10 12
Residual Plots: Example
Excel Output
No Discernable
Pattern
Temperature R esidual P lot
- 6 0
- 4 0
- 2 0
0
2 0
4 0
6 0
0 20 40 60 80
Re
sid
ua
ls
© 1999 Prentice-Hall, Inc. Chap. 14 - 11
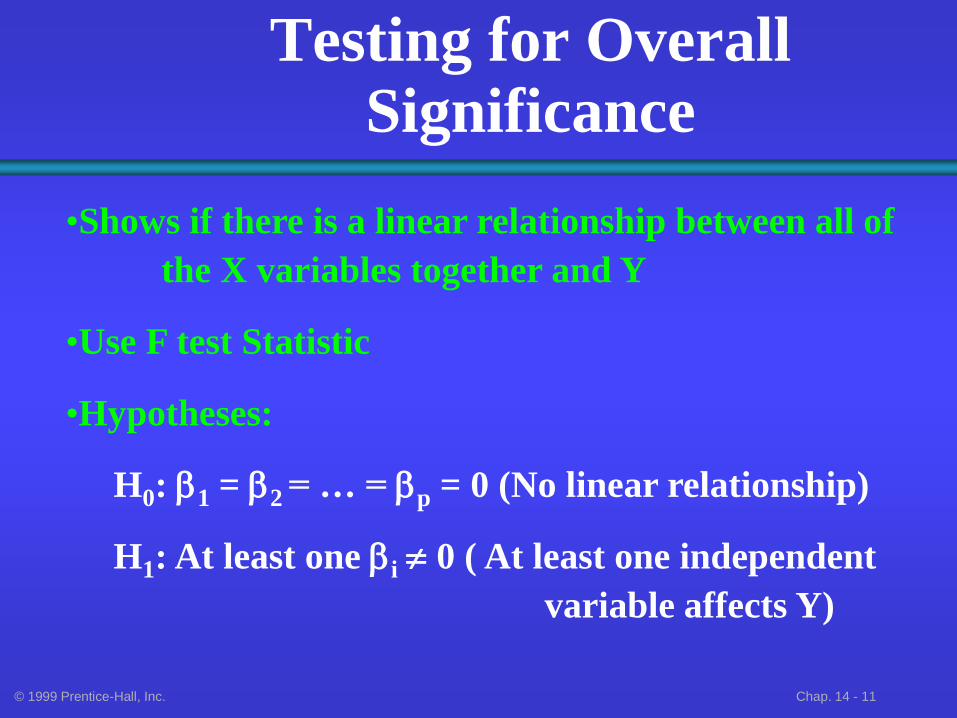
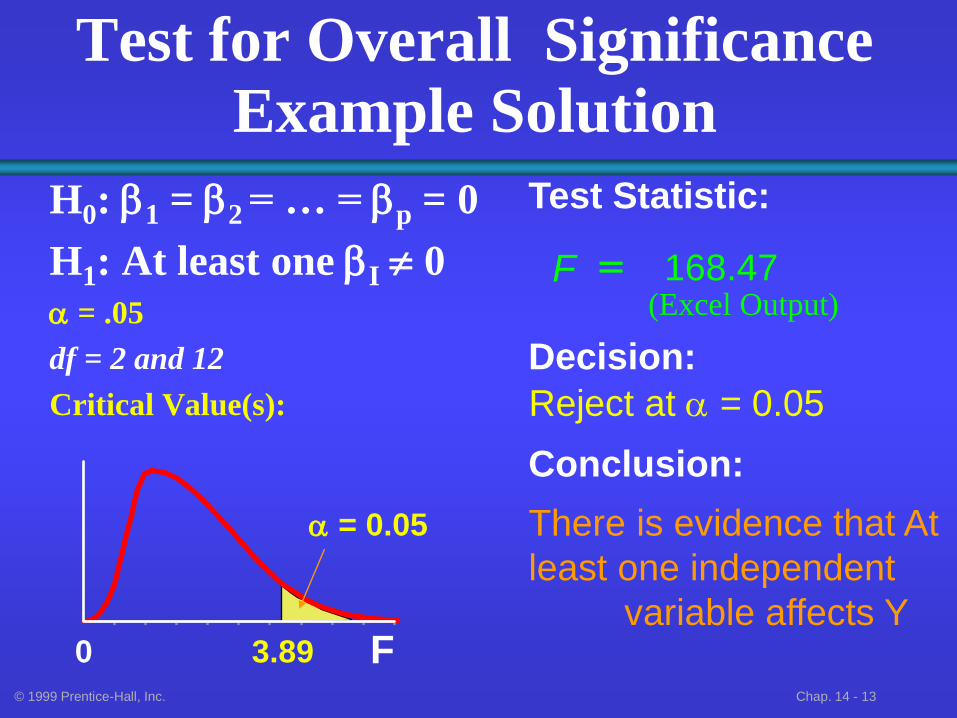
Testing for Overall Significance
•Shows if there is a linear relationship between all of
the X variables together and Y
•Use F test Statistic
•Hypotheses:
H0: 1 = 2 = … = p = 0 (No linear relationship)
H1: At least one i 0 ( At least one independent
variable affects Y)
© 1999 Prentice-Hall, Inc. Chap. 14 - 12
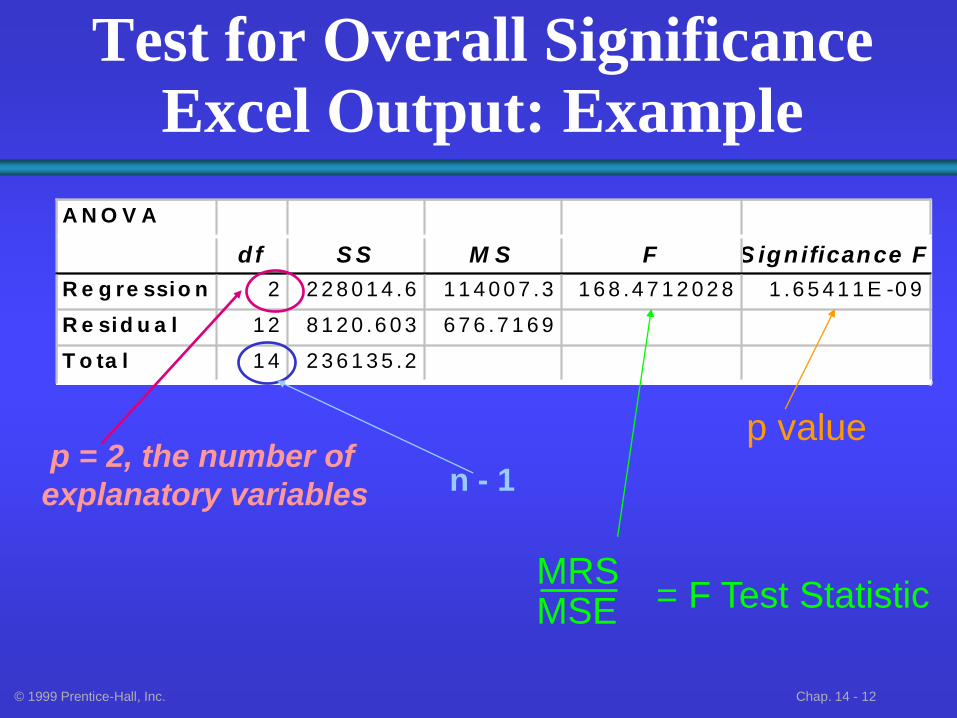
Test for Overall Significance Excel Output: Example
A N O V A
df S S M S F S ignificance F
R e g re ssio n 2 2 2 8 0 1 4 .6 1 1 4 0 0 7 .3 1 6 8 .4 7 1 2 0 2 8 1 .6 5 4 1 1 E -0 9
R e sid u a l 1 2 8 1 2 0 .6 0 3 6 7 6 .7 1 6 9
T o ta l 1 4 2 3 6 1 3 5 .2
p = 2, the number of
explanatory variables n - 1
MRS MSE
p value
= F Test Statistic
© 1999 Prentice-Hall, Inc. Chap. 14 - 13
F 0 3.89
H0: 1 = 2 = … = p = 0
H1: At least one I 0
a = .05
df = 2 and 12
Critical Value(s):
Test Statistic:
Decision:
Conclusion:
Reject at a = 0.05
There is evidence that At
least one independent
variable affects Y
a = 0.05
F
Test for Overall Significance Example Solution
168.47 (Excel Output)
© 1999 Prentice-Hall, Inc. Chap. 14 - 14
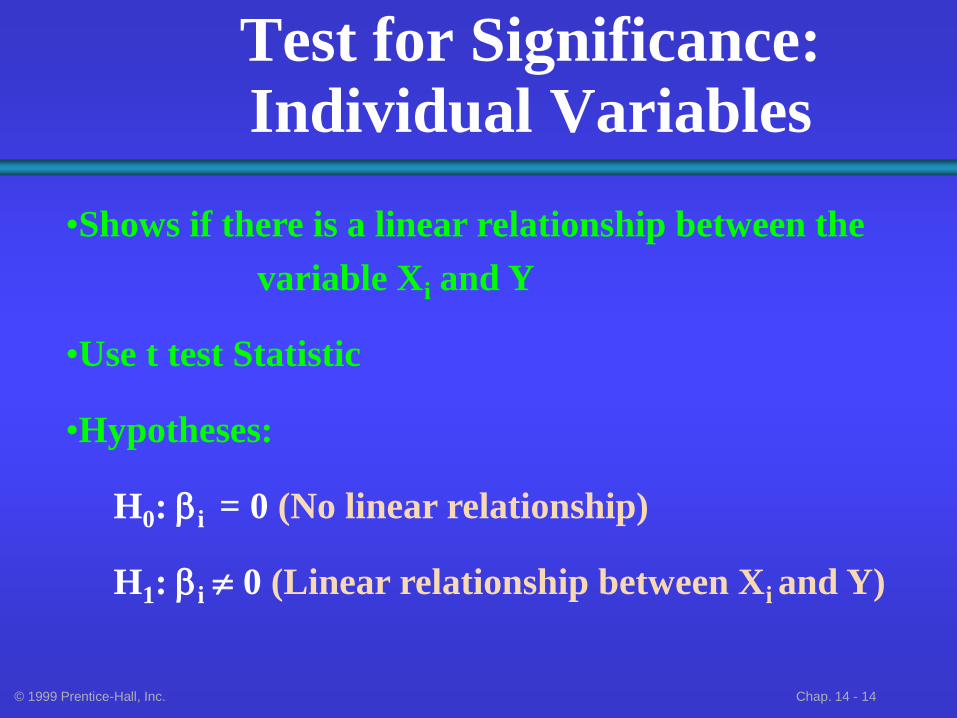
Test for Significance: Individual Variables
•Shows if there is a linear relationship between the
variable Xi and Y
•Use t test Statistic
•Hypotheses:
H0: i = 0 (No linear relationship)
H1: i 0 (Linear relationship between Xi and Y)
© 1999 Prentice-Hall, Inc. Chap. 14 - 15
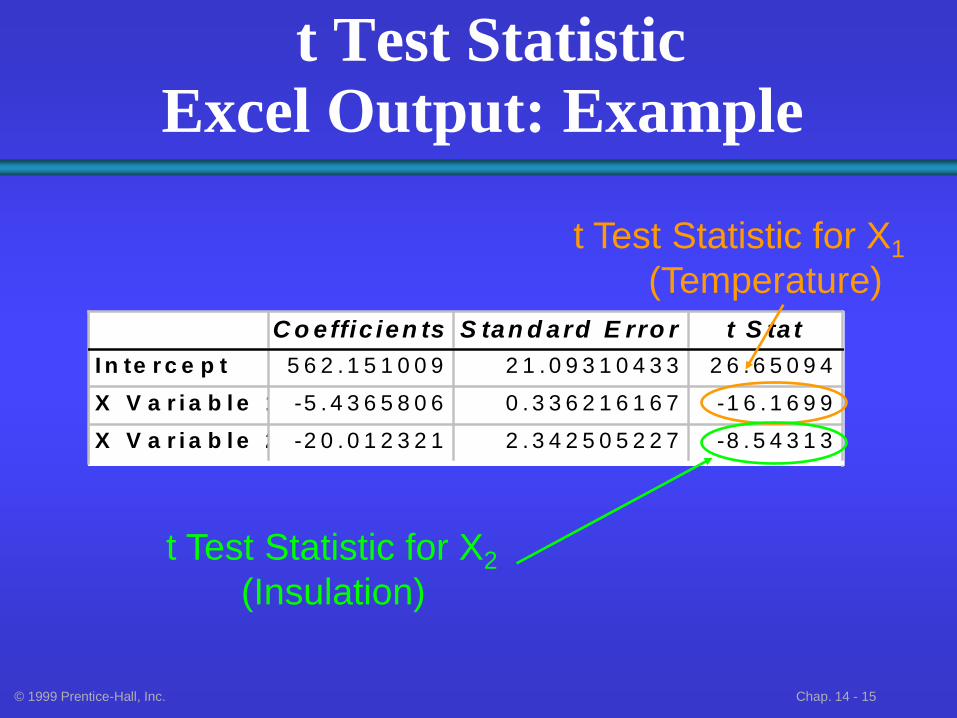
C o effic ien ts S tan d ard E rro r t S ta t
I n te r c e p t 5 6 2 . 1 5 1 0 0 9 2 1 . 0 9 3 1 0 4 3 3 2 6 . 6 5 0 9 4
X V a r i a b l e 1 -5 . 4 3 6 5 8 0 6 0 . 3 3 6 2 1 6 1 6 7 -1 6 . 1 6 9 9
X V a r i a b l e 2 -2 0 . 0 1 2 3 2 1 2 . 3 4 2 5 0 5 2 2 7 -8 . 5 4 3 1 3
t Test Statistic Excel Output: Example
t Test Statistic for X1
(Temperature)
t Test Statistic for X2
(Insulation)
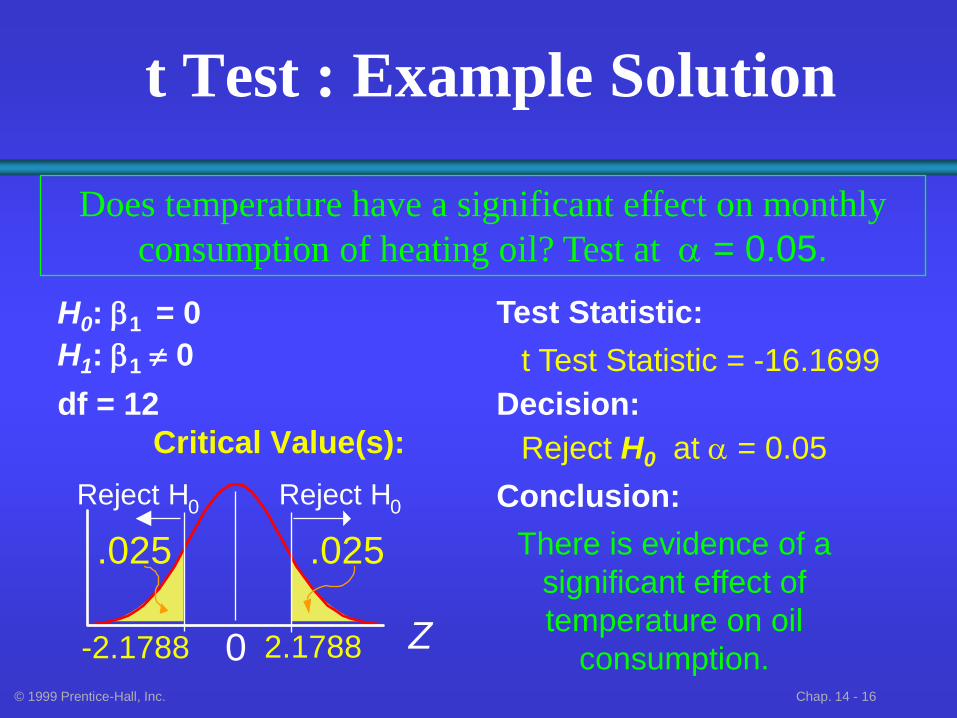
© 1999 Prentice-Hall, Inc. Chap. 14 - 16
H0: 1 = 0
H1: 1 0
df = 12
Critical Value(s):
Test Statistic:
Decision:
Conclusion:
Reject H0 at a = 0.05
There is evidence of a
significant effect of
temperature on oil
consumption. Z 0 2.1788 -2.1788
.025
Reject H 0 Reject H 0
.025
Does temperature have a significant effect on monthly
consumption of heating oil? Test at a = 0.05.
t Test : Example Solution
t Test Statistic = -16.1699
© 1999 Prentice-Hall, Inc. Chap. 14 - 17
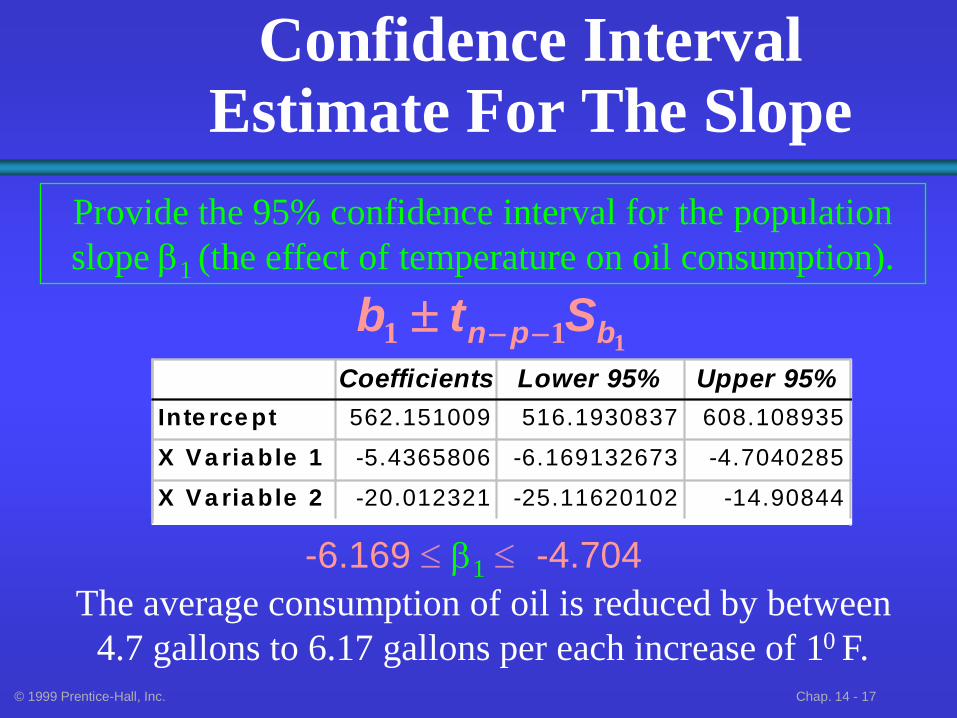
Confidence Interval Estimate For The Slope
Provide the 95% confidence interval for the population
slope 1 (the effect of temperature on oil consumption).
111 bpn Stb
Coefficients Lower 95% Upper 95%
Inte rce pt 562.151009 516.1930837 608.108935
X Va ria ble 1 -5.4365806 -6.169132673 -4.7040285
X Va ria ble 2 -20.012321 -25.11620102 -14.90844
-6.169 1 -4.704
The average consumption of oil is reduced by between
4.7 gallons to 6.17 gallons per each increase of 10 F.
© 1999 Prentice-Hall, Inc. Chap. 14 - 18
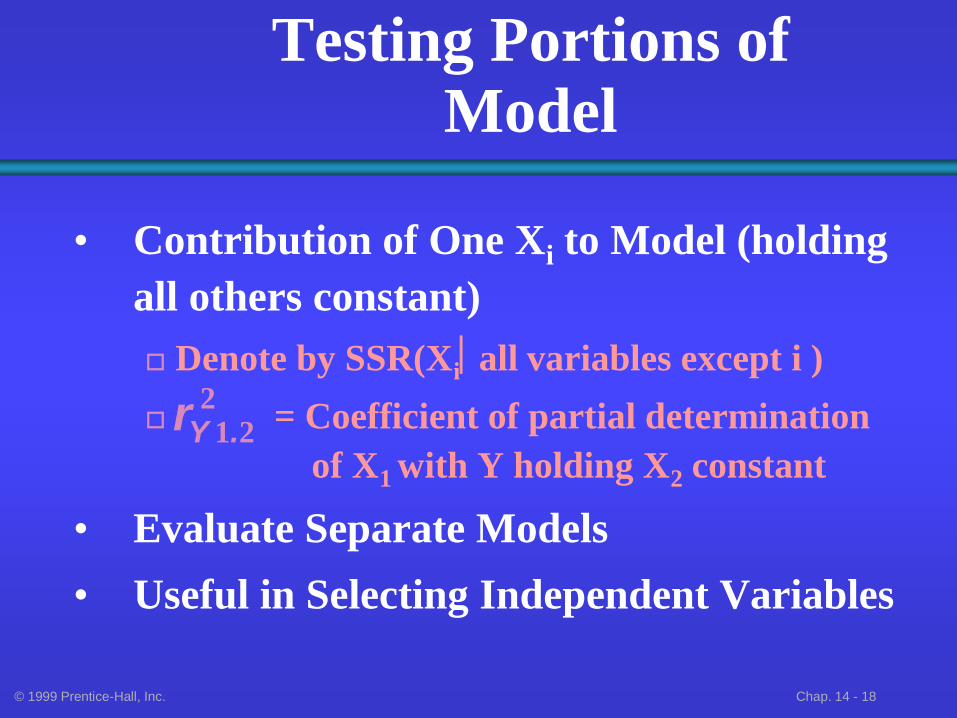
Testing Portions of Model
• Contribution of One Xi to Model (holding
all others constant)
Denote by SSR(Xiall variables except i )
= Coefficient of partial determination
of X1 with Y holding X2 constant
• Evaluate Separate Models
• Useful in Selecting Independent Variables
221.Yr
© 1999 Prentice-Hall, Inc. Chap. 14 - 19
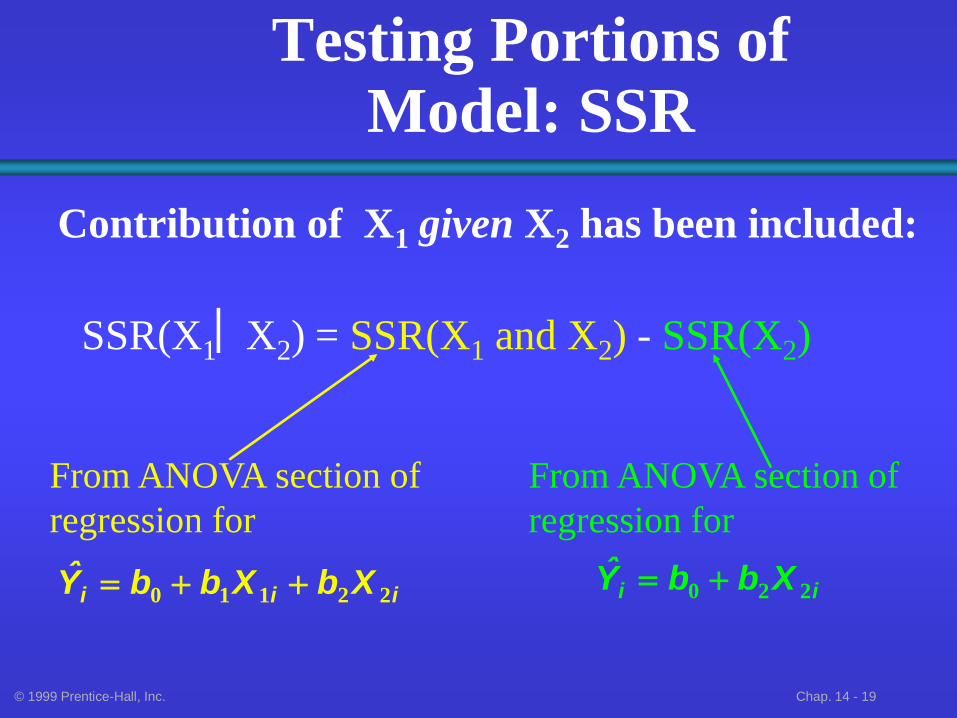
Testing Portions of Model: SSR
Contribution of X1 given X2 has been included:
SSR(X1X2) = SSR(X1 and X2) - SSR(X2)
From ANOVA section of
regression for
iii XbXbbY 22110
From ANOVA section of
regression for
ii XbbY 220
© 1999 Prentice-Hall, Inc. Chap. 14 - 20
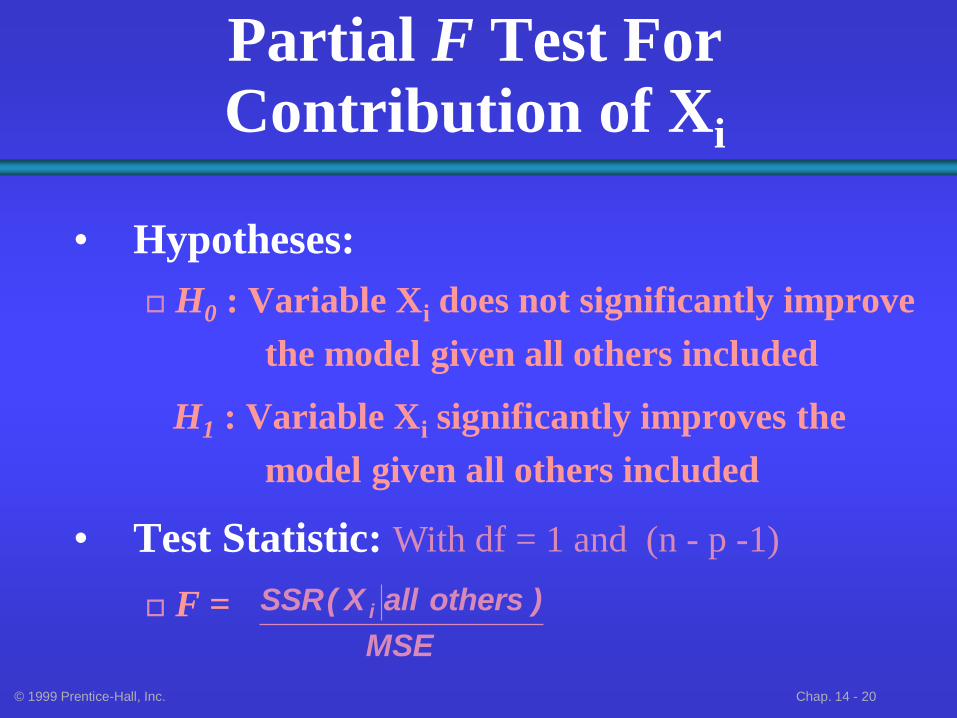
Partial F Test For Contribution of Xi
• Hypotheses:
H0 : Variable Xi does not significantly improve
the model given all others included
H1 : Variable Xi significantly improves the
model given all others included
• Test Statistic:
F = MSE
)othersallX(SSR i
With df = 1 and (n - p -1)
© 1999 Prentice-Hall, Inc. Chap. 14 - 21
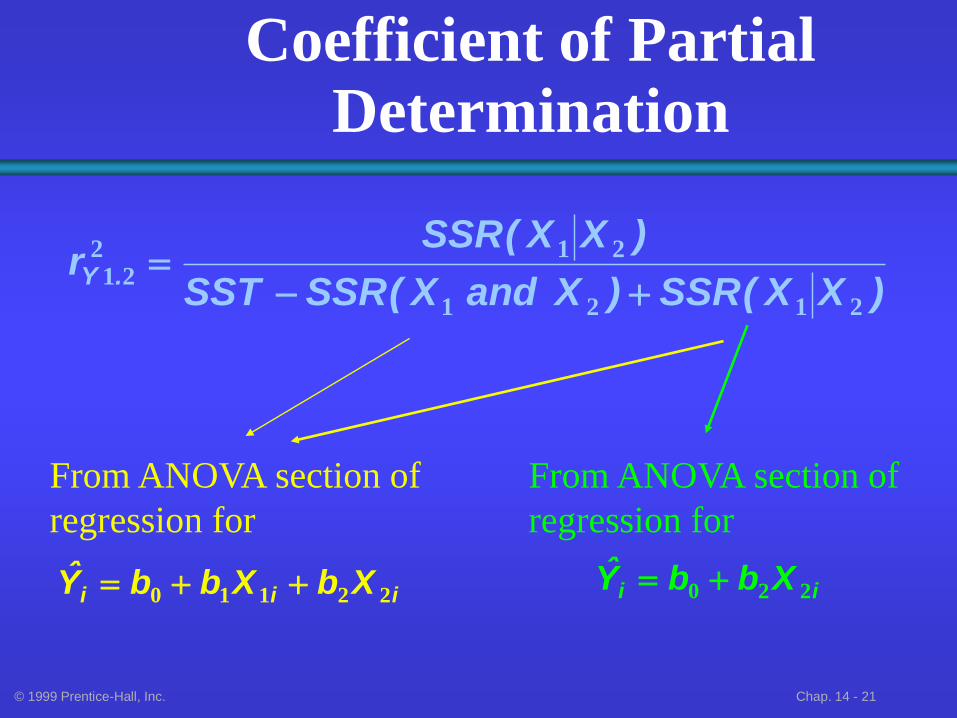
Coefficient of Partial Determination
)XX(SSR)XandX(SSRSST
)XX(SSRr .Y
2121
21221
iii XbXbbY 22110
From ANOVA section of
regression for
From ANOVA section of
regression for
ii XbbY 220
© 1999 Prentice-Hall, Inc. Chap. 14 - 22
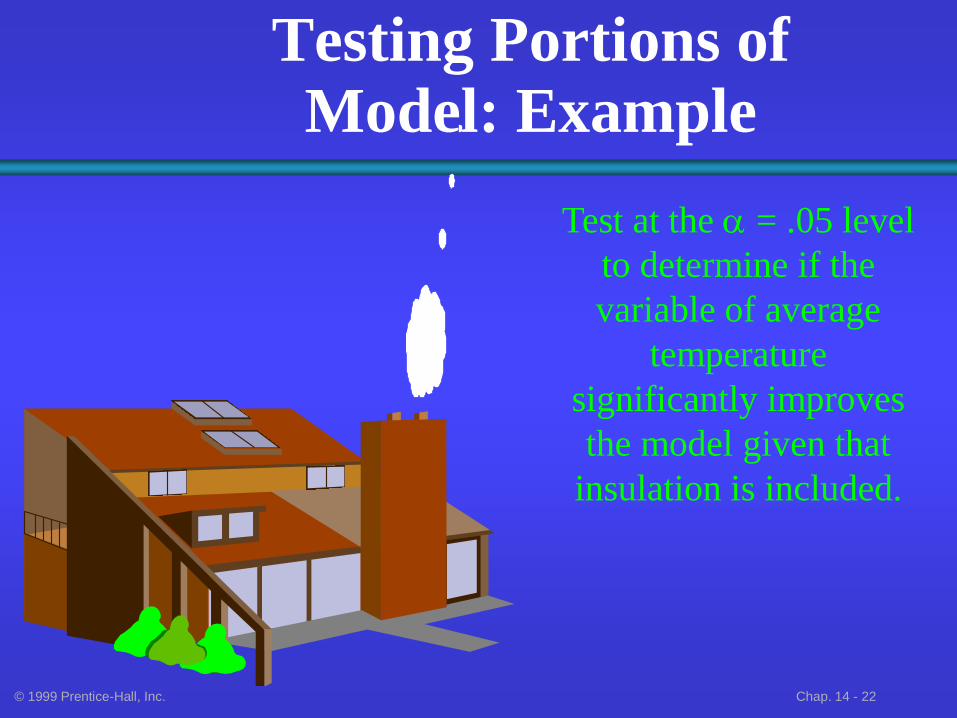
Testing Portions of Model: Example
Test at the a = .05 level
to determine if the
variable of average
temperature
significantly improves
the model given that
insulation is included.
© 1999 Prentice-Hall, Inc. Chap. 14 - 23
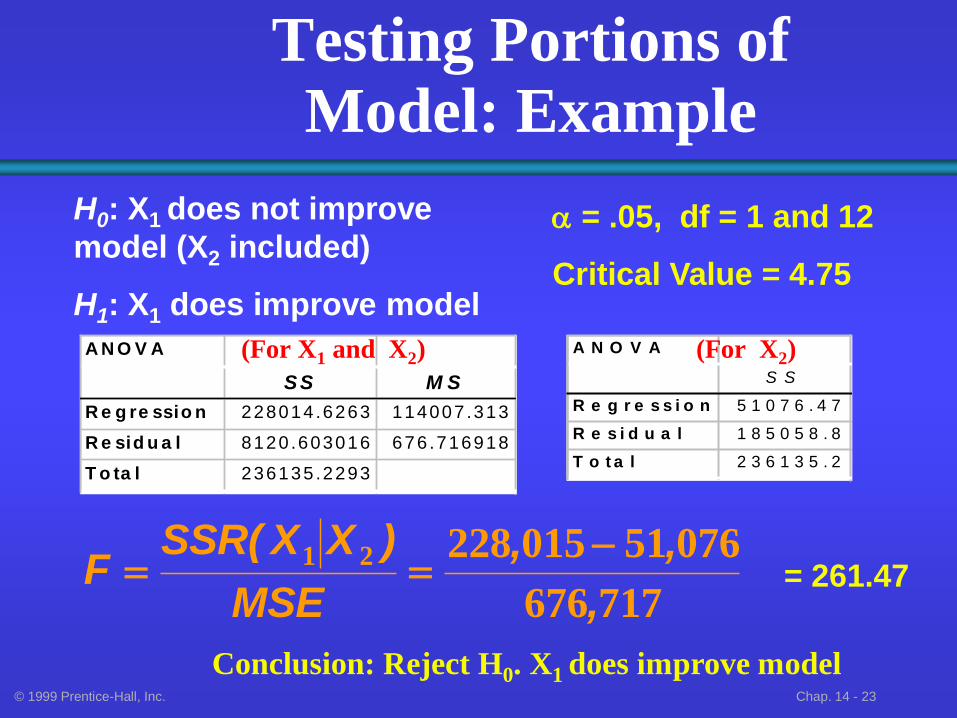
Testing Portions of Model: Example
H0: X1 does not improve
model (X2 included)
H1: X1 does improve model
a = .05, df = 1 and 12
Critical Value = 4.75
A N O V A
S S
R e g r e s s i o n 5 1 0 7 6 . 4 7
R e s i d u a l 1 8 5 0 5 8 . 8
T o t a l 2 3 6 1 3 5 . 2
717676
0765101522821
,
,,
MSE
)XX(SSRF
A N O V A
SS M S
R e g re ssio n 228014 .6263 114007 .313
R e sid u a l 8120 .603016 676 .716918
T o ta l 236135 .2293
(For X1 and X2) (For X2)
= 261.47
Conclusion: Reject H0. X1 does improve model
© 1999 Prentice-Hall, Inc. Chap. 14 - 24
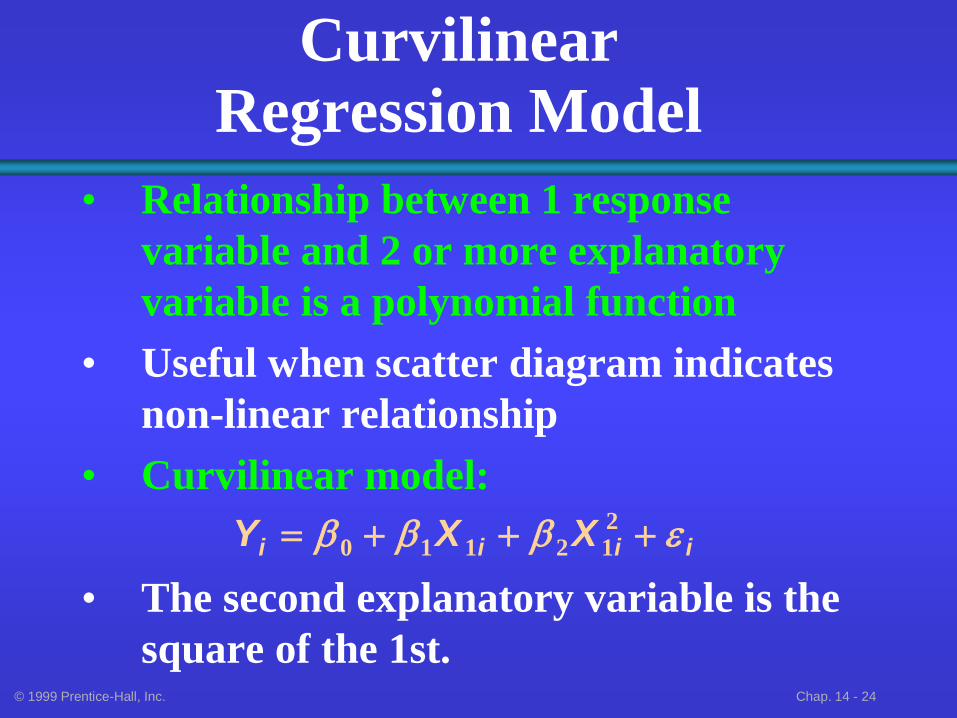
Curvilinear Regression Model
• Relationship between 1 response
variable and 2 or more explanatory
variable is a polynomial function
• Useful when scatter diagram indicates
non-linear relationship
• Curvilinear model:
• The second explanatory variable is the
square of the 1st.
iiii XXY 212110
© 1999 Prentice-Hall, Inc. Chap. 14 - 25
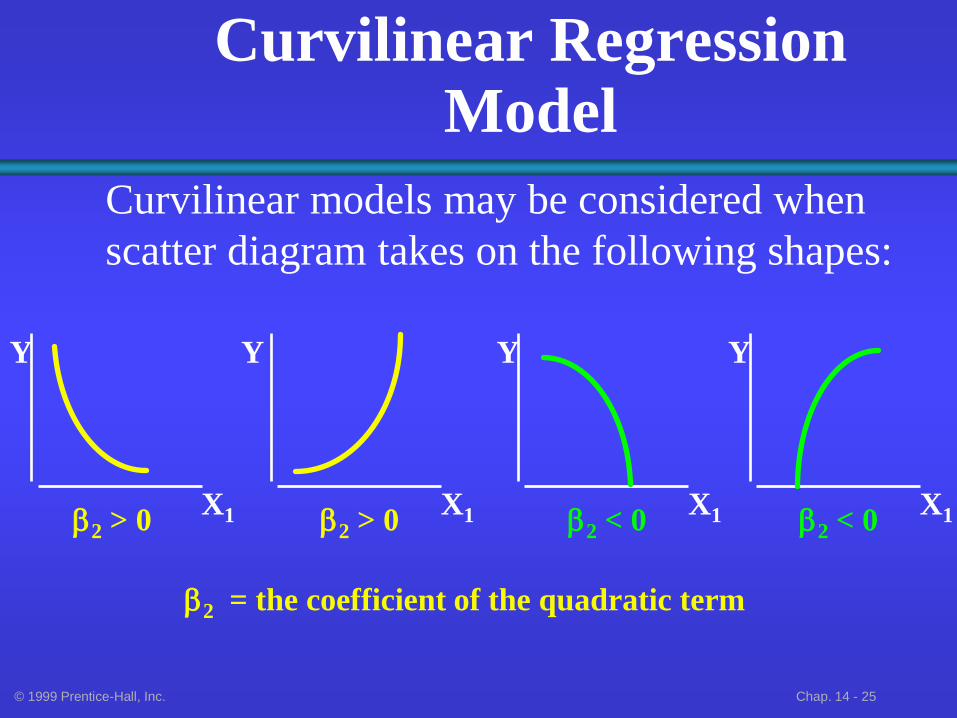
Curvilinear Regression Model
Curvilinear models may be considered when
scatter diagram takes on the following shapes:
X1
Y
X1 X1 X1
Y Y Y
2 > 0 2 > 0 2 < 0 2 < 0
2 = the coefficient of the quadratic term
© 1999 Prentice-Hall, Inc. Chap. 14 - 26
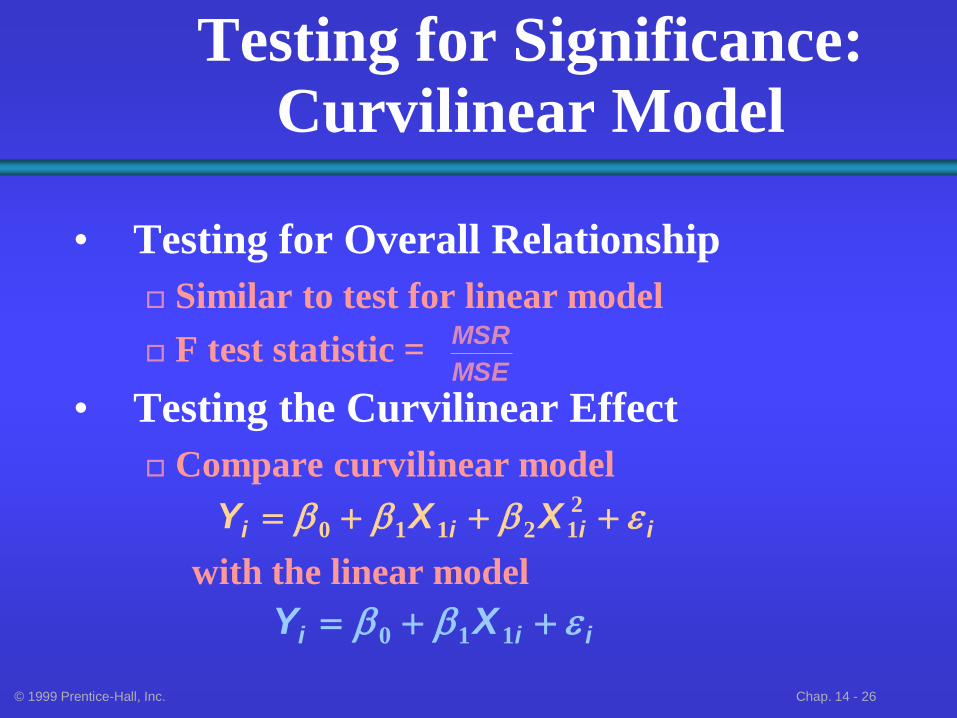
Testing for Significance: Curvilinear Model
• Testing for Overall Relationship
Similar to test for linear model
F test statistic =
• Testing the Curvilinear Effect
Compare curvilinear model
with the linear model
MSE
MSR
iiii XXY 212110
iii XY 110
© 1999 Prentice-Hall, Inc. Chap. 14 - 27
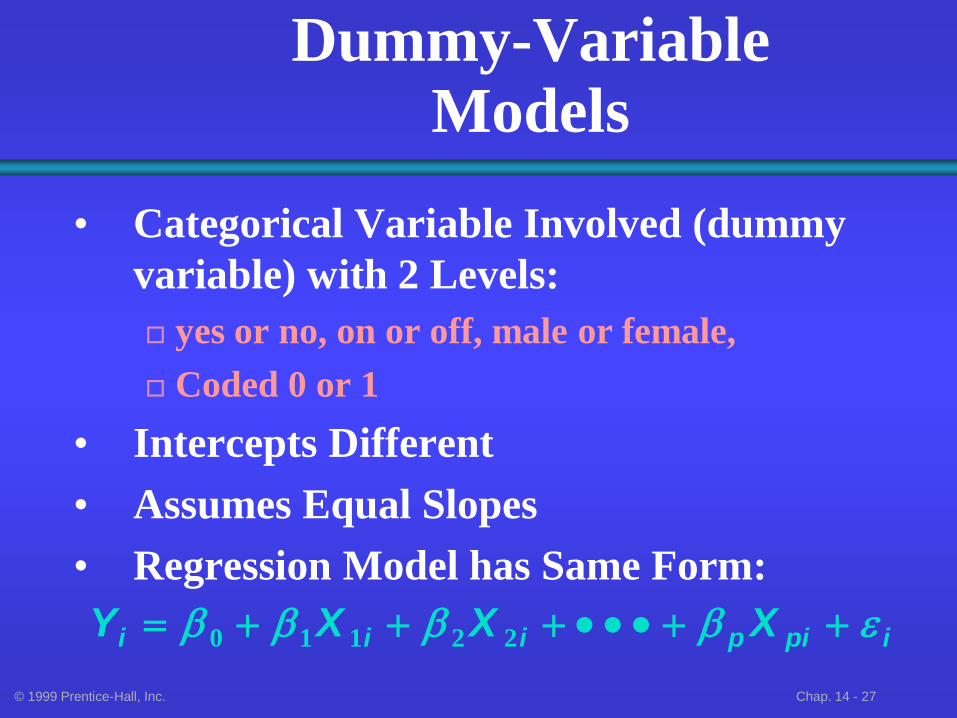
Dummy-Variable Models
• Categorical Variable Involved (dummy
variable) with 2 Levels:
yes or no, on or off, male or female,
Coded 0 or 1
• Intercepts Different
• Assumes Equal Slopes
• Regression Model has Same Form:
ipipiii XXXY 22110
© 1999 Prentice-Hall, Inc. Chap. 14 - 28
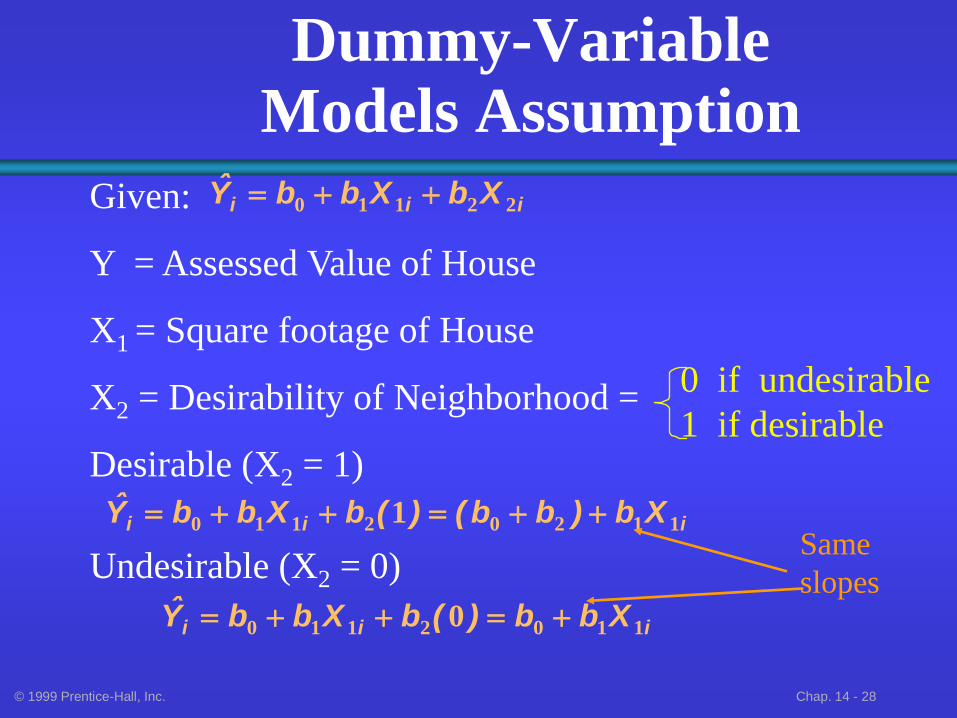
Dummy-Variable Models Assumption
Given:
Y = Assessed Value of House
X1 = Square footage of House
X2 = Desirability of Neighborhood =
Desirable (X2 = 1)
Undesirable (X2 = 0)
iii Xb)bb()(bXbbY 11202110 1
0 if undesirable
1 if desirable
iii Xbb)(bXbbY 1102110 0
iii XbXbbY 22110
Same
slopes
© 1999 Prentice-Hall, Inc. Chap. 14 - 29
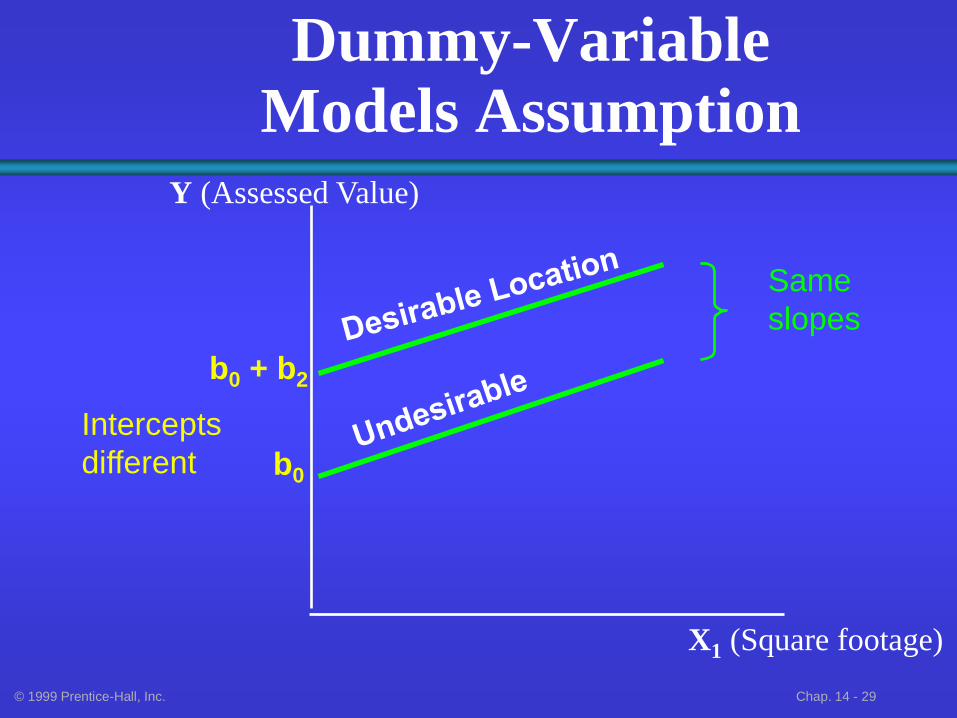
Dummy-Variable Models Assumption
X1 (Square footage)
Y (Assessed Value)
b0 + b2
b0
Same
slopes
Intercepts
different
© 1999 Prentice-Hall, Inc. Chap. 14 - 30
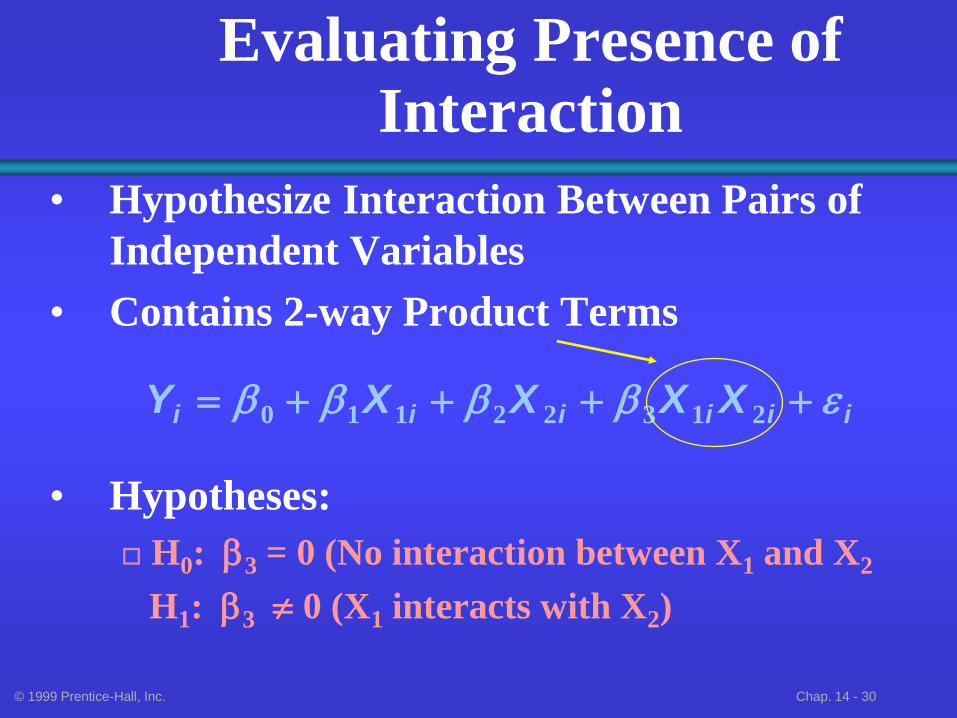
Evaluating Presence of Interaction
• Hypothesize Interaction Between Pairs of
Independent Variables
• Contains 2-way Product Terms
• Hypotheses:
H0: 3 = 0 (No interaction between X1 and X2
H1: 3 0 (X1 interacts with X2)
iiiiii XXXXY 21322110
© 1999 Prentice-Hall, Inc. Chap. 14 - 31
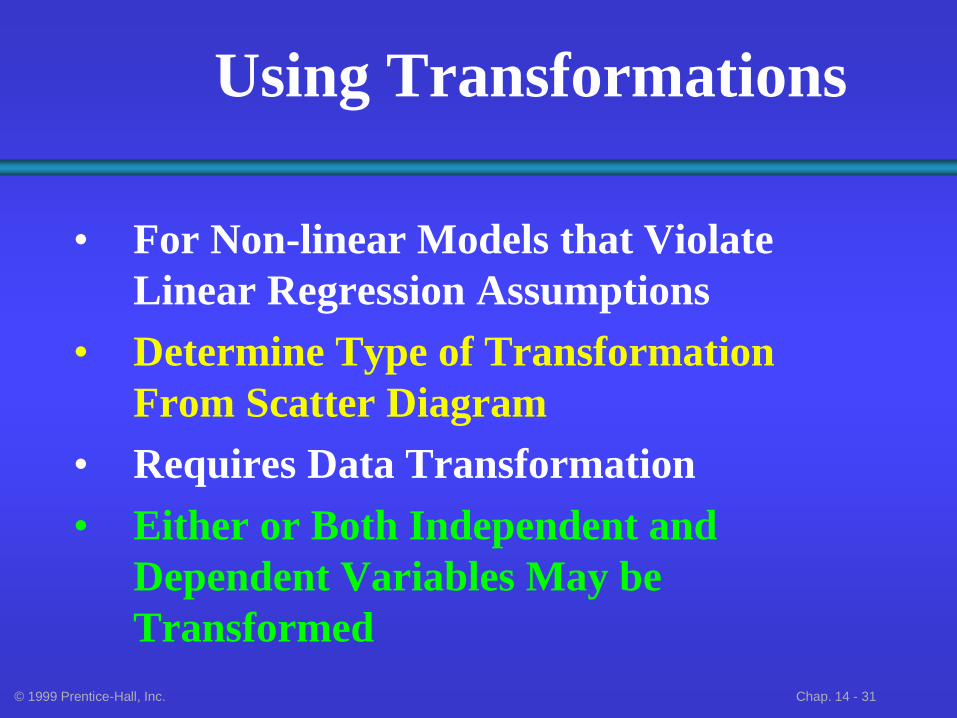
Using Transformations
• For Non-linear Models that Violate
Linear Regression Assumptions
• Determine Type of Transformation
From Scatter Diagram
• Requires Data Transformation
• Either or Both Independent and
Dependent Variables May be
Transformed
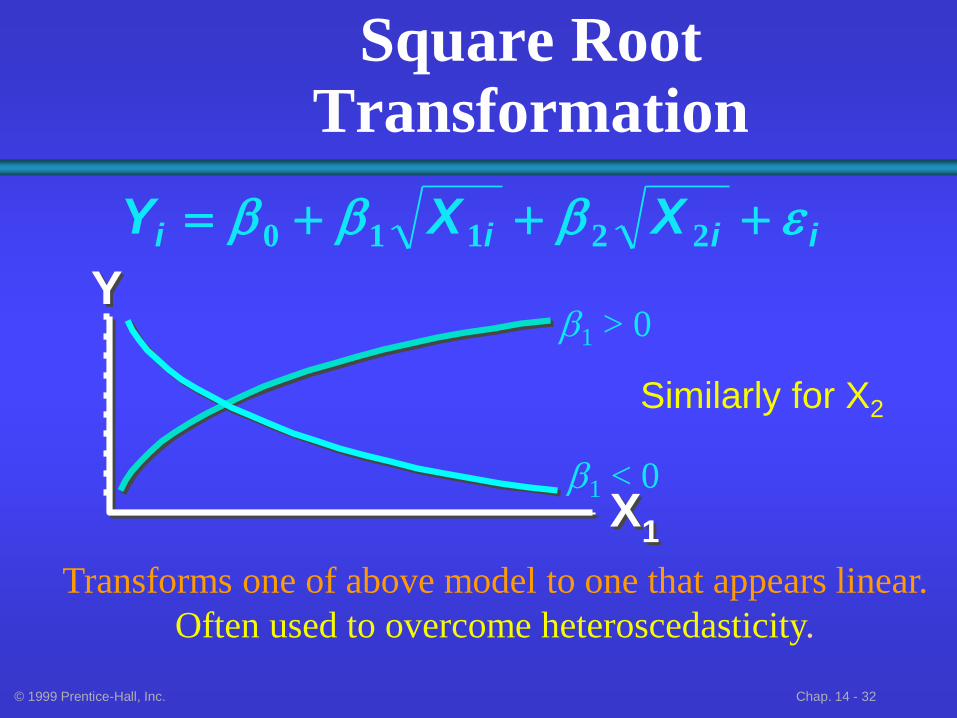
© 1999 Prentice-Hall, Inc. Chap. 14 - 32
Square Root Transformation
Y
X1
Y
X1
iiii XXY 22110
1 > 0
1 < 0
Similarly for X2
Transforms one of above model to one that appears linear.
Often used to overcome heteroscedasticity.
© 1999 Prentice-Hall, Inc. Chap. 14 - 33
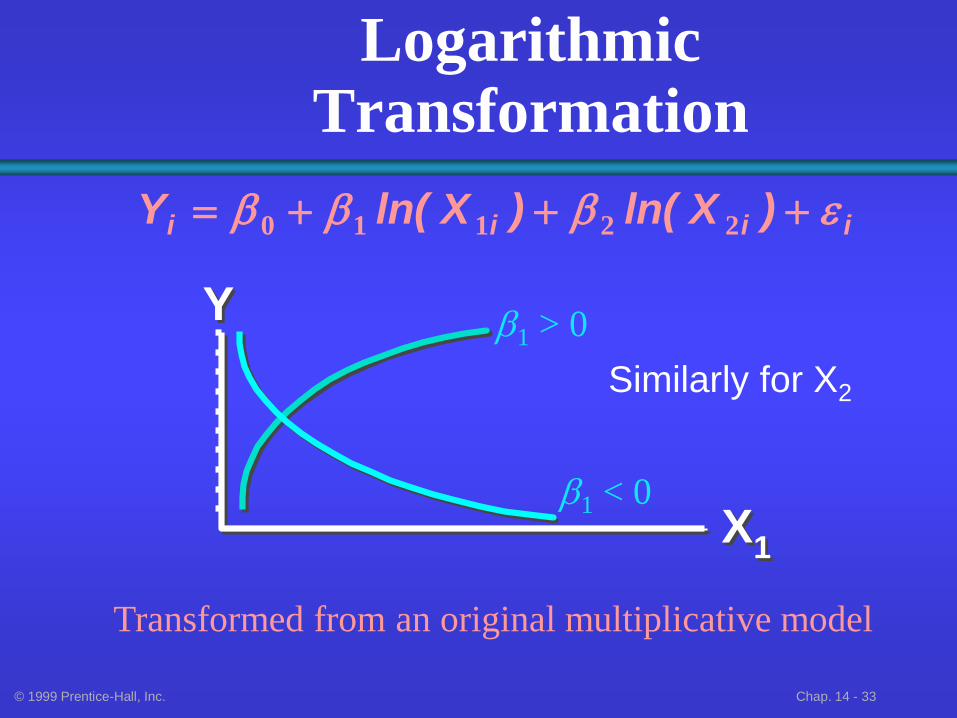
Logarithmic Transformation
Y
X1
Y
X1
iiii )Xln()Xln(Y 22110
1 > 0
1 < 0
Similarly for X2
Transformed from an original multiplicative model
© 1999 Prentice-Hall, Inc. Chap. 14 - 34
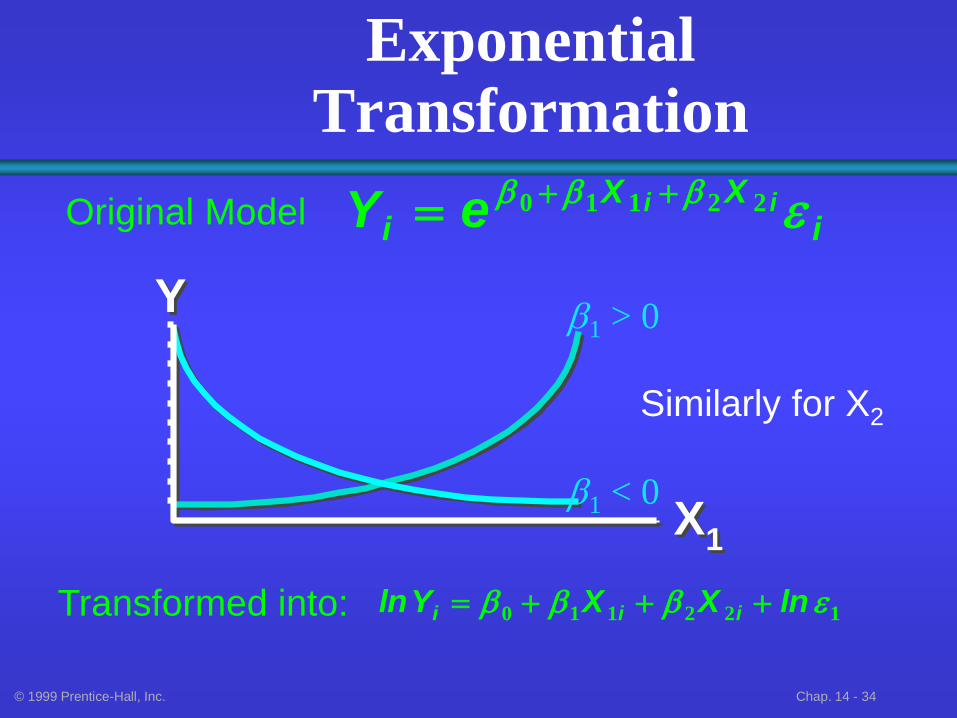
Exponential Transformation
Y
X1
Y
X1
iXX
iiieY 22110
Original Model
1 > 0
1 < 0
Similarly for X2
Transformed into: 122110 lnXXYln iii
© 1999 Prentice-Hall, Inc. Chap. 14 - 35
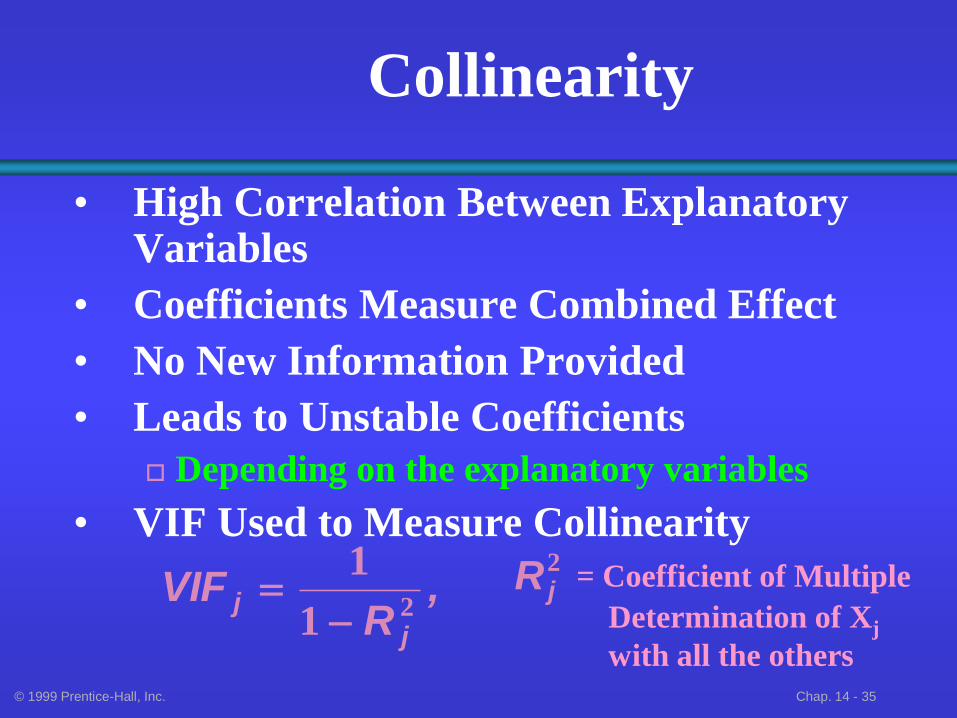
Collinearity
• High Correlation Between Explanatory Variables
• Coefficients Measure Combined Effect
• No New Information Provided
• Leads to Unstable Coefficients
Depending on the explanatory variables
• VIF Used to Measure Collinearity
,R
VIFj
j 21
1
2jR = Coefficient of Multiple
Determination of Xj
with all the others
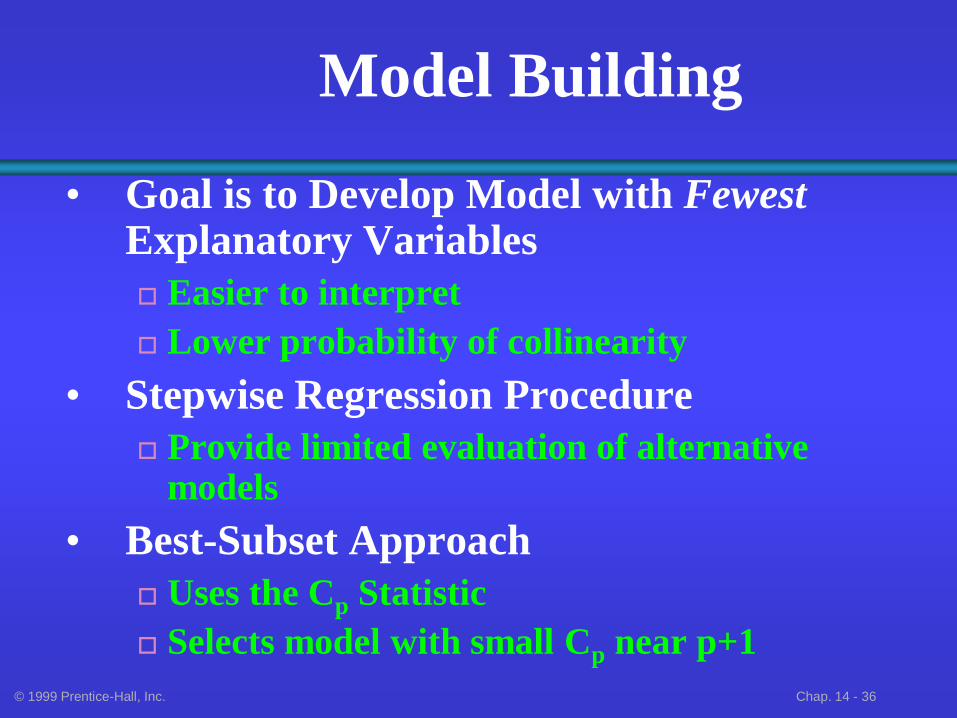
© 1999 Prentice-Hall, Inc. Chap. 14 - 36
Model Building
• Goal is to Develop Model with Fewest Explanatory Variables
Easier to interpret
Lower probability of collinearity
• Stepwise Regression Procedure
Provide limited evaluation of alternative models
• Best-Subset Approach
Uses the Cp Statistic
Selects model with small Cp near p+1
© 1999 Prentice-Hall, Inc. Chap. 14 - 37
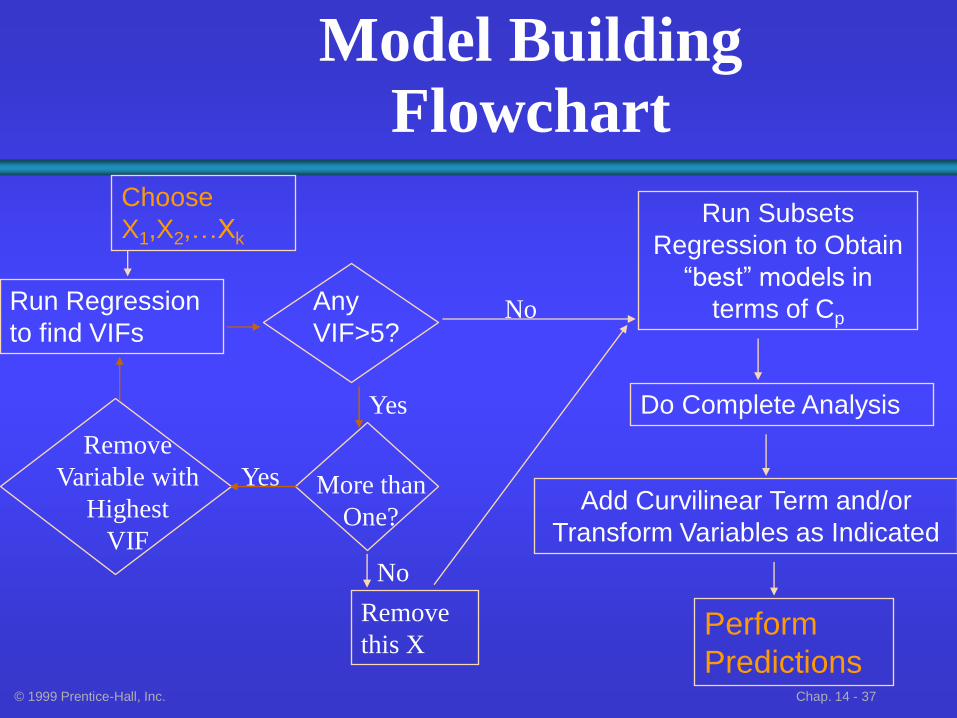
Model Building Flowchart
Choose
X1,X2,…Xk
Run Regression
to find VIFs
Remove
Variable with
Highest
VIF
Any
VIF>5?
Run Subsets
Regression to Obtain
“best” models in
terms of Cp
Do Complete Analysis
Add Curvilinear Term and/or
Transform Variables as Indicated
Perform
Predictions
No
More than
One?
Remove
this X
Yes
No
Yes
© 1999 Prentice-Hall, Inc. Chap. 14 - 38
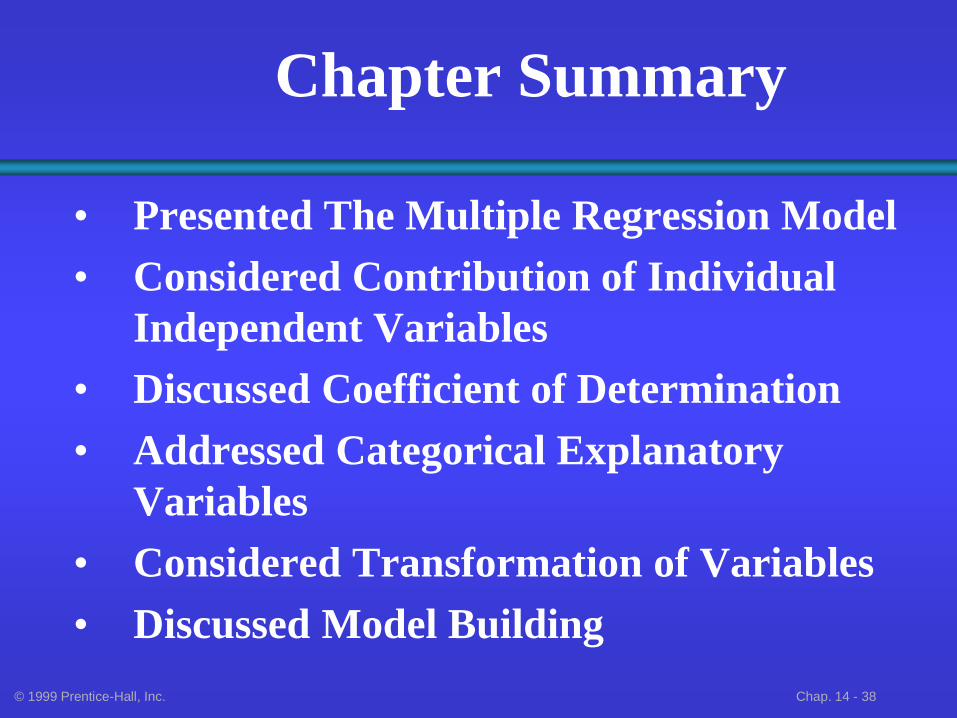
Chapter Summary
• Presented The Multiple Regression Model
• Considered Contribution of Individual
Independent Variables
• Discussed Coefficient of Determination
• Addressed Categorical Explanatory
Variables
• Considered Transformation of Variables
• Discussed Model Building