Embed Size (px)
Citation preview

© 1999 Prentice-Hall, Inc. Chap. 13 - 1
Statistics for Managers
Using Microsoft Excel/SPSS
Chapter 13
The Simple Linear Regression
Model and Correlation

© 1999 Prentice-Hall, Inc. Chap. 13 - 2
Chapter Topics
• Types of Regression Models
• Determining the Simple Linear Regression Equation
• Measures of Variation in Regression and Correlation
• Assumptions of Regression and Correlation
• Residual Analysis and the Durbin-Watson Statistic
• Estimation of Predicted Values
• Correlation - Measuring the Strength of the Association

© 1999 Prentice-Hall, Inc. Chap. 13 - 3
Purpose of Regression and Correlation Analysis
• Regression Analysis is Used Primarily for
Prediction
A statistical model used to predict the values of a
dependent or response variable based on values of
at least one independent or explanatory variable
Correlation Analysis is Used to Measure
Strength of the Association Between
Numerical Variables

© 1999 Prentice-Hall, Inc. Chap. 13 - 4
The Scatter Diagram
0
20
40
60
0 20 40 60
X
Y
Plot of all (Xi , Yi) pairs

© 1999 Prentice-Hall, Inc. Chap. 13 - 5
Types of Regression Models
Positive Linear Relationship
Negative Linear Relationship
Relationship NOT Linear
No Relationship

© 1999 Prentice-Hall, Inc. Chap. 13 - 6
Simple Linear Regression Model
iii XY 10
Y intercept
Slope
• The Straight Line that Best Fit the Data
• Relationship Between Variables Is a Linear Function
Random
Error
Dependent
(Response)
Variable
Independent
(Explanatory)
Variable

© 1999 Prentice-Hall, Inc. Chap. 13 - 7
i = Random Error
Y
X
Population
Linear Regression Model
Observed
Value
Observed Value
m YX i X 0 1
Y X i i i 0 1
© 1999 Prentice-Hall, Inc. Chap. 13 - 8
Sample Linear Regression Model
ii XbbY 10
Yi
= Predicted Value of Y for observation i
Xi = Value of X for observation i
b0 = Sample Y - intercept used as estimate of
the population 0
b1 = Sample Slope used as estimate of the
population 1

© 1999 Prentice-Hall, Inc. Chap. 13 - 9
Simple Linear Regression Equation: Example
You wish to examine the
relationship between the
square footage of produce
stores and its annual sales.
Sample data for 7 stores
were obtained. Find the
equation of the straight
line that fits the data best
Annual Store Square Sales Feet ($000)
1 1,726 3,681
2 1,542 3,395
3 2,816 6,653
4 5,555 9,543
5 1,292 3,318
6 2,208 5,563
7 1,313 3,760

© 1999 Prentice-Hall, Inc. Chap. 13 - 10
Scatter Diagram Example
0
2 0 0 0
4 0 0 0
6 0 0 0
8 0 0 0
1 0 0 0 0
1 2 0 0 0
0 1 0 0 0 2 0 0 0 3 0 0 0 4 0 0 0 5 0 0 0 6 0 0 0
S q u a re F e e t
An
nu
al
Sa
les (
$0
00
)
Excel Output

© 1999 Prentice-Hall, Inc. Chap. 13 - 11
Equation for the Best Straight Line
i
ii
X..
XbbY
48714151636
10
From Excel Printout:
C o effic ien ts
I n te r c e p t 1 6 3 6 . 4 1 4 7 2 6
X V a r i a b l e 1 1 . 4 8 6 6 3 3 6 5 7

© 1999 Prentice-Hall, Inc. Chap. 13 - 12
Graph of the Best Straight Line
0
2 0 0 0
4 0 0 0
6 0 0 0
8 0 0 0
1 0 0 0 0
1 2 0 0 0
0 1 0 0 0 2 0 0 0 3 0 0 0 4 0 0 0 5 0 0 0 6 0 0 0
S q u a re F e e t
An
nu
al
Sa
les (
$0
00
)

© 1999 Prentice-Hall, Inc. Chap. 13 - 13
Interpreting the Results
Yi = 1636.415 +1.487Xi
The slope of 1.487 means for each increase of one
unit in X, the Y is estimated to increase 1.487units.
For each increase of 1 square foot in the size of the
store, the model predicts that the expected annual
sales are estimated to increase by $1487.

© 1999 Prentice-Hall, Inc. Chap. 13 - 14
Measures of Variation: The Sum of Squares
SST = Total Sum of Squares
•measures the variation of the Yi values around their
mean Y
SSR = Regression Sum of Squares
•explained variation attributable to the relationship
between X and Y
SSE = Error Sum of Squares
•variation attributable to factors other than the
relationship between X and Y
_

© 1999 Prentice-Hall, Inc. Chap. 13 - 15
Measures of Variation: The Sum of Squares
Xi
Y
X
Y
SST = (Yi - Y)2
SSE =(Yi - Yi )2
SSR = (Yi - Y)2
_
_
_

© 1999 Prentice-Hall, Inc. Chap. 13 - 16
d f S S
R e g r e ssi o n 1 3 0 3 8 0 4 5 6 . 1 2
R e si d u a l 5 1 8 7 1 1 9 9 . 5 9 5
T o ta l 6 3 2 2 5 1 6 5 5 . 7 1
Measures of Variation The Sum of Squares:
Example
Excel Output for Produce Stores
SSR SSE SST
© 1999 Prentice-Hall, Inc. Chap. 13 - 17
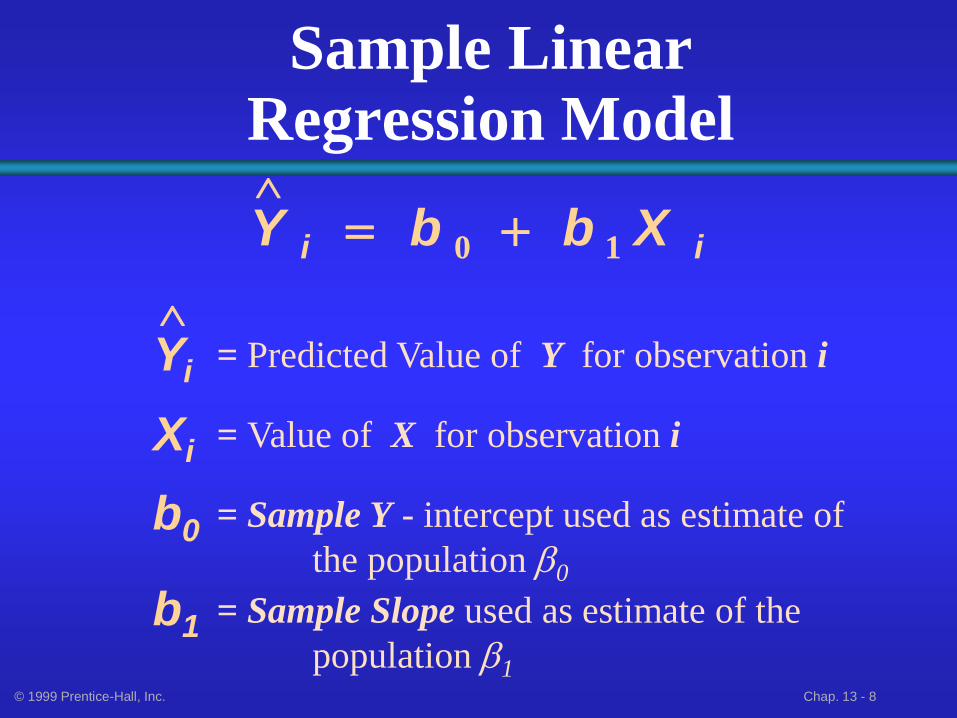
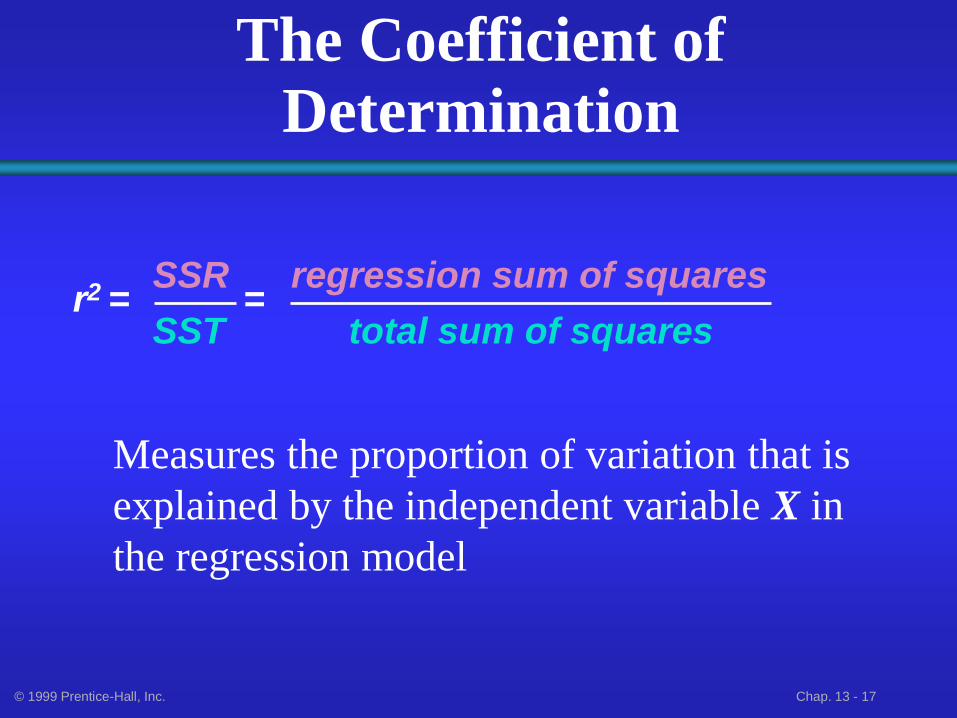
The Coefficient of Determination
SSR regression sum of squares
SST total sum of squares r2 = =
Measures the proportion of variation that is
explained by the independent variable X in
the regression model

© 1999 Prentice-Hall, Inc. Chap. 13 - 18
Coefficients of Determination
(r2) and Correlation (r)
r2 = 1, r2 = 1,
r2 = .8, r2 = 0, Y
Y i = b 0 + b 1 X i
X
^
Y
Y i = b 0 + b 1 X i
X
^ Y
Y i = b 0 + b 1 X i X
^
Y
Y i = b 0 + b 1 X i
X
^
r = +1 r = -1
r = +0.9 r = 0

© 1999 Prentice-Hall, Inc. Chap. 13 - 19
Standard Error of Estimate
2
n
SSESyx
2
1
2
n
)YY(n
iii
=
The standard deviation of the variation of
observations around the regression line

© 1999 Prentice-Hall, Inc. Chap. 13 - 20
R e g re ssio n S ta tistic s
M u lt ip le R 0 . 9 7 0 5 5 7 2
R S q u a re 0 . 9 4 1 9 8 1 2 9
A d ju s t e d R S q u a re 0 . 9 3 0 3 7 7 5 4
S t a n d a rd E rro r 6 1 1 . 7 5 1 5 1 7
O b s e rva t io n s 7
Measures of Variation:
Example
Excel Output for Produce Stores
r2 = .94 Syx 94% of the variation in annual sales can be
explained by the variability in the size of the
store as measured by square footage

© 1999 Prentice-Hall, Inc. Chap. 13 - 21
Linear Regression
Assumptions
1. Normality
Y Values Are Normally Distributed For Each
X
Probability Distribution of Error is Normal
2. Homoscedasticity (Constant Variance)
3. Independence of Errors
For Linear Models

© 1999 Prentice-Hall, Inc. Chap. 13 - 22
Variation of Errors Around the Regression Line
X1
X2
X
Y
f(e) y values are normally distributed
around the regression line.
For each x value, the “spread” or
variance around the regression
line is the same.
Regression Line

© 1999 Prentice-Hall, Inc. Chap. 13 - 23
Residual Analysis
• Purposes
Examine Linearity
Evaluate violations of assumptions
• Graphical Analysis of Residuals
Plot residuals Vs. Xi values
Difference between actual Yi & predicted Yi
Studentized residuals:
Allows consideration for the magnitude of the
residuals

© 1999 Prentice-Hall, Inc. Chap. 13 - 24
Residual Analysis for Linearity
Not Linear Linear
X
e e
X

© 1999 Prentice-Hall, Inc. Chap. 13 - 25
Residual Analysis for Homoscedasticity
Heteroscedasticity Homoscedasticity
Using Standardized Residuals
SR
X
SR
X

© 1999 Prentice-Hall, Inc. Chap. 13 - 26
R e s id u a l P lo t
0 1 0 0 0 2 0 0 0 3 0 0 0 4 0 0 0 5 0 0 0 6 0 0 0
S q u a r e F e e t
Residual Analysis:
Computer Output Example
Produce Stores
Excel Output
Observation Predicted Y Residuals
1 4202.344417 -521.3444173
2 3928.803824 -533.8038245
3 5822.775103 830.2248971
4 9894.664688 -351.6646882
5 3557.14541 -239.1454103
6 4918.90184 644.0981603
7 3588.364717 171.6352829

© 1999 Prentice-Hall, Inc. Chap. 13 - 27
The Durbin-Watson Statistic
•Used when data is collected over time to detect
autocorrelation (Residuals in one time period
are related to residuals in another period)
•Measures Violation of independence assumption
n
ii
n
iii
e
)ee(D
1
2
2
21 Should be close to 2.
If not, examine the model
for autocorrelation.

© 1999 Prentice-Hall, Inc. Chap. 13 - 28
Residual Analysis for
Independence
Not Independent Independent
X
SR
X
SR

© 1999 Prentice-Hall, Inc. Chap. 13 - 29
Inferences about the Slope: t Test
• t Test for a Population Slope
Is a Linear Relationship Between X & Y ?
1
11
bS
bt
•Test Statistic:
n
ii
YXb
)XX(
SS
1
21
and df = n - 2
•Null and Alternative Hypotheses
H0: 1 = 0 (No Linear Relationship)
H1: 1 0 (Linear Relationship)
Where
© 1999 Prentice-Hall, Inc. Chap. 13 - 30
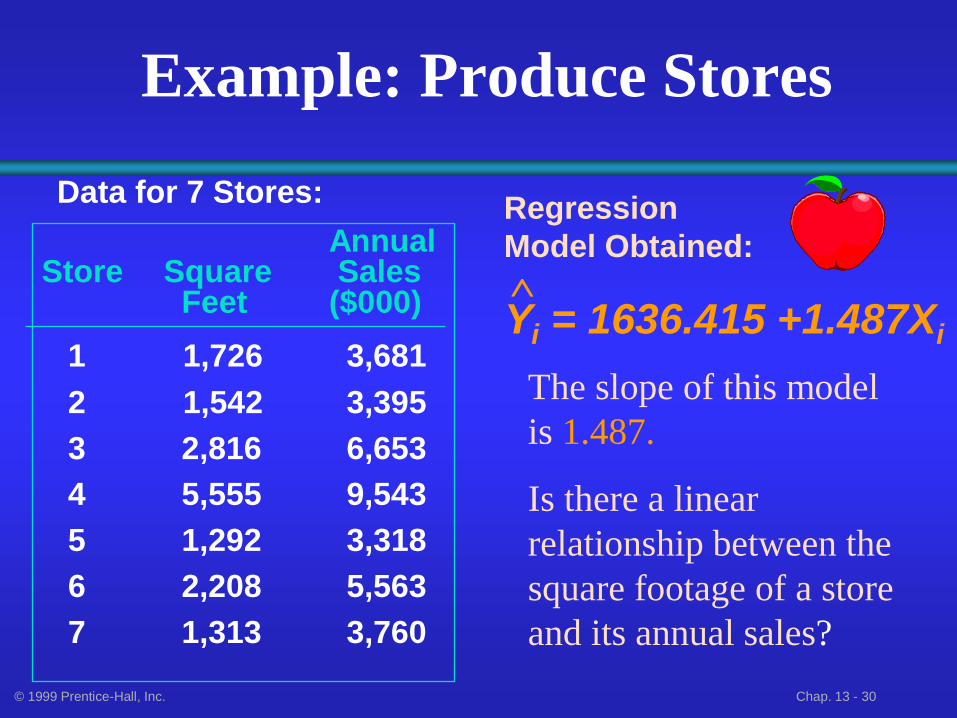
Example: Produce Stores
Data for 7 Stores: Regression
Model Obtained:
The slope of this model
is 1.487.
Is there a linear
relationship between the
square footage of a store
and its annual sales?
Annual Store Square Sales Feet ($000)
1 1,726 3,681
2 1,542 3,395
3 2,816 6,653
4 5,555 9,543
5 1,292 3,318
6 2,208 5,563
7 1,313 3,760
Yi = 1636.415 +1.487Xi

© 1999 Prentice-Hall, Inc. Chap. 13 - 31
t S tat P-value
In te rce p t 3 .6244333 0 .0151488
X V a ria b le 1 9 .009944 0 .0002812
H0: 1 = 0
H1: 1 0
a .05
df 7 - 2 = 7
Critical Value(s):
Test Statistic:
Decision:
Conclusion:
There is evidence of a
relationship. t 0 2.5706 -2.5706
.025
Reject Reject
.025
From Excel Printout
Reject H0
Inferences about the Slope: t Test Example

© 1999 Prentice-Hall, Inc. Chap. 13 - 32
Inferences about the Slope: Confidence Interval Example
Confidence Interval Estimate of the Slope
b1 tn-2 1bS
Excel Printout for Produce Stores
At 95% level of Confidence The confidence Interval for the
slope is (1.062, 1.911). Does not include 0.
Conclusion: There is a significant linear relationship
between annual sales and the size of the store.
Low er 95% Upper 95%
In te rc e p t 4 7 5 .8 1 0 9 2 6 2 7 9 7 .0 1 8 5 3
X V a r ia b le 11 .0 6 2 4 9 0 3 7 1 .9 1 0 7 7 6 9 4
© 1999 Prentice-Hall, Inc. Chap. 13 - 33
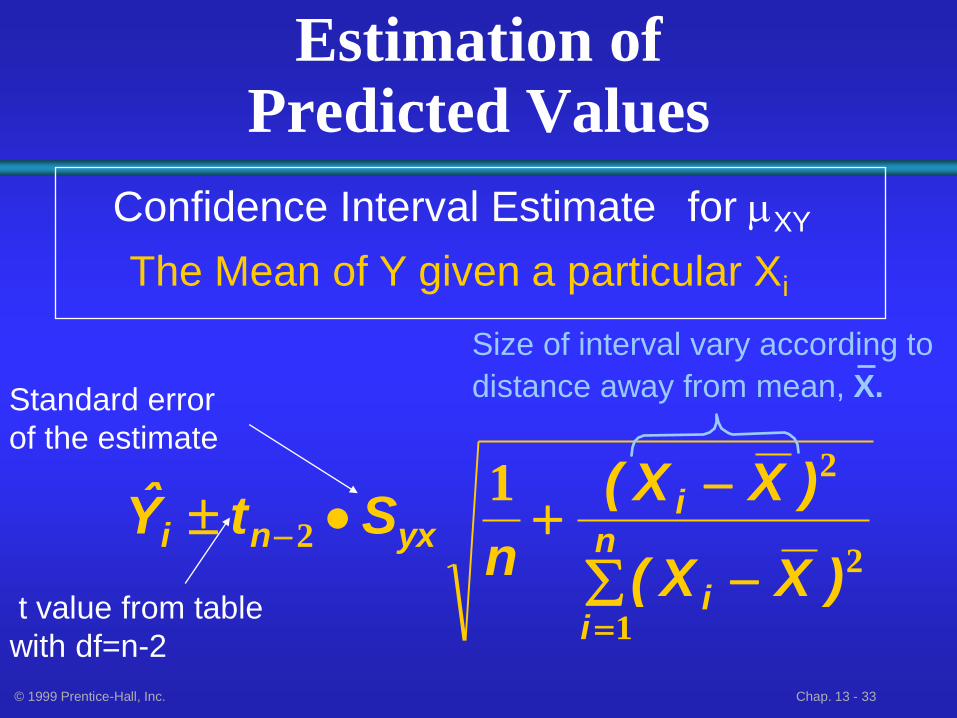
Estimation of Predicted Values
Confidence Interval Estimate for mXY
The Mean of Y given a particular Xi
n
ii
iyxni
)XX(
)XX(
nStY
1
2
2
2
1
t value from table
with df=n-2
Standard error
of the estimate
Size of interval vary according to
distance away from mean, X.

© 1999 Prentice-Hall, Inc. Chap. 13 - 34
Estimation of Predicted Values
Confidence Interval Estimate for
Individual Response Yi at a Particular Xi
n
ii
iyxni
)XX(
)XX(
nStY
1
2
2
2
11
Addition of this 1 increased width of
interval from that for the mean Y

© 1999 Prentice-Hall, Inc. Chap. 13 - 35
Interval Estimates for
Different Values of X
X
Y
X
Confidence Interval
for a individual Yi
A Given X
Confidence
Interval for the
mean of Y
_

© 1999 Prentice-Hall, Inc. Chap. 13 - 36
Example: Produce Stores
Yi = 1636.415 +1.487Xi
Data for 7 Stores:
Regression Model Obtained:
Predict the annual
sales for a store with
2000 square feet.
Annual Store Square Sales Feet ($000)
1 1,726 3,681
2 1,542 3,395
3 2,816 6,653
4 5,555 9,543
5 1,292 3,318
6 2,208 5,563
7 1,313 3,760

© 1999 Prentice-Hall, Inc. Chap. 13 - 37
Estimation of Predicted Values: Example
Confidence Interval Estimate for Individual Y
Find the 95% confidence interval for the average annual sales
for stores of 2,000 square feet
n
ii
iyxni
)XX(
)XX(
nStY
1
2
2
2
1
Predicted Sales Yi = 1636.415 +1.487Xi = 4610.45 ($000)
X = 2350.29 SYX = 611.75 tn-2 = t5 = 2.5706
= 4610.45 980.97
Confidence interval for mean Y

© 1999 Prentice-Hall, Inc. Chap. 13 - 38
Estimation of Predicted Values: Example
Confidence Interval Estimate for mXY
Find the 95% confidence interval for annual sales of one
particular stores of 2,000 square feet
Predicted Sales Yi = 1636.415 +1.487Xi = 4610.45 ($000)
X = 2350.29 SYX = 611.75 tn-2 = t5 = 2.5706
= 4610.45 1853.45
Confidence interval for
individual Y
n
ii
iyxni
)XX(
)XX(
nStY
1
2
2
2
11
© 1999 Prentice-Hall, Inc. Chap. 13 - 39
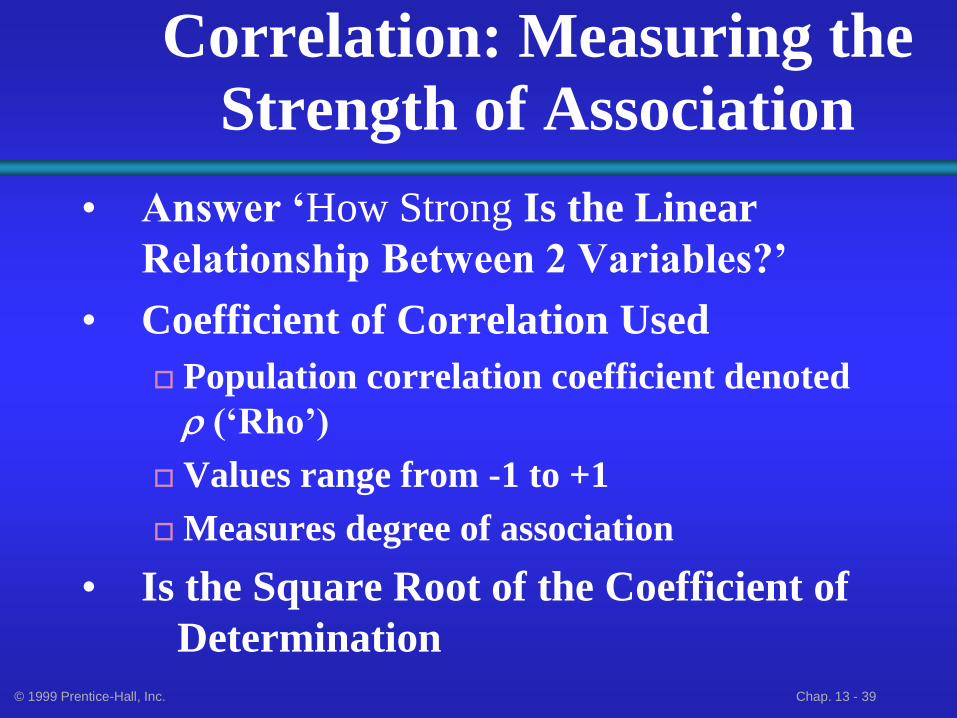
Correlation: Measuring the
Strength of Association
• Answer ‘How Strong Is the Linear
Relationship Between 2 Variables?’
• Coefficient of Correlation Used
Population correlation coefficient denoted
r (‘Rho’)
Values range from -1 to +1
Measures degree of association
• Is the Square Root of the Coefficient of
Determination

© 1999 Prentice-Hall, Inc. Chap. 13 - 40
Test of
Coefficient of Correlation
• Tests If There Is a Linear Relationship
Between 2 Numerical Variables
• Same Conclusion as Testing Population
Slope 1
• Hypotheses
H0: r = 0 (No Correlation)
H1: r 0 (Correlation)

© 1999 Prentice-Hall, Inc. Chap. 13 - 41
Chapter Summary
• Described Types of Regression Models
• Determined the Simple Linear Regression Equation
• Provided Measures of Variation in Regression and Correlation
• Stated Assumptions of Regression and Correlation
• Described Residual Analysis and the Durbin-Watson Statistic
• Provided Estimation of Predicted Values
• Discussed Correlation - Measuring the Strength of the Association