Embed Size (px)
Citation preview
Statistics in
Biology: Standard Deviation &
Standard Error
AP Biology
Bloomington High School
Standard Deviation
Measure of how spread out the data is
from the mean
Standard Deviation
Lower standard deviation
Data closer to the mean
More likely the independent variable is
causing the changes in the dependent
variable
Standard Deviation
Higher the standard deviation
Data more spread out from the mean
More likely factors, other than independent
variable, are influencing dependent
variable
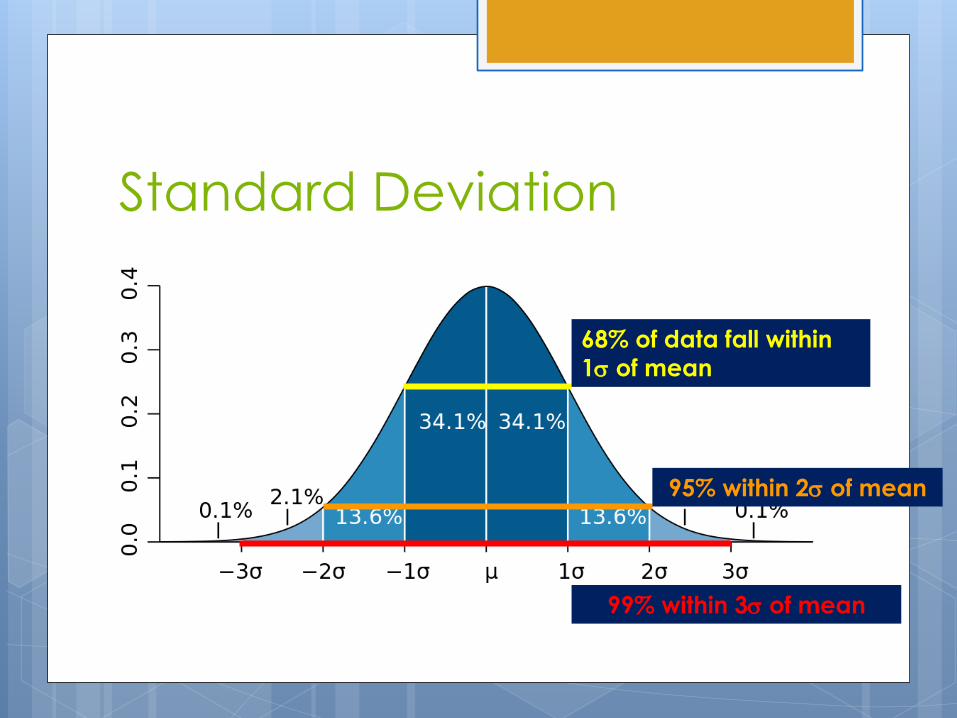
Standard Deviation
68% of data fall within
1 of mean
95% within 2 of mean
99% within 3 of mean
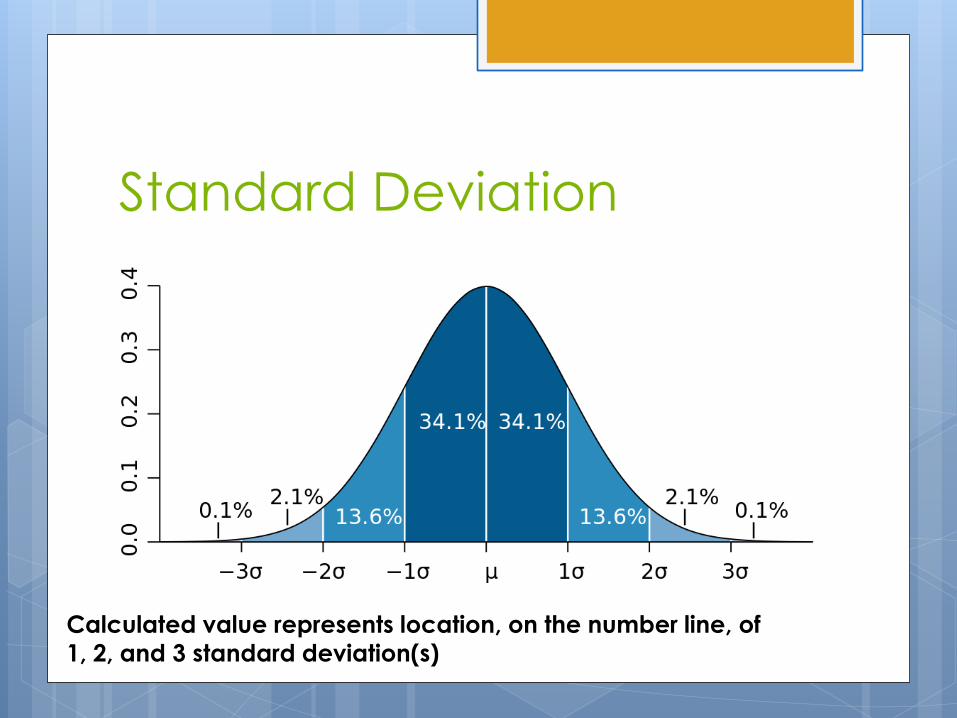
Standard Deviation
Calculated value represents location, on the number line, of
1, 2, and 3 standard deviation(s)
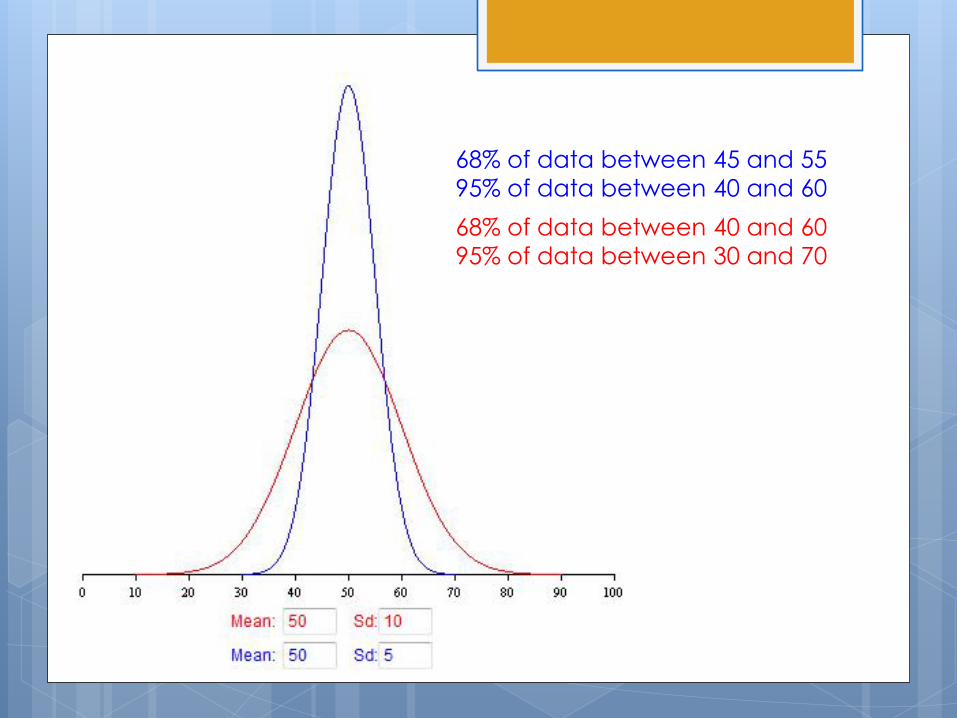
68% of data between 45 and 55
95% of data between 40 and 60
68% of data between 40 and 60
95% of data between 30 and 70
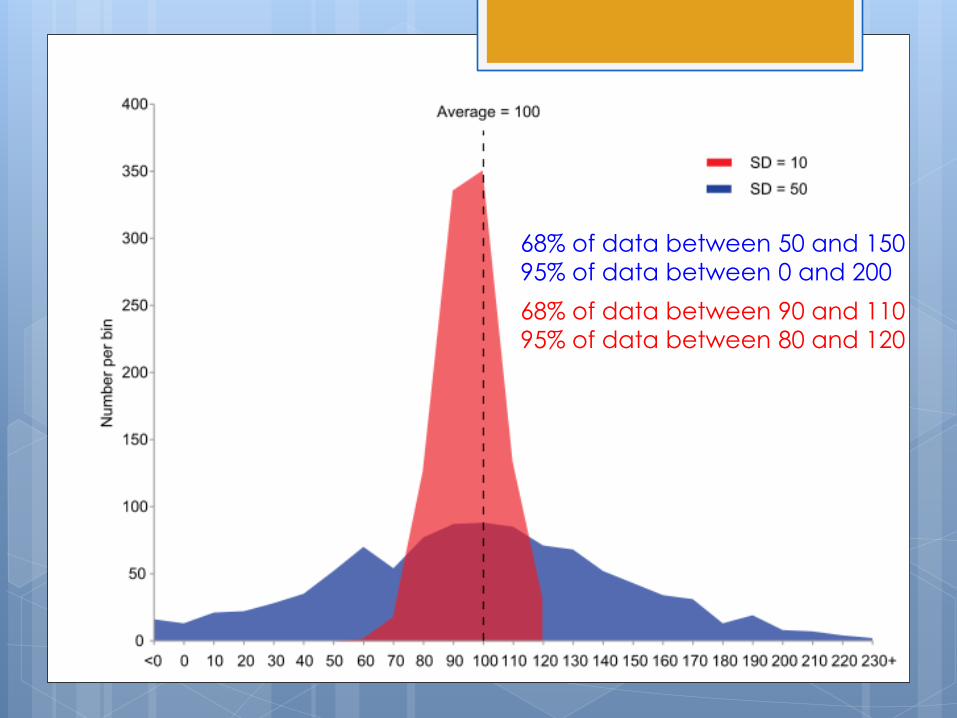
68% of data between 50 and 150
95% of data between 0 and 200
68% of data between 90 and 110
95% of data between 80 and 120
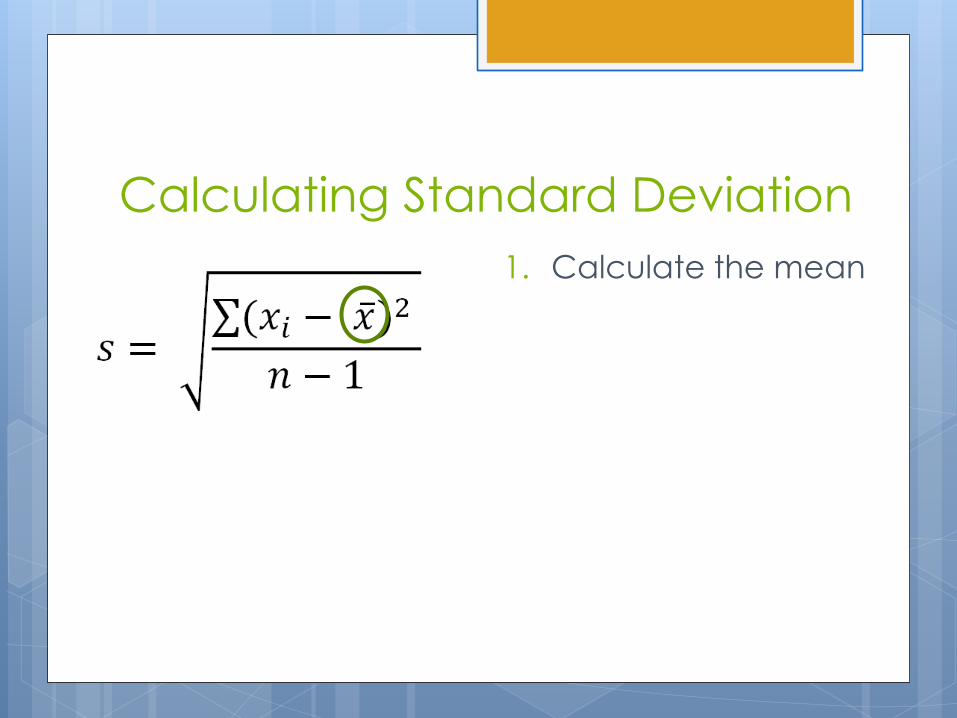
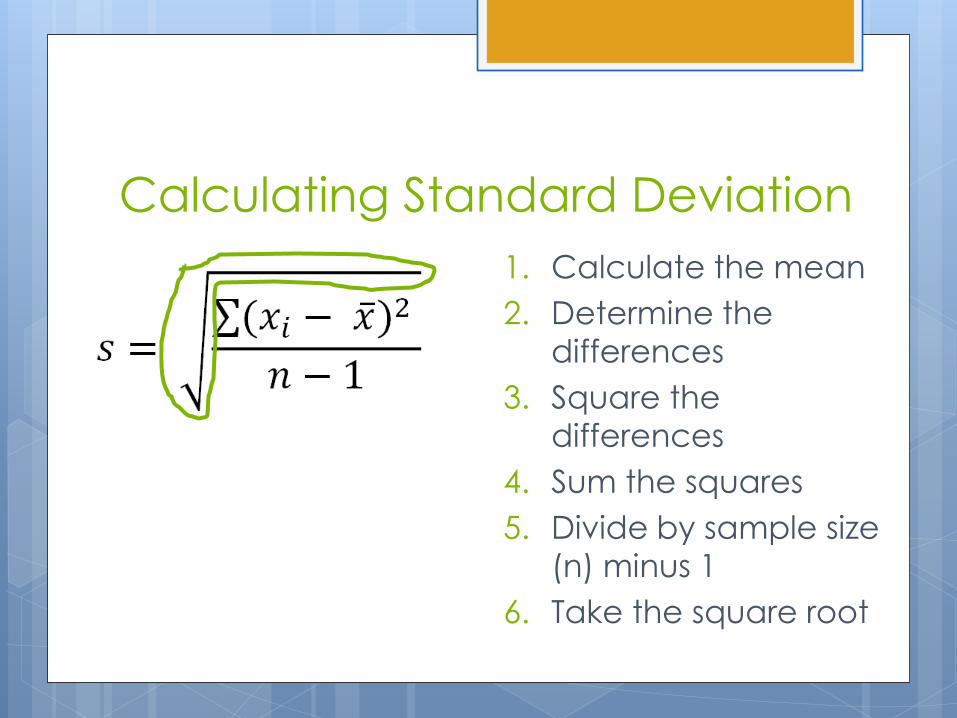
Calculating Standard Deviation
1. Calculate the mean
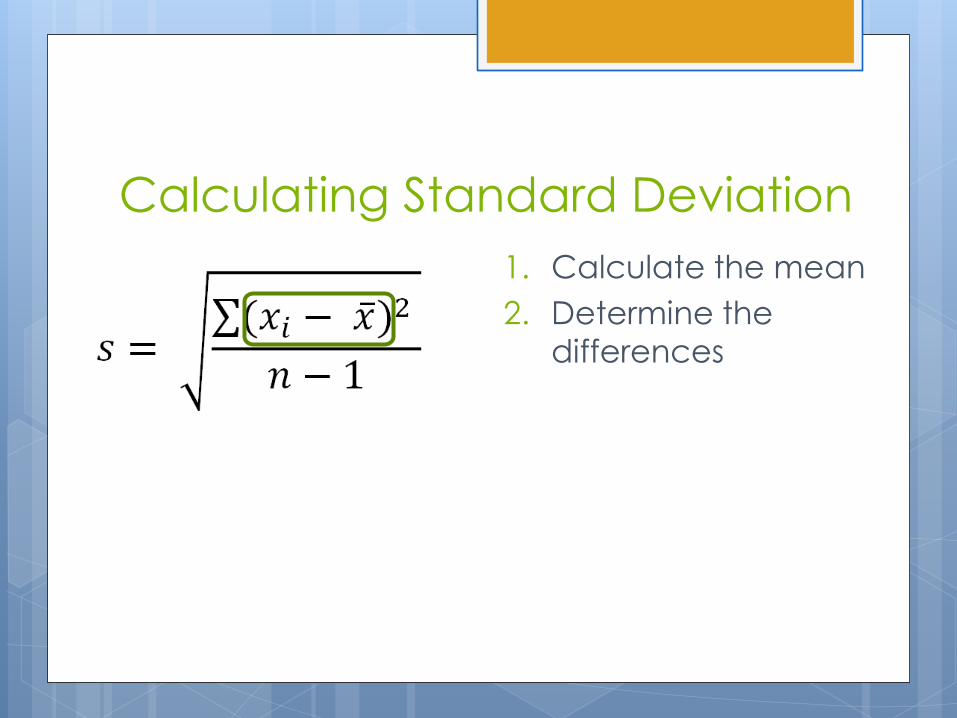
Calculating Standard Deviation
1. Calculate the mean
2. Determine the
differences
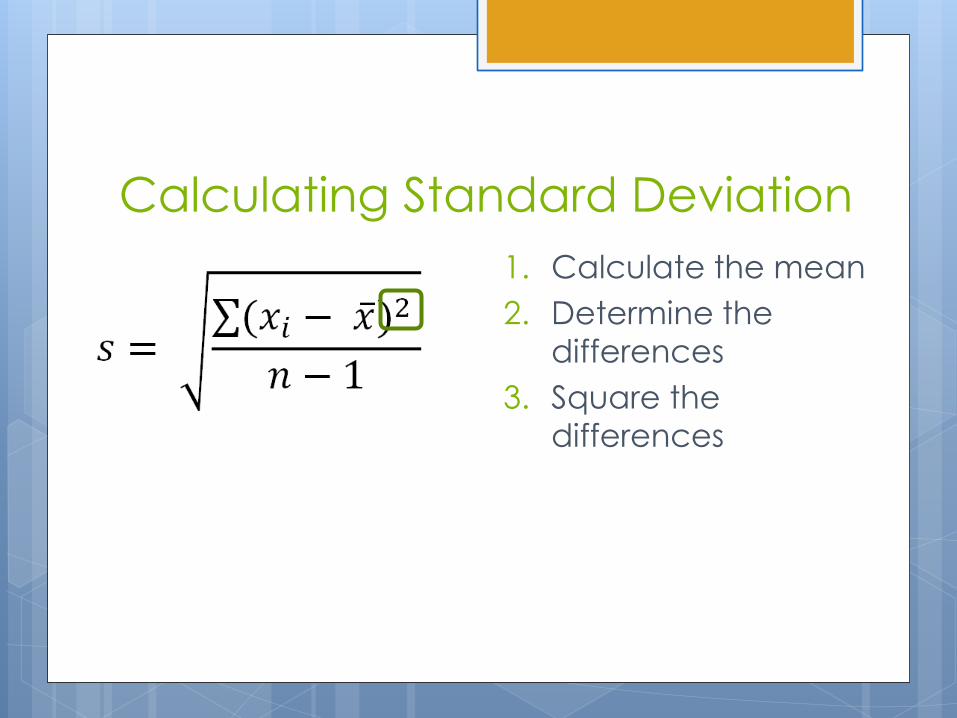
Calculating Standard Deviation
1. Calculate the mean
2. Determine the
differences
3. Square the
differences
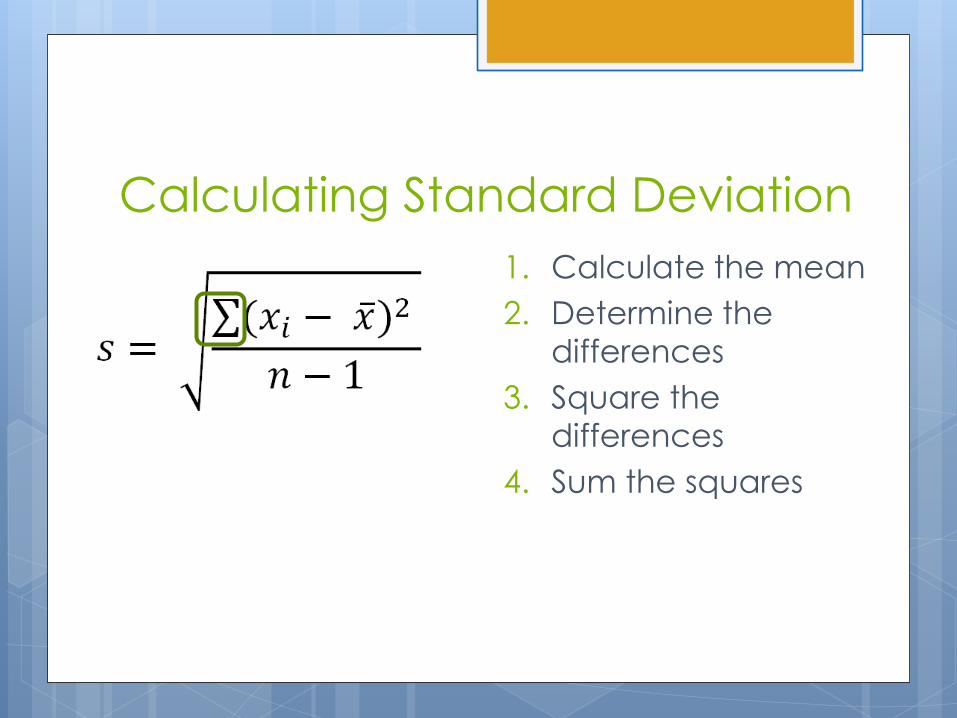
Calculating Standard Deviation
1. Calculate the mean
2. Determine the
differences
3. Square the
differences
4. Sum the squares

Calculating Standard Deviation
1. Calculate the mean
2. Determine the
differences
3. Square the
differences
4. Sum the squares
5. Divide by sample size
(n) minus 1
Calculating Standard Deviation
1. Calculate the mean
2. Determine the
differences
3. Square the
differences
4. Sum the squares
5. Divide by sample size
(n) minus 1
6. Take the square root
Standard Error
Indication of how well the mean of a
sample estimates the true mean of a
population or whole
Measure of accuracy if the true mean is
known
Measure of precision if true mean is not
known
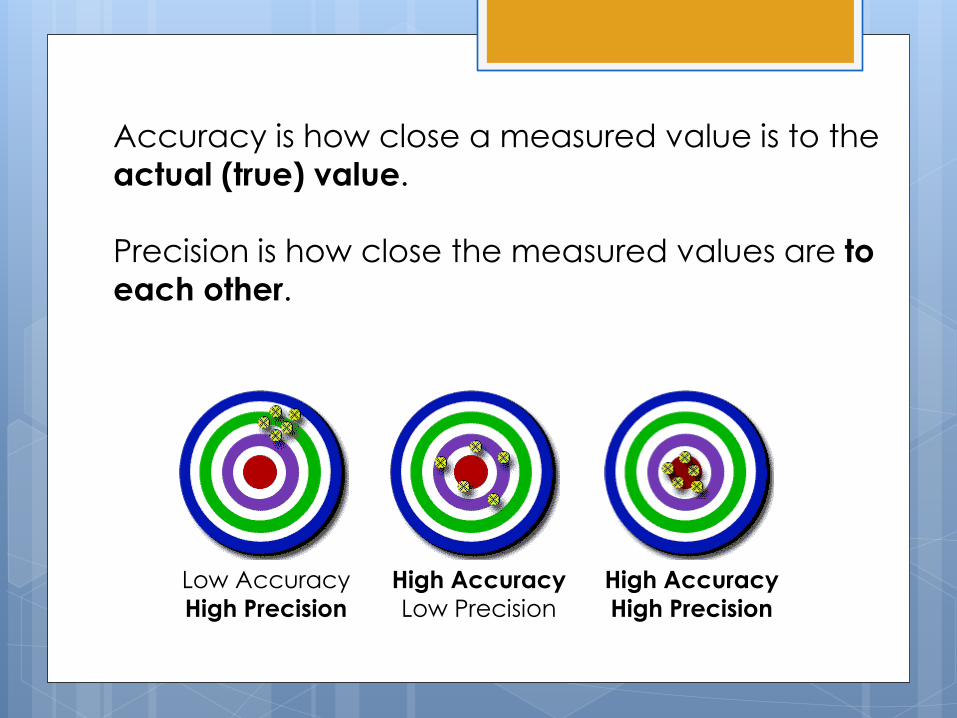
Low Accuracy
High Precision
High Accuracy
Low Precision
High Accuracy
High Precision
Accuracy is how close a measured value is to the
actual (true) value.
Precision is how close the measured values are to
each other.
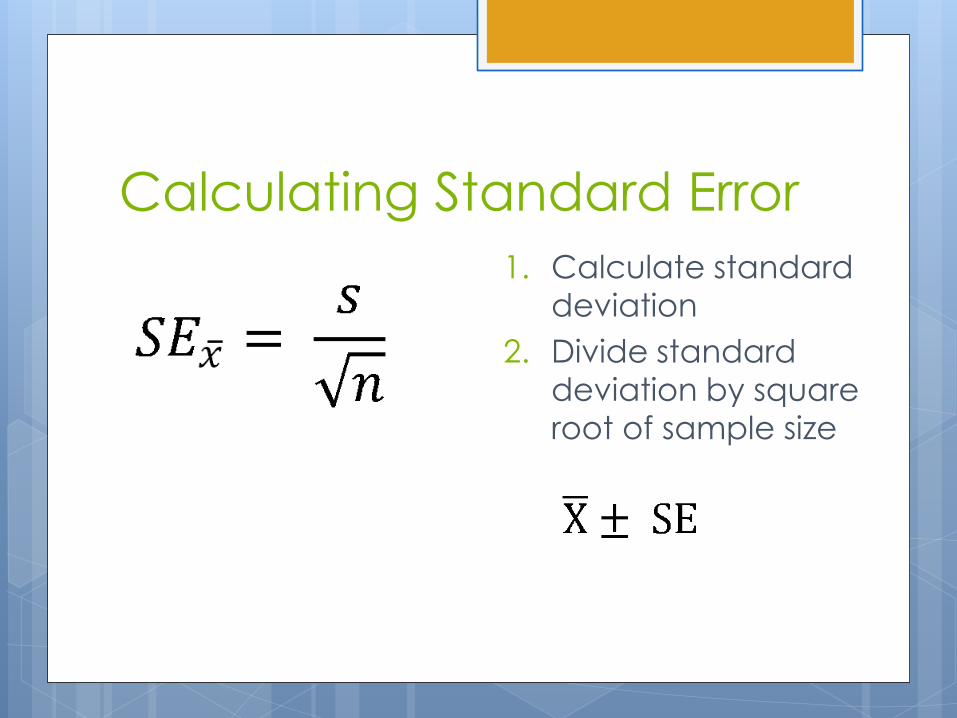
Calculating Standard Error
1. Calculate standard
deviation
2. Divide standard
deviation by square
root of sample size
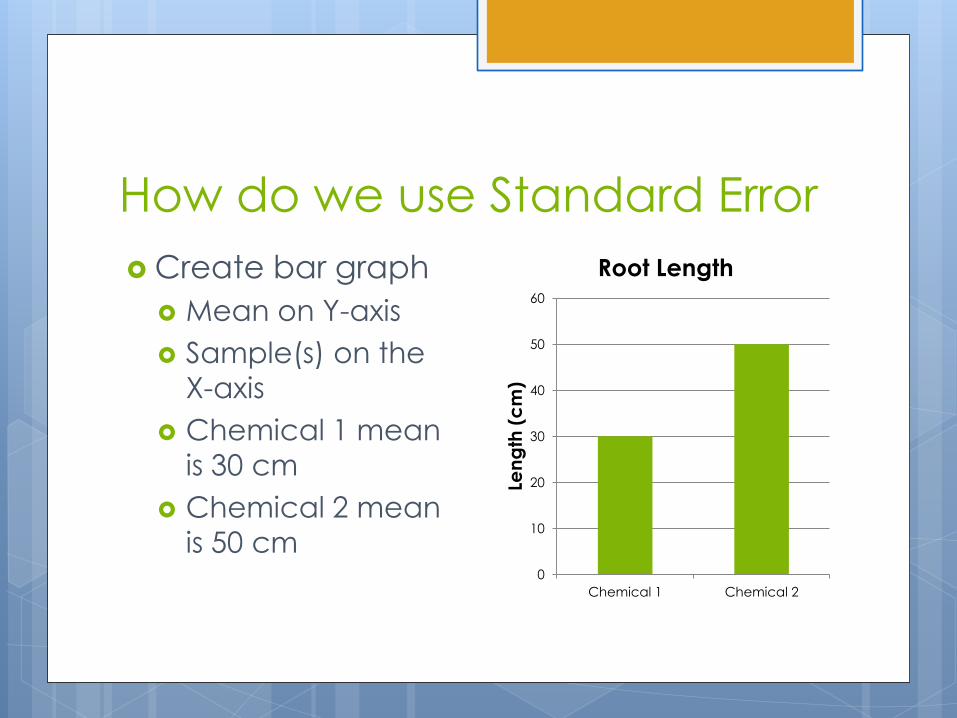
How do we use Standard Error
Create bar graph
Mean on Y-axis
Sample(s) on the
X-axis
Chemical 1 mean
is 30 cm
Chemical 2 mean
is 50 cm
0
10
20
30
40
50
60
Chemical 1 Chemical 2
Len
gth
(c
m)
Root Length
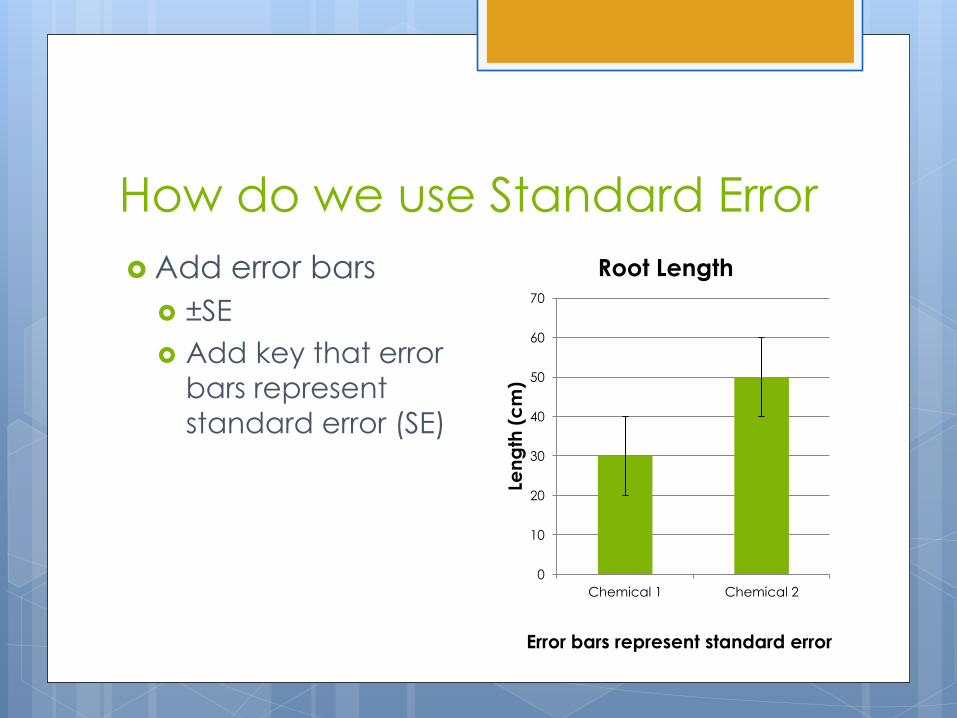
How do we use Standard Error
Add error bars
±SE
Add key that error
bars represent
standard error (SE)
0
10
20
30
40
50
60
70
Chemical 1 Chemical 2
Len
gth
(c
m)
Root Length
Error bars represent standard error
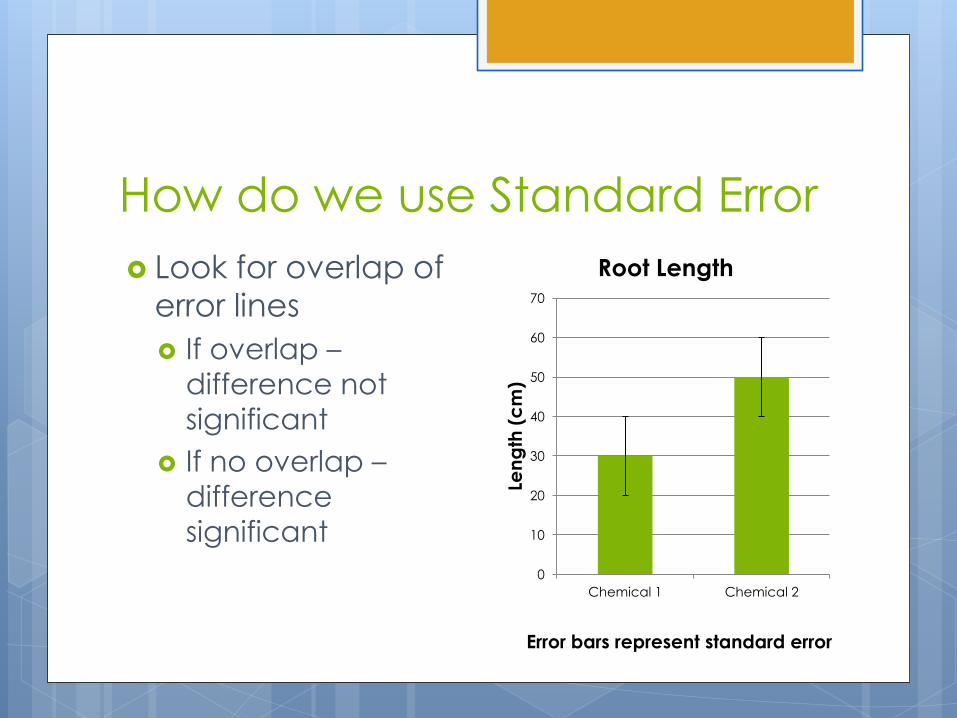
How do we use Standard Error
Look for overlap of
error lines
If overlap –
difference not
significant
If no overlap –
difference
significant
0
10
20
30
40
50
60
70
Chemical 1 Chemical 2
Len
gth
(c
m)
Root Length
Error bars represent standard error
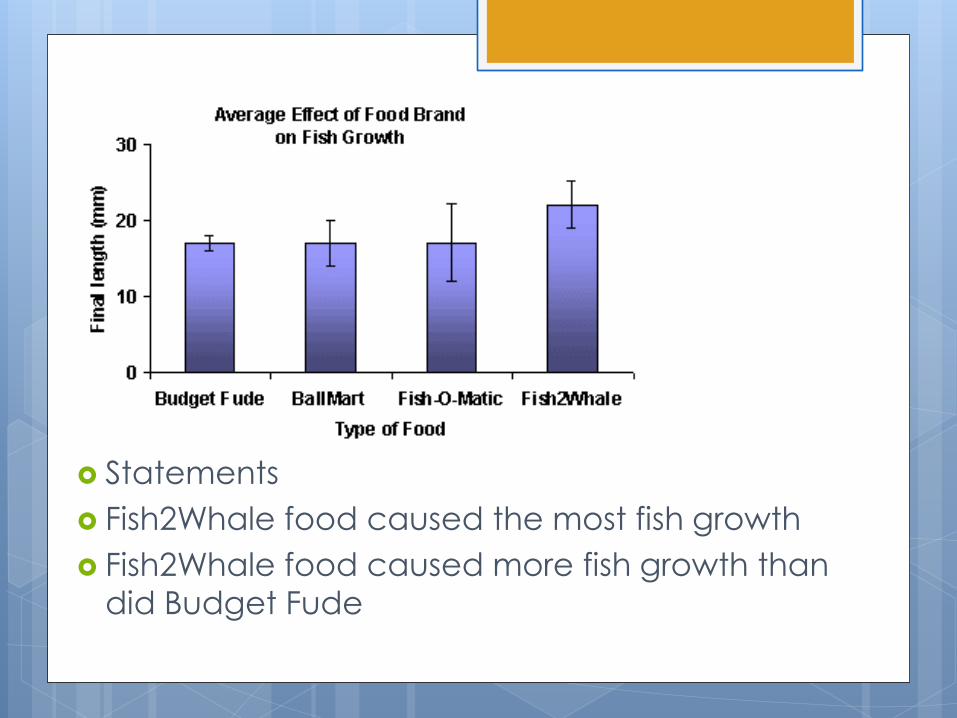
Statements
Fish2Whale food caused the most fish growth
Fish2Whale food caused more fish growth than
did Budget Fude
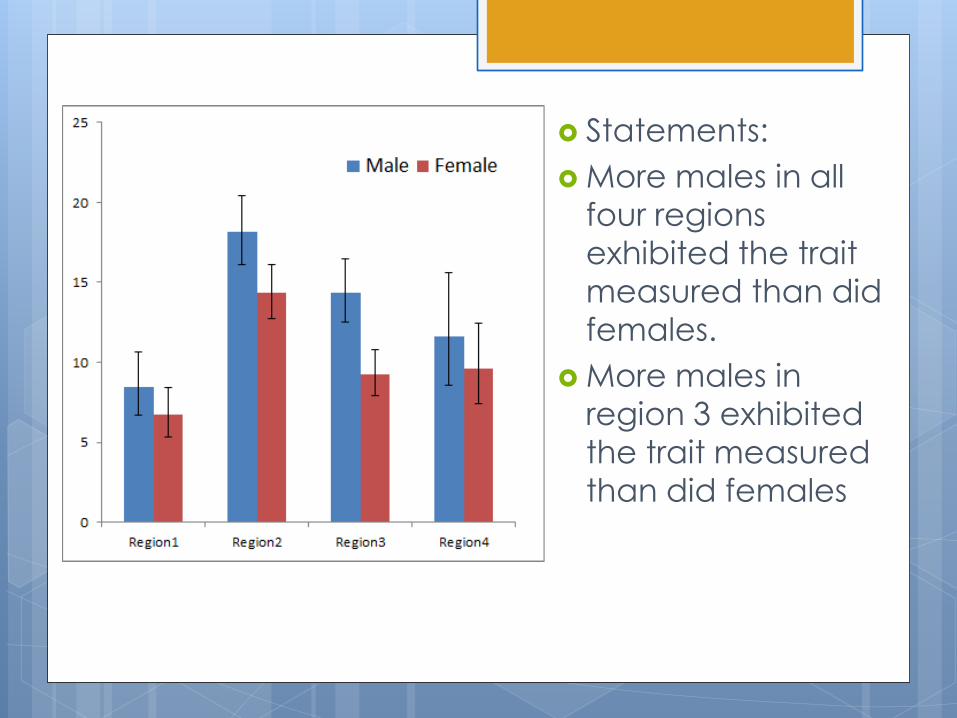
Statements:
More males in all
four regions
exhibited the trait
measured than did
females.
More males in
region 3 exhibited
the trait measured
than did females
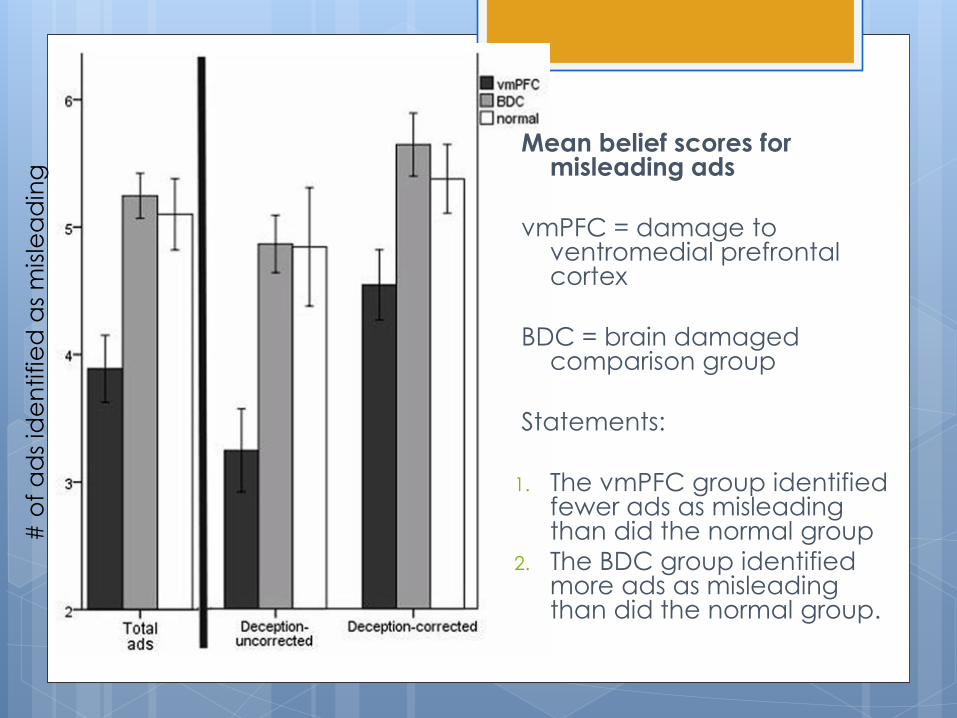
Mean belief scores for misleading ads
vmPFC = damage to ventromedial prefrontal cortex
BDC = brain damaged comparison group
Statements:
1. The vmPFC group identified fewer ads as misleading than did the normal group
2. The BDC group identified more ads as misleading than did the normal group.
# o
f a
ds
ide
ntifie
d a
s m
isle
ad
ing