Embed Size (px)
Citation preview

STATISTICS IN PSYCHOLOGY
MPC-006
www.springseason.in

Statistics in Psychology
(MPC006)
SPRING SEASON PUBLICATIONS
Navi Mumbai, INDIA

Free Distribution of this document, except the author,
will be considered as COPYRIGHT Violation.
As per Indian Copyrights Act 1957, Copyright
infringement is a cognizable offence and Copyright
owners can take legal action against any person or
entity that infringes on the copyright of a work. The
copyright owner can file a civil remedies case in a court
having jurisdiction and is entitled to remedies by way of
injunctions, damages and accounts.
Assignment Container: Statistics in Psychology (MPC006)
© Spring Season Publications 2019
All Rights Reserved
First Published – 2019
Spring Season Publications
Kharghar Sec 10, Navi Mumbai, MS, INDIA, 410210
www.springseason.in
All rights reserved. No part of this publication may be reproduced, stored in or introduced into a retrieval system, or
transmitted, in any form, or by any means (electrical, mechanical, Photocopying, recording or otherwise) without the
prior Written permission of the author.
All data were deemed correct at time of creation
Author/Publisher is not liable for errors or omissions
Only for PERSONAL USE not for PUBLIC Circulation
INR 99/-

www.springseason.in
Guidelines/Tips to Write MAPC Assignments
Using this Document
• Please note that the main aim of this document is to provide the guideline to write the assignment
• It is advisable not copy answers as it is from this document
• Write the answers in your own words
• Numbers of illustrations are also given in this document
Paper
• You need to use A4 ruled paper (with lines). You can also use the A4 note book and cover it with plain
and nice cover and put the desired information on it
• Also it is advisable to check with your resource/study center for any guidelines on the same and follow
if it is there
• However, contain of the assignment is important as compare to the paper used to write it (As per our
understanding)
Writing your Answers
• Assignment should be Hand written and you can use both the side of the page to write your answer
• Write the Section/Question number with each answer and please write all the questions
• Make sure that the answer is within the stipulated word limit
• You can use Blue/Black ink to write your assignment (Don’t use pencil in your assignment)
• Don’t use RED Pen in your assignment as normally it is used to check the assignment
• If you wish you can use light color pens for illustrations/brain maps for your assignment
• Number of pages required to write the answer depends on your handwriting. Below is the
approximately guideline for your reference
Word Limit 1000 400 50
Number of Lines in one paper 20 20 20
Words per line
(Big Hand Writing) 7 7 7
Total Pages required
(Front and Back) 7 3 0.3
Words per line
(Small Hand Writing) 10 10 10
Total Pages required
(Front and Back) 5 4 0.2

Content
1 Organizing the data 1
2 ANOVA Numerical 6
3 Non-Parametric Statistics 7
4 Type I and Type II Error 12
5 Spearman’s rho Numerical 13
6 Mann Whitney ‘U’ test Numerical 14
7 Partial Correlation 16
8 Chi-Square Numerical 17
9 Hypothesis Testing 20
10 Measure of Central Tendency 20
11 Scatter Diagram 20
12 Tetrachoric Correlation 22
13 Multiple Correlation 22
14 Regression Equation 23
15 Normal Curve 24
16 Degree of Freedom 24
17 Measuring Skewness 26
18 Kruskal Wallis ANOVA 26


Assignment Container Statistics in Psychology (MPC-006)
Page 1 of 27 www.springseason.in
IGNOU MAPC
STATISTICS IN PSYCHOLOGY (MPC-006)
Course Code: MPC-006
Assignment Code: MPC-006/ASST/TMA/2019-20
Marks: 100
Last Date of Submission: 30th April 2020 and 30th Sep 2020
SECTION-A
Answer the following question in about 1000 words (wherever applicable) each.
15 x 3 = 45 Marks
Q. No. 1 Describe the major statistical techniques for organising the data with suitable
example and diagrams.
Answer: Data are collected often in raw form. These are then not useable unless organized.
After collection of data (primary or secondary), it is necessary to organize them suitably and
present in such forms as can facilitate subsequent analysis and interpretation.
There are four major statistical techniques for organizing the data. These are:
• Classification
• Tabulation
• Graphical Presentation, and
• Diagrammatical Presentation
1. Classification of Data
The process of arranging data into homogenous group or classes according to some common
characteristics present in the data is called classification. Basically, classification is the
process of arranging the data in groups according to similarities for its most effective and
efficient use.
If the value of a variable occurs twice or more in a given series of observations, then the
number of occurrence of the value is termed as the ‘frequency’ of that value. The way of
tabulating a pool of data of a variable and their respective frequencies side by side is called
a ‘frequency distribution’ of those data.
Let us consider the marks obtained by 100 students of a class in Statistics
72 61 63 65 62 68 69 64 65 67 65 58 63 68 64 61 62 65 66 59
69 56 60 66 62 57 72 67 65 70 62 65 65 60 64 61 64 69 62 64

Assignment Container Statistics in Psychology (MPC-006)
Page 5 of 27 www.springseason.in
4. Diagrammatic Representation of Data
A diagram is a visual form for the presentation of statistical data. They present the data in
simple, readily comprehensible form. Diagrammatic presentation is used only for
presentation of the data in visual form, whereas graphic presentation of the data can be used
for further analysis. There are different
forms of diagram
a. Bar or Column Chart: Bar charts
are used for categorical data or the
data that are transformed into
categorical data. Categories are
shown on the ‘x’-axis. Frequency,
percentage, or proportion is shown
on the ‘y’-axis. The bars are
separated by small gaps to indicate
that the data are categorical or discrete.
b. Pie Chart: Like bar charts, pie charts are also used for categorical data. A pie chart
consists of a circle divided into wedge-
shaped ‘slices’, one slices for each category.
The size of each slice is determined by the
frequency of the category and measured by
the angle of the slice.
(1012 Words)
Assignment Container Statistics in Psychology (MPC-006)
Page 25 of 27 www.springseason.in
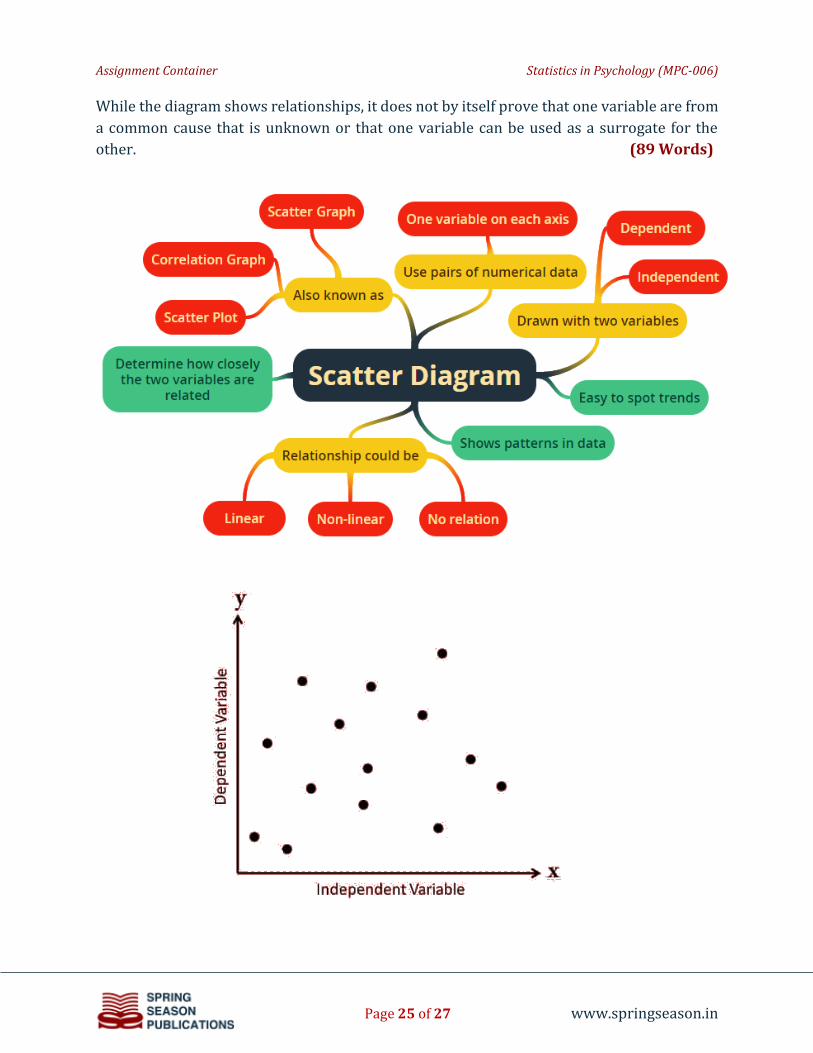
While the diagram shows relationships, it does not by itself prove that one variable are from
a common cause that is unknown or that one variable can be used as a surrogate for the
other. (89 Words)

Spring Season Publications Kharghar, Navi Mumbai, MS, INDIA, 410210
Visit us at www.springseason.in
Rs. 99