Embed Size (px)
Citation preview
The Mathematics Vision Project Scott Hendrickson, Joleigh Honey, Barbara Kuehl, Travis Lemon, Janet Sutorius
© 2018 Mathematics Vision Project Original work © 2013 in partnership with the Utah State Office of Education
This work is licensed under the Creative Commons Attribution CC BY 4.0
MODULE 9
Statistics
SECONDARY
MATH THREE
An Integrated Approach

SECONDARY MATH III // MODULE 9
STATISTICS
Mathematics Vision Project Licensed under the Creative Commons Attribution CC BY 4.0 mathematicsvisionproject.org
MODULE 9 - TABLE OF CONTENTS
STATISTICS
9.1 What Is Normal? – A Develop Understanding Task
Understanding normal distributions and identify their features (S.ID.4)
Ready, Set, Go Homework: Statistics 9.1
9.2 Just ACT Normal – A Solidify Understanding Task
Using the features of a normal distribution to make decisions (S.ID.4)
Ready, Set, Go Homework: Statistics 9.2
9.3 Y B Normal? – A Solidify Understanding Task
Introducing z scores to compare normal distributions (S.ID.4)
Ready, Set, Go Homework: Statistics 9.3
9.4 Wow, That’s Weird! – A Practice Understanding Task
Comparing normal distributions using z scores and understanding of mean and standard
deviation (S.ID.4)
Ready, Set, Go Homework: Statistics 9.4
9.5 Would You Like to Try a Sample – A Develop Understanding Task
Understanding and identifying different methods of sampling (S.IC.1)
Ready, Set, Go Homework: Statistics 9.5
9.6 Let’s Investigate – A Solidify Understanding Task
Identifying the difference between survey, observational studies, and experiments (S.IC.1,
S.IC.2)
Ready, Set, Go Homework: Statistics 9.6
SECONDARY MATH III // MODULE 9
STATISTICS
Mathematics Vision Project Licensed under the Creative Commons Attribution CC BY 4.0 mathematicsvisionproject.org
9.7 Slacker’s Simulation – A Solidify Understanding Task
Using simulation to estimate the likelihood of an event (S.IC.2, S.IC.3)
Ready, Set, Go Homework: Statistics 9.7
SECONDARY MATH III // MODULE 9
STATISTICS – 9.1
Mathematics Vision Project Licensed under the Creative Commons Attribution CC BY 4.0 mathematicsvisionproject.org
9.1 What Is Normal?
A Develop Understanding Task
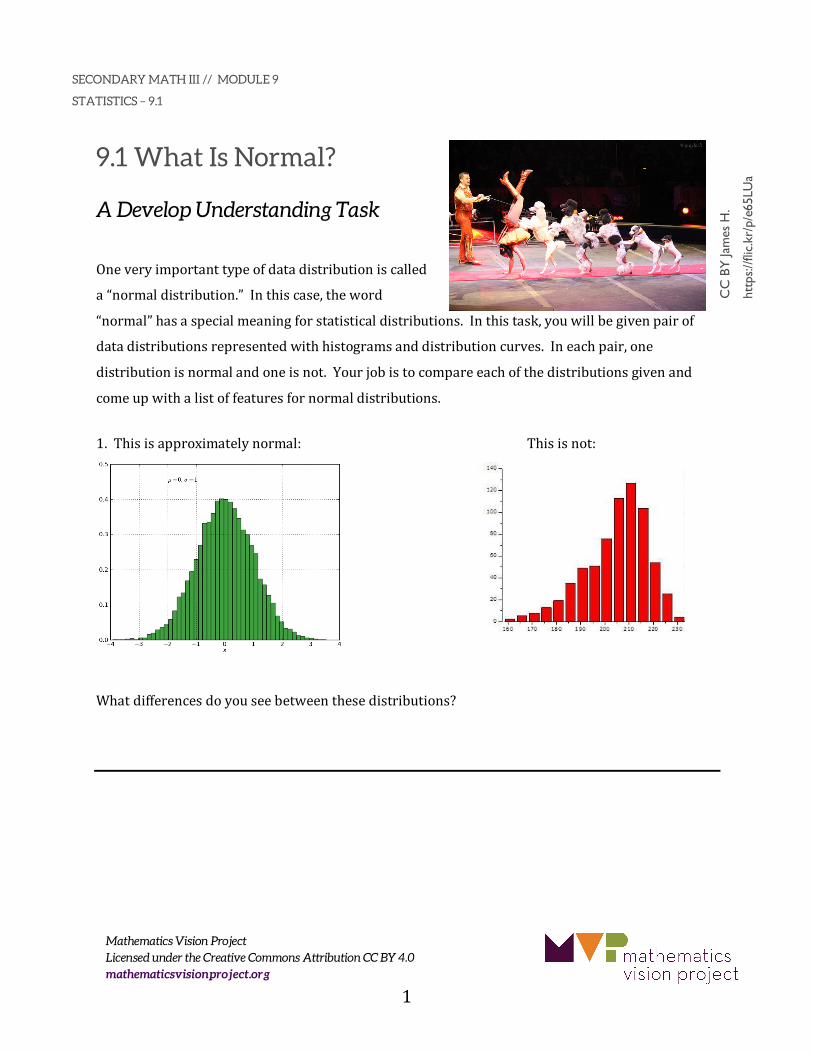
Oneveryimportanttypeofdatadistributioniscalled
a“normaldistribution.”Inthiscase,theword
“normal”hasaspecialmeaningforstatisticaldistributions.Inthistask,youwillbegivenpairof
datadistributionsrepresentedwithhistogramsanddistributioncurves.Ineachpair,one
distributionisnormalandoneisnot.Yourjobistocompareeachofthedistributionsgivenand
comeupwithalistoffeaturesfornormaldistributions.
1.Thisisapproximatelynormal: Thisisnot:
Whatdifferencesdoyouseebetweenthesedistributions?
CC
BY
Jam
es H
.
http
s://f
lic.k
r/p/
e65L
Ua
1
SECONDARY MATH III // MODULE 9
STATISTICS – 9.1
Mathematics Vision Project Licensed under the Creative Commons Attribution CC BY 4.0 mathematicsvisionproject.org
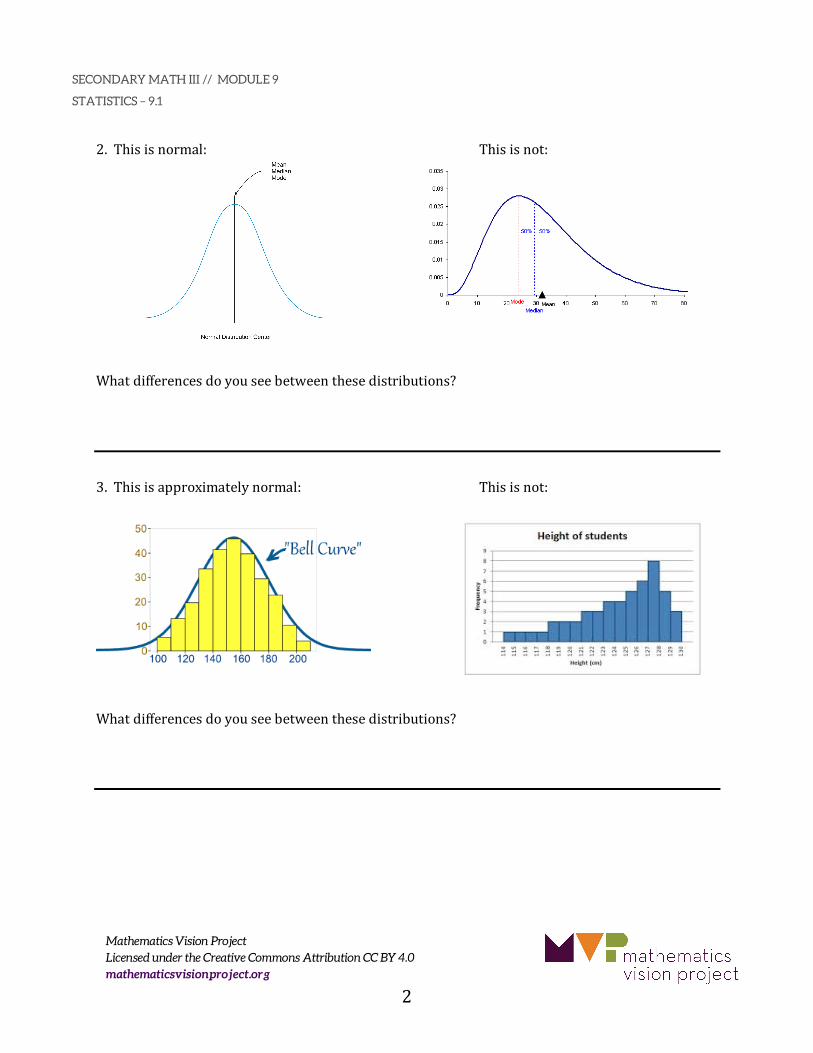
2.Thisisnormal: Thisisnot:
Whatdifferencesdoyouseebetweenthesedistributions?
3.Thisisapproximatelynormal: Thisisnot:
Whatdifferencesdoyouseebetweenthesedistributions?
2
SECONDARY MATH III // MODULE 9
STATISTICS – 9.1
Mathematics Vision Project Licensed under the Creative Commons Attribution CC BY 4.0 mathematicsvisionproject.org
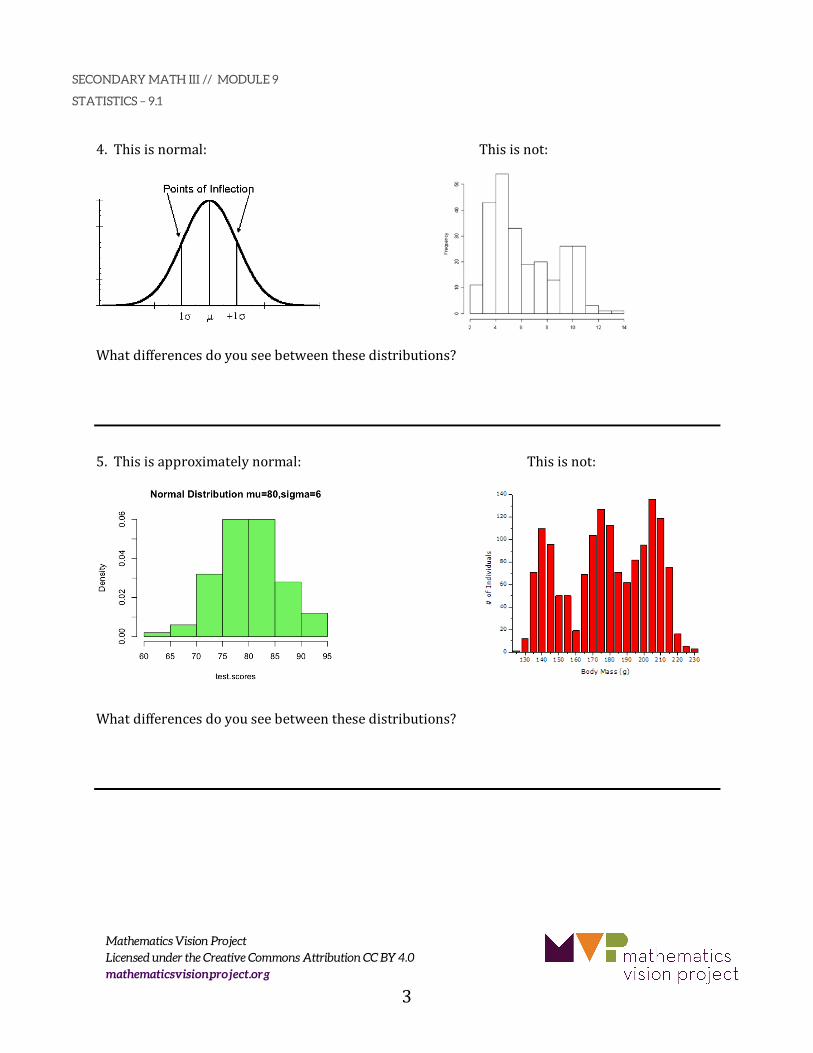
4.Thisisnormal: Thisisnot:
Whatdifferencesdoyouseebetweenthesedistributions?
5.Thisisapproximatelynormal: Thisisnot:
Whatdifferencesdoyouseebetweenthesedistributions?
-
3
SECONDARY MATH III // MODULE 9
STATISTICS – 9.1
Mathematics Vision Project Licensed under the Creative Commons Attribution CC BY 4.0 mathematicsvisionproject.org
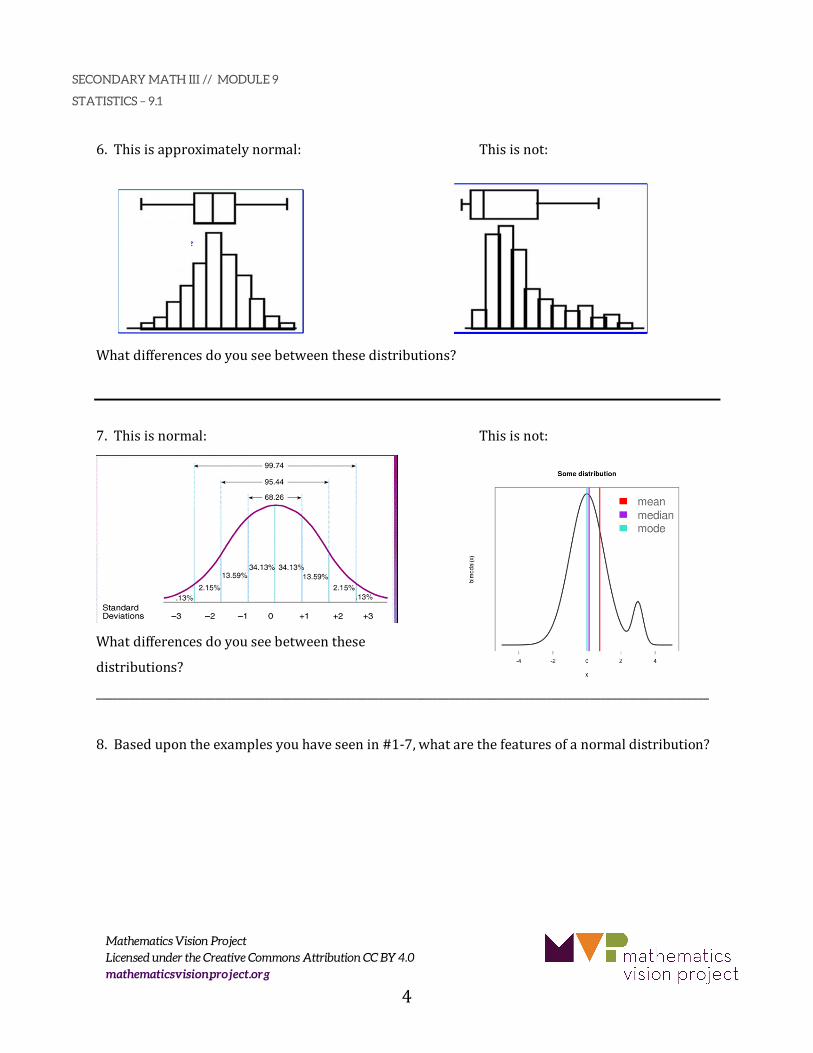
6.Thisisapproximatelynormal: Thisisnot:
Whatdifferencesdoyouseebetweenthesedistributions?
7.Thisisnormal: Thisisnot:
Whatdifferencesdoyouseebetweenthese
distributions?
_________________________________________________________________________________________________________________
8.Basedupontheexamplesyouhaveseenin#1-7,whatarethefeaturesofanormaldistribution?
4
SECONDARY MATH III // MODULE 9
STATISTICS – 9.1
Mathematics Vision Project Licensed under the Creative Commons Attribution CC BY 4.0 mathematicsvisionproject.org
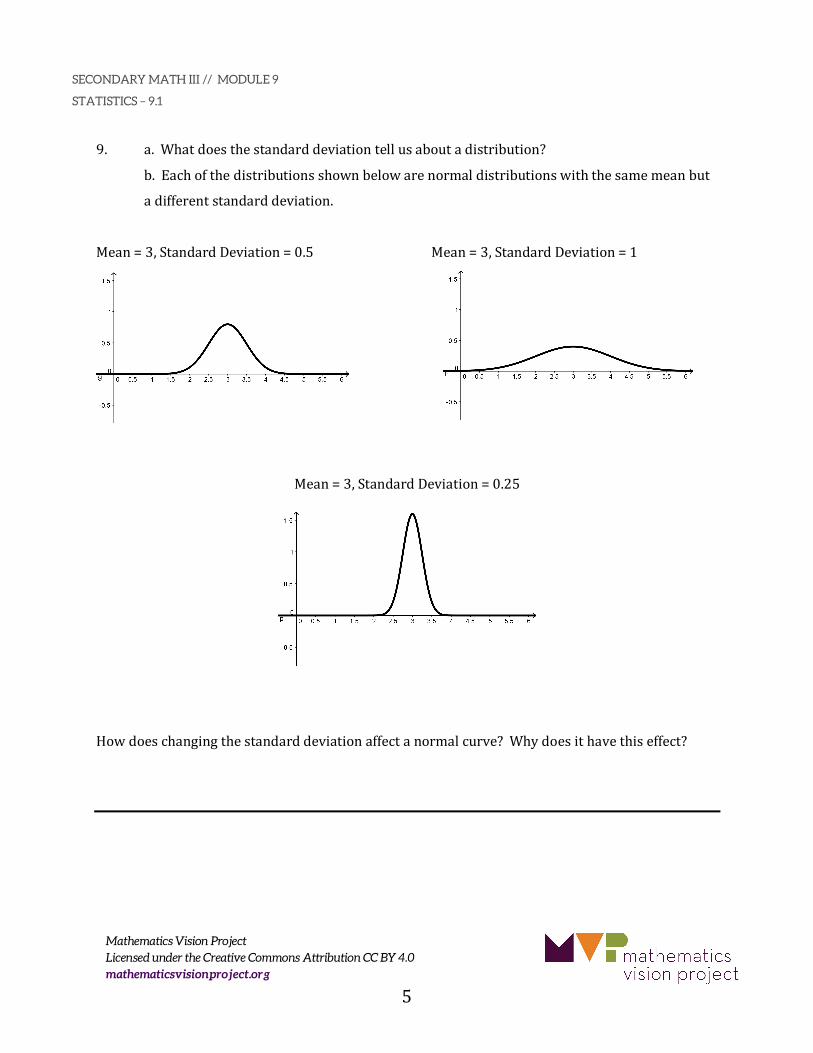
9. a.Whatdoesthestandarddeviationtellusaboutadistribution?
b.Eachofthedistributionsshownbelowarenormaldistributionswiththesamemeanbut
adifferentstandarddeviation.
Mean=3,StandardDeviation=0.5 Mean=3,StandardDeviation=1
Mean=3,StandardDeviation=0.25
Howdoeschangingthestandarddeviationaffectanormalcurve?Whydoesithavethiseffect?
5
SECONDARY MATH III // MODULE 9
STATISTICS – 9.1
Mathematics Vision Project Licensed under the Creative Commons Attribution CC BY 4.0 mathematicsvisionproject.org
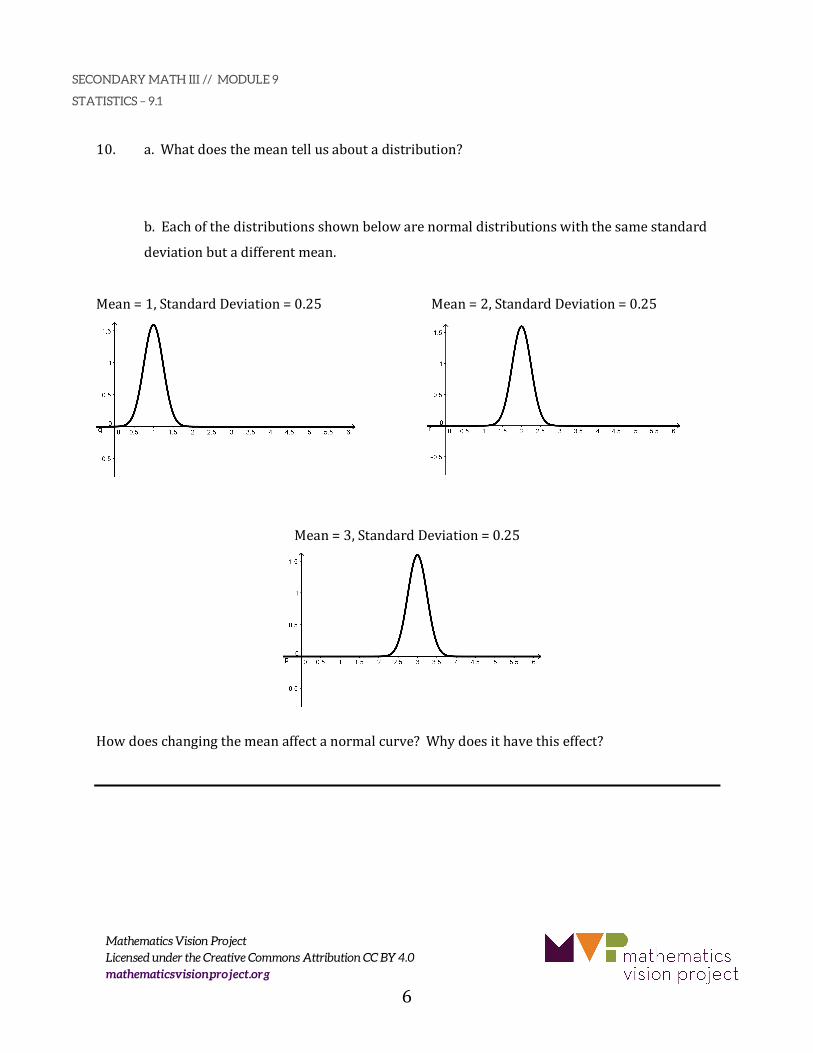
10. a.Whatdoesthemeantellusaboutadistribution?
b.Eachofthedistributionsshownbelowarenormaldistributionswiththesamestandard
deviationbutadifferentmean.
Mean=1,StandardDeviation=0.25 Mean=2,StandardDeviation=0.25
Mean=3,StandardDeviation=0.25
Howdoeschangingthemeanaffectanormalcurve?Whydoesithavethiseffect?
6
SECONDARY MATH III // MODULE 9
STATISTICS – 9.1
Mathematics Vision Project Licensed under the Creative Commons Attribution CC BY 4.0 mathematicsvisionproject.org
11.Nowthatyouhavefiguredoutsomeofthefeaturesofanormaldistribution,determineifthe
followingstatementsaretrueorfalse.Ineachcase,explainyouranswer.
a.Anormaldistributiondependsonthemeanandthestandarddeviation.
True/FalseWhy?
b.Themean,median,andmodeareequalinanormaldistribution.
True/FalseWhy?
c.Anormaldistributionisbimodal.
True/FalseWhy?
d.Inanormaldistribution,exactly50%ofthepopulationiswithinonestandarddeviationofthe
mean.
True/FalseWhy?
7
SECONDARY MATH III // MODULE 9
STATISTICS – 9.1
Mathematics Vision Project Licensed under the Creative Commons Attribution CC BY 4.0 mathematicsvisionproject.org
9.1
Needhelp?Visitwww.rsgsupport.org
READY Topic:Workingwithstandarddeviationandpercentiles
1.Jordanscoresa53onhismathtest.Theclassaverageis57withastandarddeviationof2points.HowmanystandarddeviationsbelowthemeandidJordanscore?
2.InJordan’sscienceclass,hescoreda114.Theclassaveragewasa126withastandarddeviation
of6points.HowmanystandarddeviationsbelowthemeandidJordanscore?Incomparisontohispeers,whichtestdidJordanperformbetteron?
3.Rankthedatasetsbelowinorderofgreateststandarddeviationtosmallest:
! = {1,2,3,4}B = {2,2,2,2, }C = {2,4,6,8}D = {4,5,6,7}E = {1,1.5,2,2.5}
4.Robinmadeittotheswimmingfinalsforherstatechampionshipmeet.Thetimesinthefinals
wereasfollows:
{2: 10.3, 2: 12.5, 2: 12.7, 2: 12.38, 2: 20.45, 2: 21.43}
IfRobin’stimewasa2:12.7,whatpercentofhercompetitorsdidshebeat?
5.Rememberthatinstatistics,MisthesymbolformeanandOisthesymbolforstandarddeviation.
Usingtechnology,identifythemeanandstandarddeviationforthedatasetbelow:
{1.23, 1.3, 1.1, 1.48, 1, 1.14, 5.21, 5.1, 4.63}
M = O =
6.Forthedatainnumber5,whattimewouldfallonestandarddeviationabovethemean?
Threestandarddeviationsbelowthemean?
READY, SET, GO! Name PeriodDate
8
SECONDARY MATH III // MODULE 9
STATISTICS – 9.1
Mathematics Vision Project Licensed under the Creative Commons Attribution CC BY 4.0 mathematicsvisionproject.org
9.1
Needhelp?Visitwww.rsgsupport.org
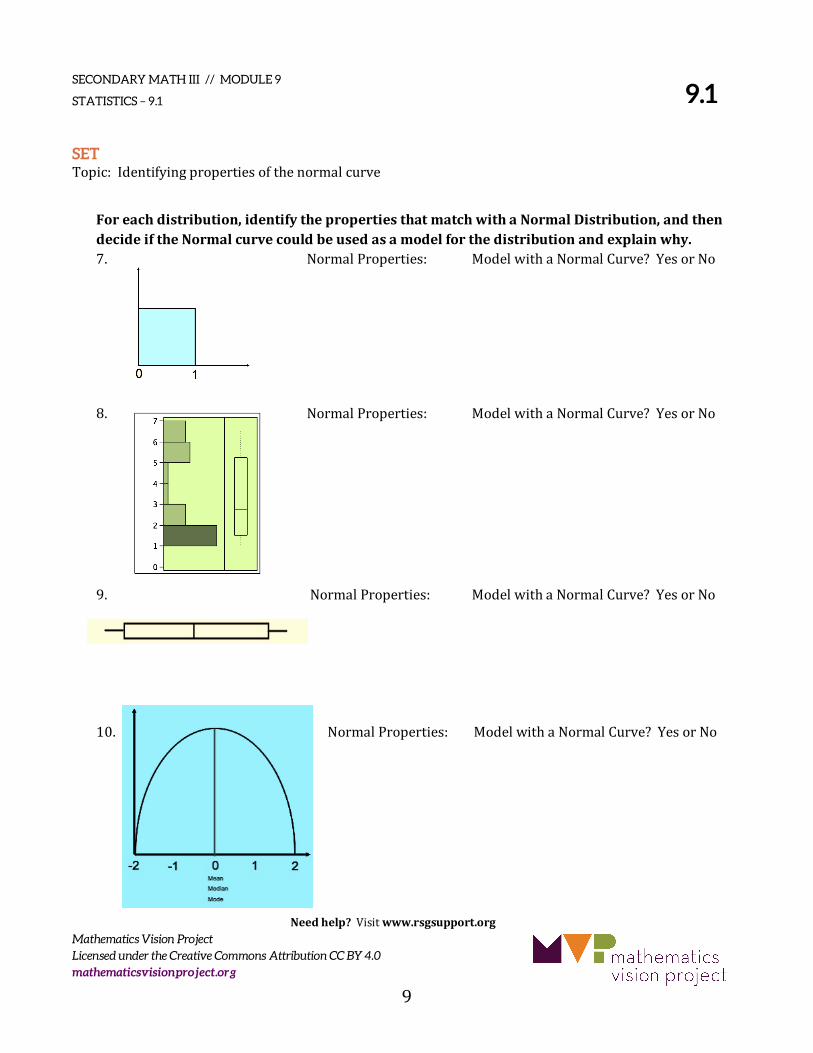
SET Topic:Identifyingpropertiesofthenormalcurve
Foreachdistribution,identifythepropertiesthatmatchwithaNormalDistribution,andthendecideiftheNormalcurvecouldbeusedasamodelforthedistributionandexplainwhy.7.NormalProperties:ModelwithaNormalCurve?YesorNo8.NormalProperties:ModelwithaNormalCurve?YesorNo
9.NormalProperties:ModelwithaNormalCurve?YesorNo10.NormalProperties:ModelwithaNormalCurve?YesorNo
9
SECONDARY MATH III // MODULE 9
STATISTICS – 9.1
Mathematics Vision Project Licensed under the Creative Commons Attribution CC BY 4.0 mathematicsvisionproject.org
9.1
Needhelp?Visitwww.rsgsupport.org
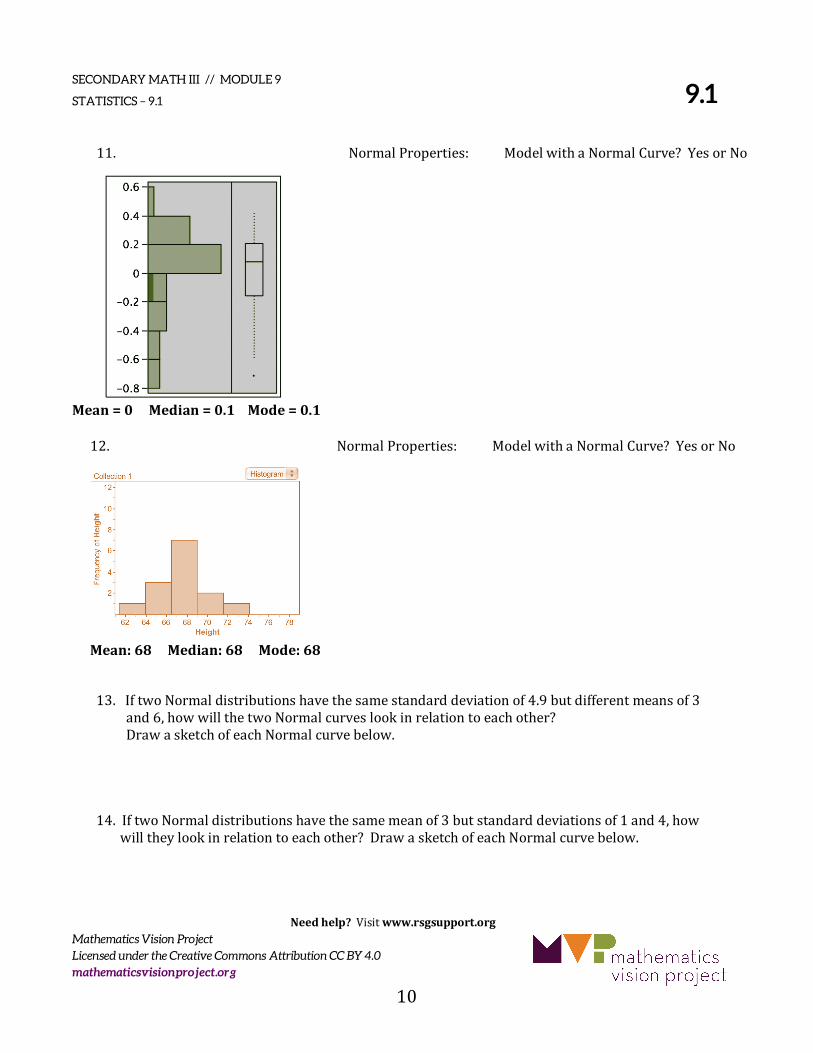
11.
Mean=0Median=0.1Mode=0.1
NormalProperties:ModelwithaNormalCurve?YesorNo
12.
Mean:68Median:68Mode:68
NormalProperties:ModelwithaNormalCurve?YesorNo
13.IftwoNormaldistributionshavethesamestandarddeviationof4.9butdifferentmeansof3
and6,howwillthetwoNormalcurveslookinrelationtoeachother?DrawasketchofeachNormalcurvebelow.
14.IftwoNormaldistributionshavethesamemeanof3butstandarddeviationsof1and4,howwilltheylookinrelationtoeachother?DrawasketchofeachNormalcurvebelow.
10
SECONDARY MATH III // MODULE 9
STATISTICS – 9.1
Mathematics Vision Project Licensed under the Creative Commons Attribution CC BY 4.0 mathematicsvisionproject.org
9.1
Needhelp?Visitwww.rsgsupport.org
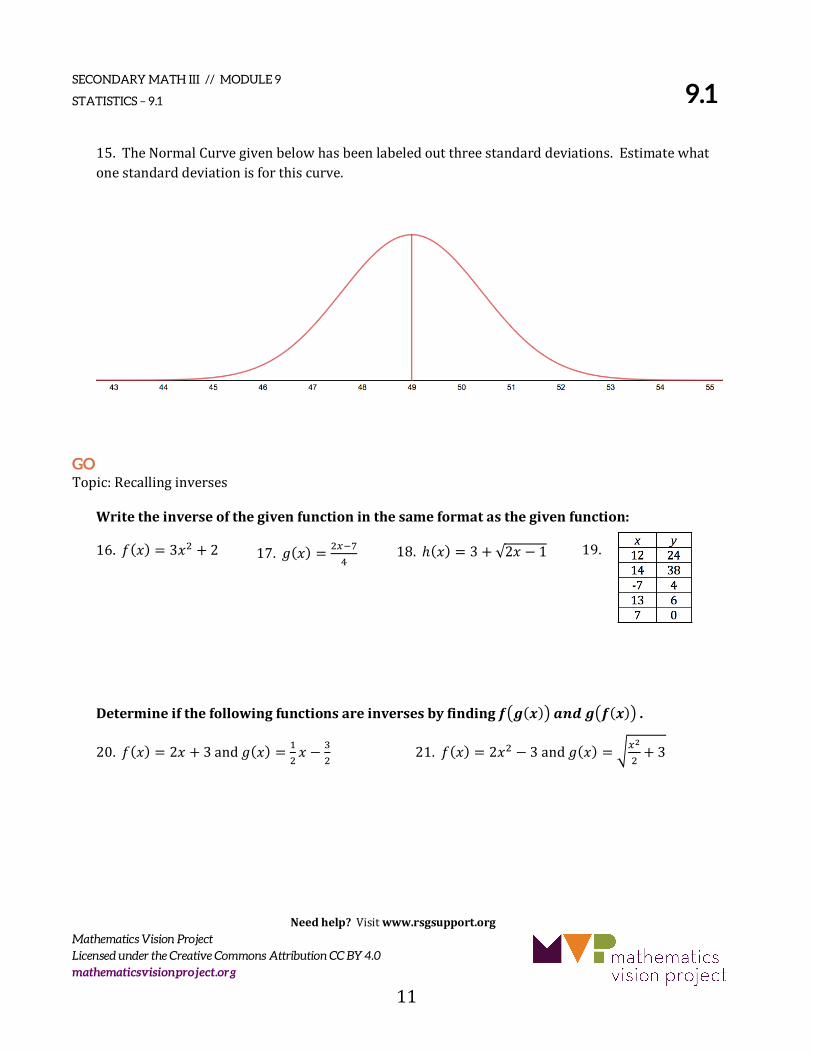
15.TheNormalCurvegivenbelowhasbeenlabeledoutthreestandarddeviations.Estimatewhatonestandarddeviationisforthiscurve.
GO Topic:Recallinginverses
Writetheinverseofthegivenfunctioninthesameformatasthegivenfunction:
16.T(V) = 3VX + 2 17.Z(V) = X[\]^ 18.ℎ(V) = 3 + √2V − 1 19.
Determineifthefollowingfunctionsareinversesbyfindingcde(f)ghijedc(f)g.
20.T(V) = 2V + 3andZ(V) = kX V −
lX 21.T(V) = 2VX − 3andZ(V) = m[n
X + 3
11
SECONDARY MATH III // MODULE 9
STATISTICS – 9.2
Mathematics Vision Project Licensed under the Creative Commons Attribution CC BY 4.0 mathematicsvisionproject.org
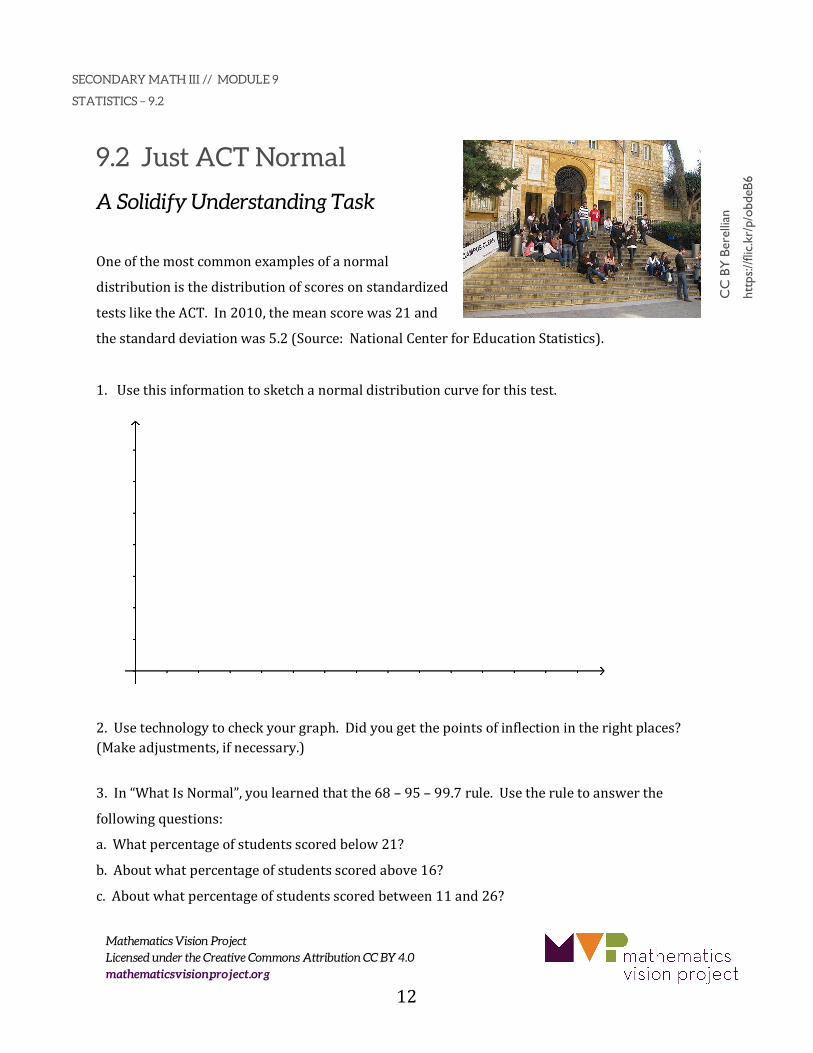
9.2 Just ACT Normal
A Solidify Understanding Task
Oneofthemostcommonexamplesofanormal
distributionisthedistributionofscoresonstandardized
testsliketheACT.In2010,themeanscorewas21and
thestandarddeviationwas5.2(Source:NationalCenterforEducationStatistics).
1.Usethisinformationtosketchanormaldistributioncurveforthistest.
2.Usetechnologytocheckyourgraph.Didyougetthepointsofinflectionintherightplaces?(Makeadjustments,ifnecessary.)
3.In“WhatIsNormal”,youlearnedthatthe68–95–99.7rule.Usetheruletoanswerthe
followingquestions:
a.Whatpercentageofstudentsscoredbelow21?
b.Aboutwhatpercentageofstudentsscoredabove16?
c.Aboutwhatpercentageofstudentsscoredbetween11and26?
CC
BY
Ber
ellia
n
http
s://f
lic.k
r/p/
obde
B6
12
SECONDARY MATH III // MODULE 9
STATISTICS – 9.2
Mathematics Vision Project Licensed under the Creative Commons Attribution CC BY 4.0 mathematicsvisionproject.org
4.Yourfriend,Calvin,wouldliketogotoaveryselectivecollegethatonlyadmitsthetop1%ofallstudentapplicants.Calvinhasgoodgradesandscored33onthetest.DoyouthinkthatCalvin’sACTscoregiveshimagoodchanceofbeingadmitted?Explainyouranswer.5.ManystudentsliketoeatmicrowavepopcornastheystudyfortheACT.Microwavepopcornproducersassumethatthetimeittakesforakerneltopopisdistributednormallywithameanof120secondsandastandarddeviationof13forastandardmicrowaveoven.Ifyou’readevotedpopcornstudier,youdon’twantalotofun-poppedkernels,butyouknowthatifyouleavethebaginlongenoughtobesurethatallthekernelsarepopped,someofthepopcornwillburn.Howmuchtimewouldyourecommendformicrowavingthepopcorn?Useanormaldistributioncurveandthefeaturesofanormaldistributiontoexplainyouranswer.
13
SECONDARY MATH III // MODULE 9
STATISTICS – 9.2
Mathematics Vision Project Licensed under the Creative Commons Attribution CC BY 4.0 mathematicsvisionproject.org
9.2
Needhelp?Visitwww.rsgsupport.org
READY Topic:ThinkingabouttheLawofLargeNumbers
1.Youandyourfriendarerollingonedieoverandoveragain.After6rolls,yourfriendhasrolledfourfives.Areyousurprisedbytheseresults?Explain
2.Afterrollingthedie50times,youknownoticethatyourolledatotalof20fives.Areyousurprisednow?Explain.
3.Yousurvey100peopleinyourschoolandaskthemiftheyfeelyourschoolhasadequateparking.Only30%ofthesamplefeelstheschoolhasenoughparking.Ifyouhave728studentstotalinyourschool,howmanywouldyouexpectoutofallthestudentbodythatfelttherewasenoughparking?
SET Topic:Applyingpropertiesofnormaldistribution
4.ThepopulationofNBAplayersisNormallydistributedwithameanof6’7”andastandarddeviationof3.9inches.(Wikepedia)Gregisconsideredunusuallytallforhishighschoolat6’3”.
a. WhatpercentofNBAplayersaretallerthanGreg?�
b. Whatpercentareshorter?�
c. HowtallwouldGreghavetobeinordertobeinthetop2.5%ofNBAplayerheights? �
READY, SET, GO! Name PeriodDate
14
SECONDARY MATH III // MODULE 9
STATISTICS – 9.2
Mathematics Vision Project Licensed under the Creative Commons Attribution CC BY 4.0 mathematicsvisionproject.org
9.2
Needhelp?Visitwww.rsgsupport.org
5.TheaverageheightofboysatGreg’sschoolis5’9”withastandarddeviationof2“.Ifweassumethepopulationisnormallydistributed,
d. WhatpercentofstudentsintheschoolareshorterthanGreg?�
e. Whatpercentofstudentsarebetween5’5”and5’11”?�
6.Jordanisdrinkingacupofhotchocolate.Frompreviousresearch,heknowsthatittakesanaveragetimeof10minutesforthehotchocolatetoreachatemperaturewherehistonguewillnotburn.ThetimeittakesthechocolatetocoolvariesNormallywithastandarddeviationof2minutes.
a. Howlongshouldhewaittodrinkhishotchocolateifhewantstobe84%surethathewon’tburnhimself?�
b. Ifhewaits8minutes,whatpercentofthetimewillheburnhistongue? �
GO Topic:Applyingthepropertiesoflogarithms
Usethepropertiesoflogarithmstoexpandtheexpressionasasumordifferenceand/orconstantmultipleoflogarithms.(Assumeallvariablesarepositive.)
7.log$3' 8.log( )* 9.ln √'- 10.log $./0123/
11.log2 45./625./ 12.log .
/74$.7$8) 13.log227'* 14.log 10)=>
15
SECONDARY MATH III // MODULE 9
STATISTICS – 9.3
Mathematics Vision Project Licensed under the Creative Commons Attribution CC BY 4.0 mathematicsvisionproject.org
9.3 Y B Normal?
A Solidify Understanding Task
Asacollegeadmissionsofficer,yougettoevaluatehundredsofapplicationsfromstudentsthatwanttoattendyourschool.Manyofthemhavegoodgrades,haveparticipatedinschoolactivities,havedoneservicewithintheircommunities,andallkindsofotherattributesthatwouldmakethemgreatcandidatesforattendingthecollegeyourepresent.Onepartoftheapplicationthatisconsideredcarefullyistheapplicantsscoreonthecollegeentranceexamination.Atthecollegeyouworkfor,somestudentshavetakentheACTandsomestudentshavetakentheSAT.Youhavetomakeafinaldecisionontwoapplicants.TheyarebothwonderfulstudentswiththeverysameG.P.A.andclassrankings.Itallcomesdowntotheirtestscores.StudentAtooktheACTandreceivedascoreof29inmathematics.StudentBtooktheSATandreceivedascoreof680inmathematics.Sinceyouareanexpertincollegeentranceexams,youknowthatbothtestsaredesignedtobenormallydistributed.AperfectACTscoreis36.TheACTmathematicssectionhasameanof21andstandarddeviationof5.3.(Source:NationalCenterforEducationStatistics2010)AperfectscoreontheSATmathsectionis800.TheSATmathematicssectionhasameanof516andastandarddeviationof116.(Source:www.collegeboard.com2010Profile).1. Basedonlyontheirtestscores,whichstudentwouldyouchooseandwhy?
Thisanalysisisstartingtomakeyouhungry,soyoucallyourfriendintheStatisticsDepartmentattheuniversityandaskhertogotolunchwithyou.Duringlunch,youtellherofyourdilemma.Theconversationgoessomethinglikethis:
CC
BY
Tyl
er P
hilli
ps
http
s://f
lic.k
r/p/
rdH
WBj
16
SECONDARY MATH III // MODULE 9
STATISTICS – 9.3
Mathematics Vision Project Licensed under the Creative Commons Attribution CC BY 4.0 mathematicsvisionproject.org
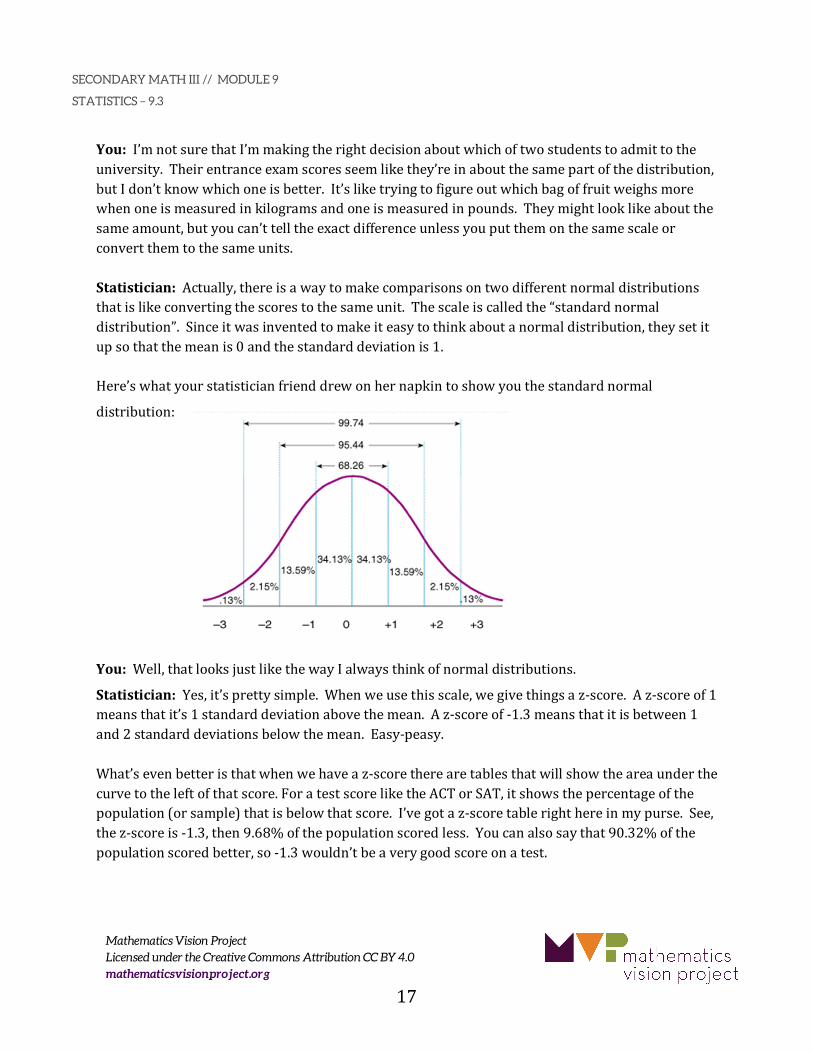
You:I’mnotsurethatI’mmakingtherightdecisionaboutwhichoftwostudentstoadmittotheuniversity.Theirentranceexamscoresseemlikethey’reinaboutthesamepartofthedistribution,butIdon’tknowwhichoneisbetter.It’sliketryingtofigureoutwhichbagoffruitweighsmorewhenoneismeasuredinkilogramsandoneismeasuredinpounds.Theymightlooklikeaboutthesameamount,butyoucan’ttelltheexactdifferenceunlessyouputthemonthesamescaleorconvertthemtothesameunits.Statistician:Actually,thereisawaytomakecomparisonsontwodifferentnormaldistributionsthatislikeconvertingthescorestothesameunit.Thescaleiscalledthe“standardnormaldistribution”.Sinceitwasinventedtomakeiteasytothinkaboutanormaldistribution,theysetitupsothatthemeanis0andthestandarddeviationis1.Here’swhatyourstatisticianfrienddrewonhernapkintoshowyouthestandardnormal
distribution:
You:Well,thatlooksjustlikethewayIalwaysthinkofnormaldistributions.
Statistician:Yes,it’sprettysimple.Whenweusethisscale,wegivethingsaz-score.Az-scoreof1meansthatit’s1standarddeviationabovethemean.Az-scoreof-1.3meansthatitisbetween1and2standarddeviationsbelowthemean.Easy-peasy.What’sevenbetteristhatwhenwehaveaz-scoretherearetablesthatwillshowtheareaunderthecurvetotheleftofthatscore.ForatestscoreliketheACTorSAT,itshowsthepercentageofthepopulation(orsample)thatisbelowthatscore.I’vegotaz-scoretablerighthereinmypurse.See,thez-scoreis-1.3,then9.68%ofthepopulationscoredless.Youcanalsosaythat90.32%ofthepopulationscoredbetter,so-1.3wouldn’tbeaverygoodscoreonatest.
17
SECONDARY MATH III // MODULE 9
STATISTICS – 9.3
Mathematics Vision Project Licensed under the Creative Commons Attribution CC BY 4.0 mathematicsvisionproject.org
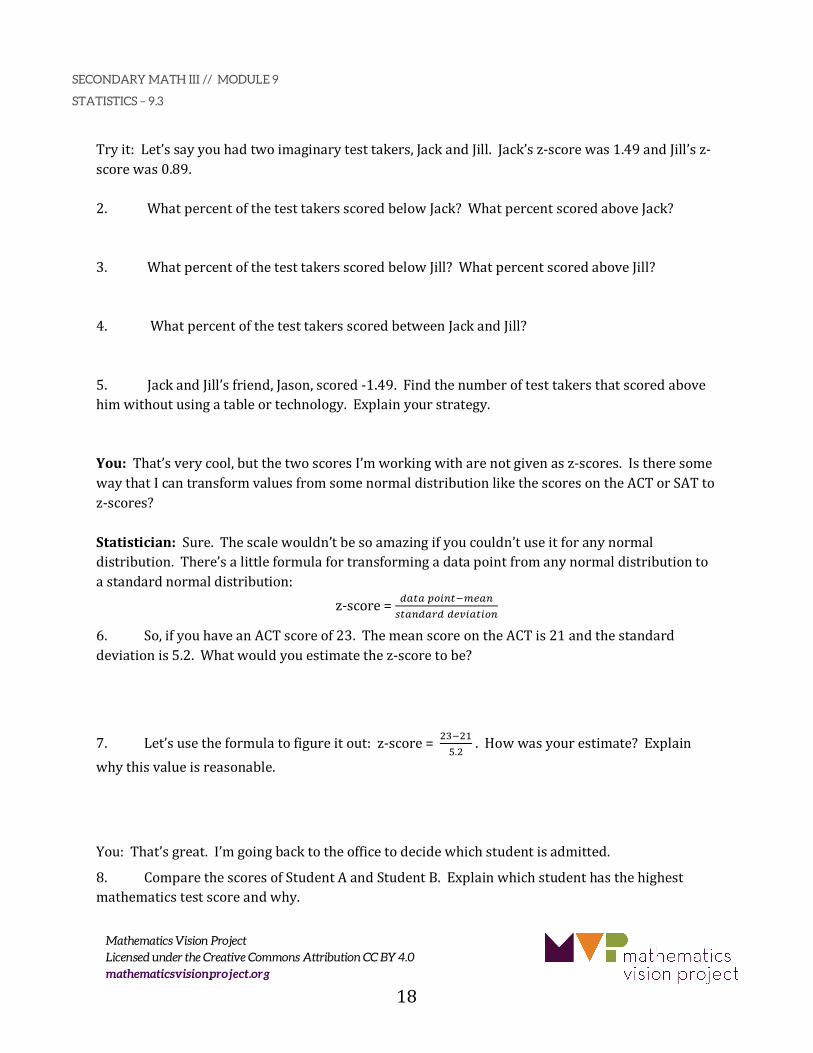
Tryit:Let’ssayyouhadtwoimaginarytesttakers,JackandJill.Jack’sz-scorewas1.49andJill’sz-scorewas0.89.2. WhatpercentofthetesttakersscoredbelowJack?WhatpercentscoredaboveJack?
3. WhatpercentofthetesttakersscoredbelowJill?WhatpercentscoredaboveJill?
4. WhatpercentofthetesttakersscoredbetweenJackandJill?
5. JackandJill’sfriend,Jason,scored-1.49.Findthenumberoftesttakersthatscoredabovehimwithoutusingatableortechnology.Explainyourstrategy.
You:That’sverycool,butthetwoscoresI’mworkingwitharenotgivenasz-scores.IstheresomewaythatIcantransformvaluesfromsomenormaldistributionlikethescoresontheACTorSATtoz-scores?Statistician:Sure.Thescalewouldn’tbesoamazingifyoucouldn’tuseitforanynormaldistribution.There’salittleformulafortransformingadatapointfromanynormaldistributiontoastandardnormaldistribution:
z-score=!"#"%&'(#)*+"(,#"(!"-!!+.'"#'&(
6. So,ifyouhaveanACTscoreof23.ThemeanscoreontheACTis21andthestandarddeviationis5.2.Whatwouldyouestimatethez-scoretobe?
7. Let’susetheformulatofigureitout:z-score=/0)/12./ .Howwasyourestimate?Explain
whythisvalueisreasonable.
You:That’sgreat.I’mgoingbacktotheofficetodecidewhichstudentisadmitted.
8. ComparethescoresofStudentAandStudentB.Explainwhichstudenthasthehighestmathematicstestscoreandwhy.
18
SECONDARY MATH III // MODULE 9
STATISTICS – 9.3
Mathematics Vision Project Licensed under the Creative Commons Attribution CC BY 4.0 mathematicsvisionproject.org
9.3
Needhelp?Visitwww.rsgsupport.org
READY Topic:Usingprobabilitytopredictfromasample
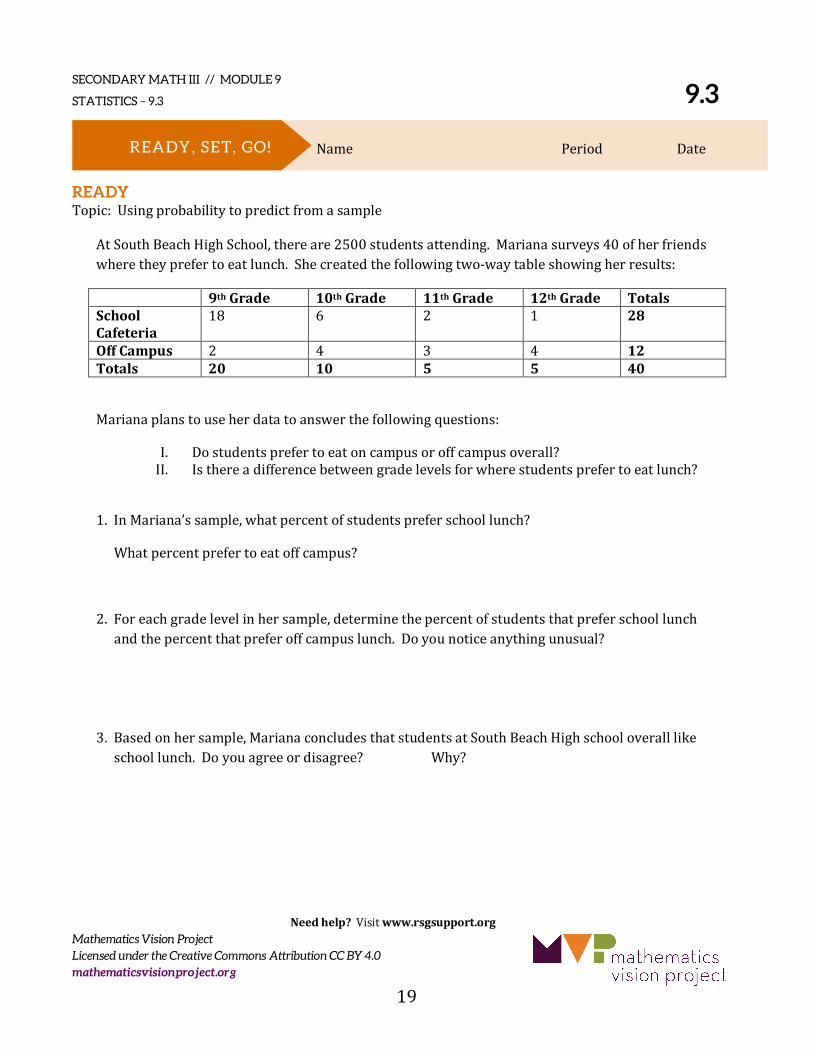
AtSouthBeachHighSchool,thereare2500studentsattending.Marianasurveys40ofherfriendswheretheyprefertoeatlunch.Shecreatedthefollowingtwo-waytableshowingherresults:
9thGrade 10thGrade 11thGrade 12thGrade TotalsSchoolCafeteria
18 6 2 1 28
OffCampus 2 4 3 4 12Totals 20 10 5 5 40
Marianaplanstouseherdatatoanswerthefollowingquestions:
I. Dostudentsprefertoeatoncampusoroffcampusoverall?II. Isthereadifferencebetweengradelevelsforwherestudentsprefertoeatlunch?
1.InMariana’ssample,whatpercentofstudentspreferschoollunch?
Whatpercentprefertoeatoffcampus?
2.Foreachgradelevelinhersample,determinethepercentofstudentsthatpreferschoollunchandthepercentthatpreferoffcampuslunch.Doyounoticeanythingunusual?
3.Basedonhersample,MarianaconcludesthatstudentsatSouthBeachHighschooloveralllikeschoollunch.Doyouagreeordisagree? Why?
READY, SET, GO! Name PeriodDate
19
SECONDARY MATH III // MODULE 9
STATISTICS – 9.3
Mathematics Vision Project Licensed under the Creative Commons Attribution CC BY 4.0 mathematicsvisionproject.org
9.3
Needhelp?Visitwww.rsgsupport.org
SET Topic:Exploringz-scores
Acompanymakesameanmonthlyincomeof$20,300withastandarddeviationof$3,200.Inonegivenmonththecompanymakes$29,500.
4.Findthez-score.
5.AssumingthecompaniesmonthlyincomeisNormallydistributed,whatpercentofthetimedoesthecompanymakemorethanthisamount?Lessthan?
6.Whatpercentofthetimedoesthecompanymakebetween$15,000and$25,000?
7.Ifthecompanyneedstomake$16,400inordertobreakeven,howlikelyinagivenmonthisthecompanytomakeaprofit?
OntheWechslerAdultIntelligenceScale,anaverageIQis100withastandarddeviationof15units.(Source:http://en.wikipedia.org/wiki/Intelligence_quotient)
8.IQscoresbetween90and109areconsideredaverage.AssumingIQscoresfollowaNormaldistribution,whatpercentofpeopleareconsideredaverage?
9.OnemeasureofGeniusisanIQscoreofabove135.Whatpercentofpeopleareconsideredgenius?
10.EinsteinhadanIQscoreof160.Whatishisz-score?
11.WhatistheprobabilityofanindividualhavingahigherIQthanEinstein?
20
SECONDARY MATH III // MODULE 9
STATISTICS – 9.3
Mathematics Vision Project Licensed under the Creative Commons Attribution CC BY 4.0 mathematicsvisionproject.org
9.3
Needhelp?Visitwww.rsgsupport.org
GO Topic:SketchingPolynomials
Withoutusingtechnology,sketchthegraphofthepolynomialfunctionwiththegivencharacteristics.Iftheequationisnotgiven,writeitinstandardform.
12.Degree4
Roots:-1multiplicity2,5,-2
"–intercept:20
Equation:
13.$(&) = (& + 2)(& − 3)-
21
SECONDARY MATH III // MODULE 9
STATISTICS – 9.3
Mathematics Vision Project Licensed under the Creative Commons Attribution CC BY 4.0 mathematicsvisionproject.org
9.3
Needhelp?Visitwww.rsgsupport.org
14.1(&) = −&(& − 3)2(& + 5)(& − 5)
15.Degree3$(−1) = 10$(25) = 0$(3) = 0Equation:
22
SECONDARY MATH III // MODULE 9
STATISTICS – 9.4
Mathematics Vision Project Licensed under the Creative Commons Attribution CC BY 4.0 mathematicsvisionproject.org
9.4 Wow, That's Weird!
A Practice Understanding Task
Eachofthestoriesbelowarebaseduponnormaldistributions.Rankorderthesestoriesfrommostunusualtomostaverage.(1isthemostunusual,8isthemostaverage.)Ineachcase,explainyourranking.A. ThenumberofredloopsinaboxofTutti-Frutti-O’sisnormallydistributedwithmeanof800loopsandstandarddeviation120.Tonyboughtanewbox,openedit,andcounted1243redloops.(Itdidn’treallymatterbecauseallthecolorsarethesameflavoranyway.)
Rank_________Explanation:_________________________________________________________________________________
B. Theweightofhousecatsisnormallydistributedwithameanof10poundsandstandarddeviation2.1pounds.Mycat,BigBoy,weighs6pounds.
Rank_________Explanation:_________________________________________________________________________________
C. Thelifetimeofabatteryisnormallydistributedwithameanlifeof40hoursandastandarddeviationof1.2hours.Ijustboughtabatteryanditdiedafterjust20hours
Rank_________Explanation:_________________________________________________________________________________
D. Theamountthatahumanfingernailgrowsinayearisnormallydistributedwithameanlengthof3.5cmandastandarddeviationof0.63cm.Myneighbor’sthumbnailgrewallyearwithoutbreakinganditis4.6cmlongwithstarsandstripespaintedonit.
Rank_________Explanation:_________________________________________________________________________________
CC
BY
Sha
wn
Car
pent
er
http
s://f
lic.k
r/p/
x9zW
w
23
SECONDARY MATH III // MODULE 9
STATISTICS – 9.4
Mathematics Vision Project Licensed under the Creative Commons Attribution CC BY 4.0 mathematicsvisionproject.org
E. Mylittlebrotherwasdigginginthegardenandfoundagiantearthwormthatwas35cmlong.Thelengthofearthwormsisnormallydistributedwithameanlengthof14cmandastandarddeviationof5.3cm.
Rank_________Explanation:_________________________________________________________________________________
F. Themeanlengthofahumanpregnancyis268dayswithastandarddeviationof16days.Myauntjusthadaprematurebabydeliveredafteronly245days.
Rank_________Explanation:_________________________________________________________________________________
G. IQscoresforyoungadultsonafamousIQtestaredistributednormallywithameanof110andastandarddeviationof25.I’mprettysmartandmyIQis135.
Rank_________Explanation:_________________________________________________________________________________
H. Thearmymeasuredheadsizesamongmalesoldiersandfoundthatthedistributionisprettyclosetonormalwithameanof22.8inchesandstandarddeviationof1.1inches.LittleJoewasalmosttoosmalltogetintothearmybecausehisheadsizewasonly20.6inches.
Rank_________Explanation:_________________________________________________________________________________
24
SECONDARY MATH III // MODULE 9
STATISTICS – 9.4
Mathematics Vision Project Licensed under the Creative Commons Attribution CC BY 4.0 mathematicsvisionproject.org
9.4
Needhelp?Visitwww.rsgsupport.org
READY Topic:Fillingintwo-waytables
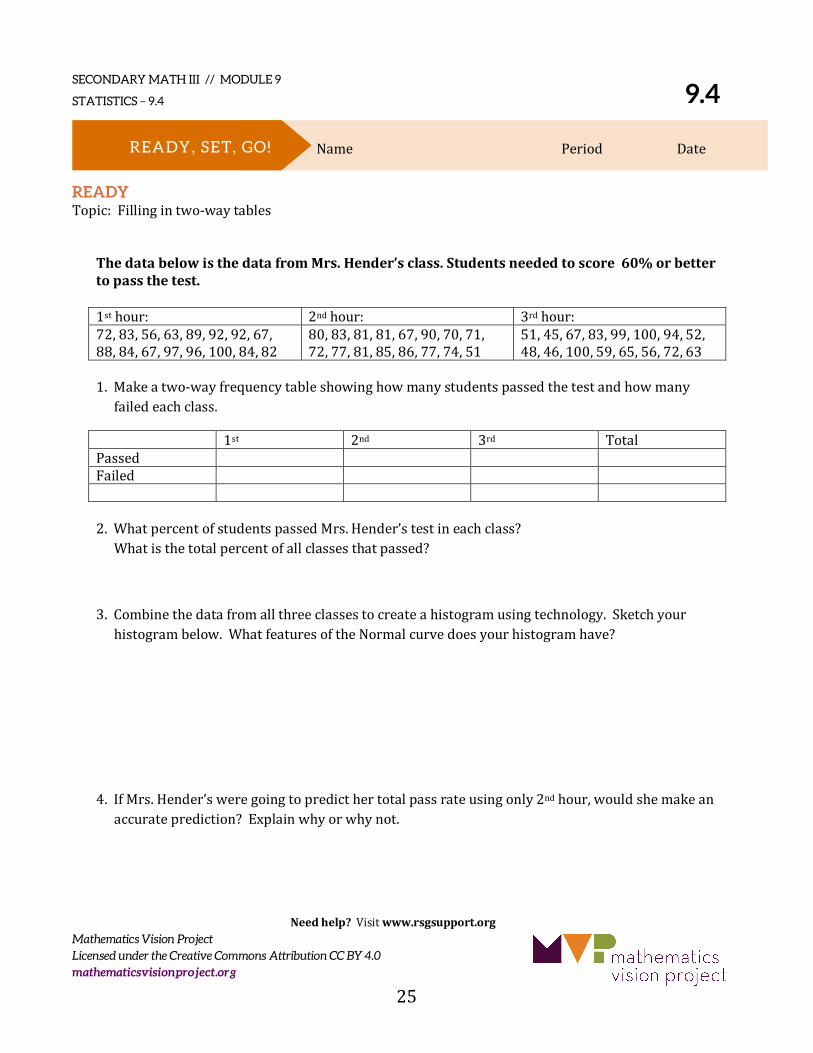
ThedatabelowisthedatafromMrs.Hender’sclass.Studentsneededtoscore60%orbettertopassthetest.
1sthour: 2ndhour: 3rdhour:72,83,56,63,89,92,92,67,88,84,67,97,96,100,84,82
80,83,81,81,67,90,70,71,72,77,81,85,86,77,74,51
51,45,67,83,99,100,94,52,48,46,100,59,65,56,72,63
1.Makeatwo-wayfrequencytableshowinghowmanystudentspassedthetestandhowmanyfailedeachclass.
1st 2nd 3rd TotalPassed Failed 2.WhatpercentofstudentspassedMrs.Hender’stestineachclass?Whatisthetotalpercentofallclassesthatpassed?
3.Combinethedatafromallthreeclassestocreateahistogramusingtechnology.Sketchyourhistogrambelow.WhatfeaturesoftheNormalcurvedoesyourhistogramhave?
4.IfMrs.Hender’sweregoingtopredicthertotalpassrateusingonly2ndhour,wouldshemakeanaccurateprediction?Explainwhyorwhynot.
READY, SET, GO! Name PeriodDate
25
SECONDARY MATH III // MODULE 9
STATISTICS – 9.4
Mathematics Vision Project Licensed under the Creative Commons Attribution CC BY 4.0 mathematicsvisionproject.org
9.4
Needhelp?Visitwww.rsgsupport.org
SET Topic:Usingfeaturesofthenormalcurvetorankdata
5.FivetrackathletesareintherunningfortheAthleticPerformanceoftheYearaward.Apanelofcoachesistryingtodecidewhichathleteisthemostdeservingtowintheaward.Rankeachathletebelowbythegiveninformation.AssumealldistributionsfollowaNormalCurve.
a. JavierthrewtheJavelin215ft.TheaverageJavelinthrowis152.08ft.withastandarddeviationof15.85ft.
b. Chancerana400mtimeof46.99seconds.Theaverage400mtimewas52.6,withastandarddeviationof1.01seconds.
c. Derickrana36.26inthe300mHurdles.Theaveragetimewas41.77withastandarddeviationof1.49seconds.
d. Chadrana100mtimeof10.59seconds.Theaveragetimewas11.603secondswithastandarddeviationof.29seconds.
e. Kaydenthrewthediscus180ft.Theaveragethrowwas122.4ft.withastandarddeviationof14.38ft.
GO Topic:Solvinglogarithmicequations
Solveeachequationbelowforxbyapplyingpropertiesforexponentsandlogarithms.
6.2%&' = 128 7., -./01
%= 27
8.3%3. = 27%&0 9.log(29 + 4) − log(39) = 0
10.log.(29. + 49 − 2) − log. 10 = 0 11. ?@(%3A)?@(.%&0) = 1
12.?BC(/%3.)?BC -' = 1 13.?BCD(0%3E)?BCD F-= 1
26
SECONDARY MATH III // MODULE 9
STATISTICS – 9.5
Mathematics Vision Project Licensed under the Creative Commons Attribution CC BY 4.0 mathematicsvisionproject.org
9.5 Would You Like to Try a Sample?
A Develop Understanding Task
InthetaskWow!That’sWeird!,yousawanumberof
statisticsforthingsliketheaverageweightofahouse
cat.Youknowitwouldbeimpossibletomeasureallthehousecatstofindtheiraverageweights,
butscientistsstillclaimtoknowit.
You’veprobablyhearditmanytimesbefore:“Surveyresultsshowthat54%ofAmericansbelieve
that...”You’resurethatyoudidn’tparticipateinthesurveyandneitherdidanyoneyouknow,and
yet,theresearchersclaimthatthesurveyrepresentsthebeliefsofallAmericans.
Howcanthisbepossible?Inthenextfewtasks,we’llexplorehowstatisticsallowustodraw
conclusionsaboutanentiregroupwithoutactuallyworkingwiththeentiregroup.Sometimesthe
resultsmakesenseandothertimesyoumightthinkthattheyjustcan’tberight.Wewilllearnhow
tomakejudgmentsaboutstatisticalstudies,basedonthemethodsthathavebeenused.
First,weneedtogetourtermsstraight.Whenwetalkabouttheentiregroupthatweare
interestedin,thatiscalledthepopulation.Whensomemembersofthegroupareselectedto
representtheentiregroup,thatiscalledasample.Thethingweareinterestedinknowingabout
thepopulationistheparameterofinterest.
Foreachofthescenariosbelow,identifythepopulation,thesampleandthepopulationparameter
ofinterest.
1. Agrocerystorewantstoknowtheaveragenumberofitemsthatshopperspurchaseineachvisittothestore.Theydecidetocounttheitemsinthecartofeverytwentiethpersonthroughthecheckstand.Population_______________________________________________________________________________________Sample___________________________________________________________________________________________Parameterofinterest___________________________________________________________________________
CC
BY
Mr.
Tin
DC
http
s://f
lic.k
r/p/
4NW
QA
2
27
SECONDARY MATH III // MODULE 9
STATISTICS – 9.5
Mathematics Vision Project Licensed under the Creative Commons Attribution CC BY 4.0 mathematicsvisionproject.org
2. Ateamofbiologistswantstoknowtheaverageweightoffishinalake.Theydecidetodropanet
andmeasureallthefishcaughtinthreedifferentlocationsinthelake.Population_______________________________________________________________________________________Sample___________________________________________________________________________________________Parameterofinterest___________________________________________________________________________
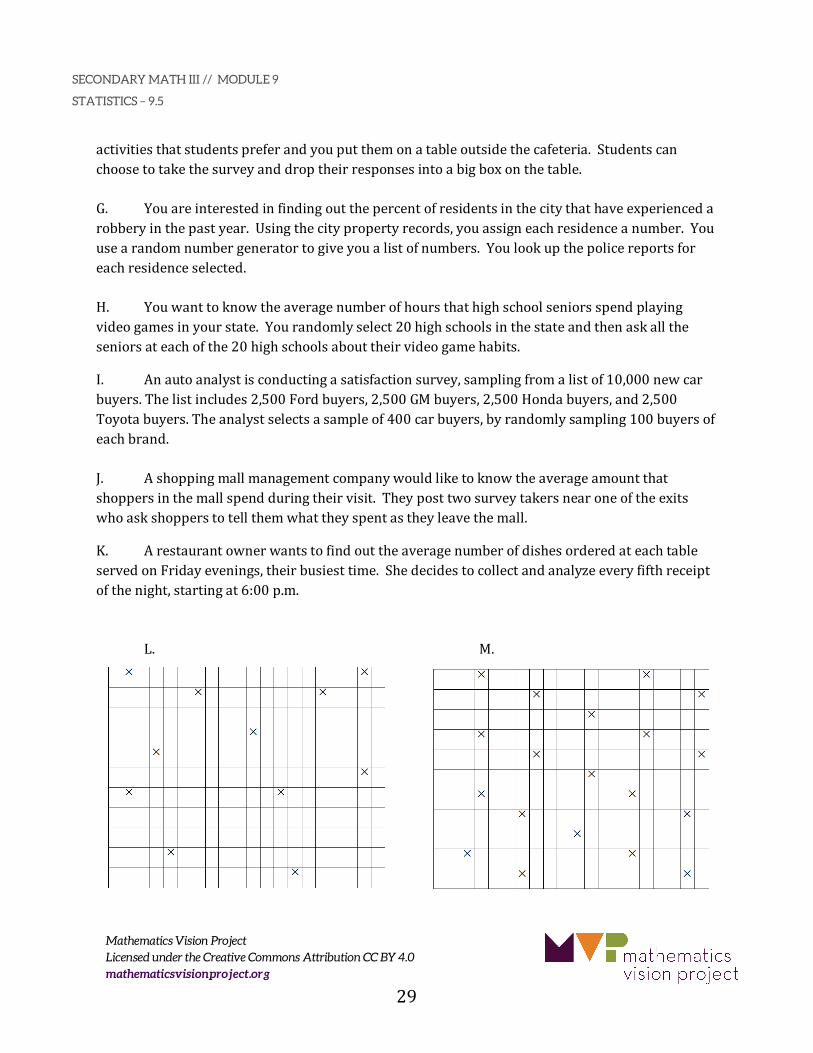
3.Therearelotsofdifferentwaysthatasamplecanbechosenfromapopulation.Groupthe
followingexamplesofwaystoselectasampleintosixcategories.
A. Youareinchargeofschoolactivities.Youwanttoknowwhatactivitiesstudentswouldprefertoparticipateinduringtheschoolyear.Youdecidetoputthenameofeachstudentintheschoolintoabigbowl.Youdraw100namesandaskthosestudentstorespondtoasurveyabouttheactivitiestheyprefer.B. Youareinchargeofschoolactivities.Youwanttoknowwhatactivitiesstudentswouldprefertoparticipateinduringtheschoolyear.Youassigneachstudentintheschoolanumber.Yourandomlyselectastartingnumberamongthefirst10numbersandthenselecteverytenthstudentinthelistfromthatpointforward.C. Youareinchargeofschoolactivities.Youwanttoknowwhatactivitiesstudentswouldprefertoparticipateinduringtheschoolyear.Youusetherollsfromeachhomeroomclass.Yougothrougheachhomeroomclass,drawing2namesfromeachclass.Youaskthosestudentstorespondtoasurveyabouttheactivitiestheyprefer.
D. Youareinchargeofschoolactivities.Youwanttoknowwhatactivitiesstudentswouldprefertoparticipateinduringtheschoolyear.Yougetthelistofallthehomeroomclassesandrandomlyselect5classes.Yougotoeachoftheclassesselectedandsurveyallthestudentsinthatclass.E. Youareinchargeofschoolactivities.Youwanttoknowwhatactivitiesstudentswouldprefertoparticipateinduringtheschoolyear.Youstandinthecafeteriaduringyourlunchbreakandaskstudentsintheywouldbewillingtoparticipateinyoursurveyastheywalkby.
F. Youareinchargeofschoolactivities.Youwanttoknowwhatactivitiesstudentswouldprefertoparticipateinduringtheschoolyear.Youmakealotofcopiesofthesurveyaboutthe
28
SECONDARY MATH III // MODULE 9
STATISTICS – 9.5
Mathematics Vision Project Licensed under the Creative Commons Attribution CC BY 4.0 mathematicsvisionproject.org
activitiesthatstudentspreferandyouputthemonatableoutsidethecafeteria.Studentscanchoosetotakethesurveyanddroptheirresponsesintoabigboxonthetable.G. Youareinterestedinfindingoutthepercentofresidentsinthecitythathaveexperiencedarobberyinthepastyear.Usingthecitypropertyrecords,youassigneachresidenceanumber.Youusearandomnumbergeneratortogiveyoualistofnumbers.Youlookupthepolicereportsforeachresidenceselected.H. Youwanttoknowtheaveragenumberofhoursthathighschoolseniorsspendplayingvideogamesinyourstate.Yourandomlyselect20highschoolsinthestateandthenaskalltheseniorsateachofthe20highschoolsabouttheirvideogamehabits.
I. Anautoanalystisconductingasatisfactionsurvey,samplingfromalistof10,000newcarbuyers.Thelistincludes2,500Fordbuyers,2,500GMbuyers,2,500Hondabuyers,and2,500Toyotabuyers.Theanalystselectsasampleof400carbuyers,byrandomlysampling100buyersofeachbrand.J. Ashoppingmallmanagementcompanywouldliketoknowtheaverageamountthatshoppersinthemallspendduringtheirvisit.Theyposttwosurveytakersnearoneoftheexitswhoaskshopperstotellthemwhattheyspentastheyleavethemall.
K. ArestaurantownerwantstofindouttheaveragenumberofdishesorderedateachtableservedonFridayevenings,theirbusiesttime.Shedecidestocollectandanalyzeeveryfifthreceiptofthenight,startingat6:00p.m.
L. M.
29
SECONDARY MATH III // MODULE 9
STATISTICS – 9.5
Mathematics Vision Project Licensed under the Creative Commons Attribution CC BY 4.0 mathematicsvisionproject.org
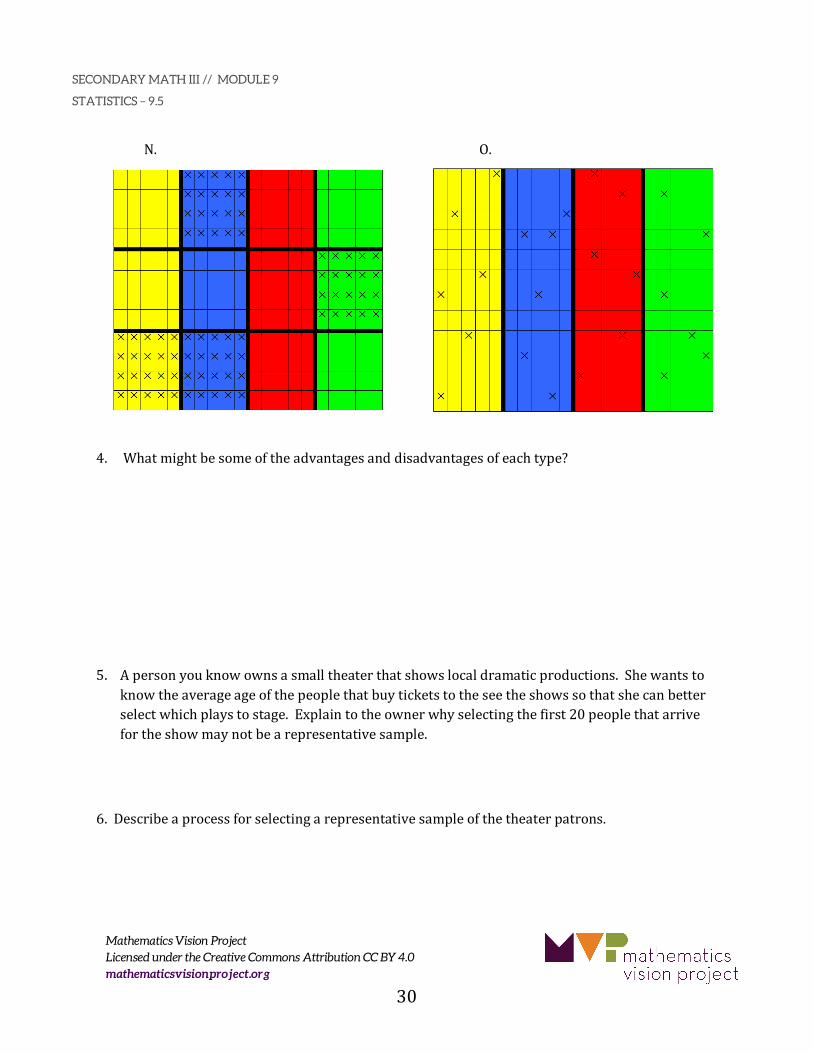
N. O.
4. Whatmightbesomeoftheadvantagesanddisadvantagesofeachtype?
5. Apersonyouknowownsasmalltheaterthatshowslocaldramaticproductions.Shewantstoknowtheaverageageofthepeoplethatbuyticketstotheseetheshowssothatshecanbetterselectwhichplaystostage.Explaintotheownerwhyselectingthefirst20peoplethatarrivefortheshowmaynotbearepresentativesample.
6.Describeaprocessforselectingarepresentativesampleofthetheaterpatrons.
30
SECONDARY MATH III // MODULE 9
STATISTICS – 9.5
Mathematics Vision Project Licensed under the Creative Commons Attribution CC BY 4.0 mathematicsvisionproject.org
9.5
Needhelp?Visitwww.rsgsupport.org
READY Topic:Contrastingassociationandcausation
Whencollectingdata,statisticiansareofteninterestedinmakingpredictions.Sometimestheysimplywanttoknowifonevariableisrelatedorisassociatedwithanothervariable.(Canyoupredictonevariablegiveninformationontheotherone).Othertimes,theywanttodetermineifonevariableactuallycausesachangeinanothervariable.Foreachexamplebelow,decidewhetherthevariablessimplyexplaineachother,orifyouthinkonevariablewouldcausetheothertochange.
1.AstheamountoffoodOllietheelephanteatsincreasesherweightalsoincreases.(Associated/Causes)
2.AsPopsiclesalesgoupinthesummer,thenumberofpeopledrowningalsoincreases.(Associated/Causes)
3.AsErika’sfeetgrowlonger,shegrowstaller.(Associated/Causes)
4.AsTabathagetsolder,herreadingscoreimprovesinschool.(Associated/Causes)
SET Topic:Identifyingpopulation,sample,andparameter
Foreachscenariobelow,identifythepopulation,sampleandparameterofinterest.
5.Thelocalschoolboardwantstogetparentstoevaluateteachers.Theyselect100parentsandfindthat89%approveoftheirchild’steacher.
Population: Sample: Parameter:
6.Jarretwantstoknowtheaverageheightofthestudentsinhisschool.Thereare753studentsinhishighschool;hefindstheheightsof52ofthem.
Population: Sample: Parameter:
7.AgovernmentofficialisinterestedinthepercentofpeopleatJFKairportthataresearchedbysecurity.Hewatches300peoplegothroughsecurityandobserves42thataresearched.
Population: Sample: Parameter:
READY, SET, GO! Name PeriodDate
31
SECONDARY MATH III // MODULE 9
STATISTICS – 9.5
Mathematics Vision Project Licensed under the Creative Commons Attribution CC BY 4.0 mathematicsvisionproject.org
9.5
Needhelp?Visitwww.rsgsupport.org
Foreachscenario,identifywhattypeofsamplingwasusedtoobtainthesample.Explainwhetherornotyouthinkthesamplewillberepresentativeofthepopulationitwassampledfrom:
8.Elvirasurveysthefirst60studentsinthelunchlinetodetermineifstudentsattheschoolaresatisfiedwithschoollunch.
Typeofsample:Representative?Explain.
9.Elviraselectsevery5thstudentinthelunchlinetodetermineifstudentsattheschoolaresatisfiedwithschoollunch.
Typeofsample:Representative?Explain.
10.Elvirarandomlyselects7differenttablesinthelunchroomandsurveyseverystudentonthetabletodetermineifstudentsattheschoolaresatisfiedwithschoollunch.
Typeofsample:Representative?Explain.
11.Elviraassignseverystudentintheschoolanumberandrandomlyselects60studentstosurveytodetermineifstudentattheschoolaresatisfiedwithschoollunch.
Typeofsample:Representative?Explain.
12.Elvirawantstodetermineifstudentsaresatisfiedwithschoollunch.Sheleavessurveysonatableforstudentstoanswerasthewalkby.
Typeofsample:Representative?Explain.
13.Elvirawantstodetermineifstudentsaresatisfiedwithschoollunch.Shewantstoincludeinputfromeachgradelevelatthehighschool.Sherandomlysurveys25freshman,25sophomores,25juniors,and25seniors.
Typeofsample:Representative?Explain.
32
SECONDARY MATH III // MODULE 9
STATISTICS – 9.5
Mathematics Vision Project Licensed under the Creative Commons Attribution CC BY 4.0 mathematicsvisionproject.org
9.5
Needhelp?Visitwww.rsgsupport.org
GO Topic:Graphingtrigfunctions
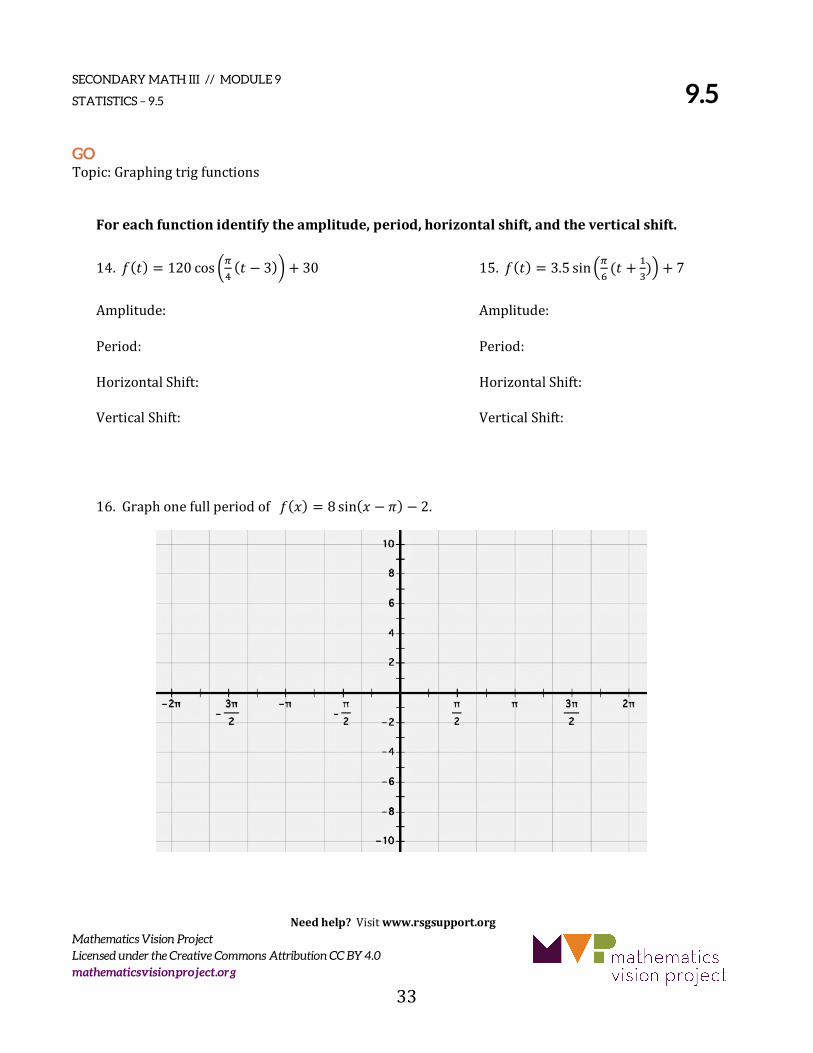
Foreachfunctionidentifytheamplitude,period,horizontalshift,andtheverticalshift.
14.!(#) = 120 cos ,-. (# − 3)1 + 30 15.!(#) = 3.5 sin7-8 (# +9:); + 7
Amplitude: Amplitude:
Period: Period:
HorizontalShift: HorizontalShift:
VerticalShift: VerticalShift:
16.Graphonefullperiodof!(=) = 8 sin(= − ?) − 2.
33
SECONDARY MATH III // MODULE 9
STATISTICS – 9.6
Mathematics Vision Project Licensed under the Creative Commons Attribution CC BY 4.0 mathematicsvisionproject.org
9.6 Let's Investigate
A Solidify Understanding Task
Whenwewanttodrawconclusionsaboutsomepopulation,thereareatleasttwodifferentstatisticalideastoconsider.WelearnedaboutsamplinginWouldYouLiketoTryaSample,sinceitisusuallymorepracticaltosamplethepopulationratherthansomehowmeasureeveryoneoreverythinginthepopulation.Thesecondthingtoconsiderishowtomeasuretheparameterofinterest,thethingwewanttoknowaboutthepopulation.Sometimesit’sobvious,likeifyouwanttoknowtheaverageweightofapopulation,youdetermineasampleandthenputeachofthesubjectsonascale.Threeothertechniquesarethefollowing:
• Surveys:Whentheywanttoknowhowpeoplefeel,whattheirpreferencesare,whattheyown,howmuchtheymake,etc.,researchersoftenconstructasurveytoaskthepeopleinthesampleabouttheparameterofinterest.
• ObservationalStudies:Inthistypeofstudy,researchersobservethebehaviorofthe
participants/subjectswithouttryingtoinfluenceitinanywaysotheycanlearnabouttheparameterofinterest.
• Experiments:Inanexperiment,researchersmanipulatethevariablestotrytodetermine
causeandeffect.
1.Imaginethatyouwanttoknowwhetheranewdietplaniseffectiveinhelpingpeoplelose
weight.Youmightchooseanyofthethreemethodstodeterminethis.
• Ifyouusedasurvey,youcouldsimplyaskpeoplethathadtriedthedietplaniftheylostweight.
• Ifyouusedanobservationalstudy,youmightmonitorvolunteersthattrythedietplanandmeasurehowmuchweighttheylost(orgained).
• Ifyouusedanexperiment,youmightrandomlyassignparticipantstotwogroups.Onegroup(thecontrolgroup)eatsastheynormallywouldandtheothergroup(theexperimentalgroup)eatsaccordingtothedietplan.Attheendoftwomonths,thetwogroupsarecomparedtoseetheaverageweightgainorlossineachgroup.
CC
BY
Sim
on B
lack
ley
http
s://f
lic.k
r/p/
aj4H
Wg
34
SECONDARY MATH III // MODULE 9
STATISTICS – 9.6
Mathematics Vision Project Licensed under the Creative Commons Attribution CC BY 4.0 mathematicsvisionproject.org
Basedonthesethreeexamples,
a. Whataresomepossibleadvantagesanddisadvantagesofsurveys?
b. Whataresomepossibleadvantagesanddisadvantagesofobservationalstudies?c. Whataresomepossibleadvantagesanddisadvantageofexperiments?
2.Identifywhichmethodisillustratedbyeachexample:a. Todeterminewhetherdrinkingorangejuicepreventscolds,researchersrandomlyassigned
participantstoagroupthatdranknoorangejuiceoragroupthatdranktwoglassesof orangejuiceaday.Theymeasuredthenumberofcoldsthateachgrouphadoverthecourse oftheyearandcomparedtheresultsofthetwogroups.b. Todeterminewhetherexercisereducesthenumberofheadaches,researchersrandomly
selectedagroupofparticipantsandrecordedthenumberofhourseachparticipant exercisedandthenumberofheadacheseachparticipantexperienced.c. Todeterminetheeffectivenessofanewadvertisingcampaign,arestaurantaskedevery
tenthcustomeriftheyhadseentheadvertisement,andifithadinfluencedtheirdecisionto visittherestaurant.d. Todetermineifanewdrugisaneffectivetreatmentfortheflu,researchersrandomly
selectedtwogroupsofpeoplethathadtheflu.Onegroupwasgivenaplacebo(asugarpill thathasnophysicaleffect)andonegroupwasgiventhenewdrug.Researchersmeasured thenumberofdaysthatparticipantsexperiencedflusymptomsandcomparedthetwo groupstoseeiftheyweredifferent.e. Todetermineifhigherspeedlimitscausemoretrafficfatalities,researcherscomparedthe
numberoftrafficdeathsonrandomlyselectedstretchesofhighwaywith65mphspeed limitstothenumberoftrafficdeathsonanequalnumberofrandomlyselectedstretchesof highwaywith75mphspeedlimits.
35
SECONDARY MATH III // MODULE 9
STATISTICS – 9.6
Mathematics Vision Project Licensed under the Creative Commons Attribution CC BY 4.0 mathematicsvisionproject.org
3.Describehowyoumightselectasampleanduseasurveytoinvestigatewhichsoftdrinkpeople
prefer:FizzyPoporKookyKola.
4.Describehowyoumightselectasampleanduseanobservationalstudytoinvestigatewhichsoft
drinkpeopleprefer:FizzyPoporKookyKola.
5.Describehowyoumightselectasampleanduseanexperimenttoinvestigateifconsuminglarge
quantitiesofKookyKolaisassociatedwithhavingheadaches.
6.Describethemethodyouwouldusetodetermineifexcessivetextingisassociatedwithbad
grades.Explainwhyyouchosethatmethodandwhatconclusionscouldbedrawnfromthestudy.
36
SECONDARY MATH III // MODULE 9
STATISTICS – 9.6
Mathematics Vision Project Licensed under the Creative Commons Attribution CC BY 4.0 mathematicsvisionproject.org
9.6
Needhelp?Visitwww.rsgsupport.org
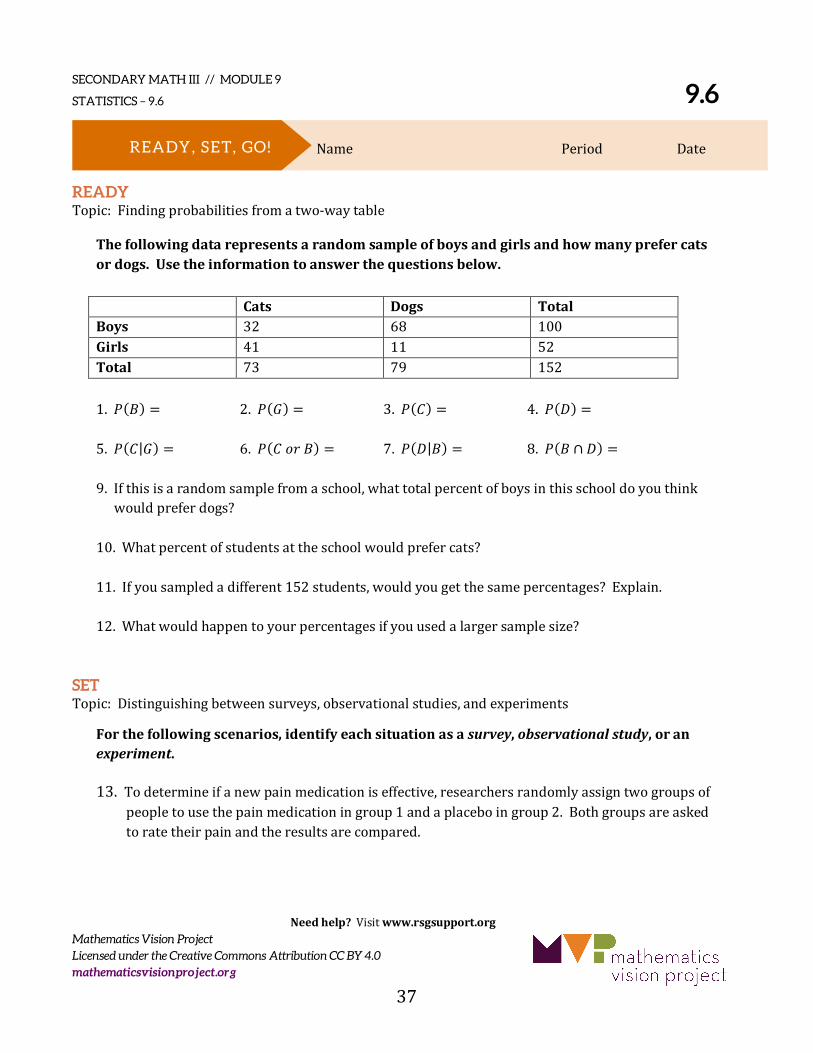
READY Topic:Findingprobabilitiesfromatwo-waytable
Thefollowingdatarepresentsarandomsampleofboysandgirlsandhowmanyprefercatsordogs.Usetheinformationtoanswerthequestionsbelow. Cats Dogs TotalBoys 32 68 100Girls 41 11 52Total 73 79 152
1.!(#) = 2.!(&) = 3.!(') = 4.!(() =5.!('|&) = 6.!('+,#) = 7.!((|#) = 8.!(# ∩ () =9.Ifthisisarandomsamplefromaschool,whattotalpercentofboysinthisschooldoyouthinkwouldpreferdogs?
10.Whatpercentofstudentsattheschoolwouldprefercats?11.Ifyousampledadifferent152students,wouldyougetthesamepercentages?Explain.12.Whatwouldhappentoyourpercentagesifyouusedalargersamplesize?
SET Topic:Distinguishingbetweensurveys,observationalstudies,andexperiments
Forthefollowingscenarios,identifyeachsituationasasurvey,observationalstudy,oranexperiment.
13.Todetermineifanewpainmedicationiseffective,researchersrandomlyassigntwogroupsof
peopletousethepainmedicationingroup1andaplaceboingroup2.Bothgroupsareaskedtoratetheirpainandtheresultsarecompared.
READY, SET, GO! Name PeriodDate
37
SECONDARY MATH III // MODULE 9
STATISTICS – 9.6
Mathematics Vision Project Licensed under the Creative Commons Attribution CC BY 4.0 mathematicsvisionproject.org
9.6
Needhelp?Visitwww.rsgsupport.org
14.Officialswanttodetermineifraisingthespeedlimitfrom75mphto80mphwillhaveanimpactonsafety.Todeterminethis,theywatchastretchofthehighwaywhenthespeedlimitis75andseehowmanyaccidentsthereare.Thentheyobservethenumberofaccidentsoveraperiodoftimeonthesamestretchofhighwayforaspeedlimitof80mph.Theythencomparethedifference.
15.Todetermineifanewsandwichonthemenuispreferredmorethantheoriginal,themanagerof
therestauranttakesarandomsampleofcustomersthathavetriedbothsandwichesandasksthemwhichsandwichtheylikebest.
16.Anewspaperwantstoknowwhatitscustomersatisfactionis.Itrandomlyselects500
customersandasksthem.Mrs.Goodmorewantstoknowifdoinghomeworkactuallyhelpsstudentsdobetterontheirunitexams.17.DescribehowMrs.Goodmorecouldcarryoutasurveytodetermineifhomeworkactuallyhelps.
Explaintheroleofrandomizationinyourdesign.18.DescribehowMrs.Goodmorecouldcarryoutanobservationalstudytodetermineifhomework
helpstestscores.19.DescribehowMrs.Goodmorecouldcarryoutanexperimenttodetermineifhomeworkhelps
testscores.Explainhowyouwilluserandomizationinyourdesignandhowyouwilluseacontrol.
20.IfMrs.Goodmorewantstodetermineifhomeworkcausestestscorestorise,whichmethod
wouldbebest?Why?
38
SECONDARY MATH III // MODULE 9
STATISTICS – 9.6
Mathematics Vision Project Licensed under the Creative Commons Attribution CC BY 4.0 mathematicsvisionproject.org
9.6
Needhelp?Visitwww.rsgsupport.org
GO Topic:Recallingnormalcurves
Theaveragerestingheartrateofayoungadultisapproximately70beatsperminutewithastandarddeviationof10beatsperminute.AssumingrestingheartratefollowsaNormalDistribution,answerthefollowingquestions.21.DrawandlabeltheNormalcurvethatdescribesthisdistribution.Besuretolabelthemean,and
themeasurements1,2,and3standarddeviationsoutfromthemean.22.Whatpercentofpeoplehaveaheartratebetween55and80beatsperminute?Labelthese
pointsonyourNormalcurveaboveandshadeintheareathatrepresentsthepercentofpeoplewithheartbeatsbetween55and80beatsperminute.
23.Ifarestingheartrateabove80beatsperminuteisconsideredunhealthy,whatpercentof
peoplehaveanunhealthyheartrate?
39
SECONDARY MATH III // MODULE 9
STATISTICS – 9.7
Mathematics Vision Project Licensed under the Creative Commons Attribution CC BY 4.0 mathematicsvisionproject.org
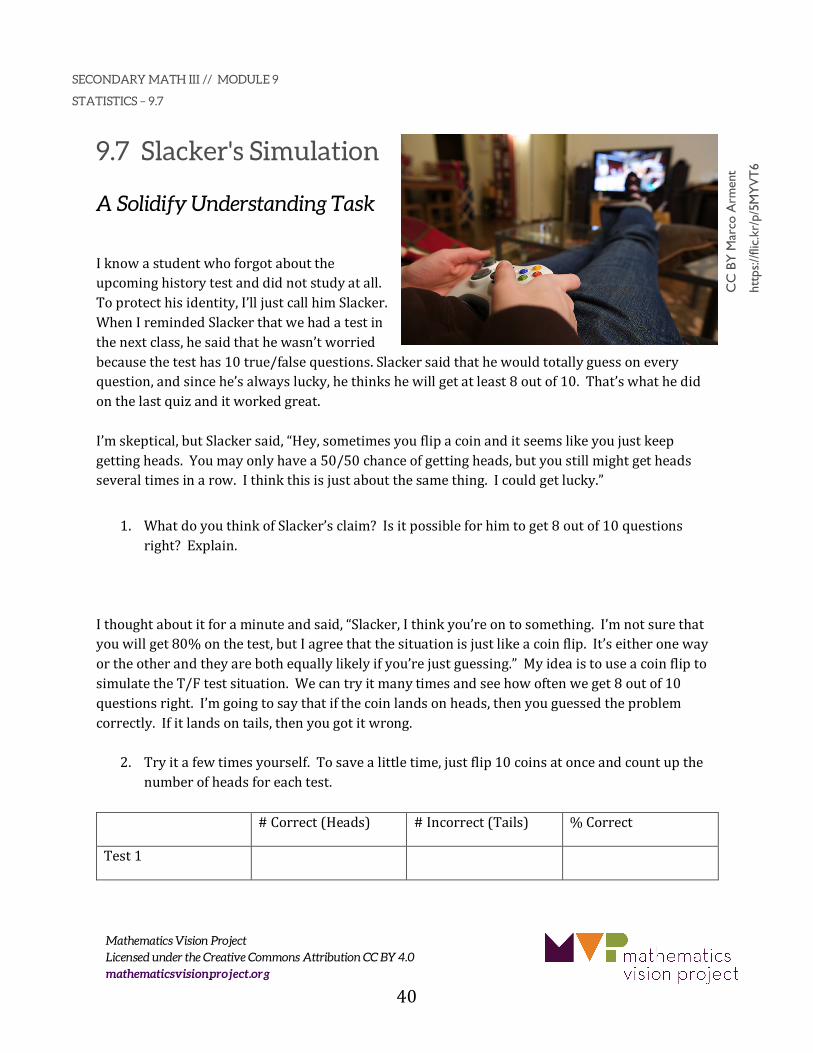
9.7 Slacker's Simulation
A Solidify Understanding Task
Iknowastudentwhoforgotabouttheupcominghistorytestanddidnotstudyatall.Toprotecthisidentity,I’lljustcallhimSlacker.WhenIremindedSlackerthatwehadatestinthenextclass,hesaidthathewasn’tworriedbecausethetesthas10true/falsequestions.Slackersaidthathewouldtotallyguessoneveryquestion,andsincehe’salwayslucky,hethinkshewillgetatleast8outof10.That’swhathedidonthelastquizanditworkedgreat.I’mskeptical,butSlackersaid,“Hey,sometimesyouflipacoinanditseemslikeyoujustkeepgettingheads.Youmayonlyhavea50/50chanceofgettingheads,butyoustillmightgetheadsseveraltimesinarow.Ithinkthisisjustaboutthesamething.Icouldgetlucky.”
1. WhatdoyouthinkofSlacker’sclaim?Isitpossibleforhimtoget8outof10questionsright?Explain.
Ithoughtaboutitforaminuteandsaid,“Slacker,Ithinkyou’reontosomething.I’mnotsurethatyouwillget80%onthetest,butIagreethatthesituationisjustlikeacoinflip.It’seitheronewayortheotherandtheyarebothequallylikelyifyou’rejustguessing.”MyideaistouseacoinfliptosimulatetheT/Ftestsituation.Wecantryitmanytimesandseehowoftenweget8outof10questionsright.I’mgoingtosaythatifthecoinlandsonheads,thenyouguessedtheproblemcorrectly.Ifitlandsontails,thenyougotitwrong.
2. Tryitafewtimesyourself.Tosavealittletime,justflip10coinsatonceandcountupthenumberofheadsforeachtest.
#Correct(Heads) #Incorrect(Tails) %Correct
Test1
CC
BY
Mar
co A
rmen
t
http
s://f
lic.k
r/p/
5MY
VT
6
40
SECONDARY MATH III // MODULE 9
STATISTICS – 9.7
Mathematics Vision Project Licensed under the Creative Commons Attribution CC BY 4.0 mathematicsvisionproject.org
Test2
Test3
Test4
Test5
Didyouget8outof10correctinanyofyourtrials?
3. Basedonyourtrials,doyouthinkSlackerhasagoodchanceofgetting80%correct?
4. Collectthedatafromtheentireclassanddisplayitusingtechnology.NowwhatdoyouthinkofSlacker’schancesofgetting80%correct?Explainwhy.
5. Whatwouldyouexpectthegraphtolooklikeifyoucontinuedtocollectsamples?Why?
6. Baseduponyourunderstandingofthisdistribution,whatwouldyouestimatethelikelihoodofSlackergetting80%onthetestwithoutstudying?
41
SECONDARY MATH III // MODULE 9
STATISTICS – 9.7
Mathematics Vision Project Licensed under the Creative Commons Attribution CC BY 4.0 mathematicsvisionproject.org
9.7
Needhelp?Visitwww.rsgsupport.org
READY Topic:Reviewinghistograms
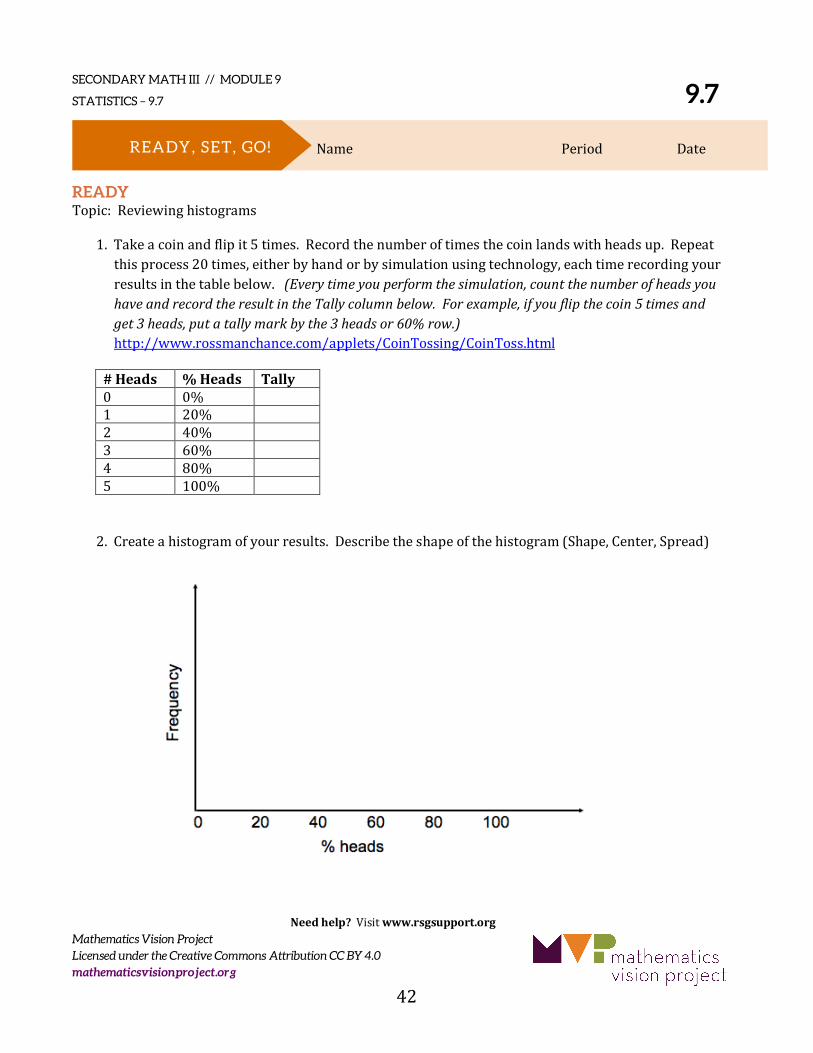
1.Takeacoinandflipit5times.Recordthenumberoftimesthecoinlandswithheadsup.Repeatthisprocess20times,eitherbyhandorbysimulationusingtechnology,eachtimerecordingyourresultsinthetablebelow.(Everytimeyouperformthesimulation,countthenumberofheadsyouhaveandrecordtheresultintheTallycolumnbelow.Forexample,ifyouflipthecoin5timesandget3heads,putatallymarkbythe3headsor60%row.)http://www.rossmanchance.com/applets/CoinTossing/CoinToss.html
2.Createahistogramofyourresults.Describetheshapeofthehistogram(Shape,Center,Spread)
#Heads %Heads Tally0 0% 1 20% 2 40% 3 60% 4 80% 5 100%
READY, SET, GO! Name PeriodDate
42
SECONDARY MATH III // MODULE 9
STATISTICS – 9.7
Mathematics Vision Project Licensed under the Creative Commons Attribution CC BY 4.0 mathematicsvisionproject.org
9.7
Needhelp?Visitwww.rsgsupport.org
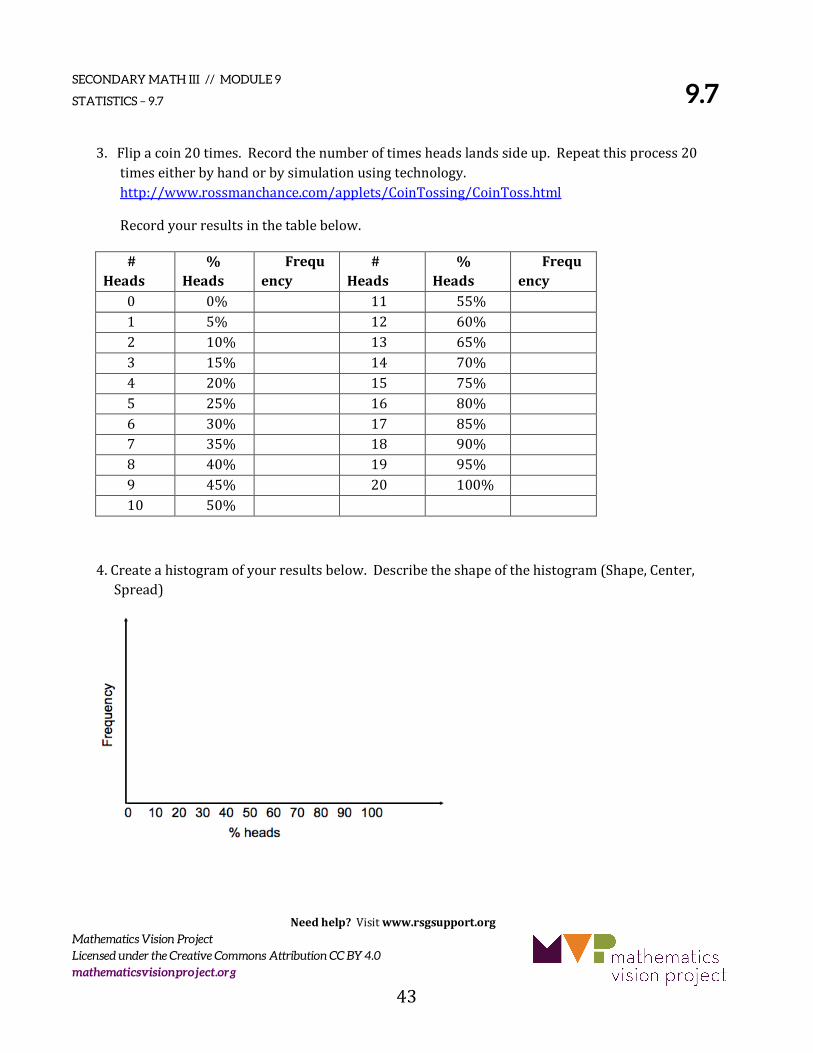
3.Flipacoin20times.Recordthenumberoftimesheadslandssideup.Repeatthisprocess20timeseitherbyhandorbysimulationusingtechnology.http://www.rossmanchance.com/applets/CoinTossing/CoinToss.html
Recordyourresultsinthetablebelow.
4.Createahistogramofyourresultsbelow.Describetheshapeofthehistogram(Shape,Center,Spread)
#Heads
%Heads
Frequency
#Heads
%Heads
Frequency
0 0% 11 55% 1 5% 12 60% 2 10% 13 65% 3 15% 14 70% 4 20% 15 75% 5 25% 16 80% 6 30% 17 85% 7 35% 18 90% 8 40% 19 95% 9 45% 20 100% 10 50%
43
SECONDARY MATH III // MODULE 9
STATISTICS – 9.7
Mathematics Vision Project Licensed under the Creative Commons Attribution CC BY 4.0 mathematicsvisionproject.org
9.7
Needhelp?Visitwww.rsgsupport.org
5.Comparetheshapecenterandspreadofeachdistribution.Whatdoyounotice?
6.Ifyourepeatedthisprocesswith500flipsinsteadof5or20,predictwhatwouldhappentotheshape,spread,andcenterofthenewhistogram.
SET Topic:Usingasimulation
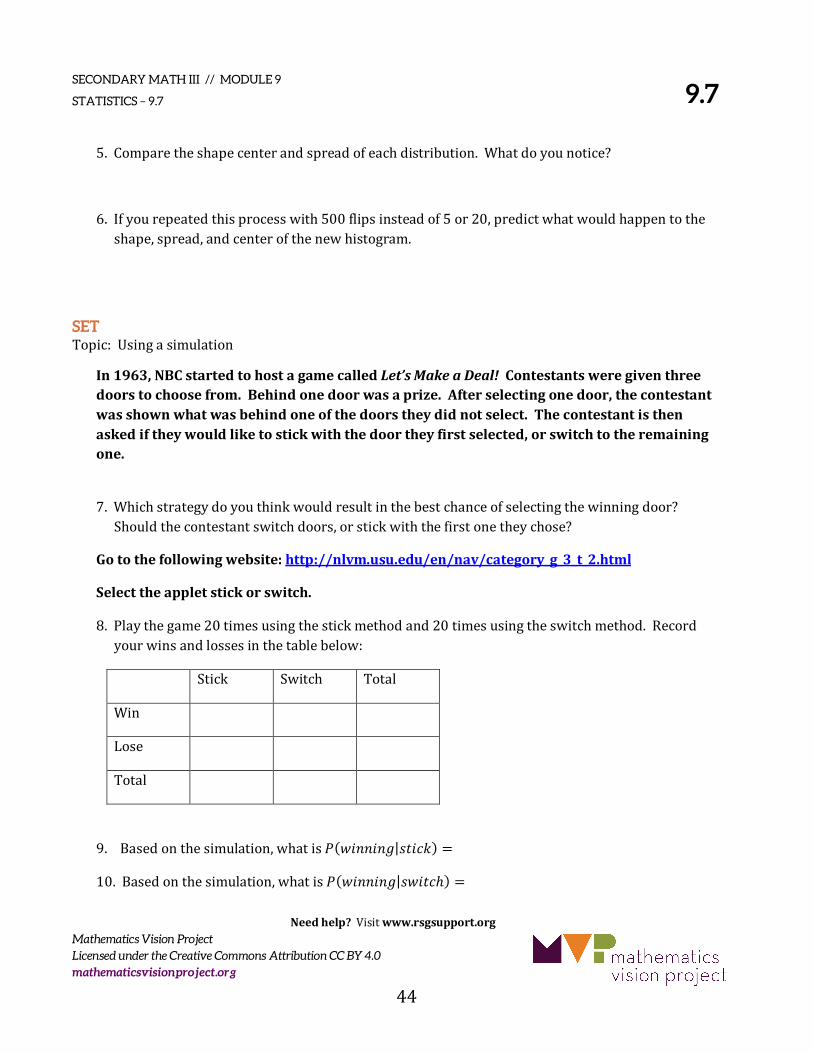
In1963,NBCstartedtohostagamecalledLet’sMakeaDeal!Contestantsweregiventhreedoorstochoosefrom.Behindonedoorwasaprize.Afterselectingonedoor,thecontestantwasshownwhatwasbehindoneofthedoorstheydidnotselect.Thecontestantisthenaskediftheywouldliketostickwiththedoortheyfirstselected,orswitchtotheremainingone.
7.Whichstrategydoyouthinkwouldresultinthebestchanceofselectingthewinningdoor?Shouldthecontestantswitchdoors,orstickwiththefirstonetheychose?
Gotothefollowingwebsite:http://nlvm.usu.edu/en/nav/category_g_3_t_2.html
Selecttheappletstickorswitch.
8.Playthegame20timesusingthestickmethodand20timesusingtheswitchmethod.Recordyourwinsandlossesinthetablebelow:
Stick Switch Total
Win
Lose
Total
9.Basedonthesimulation,whatis!(#$%%$%&|()$*+) =
10.Basedonthesimulation,whatis!(#$%%$%&|(#$)*ℎ) =
44
SECONDARY MATH III // MODULE 9
STATISTICS – 9.7
Mathematics Vision Project Licensed under the Creative Commons Attribution CC BY 4.0 mathematicsvisionproject.org
9.7
Needhelp?Visitwww.rsgsupport.org
11.Clickonthemultiplegamestab.Simulate100gamesforeachstrategy.Whatistheprobabilityofwinningusingeachmethod?
GO Topic:Reviewingprobability
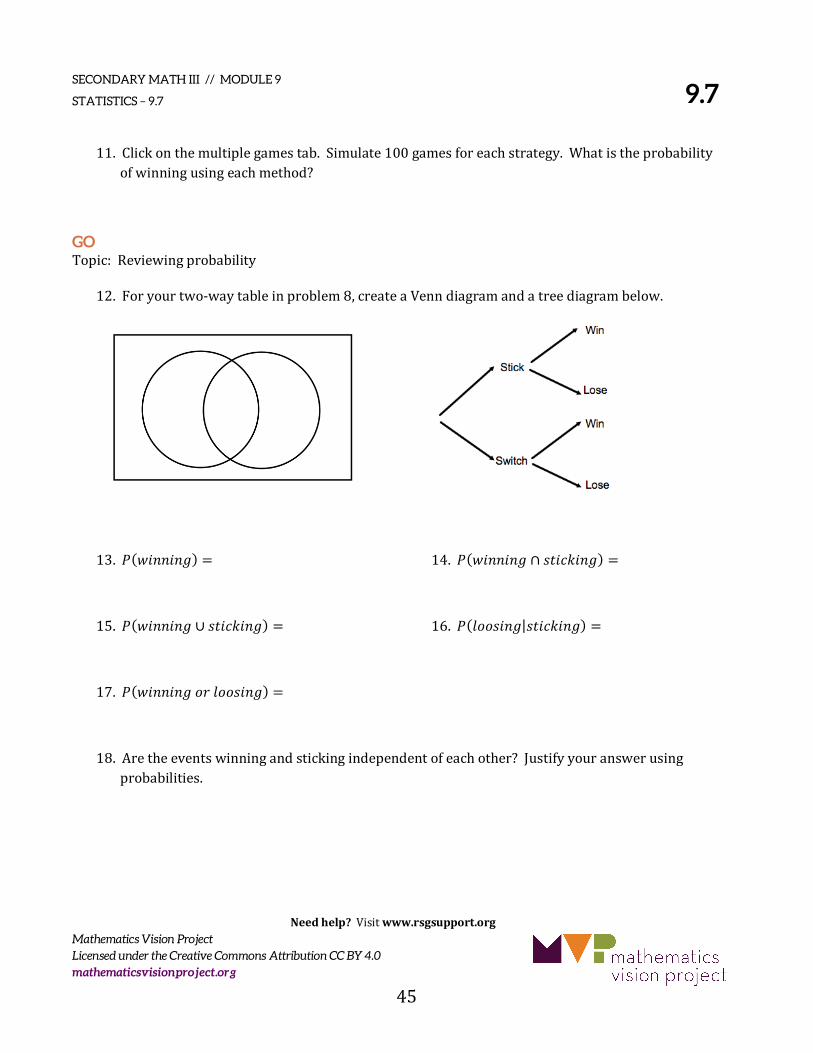
12.Foryourtwo-waytableinproblem8,createaVenndiagramandatreediagrambelow.
13.!(#$%%$%&) = 14.!(#$%%$%& ∩ ()$*+$%&) =
15.!(#$%%$%& ∪ ()$*+$%&) = 16.!(122($%&|()$*+$%&) =
17.!(#$%%$%&24122($%&) =
18.Aretheeventswinningandstickingindependentofeachother?Justifyyouranswerusingprobabilities.
45