Embed Size (px)
Citation preview
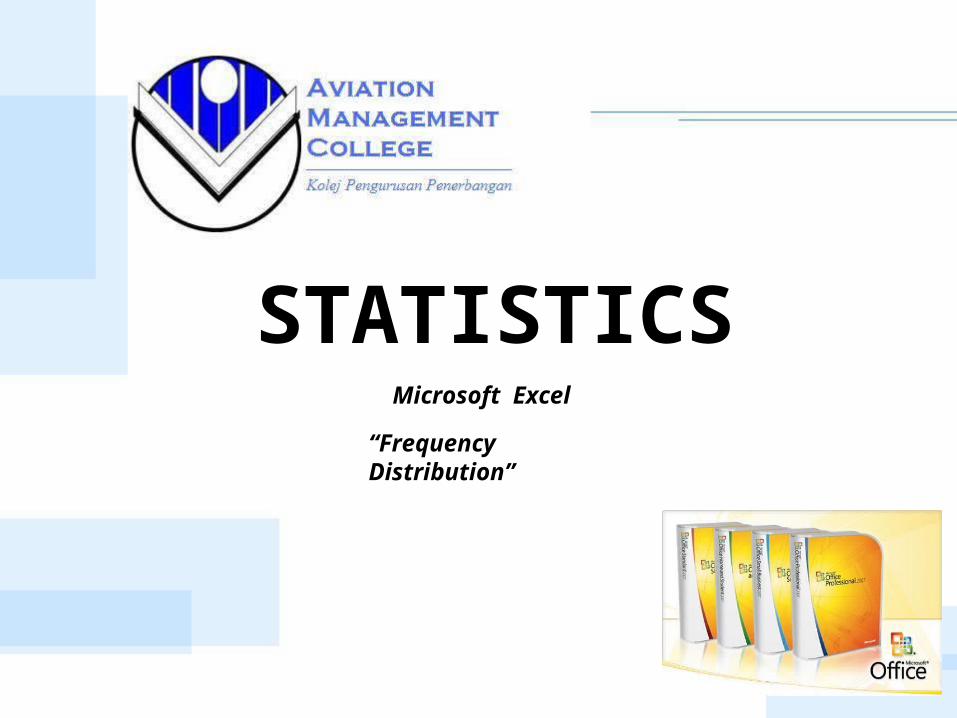
STATISTICSMicrosoft Excel
“Frequency Distribution”
Microsoft Office
• Microsoft Office is a commercial office suite desktop applications, servers and services for the Microsoft Windows and Mac OS X operating systems, introduced by Microsoft in 1989.
• Microsoft Office contained Microsoft Word, Microsoft Excel, and Microsoft PowerPoint.
• The current versions are Office 2010 for Windows, released on June 15, 2010; and Office 2011 for Mac OS X, released October 26, 2010.

Microsoft Office
Microsoft Excel
• Microsoft Excel is a commercial spreadsheet application written and distributed by Microsoft for Microsoft Windows and Mac OS X.
• It features calculation, graphing tools, pivot tables and a macro programming language called Visual Basic for Applications
• The current versions are 2010 for Windows and 2011 for Mac.
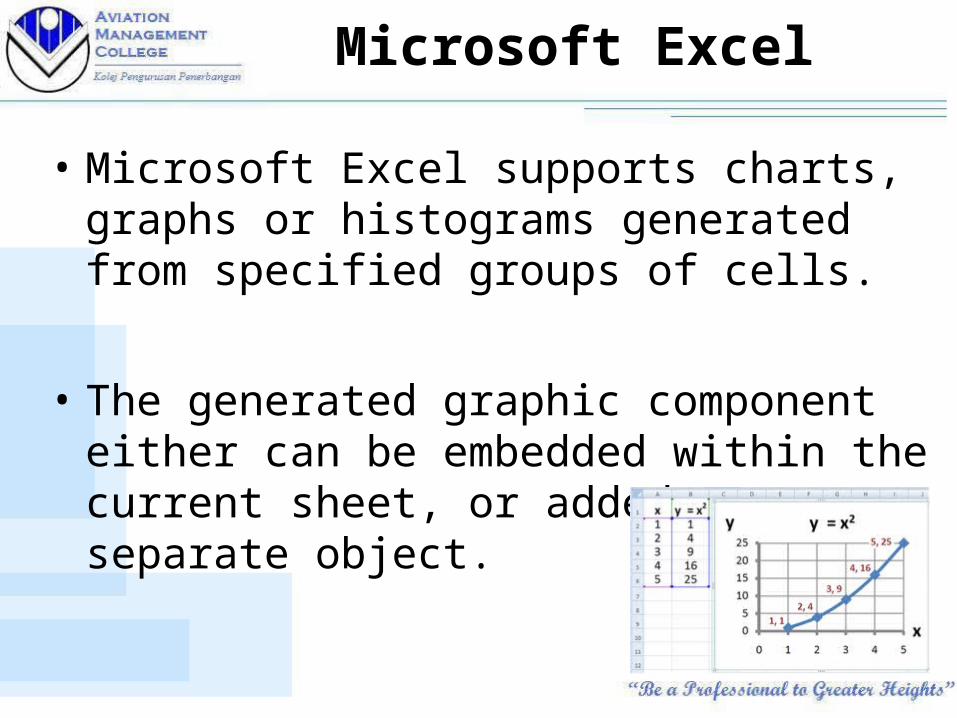
• Microsoft Excel supports charts, graphs or histograms generated from specified groups of cells.
• The generated graphic component either can be embedded within the current sheet, or added as a separate object.
Microsoft Excel
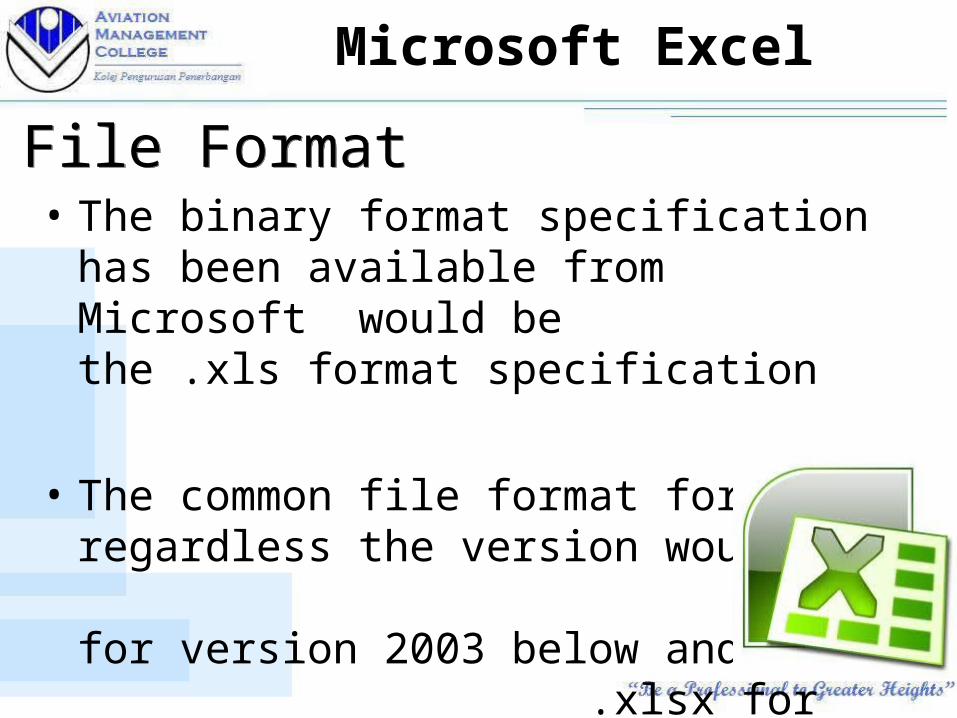
File FormatFile Format• The binary format specification has been
available from Microsoft would be the .xls format specification
• The common file format for excel regardless the version would be .xls for version 2003 below and .xlsx for 2007 above.
Microsoft Excel
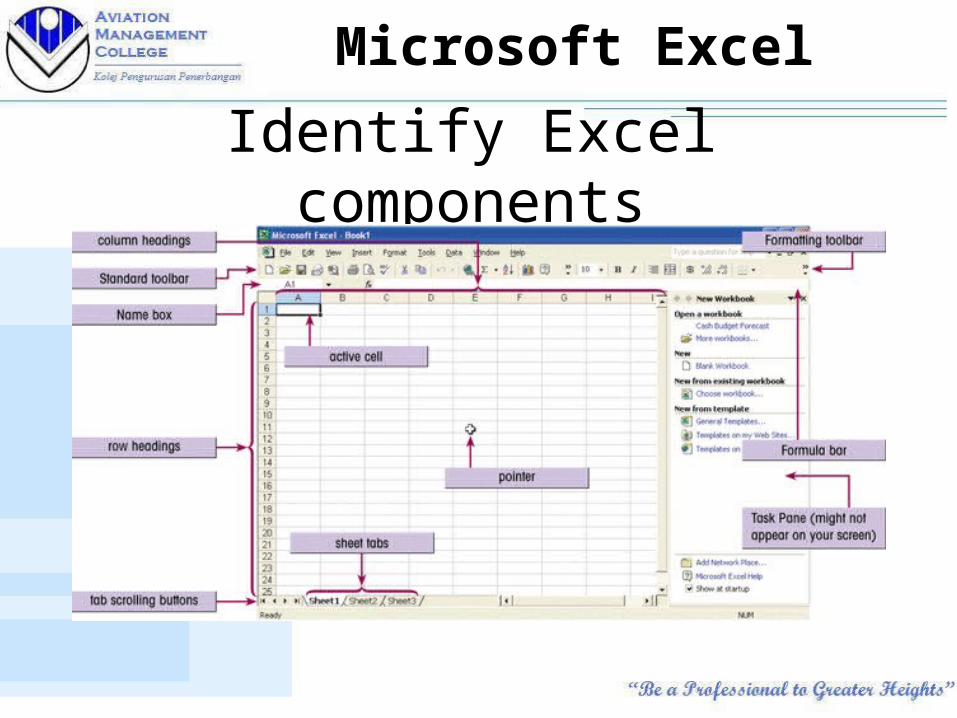
Identify Excel components
Microsoft Excel
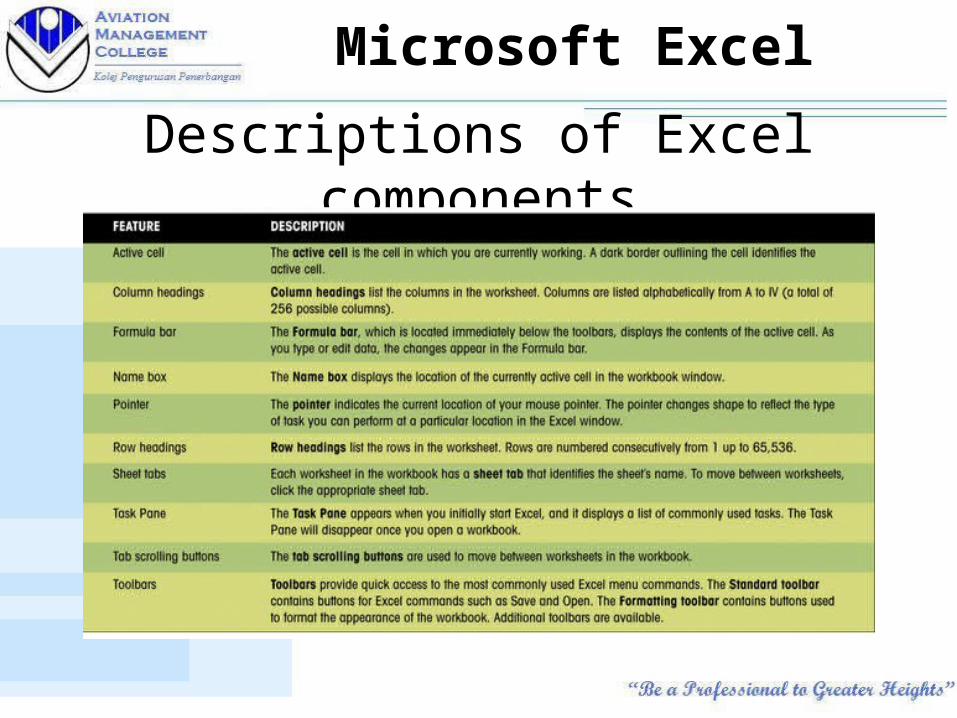
Descriptions of Excel components
Microsoft Excel
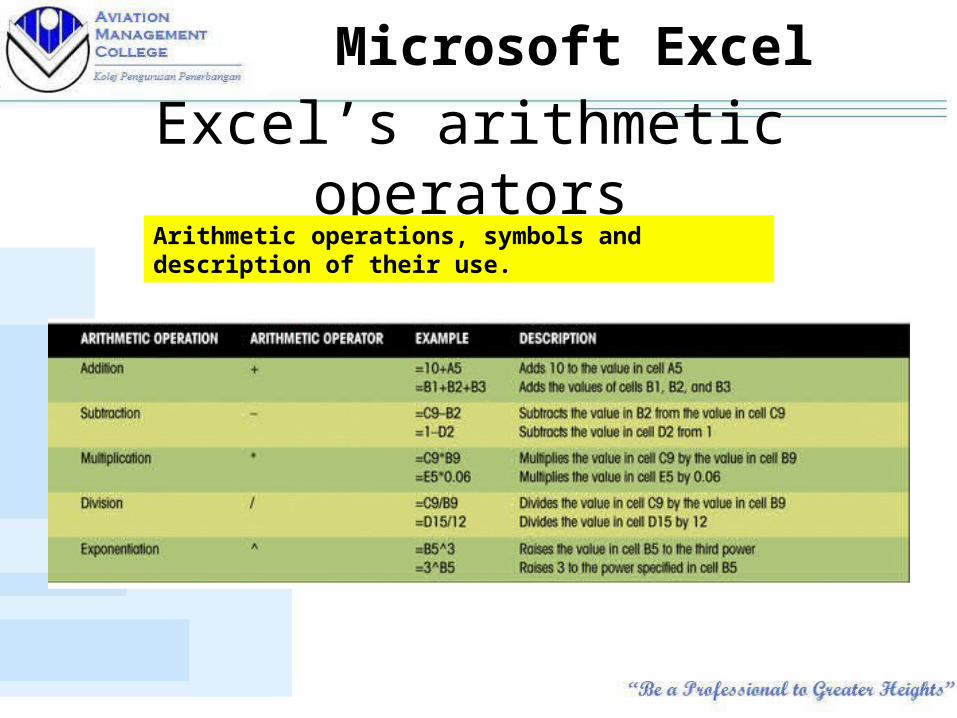
Excel’s arithmetic operatorsArithmetic operations, symbols and description of their use.
Microsoft Excel
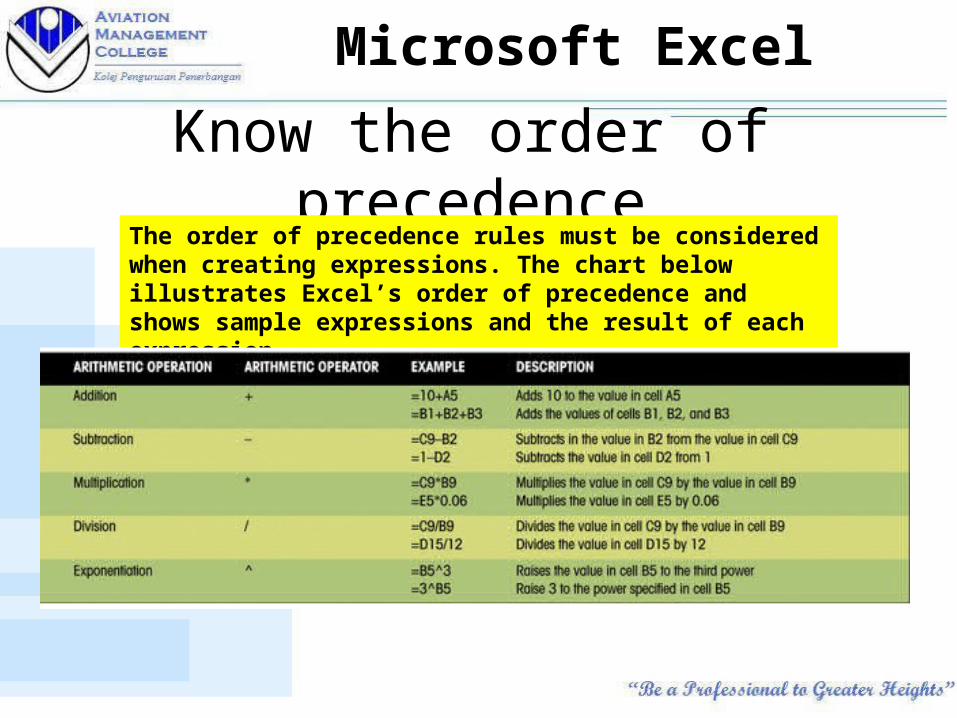
Know the order of precedenceThe order of precedence rules must be considered when creating expressions. The chart below illustrates Excel’s order of precedence and shows sample expressions and the result of each expression.
Microsoft Excel
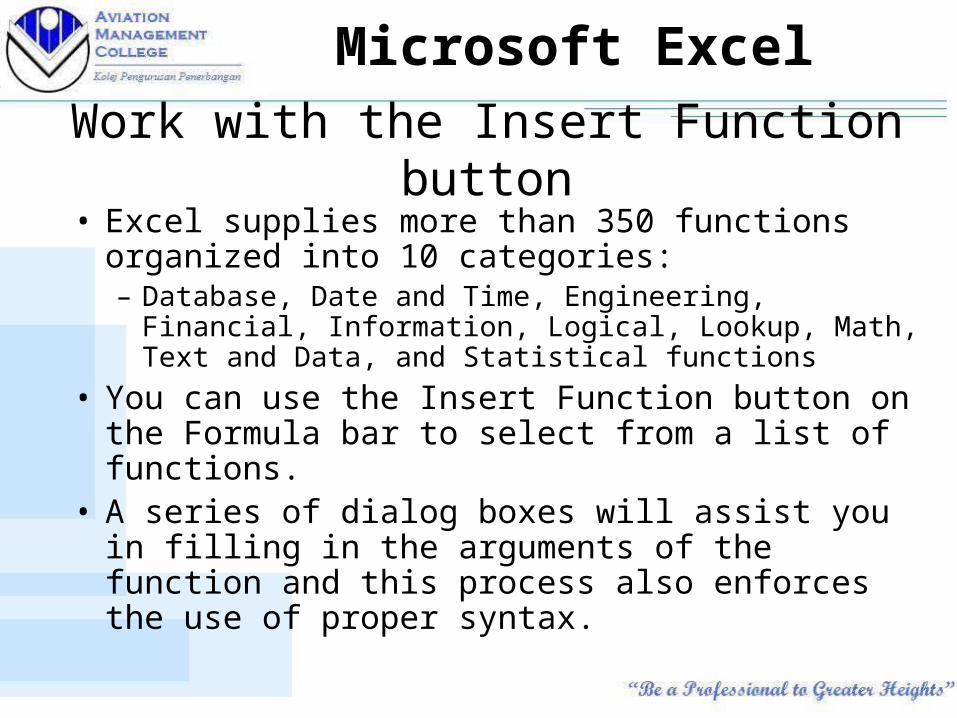
Work with the Insert Function button
• Excel supplies more than 350 functions organized into 10 categories:– Database, Date and Time, Engineering, Financial,
Information, Logical, Lookup, Math, Text and Data, and Statistical functions
• You can use the Insert Function button on the Formula bar to select from a list of functions.
• A series of dialog boxes will assist you in filling in the arguments of the function and this process also enforces the use of proper syntax.
Microsoft Excel
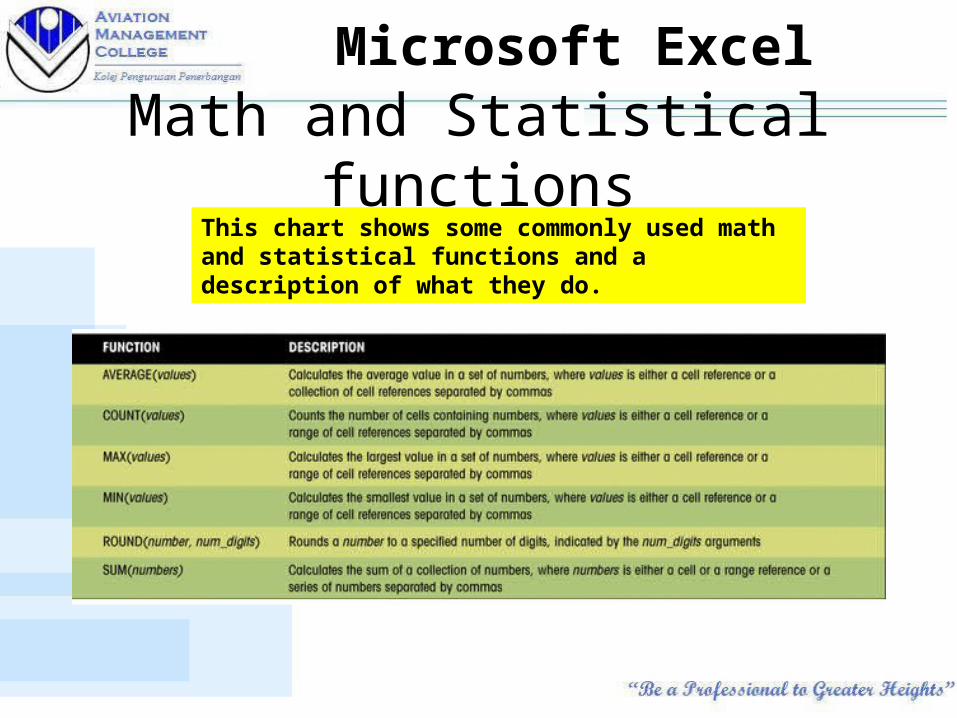
Math and Statistical functionsThis chart shows some commonly used math and statistical functions and a description of what they do.
Microsoft Excel
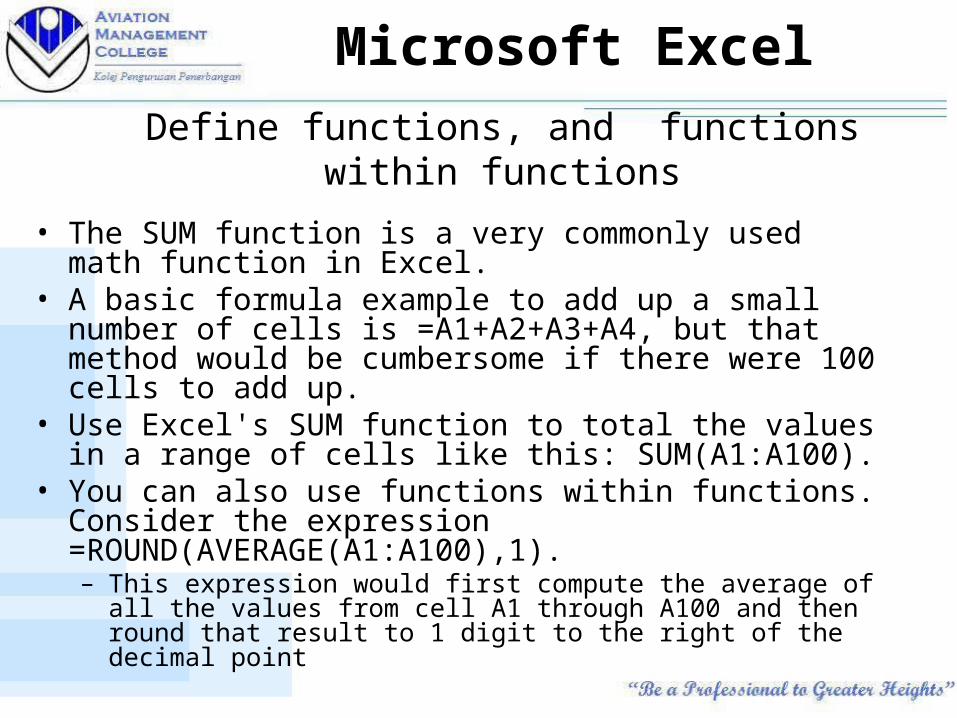
Define functions, and functions within functions
• The SUM function is a very commonly used math function in Excel.
• A basic formula example to add up a small number of cells is =A1+A2+A3+A4, but that method would be cumbersome if there were 100 cells to add up.
• Use Excel's SUM function to total the values in a range of cells like this: SUM(A1:A100).
• You can also use functions within functions. Consider the expression =ROUND(AVERAGE(A1:A100),1).– This expression would first compute the average of all the values
from cell A1 through A100 and then round that result to 1 digit to the right of the decimal point
Microsoft Excel
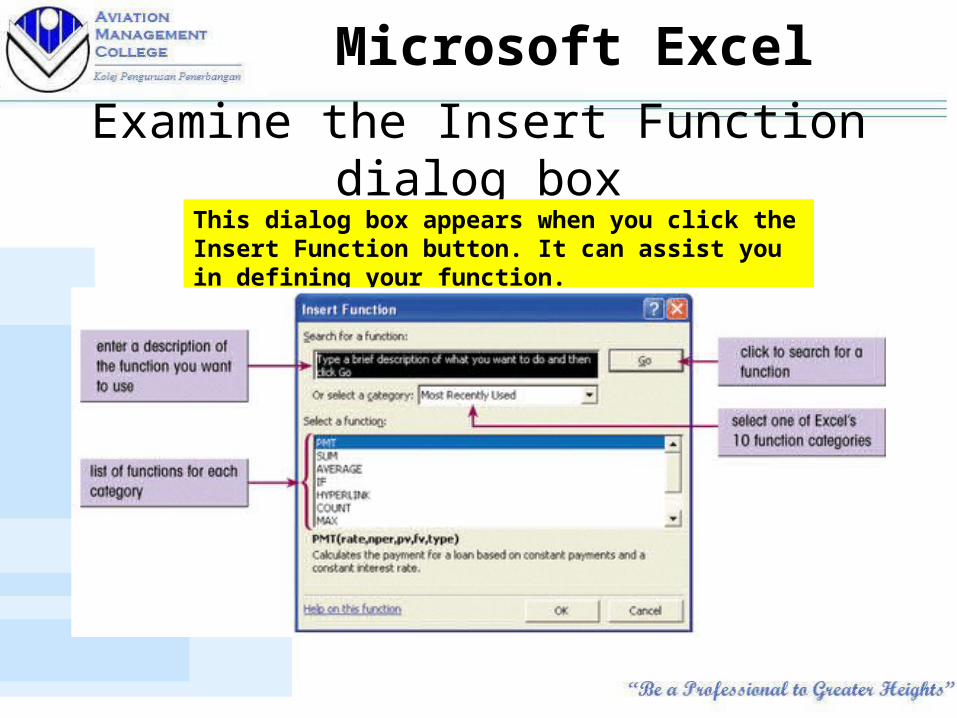
Examine the Insert Function dialog boxThis dialog box appears when you click the Insert Function button. It can assist you in defining your function.
Microsoft Excel
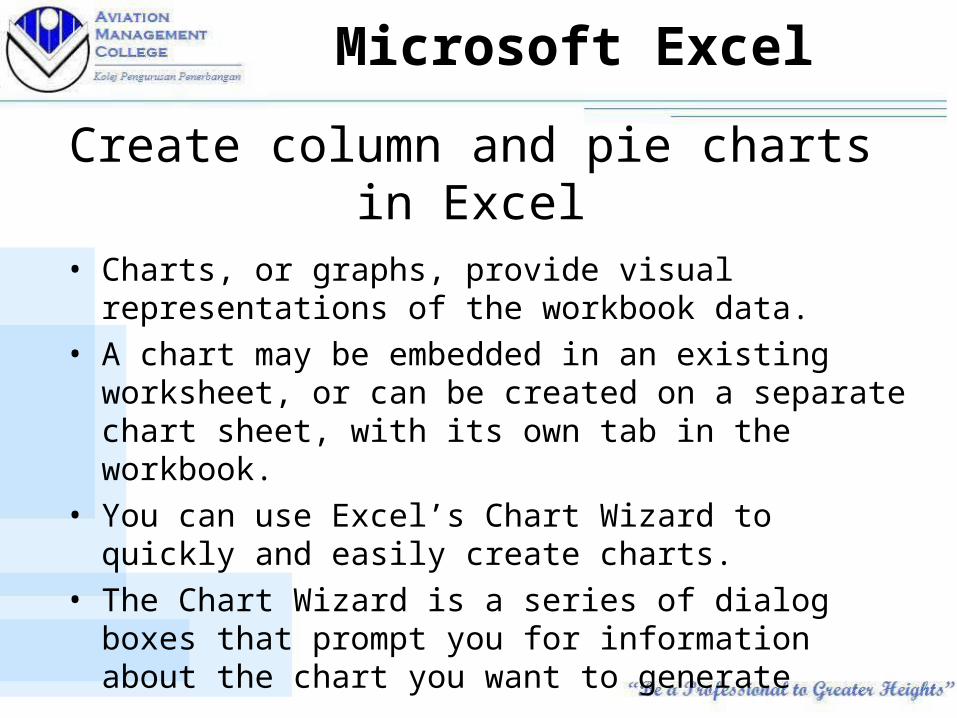
Create column and pie charts in Excel
• Charts, or graphs, provide visual representations of the workbook data.
• A chart may be embedded in an existing worksheet, or can be created on a separate chart sheet, with its own tab in the workbook.
• You can use Excel’s Chart Wizard to quickly and easily create charts.
• The Chart Wizard is a series of dialog boxes that prompt you for information about the chart you want to generate
Microsoft Excel
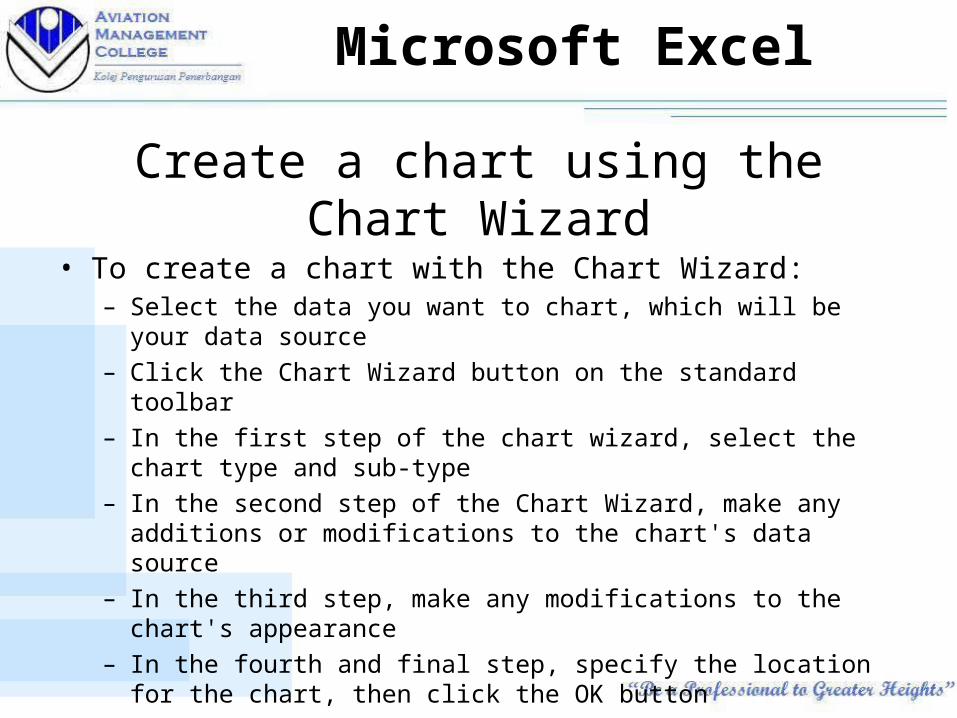
Create a chart using the Chart Wizard
• To create a chart with the Chart Wizard:– Select the data you want to chart, which will be your data source– Click the Chart Wizard button on the standard toolbar – In the first step of the chart wizard, select the chart type and sub-
type– In the second step of the Chart Wizard, make any additions or
modifications to the chart's data source – In the third step, make any modifications to the chart's
appearance– In the fourth and final step, specify the location for the chart,
then click the OK button
Microsoft Excel
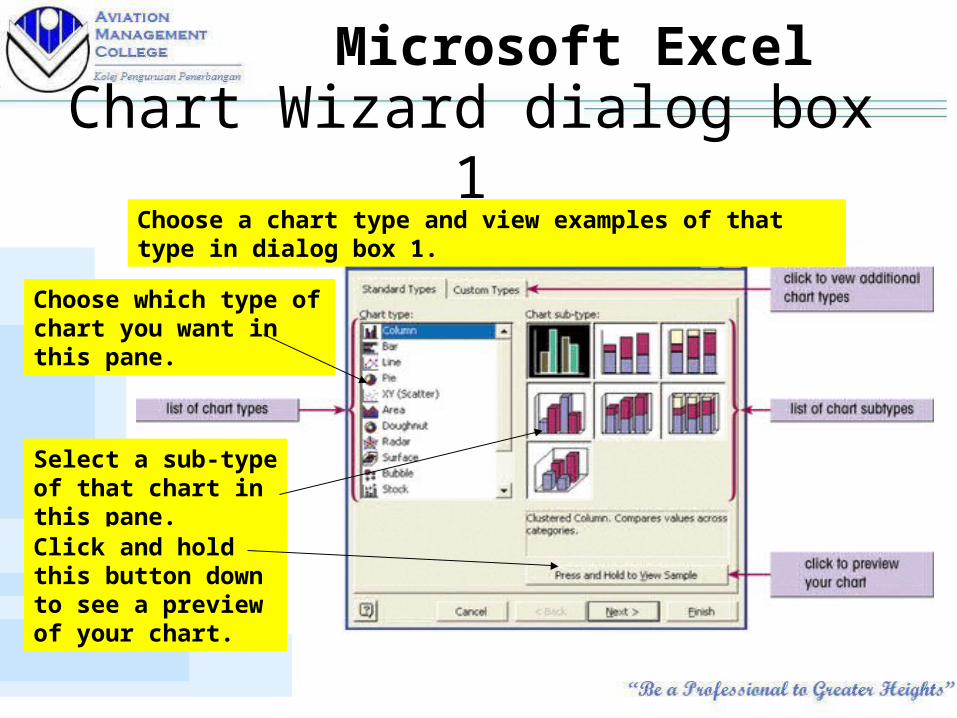
Chart Wizard dialog box 1Choose a chart type and view examples of that type in dialog box 1.
Choose which type of chart you want in this pane.
Select a sub-type of that chart in this pane.Click and hold this button down to see a preview of your chart.
Microsoft Excel
Choosing a data series• You can alter the data source during step 2 of the Chart
Wizard and also choose whether to organize the data source by rows or by columns.
• The data source is organized into a collection of data series. – A data series consists of data values, which are plotted on the
chart's vertical, or Y-axis – The data series’ category values, or X values, are on the
horizontal axis, called the X-axis
• A chart can have several data series all plotted against a common set of category values.
Microsoft Excel

Chart Wizard dialog box 2During the second step of the Chart Wizard, you specify the data to be displayedin the chart, which is also known as the chart's data source.
Specify the cell range and whether the data series is in rows or columns.
Microsoft Excel

Chart Wizard dialog box 2During the second step of the Chart Wizard, you specify the data to be displayedin the chart, which is also known as the chart's data source.
Specify the cell range and whether the data series is in rows or columns.
Microsoft Excel
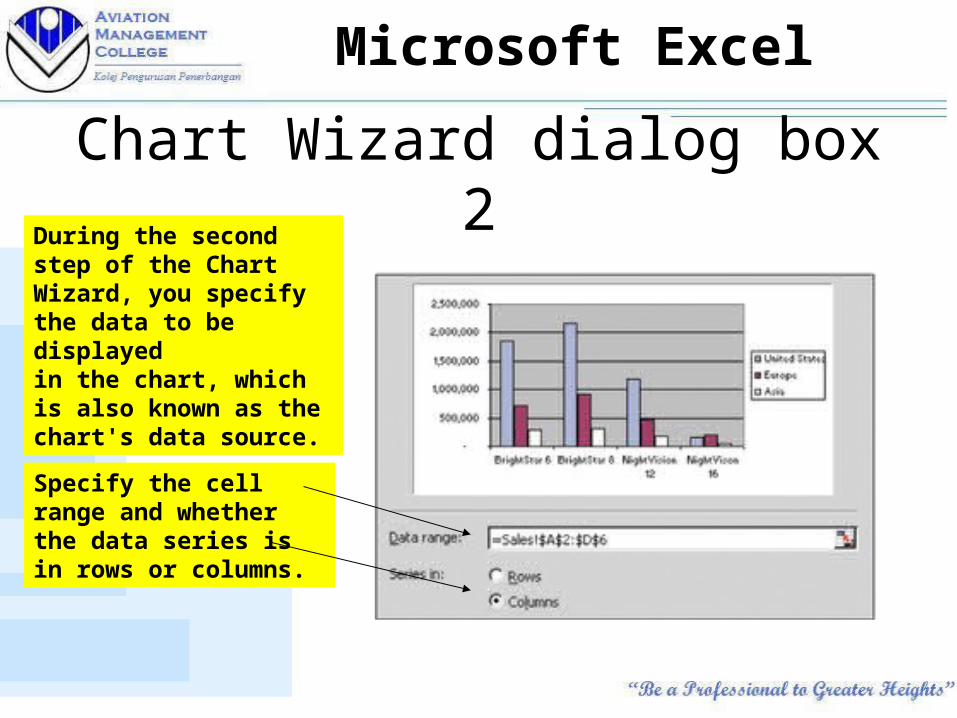
Chart Wizard dialog box 2During the second step of the Chart Wizard, you specify the data to be displayedin the chart, which is also known as the chart's data source.
Specify the cell range and whether the data series is in rows or columns.
Microsoft Excel

Chart Wizard dialog box 2During the second step of the Chart Wizard, you specify the data to be displayedin the chart, which is also known as the chart's data source.
Specify the cell range and whether the data series is in rows or columns.
Microsoft Excel