Embed Size (px)
Citation preview
STATISTICS OF HAWAII AGRICULTURE 2009
January 2011
A Partnership Between the
v Hawaii United States Department of Agriculture Department of Agriculture Agricultural Development Division National Agricultural Statistics Service

Hawaii Agricultural Statistics June 29, 2011
The unique history of agriculture in Hawai`i has had
a profound impact on every aspect of our lives today.
Many of our families and friends have deep roots in
local agriculture, which grew and shaped our
community and relationships in ways that are difficult
to quantify.
The work by the Hawai`i Field Office of the National
Agricultural Statistics Service provides a window into
the agricultural industry as it continues to play a role
in our economy and communities.
This publication provides accurate statistical measures
of the various commodities grown and the livestock
raised on the state’s 7,500 farms and ranches.
It also includes production estimates for our nursery and floriculture industries that are
important components of our agricultural industry.
We can all appreciate the statistics for its significance in quantifying the impact of
agriculture in our islands at this moment. However, the greater value of this body of work
is that it will allow us to look back on trends and developments of the past in order to more
accurately plan for our future.
E Malama Pono,
NEIL ABERCROMBIE
Governor, State of Hawai‘i
NEIL ABERCROMBIE Governor
RUSSELL S. KOKUBUN Chairperson, Board of Agriculture
JAMES J. NAKATANI
Deputy to the Chairperson
State of Hawaii DEPARTMENT OF AGRICULTURE
1428 South King Street Honolulu, Hawaii 96814-2512
Agriculture has long been an important part of Hawaii’s history and economy and continues to be so today. The composition of the agricultural sector continues to transform from sugar and pineapple production to diversified agricultural commodities led by the seed industry which accounts for 35 percent of the 2009 farm gate total. Figures in this publication show the total farm value to be $631.2 million which is the highest since the 1980 farm gate value of $634.1 million. In 1980, unprocessed sugarcane value jumped due to high prices caused by short world supplies as sugarcane accounted for $385 million or 61 percent of the total farm gate value. In the two preceding and two subsequent years to 1980, sugarcane accounted for an average of 46 percent. In contrast, sugarcane accounted for seven percent of the total farm gate value in 2009. Like all farmers throughout the nation, Hawaii’s 7,500 farmers and ranchers are a crucial but relatively small part of today’s complex global economy in which various businesses are mutually dependent. In order to prosper, agricultural producers must now work collaboratively to develop working coalitions and alliances with other organizations involved with the tourism industry, environmental stewardship, and the business community. This publication is a valuable resource to measure our progress and benchmark for future plans. Data contained in this publication also gauges our department’s mission statement; To re-establish agriculture as essential to the well-being of our island society by rejuvenating the economy, protecting important resources, and gaining greater self-sufficiency in food production and alternative energy development. The Statistics of Hawaii Agriculture publication also provides the hard data that describes the importance and impact made by our agricultural producers, their families, and production-level agriculture to our communities and our economy. But that only shows a portion of the complete picture. The latest available study estimates that when you enhance the value of many of our commodities along with the related business activities generated because of agriculture, the impact of agriculture increased to $1.9 billion. Hawaii would not be Hawaii without agriculture. I want to thank all of you who have taken time to provide the data that made the 2009 Statistics of Hawaii Agriculture possible.
Russell S. Kokubun Chairperson, Board of Agriculture
1428 South King Street ◇ Honolulu, HI 96814-2512 ◇ TEL: (808) 973-9588 ◇ FAX: (808) 973-2909
USDA, NASS, HAWAII FIELD OFFICE “Fact Finders for Hawaii Agriculture”
United States Department of Agriculture - National Agricultural Statistics Service
In cooperation with Hawaii Department of Agriculture - Agricultural Development Division
MESSAGE FROM THE STATE DIRECTOR
Producers are the primary information source for this publication. We appreciate the cooperation they extend when we contact them for information. Also, we are aware and sensitive to the frequent contacts made to Hawaii producers. Many options are available for producers to respond including responding by mail, facsimile, the Internet (for certain selected surveys), by phone, and personal interviews. The vast majority of producers understand that farmers and ranchers are the most knowledgeable source, often the only source, for the information required to meet specific data needs and publication results. We truly appreciate and thank all the agricultural producers and organizations who have so willingly and faithfully provided survey information. Supplemental information is provided by grower organizations and agribusiness firms. Without their vital cooperation and support on the many surveys conducted throughout the year, these reports would not be possible. A very important component of our data collection efforts is performed by our National Association of State Department of Agriculture (NASDA) enumerators. Their efforts are very worthy of special recognition for their important and significant contributions. The direct value of this data is not always transparent to the producer, but reliable numbers are needed for business and policy decisions. The uses of this information are many, but often the data is needed for developing marketing strategies, obtaining farm loans, writing business plans, testifying before local or state governing bodies, justifying claims for disaster relief, and evaluating and developing risk aversion plans. Results of the first ever 2009 On-Farm Energy Production and Organic Production surveys were released last year. These studies provided additional detailed breakouts based on Census of Agriculture information. Agricultural operations that indicated organic production and/or informed the Census of Agriculture form that they produced their own renewable energy on their farm or ranch were included in these studies. Our website, http://www.nass.usda.gov/Statistics_by_State/Hawaii/index.asp, contains all the data published by our office including the 2007 Census of Agriculture results and other Census of Agriculture follow-on surveys previously mentioned. This site contains this publication in electronic format along with other numerous commodity releases issued throughout the year.
Thank you, Mark E. Hudson Director, USDA NASS Hawaii Field Office
TABLE OF CONTENTS
GENERAL Agricultural summary ................................ 2
Agriculture’s contributions to Hawaii’s economy 2005 ......................................... 17
Cooperative Extension Service County Offices/USDA Farm Service Agencies .... 94
Definition of terms ..................................... 89
Directory for information ............................ 91
Diversified agriculture ranking ................... 7
Farm financial indicators ........................... 18
Food expenditures .................................... 14
Industry associations ................................. 95-96
List of publications ..................................... 92
Major agricultural areas (Maps) ................ 5-6
Photography acknowledgments ................ 97
Record highs and lows .............................. 15-16
Sampling methods and estimation ............ 90
State field offices ....................................... 93
CROPS Acreage in crop and total farm acreage .... 8
Number of farms ....................................... 9
Value of sales ............................................ 11-12
Sugar and Specialty Crops
Highlights ................................................. 19
Coffee ...................................................... 20
Floriculture and nursery products ........... 26-36
Ginger root .............................................. 21
Herbs ....................................................... 22
Macadamia nuts ...................................... 25
Seed crops .............................................. 22
Sugarcane and sugar .............................. 23-24
Fruits
Highlights ................................................. 37
Avocados ................................................. 42
Bananas .................................................. 42
Guavas .................................................... 45
Papayas .................................................. 43-44
Pineapples............................................... 41
Tropical specialty fruit ............................. 39-40
Vegetables, Melon, and Taro
Highlights ................................................. 46
Beans, snap ............................................ 49
Cabbage, Chinese .................................. 50
Cabbage, head ........................................ 51
Celery ...................................................... 52
Corn, sweet ............................................. 53
Cucumbers ............................................... 54
Eggplant ................................................... 55
Lettuces ................................................... 56
Onions, dry ............................................... 57
Onions, green .......................................... 58
Peppers, green ........................................ 59
Potatoes, sweet ....................................... 60
Romaine ................................................... 61
Squash, Italian ......................................... 62
Taro .......................................................... 63
Tomatoes ................................................. 64
Watercress ............................................... 65
Watermelons ............................................ 65
Other vegetables...................................... 66
Market Supply
Fruits ........................................................ 38
Vegetables ............................................... 47-48
LIVESTOCK Number of farms ........................................ 10
Value of sales ............................................ 13
Livestock
Highlights ................................................. 67-68
Aquaculture .............................................. 82
Cattle and calves ..................................... 69-72
Dairy ......................................................... 73-74
Equine ...................................................... 81
Goats ....................................................... 81
Honey and beeswax ................................ 81
Hogs and pigs .......................................... 75-77
Sheep and lambs ..................................... 81
Poultry and Eggs
Highlights ................................................. 78
Chickens .................................................. 78
Eggs ......................................................... 79-80
MISCELLANEOUS STATISTICS Agricultural exports .................................... 88
Agricultural theft and/or vandalism ............ 87
Ag-tourism .................................................. 85-86
Agricultural Employment
Wage rates ............................................... 84
Workers on farms..................................... 83
Climatology
Rainfall data ............................................. 4
Weather review ........................................ 3
1 Statistics of Hawaii Agriculture
HAWAII AGRICULTURE 2009
2009 Farm Revenues up 4 Percent from Previous Year
Farm gate revenues for 2009 totaled $631.2 million compared to the revised 2008 level of $605.6 million. Compared to the previous year, 10 of the 20 top ranked commodities were higher including seed crops, coffee, cattle, algae, bananas, eggs, milk, basil, sweet potatoes, and head cabbage. The value of individually published diversified commodities rose 8 percent including a 26 percent increase for seed crops. The $222.6 million seed revenue is a new record high as seed companies continue to expand their Hawaii based operations in response to continued demand for ethanol production. Farm gate value for cattle and calves rose 19 percent due to higher marketings in 2009. Fruit farm gate revenues rose 7 percent. Published vegetables and melons rose 2 percent, egg farm gate value rose 1 percent, and milk farm revenue rose by 37 percent which is attributed to higher milk production and price. Information for some agricultural commodities is suppressed to prevent disclosing individual operation information, but is included in the total revenue number. Revenue declines include flowers and nursery products which fell 15 percent from the previous
year and 26 percent from the record $108.7 million set in 2007. Growers commented on continued slower business due to the sluggish economy, crop losses attributed to volcanic emissions, and drought as contributing factors that caused this decline. Sixteen percent less macadamia nut production was the contributing factor for the 12 percent revenue decline. This was offset by a 3.0 cents per pound higher wet-in-shell farm price. Coffee farm gate value was up 6 percent due to higher prices. The equivalent farm value of sugarcane (this does not include the processed value of raw sugar) was set at $44.2 million, unchanged from 2008. Farm level values shown in this publication are an important measure of production agriculture, but they do not truly reflect the total contribution of agriculture to the State and county economies. For the better understanding of the overall picture, refer to “Agriculture’s Contribution to Hawaii’s Economy 2005” - (CTAHR Economic Issue EI 13, Jan 2008) a publication prepared jointly by the College of Tropical Agriculture and Human Resources, University of Hawaii at Manoa, and the Hawaii State Department of Agriculture.
Statistics of Hawaii Agriculture 2

2009 CROP WEATHER REVIEW
State Continues to Face Persisting Drought Conditions
January - March Extreme drought conditions continued into the new year with 78.88 percent of the State under abnormally dry or worse drought classifications in the first week of January. The leeward areas of the southern islands in Hawaii and Maui Counties were the most heavily impacted areas. Southeastern areas of Honolulu County were also affected by lack of rain. As the quarter progressed, drought conditions let up slowly with windward facing shores no longer suffering from drought conditions by the end of the quarter. Periods of heavy rains in many areas brought rainfall gauges to near normal average totals, if not greater. This included the Mountain View location on Hawaii County that received 27.1 inches of rain in March, compared to a normal average of 19.6 inches. Other less fortunate areas did not receive anything near average totals. One such area included North Kohala of Hawaii County which remained the most severely affected and the only area in the State facing extreme drought.
April - June Weather in the second quarter started well. The extreme drought in the North Kohala region was downgraded to severe drought only a few weeks into the quarter. Hawaii County was the beneficiary of continued rains, which kept rainfall totals near averages. During April, the Kahuku rain gauge on Honolulu County surpassed its average monthly total. However, as the quarter continued, dry conditions slowly crept up the island chain. The leeward side of Honolulu County fell into abnormally dry conditions, followed by Kauai County. Eventually, abnormally dry conditions worsened to moderate in many areas, while windward coasts were classified as abnormally dry statewide.
July - September Rainfall during the summer waned from decent totals that had come early to mid-year. During the first week of the third quarter, the North Kohala area was again classified under extreme drought. The State was fortunate to receive rain from the remnant of Hurricane Felicia that gave some areas a
good amount of rainfall. Mid-quarter, northern counties and windward areas of the State were in generally good condition. October – December The end of the year resulted in contrasting weather conditions. Drier leeward areas continued to remain dry and intensify in drought severity. The South Kohala region of Hawaii County was also classified under extreme drought conditions. However, traditionally rainy areas such as Hana in Maui County received exceptional amounts of rain. During the month of November, Hana received 163 percent of its normal total. By the year’s end, South Kohala conditions improved as did conditions on all windward areas. The State ended the year with 68.88 percent of the State classified as abnormally dry or worse, 10 percent improved from the beginning of the year. Underscoring this improvement, on Sunday, December 20th, a record daily maximum of rainfall was set in Hilo, Hawaii County with 7.92 inches being recorded. This more than doubled the previous record of 3.27 inches that was set in 1971.
Source: National Weather Service, National Drought Mitigation Center, and Farm Service Agency.
3 Statistics of Hawaii Agriculture
WEATHER
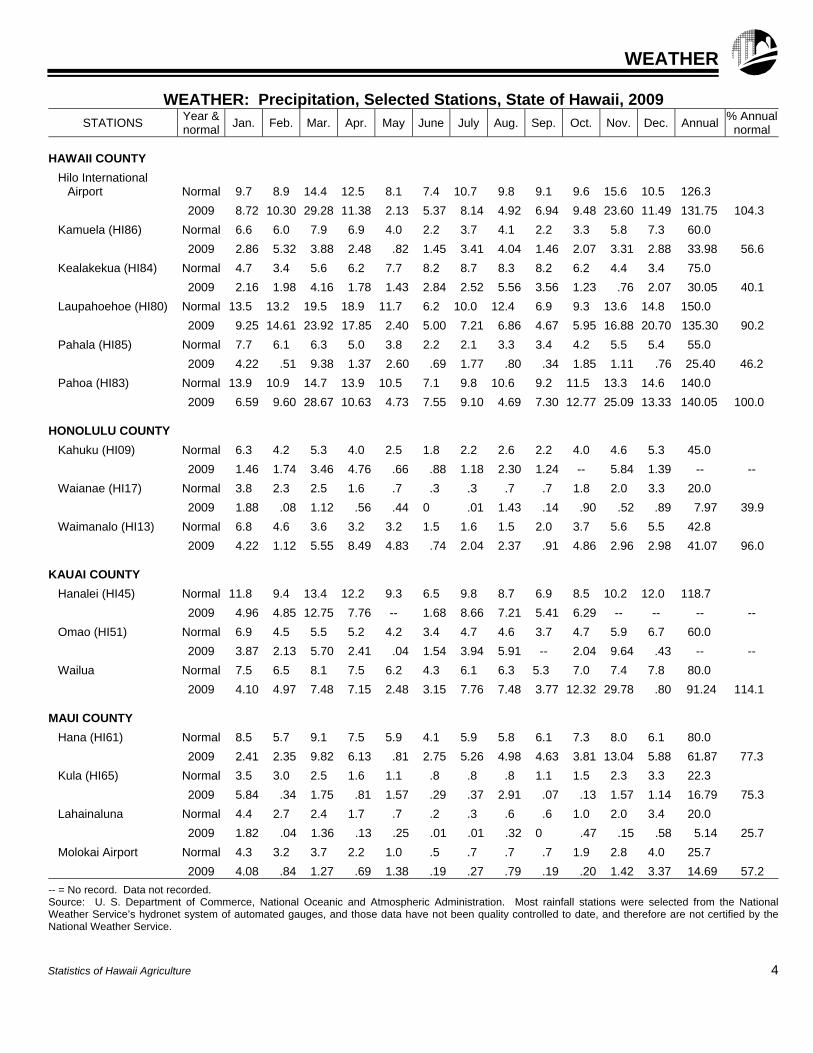
WEATHER: Precipitation, Selected Stations, State of Hawaii, 2009 STATIONS
Year & normal
Jan. Feb. Mar. Apr. May June July Aug. Sep. Oct. Nov. Dec. Annual% Annual
normal
HAWAII COUNTY
Hilo International Airport Normal 9.7 8.9 14.4 12.5 8.1 7.4 10.7 9.8 9.1 9.6 15.6 10.5 126.3
2009 8.72 10.30 29.28 11.38 2.13 5.37 8.14 4.92 6.94 9.48 23.60 11.49 131.75 104.3
Kamuela (HI86) Normal 6.6 6.0 7.9 6.9 4.0 2.2 3.7 4.1 2.2 3.3 5.8 7.3 60.0
2009 2.86 5.32 3.88 2.48 .82 1.45 3.41 4.04 1.46 2.07 3.31 2.88 33.98 56.6
Kealakekua (HI84) Normal 4.7 3.4 5.6 6.2 7.7 8.2 8.7 8.3 8.2 6.2 4.4 3.4 75.0
2009 2.16 1.98 4.16 1.78 1.43 2.84 2.52 5.56 3.56 1.23 .76 2.07 30.05 40.1
Laupahoehoe (HI80) Normal 13.5 13.2 19.5 18.9 11.7 6.2 10.0 12.4 6.9 9.3 13.6 14.8 150.0
2009 9.25 14.61 23.92 17.85 2.40 5.00 7.21 6.86 4.67 5.95 16.88 20.70 135.30 90.2
Pahala (HI85) Normal 7.7 6.1 6.3 5.0 3.8 2.2 2.1 3.3 3.4 4.2 5.5 5.4 55.0
2009 4.22 .51 9.38 1.37 2.60 .69 1.77 .80 .34 1.85 1.11 .76 25.40 46.2
Pahoa (HI83) Normal 13.9 10.9 14.7 13.9 10.5 7.1 9.8 10.6 9.2 11.5 13.3 14.6 140.0
2009 6.59 9.60 28.67 10.63 4.73 7.55 9.10 4.69 7.30 12.77 25.09 13.33 140.05 100.0
HONOLULU COUNTY
Kahuku (HI09) Normal 6.3 4.2 5.3 4.0 2.5 1.8 2.2 2.6 2.2 4.0 4.6 5.3 45.0
2009 1.46 1.74 3.46 4.76 .66 .88 1.18 2.30 1.24 -- 5.84 1.39 -- --
Waianae (HI17) Normal 3.8 2.3 2.5 1.6 .7 .3 .3 .7 .7 1.8 2.0 3.3 20.0
2009 1.88 .08 1.12 .56 .44 0 .01 1.43 .14 .90 .52 .89 7.97 39.9
Waimanalo (HI13) Normal 6.8 4.6 3.6 3.2 3.2 1.5 1.6 1.5 2.0 3.7 5.6 5.5 42.8
2009 4.22 1.12 5.55 8.49 4.83 .74 2.04 2.37 .91 4.86 2.96 2.98 41.07 96.0
KAUAI COUNTY
Hanalei (HI45) Normal 11.8 9.4 13.4 12.2 9.3 6.5 9.8 8.7 6.9 8.5 10.2 12.0 118.7
2009 4.96 4.85 12.75 7.76 -- 1.68 8.66 7.21 5.41 6.29 -- -- -- --
Omao (HI51) Normal 6.9 4.5 5.5 5.2 4.2 3.4 4.7 4.6 3.7 4.7 5.9 6.7 60.0
2009 3.87 2.13 5.70 2.41 .04 1.54 3.94 5.91 -- 2.04 9.64 .43 -- --
Wailua Normal 7.5 6.5 8.1 7.5 6.2 4.3 6.1 6.3 5.3 7.0 7.4 7.8 80.0
2009 4.10 4.97 7.48 7.15 2.48 3.15 7.76 7.48 3.77 12.32 29.78 .80 91.24 114.1
MAUI COUNTY
Hana (HI61) Normal 8.5 5.7 9.1 7.5 5.9 4.1 5.9 5.8 6.1 7.3 8.0 6.1 80.0
2009 2.41 2.35 9.82 6.13 .81 2.75 5.26 4.98 4.63 3.81 13.04 5.88 61.87 77.3
Kula (HI65) Normal 3.5 3.0 2.5 1.6 1.1 .8 .8 .8 1.1 1.5 2.3 3.3 22.3
2009 5.84 .34 1.75 .81 1.57 .29 .37 2.91 .07 .13 1.57 1.14 16.79 75.3
Lahainaluna Normal 4.4 2.7 2.4 1.7 .7 .2 .3 .6 .6 1.0 2.0 3.4 20.0
2009 1.82 .04 1.36 .13 .25 .01 .01 .32 0 .47 .15 .58 5.14 25.7
Molokai Airport Normal 4.3 3.2 3.7 2.2 1.0 .5 .7 .7 .7 1.9 2.8 4.0 25.7
2009 4.08 .84 1.27 .69 1.38 .19 .27 .79 .19 .20 1.42 3.37 14.69 57.2
-- = No record. Data not recorded. Source: U. S. Department of Commerce, National Oceanic and Atmospheric Administration. Most rainfall stations were selected from the NationalWeather Service’s hydronet system of automated gauges, and those data have not been quality controlled to date, and therefore are not certified by the National Weather Service.
Statistics of Hawaii Agriculture 4
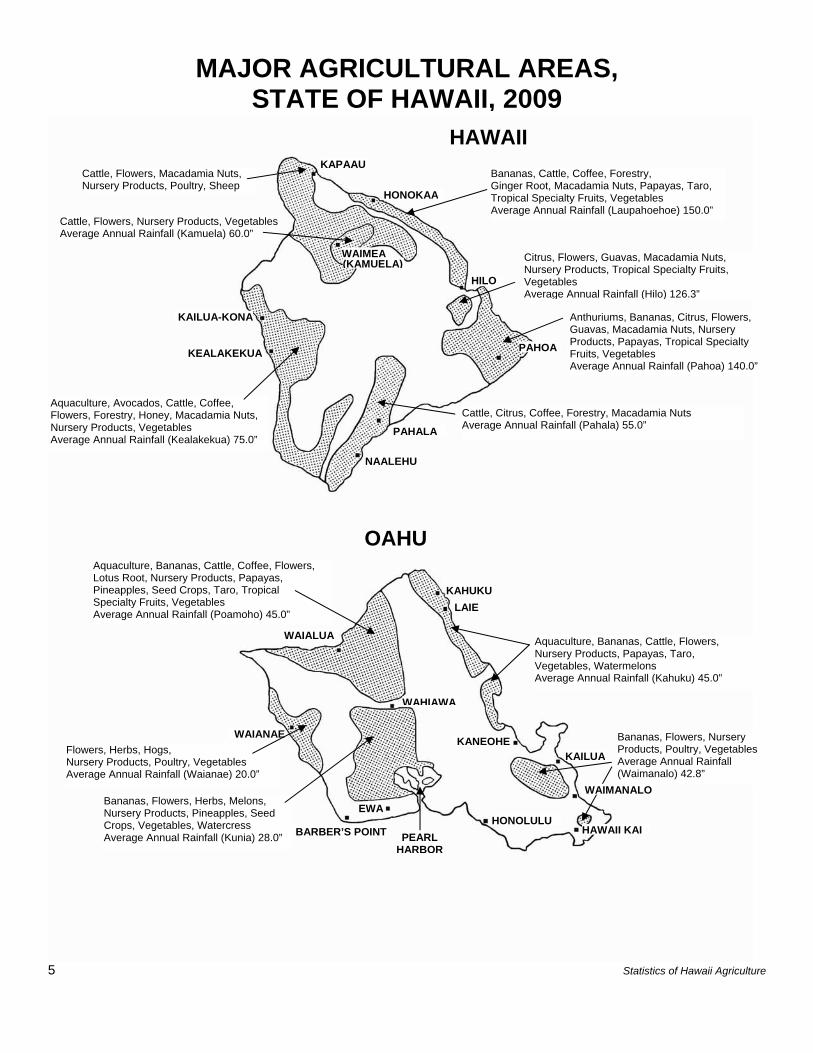
MAJOR AGRICULTURAL AREAS, STATE OF HAWAII, 2009
Cattle, Flowers, Macadamia Nuts, Nursery Products, Poultry, Sheep
Cattle, Flowers, Nursery Products, Vegetables Average Annual Rainfall (Kamuela) 60.0”
Aquaculture, Avocados, Cattle, Coffee, Flowers, Forestry, Honey, Macadamia Nuts, Nursery Products, Vegetables Average Annual Rainfall (Kealakekua) 75.0”
KAPAAU
HONOKAA
WAIMEA
HILO
PAHOA
NAALEHU
KAILUA-KONA
KEALAKEKUA
KAHUKU
LAIE
WAIALUA
WAIANAEKANEOHE
HAWAII KAI BARBER’S POINT
EWA
WAHIAWA
HONOLULU
Anthuriums, Bananas, Citrus, Flowers, Guavas, Macadamia Nuts, Nursery Products, Papayas, Tropical Specialty Fruits, Vegetables Average Annual Rainfall (Pahoa) 140.0”
Bananas, Cattle, Coffee, Forestry, Ginger Root, Macadamia Nuts, Papayas, Taro, Tropical Specialty Fruits, Vegetables Average Annual Rainfall (Laupahoehoe) 150.0”
Cattle, Citrus, Coffee, Forestry, Macadamia Nuts Average Annual Rainfall (Pahala) 55.0”
Citrus, Flowers, Guavas, Macadamia Nuts, Nursery Products, Tropical Specialty Fruits, Vegetables Average Annual Rainfall (Hilo) 126.3”
Aquaculture, Bananas, Cattle, Coffee, Flowers, Lotus Root, Nursery Products, Papayas, Pineapples, Seed Crops, Taro, Tropical Specialty Fruits, Vegetables Average Annual Rainfall (Poamoho) 45.0”
Flowers, Herbs, Hogs, Nursery Products, Poultry, Vegetables Average Annual Rainfall (Waianae) 20.0”
Bananas, Flowers, Herbs, Melons, Nursery Products, Pineapples, Seed Crops, Vegetables, Watercress Average Annual Rainfall (Kunia) 28.0”
Aquaculture, Bananas, Cattle, Flowers, Nursery Products, Papayas, Taro, Vegetables, Watermelons Average Annual Rainfall (Kahuku) 45.0”
Bananas, Flowers, Nursery Products, Poultry, VegetablesAverage Annual Rainfall (Waimanalo) 42.8”
HAWAII
OAHU
PEARLHARBOR
5 Statistics of Hawaii Agriculture
PAHALA
(KAMUELA)
KAILUA
WAIMANALO
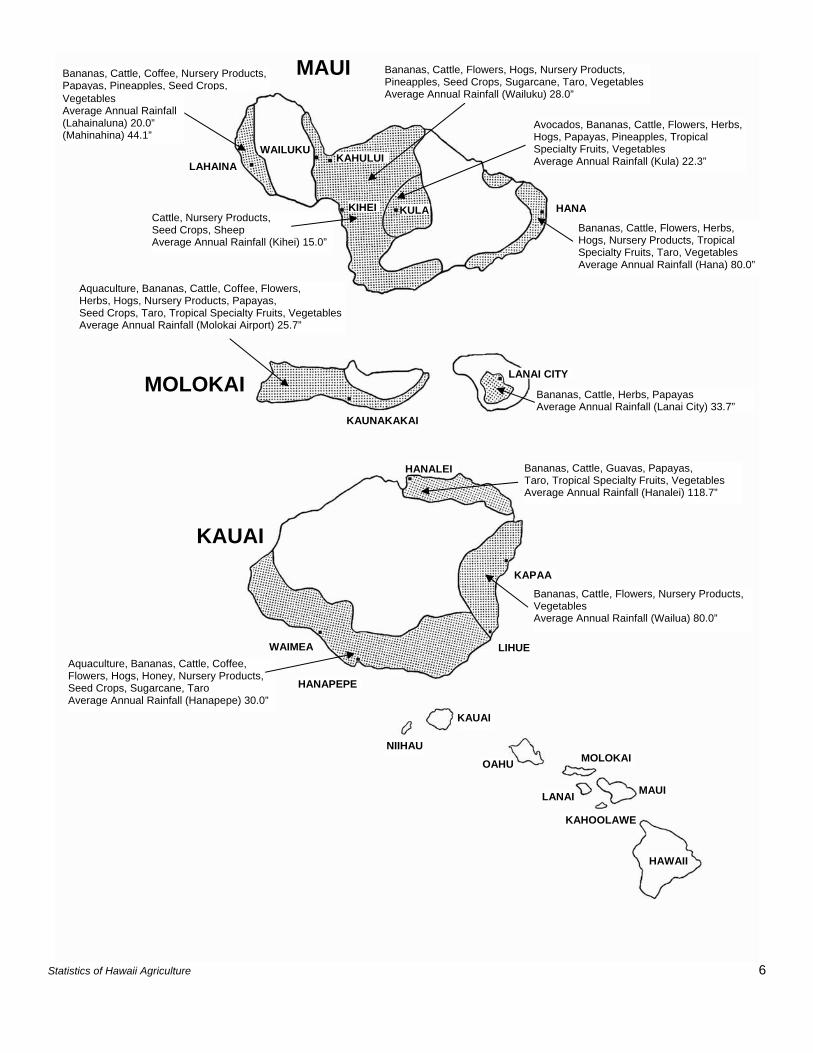
MAUI
LAHAINA
WAILUKUKAHULUI
KIHEI KULA HANA
KAUNAKAKAI
LANAI CITY
HANALEI
KAPAA
LIHUE
HANAPEPE
WAIMEA
Cattle, Nursery Products, Seed Crops, Sheep Average Annual Rainfall (Kihei) 15.0”
Aquaculture, Bananas, Cattle, Coffee, Flowers, Herbs, Hogs, Nursery Products, Papayas, Seed Crops, Taro, Tropical Specialty Fruits, VegetablesAverage Annual Rainfall (Molokai Airport) 25.7”
Avocados, Bananas, Cattle, Flowers, Herbs,Hogs, Papayas, Pineapples, Tropical Specialty Fruits, Vegetables Average Annual Rainfall (Kula) 22.3”
Bananas, Cattle, Flowers, Hogs, Nursery Products, Pineapples, Seed Crops, Sugarcane, Taro, Vegetables Average Annual Rainfall (Wailuku) 28.0”
Bananas, Cattle, Flowers, Herbs, Hogs, Nursery Products, Tropical Specialty Fruits, Taro, Vegetables Average Annual Rainfall (Hana) 80.0”
Bananas, Cattle, Herbs, Papayas Average Annual Rainfall (Lanai City) 33.7”
Bananas, Cattle, Guavas, Papayas, Taro, Tropical Specialty Fruits, Vegetables Average Annual Rainfall (Hanalei) 118.7”
Bananas, Cattle, Flowers, Nursery Products, Vegetables Average Annual Rainfall (Wailua) 80.0”
Aquaculture, Bananas, Cattle, Coffee, Flowers, Hogs, Honey, Nursery Products, Seed Crops, Sugarcane, Taro Average Annual Rainfall (Hanapepe) 30.0”
Statistics of Hawaii Agriculture 6
MOLOKAI
KAUAI
NIIHAU
KAUAI
OAHU
LANAI
MOLOKAI
KAHOOLAWE
MAUI
HAWAII
Bananas, Cattle, Coffee, Nursery Products, Papayas, Pineapples, Seed Crops, Vegetables Average Annual Rainfall (Lahainaluna) 20.0” (Mahinahina) 44.1”
SUMMARIES
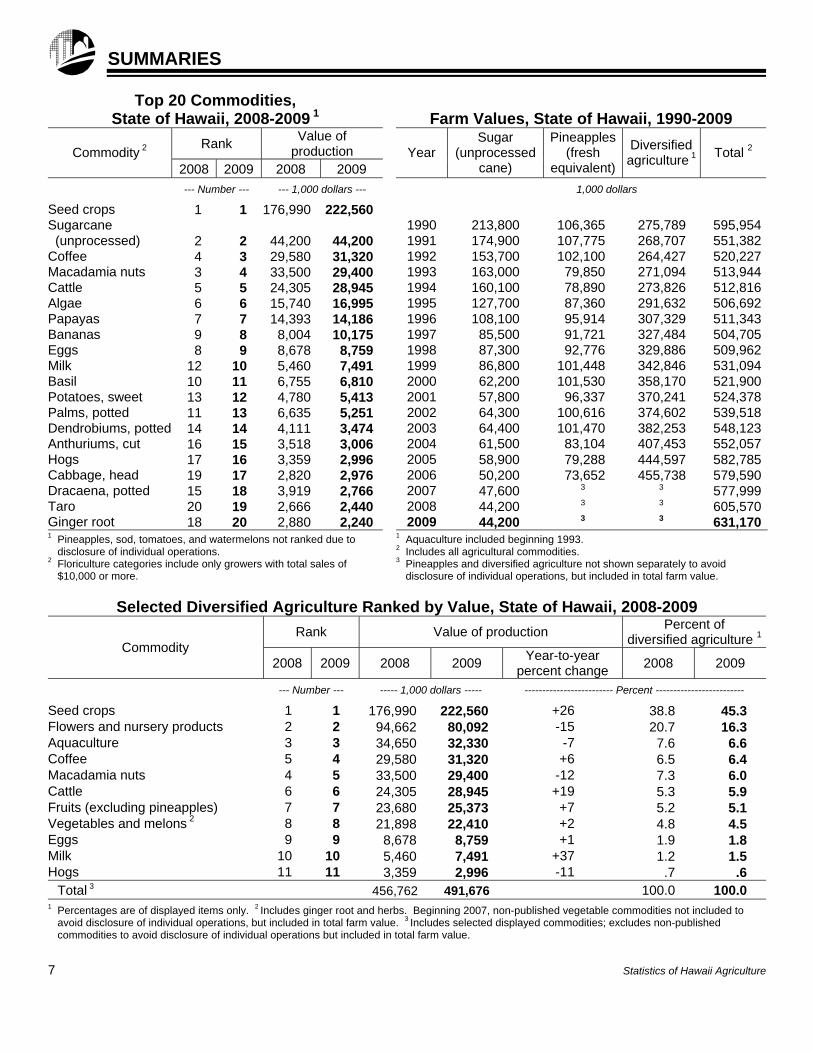
Top 20 Commodities, State of Hawaii, 2008-2009 1
Farm Values, State of Hawaii, 1990-2009
Commodity 2 Rank
Value of production
Year
Sugar (unprocessed
cane)
Pineapples (fresh
equivalent)
Diversified agriculture 1 Total 2
2008 2009 2008 2009
--- Number --- --- 1,000 dollars --- 1,000 dollars
Seed crops 1 1 176,990 222,560 Sugarcane 1990 213,800 106,365 275,789 595,954 (unprocessed) 2 2 44,200 44,200 1991 174,900 107,775 268,707 551,382Coffee 4 3 29,580 31,320 1992 153,700 102,100 264,427 520,227Macadamia nuts 3 4 33,500 29,400 1993 163,000 79,850 271,094 513,944Cattle 5 5 24,305 28,945 1994 160,100 78,890 273,826 512,816Algae 6 6 15,740 16,995 1995 127,700 87,360 291,632 506,692Papayas 7 7 14,393 14,186 1996 108,100 95,914 307,329 511,343Bananas 9 8 8,004 10,175 1997 85,500 91,721 327,484 504,705Eggs 8 9 8,678 8,759 1998 87,300 92,776 329,886 509,962Milk 12 10 5,460 7,491 1999 86,800 101,448 342,846 531,094Basil 10 11 6,755 6,810 2000 62,200 101,530 358,170 521,900Potatoes, sweet 13 12 4,780 5,413 2001 57,800 96,337 370,241 524,378Palms, potted 11 13 6,635 5,251 2002 64,300 100,616 374,602 539,518Dendrobiums, potted 14 14 4,111 3,474 2003 64,400 101,470 382,253 548,123Anthuriums, cut 16 15 3,518 3,006 2004 61,500 83,104 407,453 552,057Hogs 17 16 3,359 2,996 2005 58,900 79,288 444,597 582,785Cabbage, head 19 17 2,820 2,976 2006 50,200 73,652 455,738 579,590Dracaena, potted 15 18 3,919 2,766 2007 47,600 3 3 577,999Taro 20 19 2,666 2,440 2008 44,200 3 3 605,570Ginger root 18 20 2,880 2,240 2009 44,200 3 3 631,1701 Pineapples, sod, tomatoes, and watermelons not ranked due to
disclosure of individual operations. 2 Floriculture categories include only growers with total sales of
$10,000 or more.
1 Aquaculture included beginning 1993. 2 Includes all agricultural commodities. 3 Pineapples and diversified agriculture not shown separately to avoid
disclosure of individual operations, but included in total farm value.
Selected Diversified Agriculture Ranked by Value, State of Hawaii, 2008-2009
Commodity Rank Value of production
Percent of diversified agriculture 1
2008 2009 2008 2009 Year-to-year
percent change 2008 2009
--- Number --- ----- 1,000 dollars ----- ------------------------- Percent -------------------------
Seed crops 1 1 176,990 222,560 +26 38.8 45.3 Flowers and nursery products 2 2 94,662 80,092 -15 20.7 16.3 Aquaculture 3 3 34,650 32,330 -7 7.6 6.6 Coffee 5 4 29,580 31,320 +6 6.5 6.4 Macadamia nuts 4 5 33,500 29,400 -12 7.3 6.0 Cattle 6 6 24,305 28,945 +19 5.3 5.9 Fruits (excluding pineapples) 7 7 23,680 25,373 +7 5.2 5.1 Vegetables and melons 2 8 8 21,898 22,410 +2 4.8 4.5 Eggs 9 9 8,678 8,759 +1 1.9 1.8 Milk 10 10 5,460 7,491 +37 1.2 1.5 Hogs 11 11 3,359 2,996 -11 .7 .6
Total 3 456,762 491,676 100.0 100.0 1 Percentages are of displayed items only. 2 Includes ginger root and herbs. Beginning 2007, non-published vegetable commodities not included to
avoid disclosure of individual operations, but included in total farm value. 3 Includes selected displayed commodities; excludes non-published commodities to avoid disclosure of individual operations but included in total farm value.
7 Statistics of Hawaii Agriculture
SUMMARIES
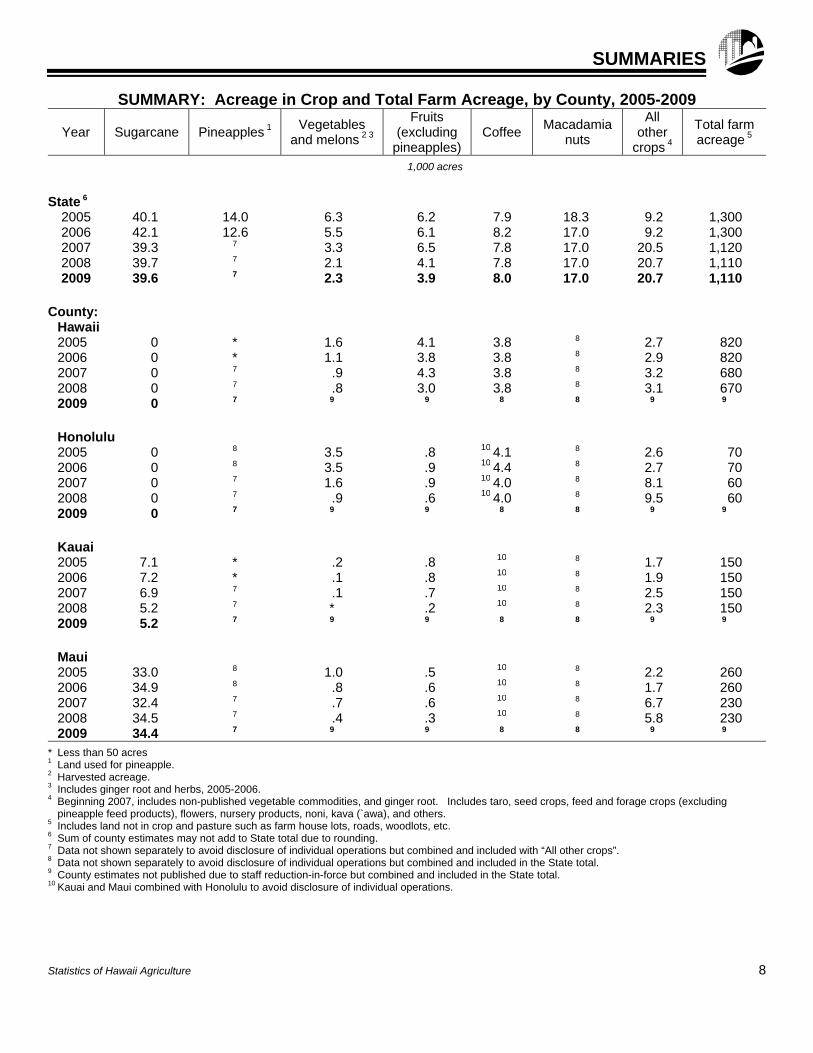
SUMMARY: Acreage in Crop and Total Farm Acreage, by County, 2005-2009
Year Sugarcane Pineapples 1 Vegetables
and melons 2 3
Fruits (excluding
pineapples) Coffee
Macadamia nuts
All other
crops 4
Total farm acreage 5
1,000 acres
State 6
2005 40.1 14.0 6.3 6.2 7.9 18.3 9.2 1,300 2006 42.1 12.6 5.5 6.1 8.2 17.0 9.2 1,300 2007 39.3 7 3.3 6.5 7.8 17.0 20.5 1,120 2008 39.7 7 2.1 4.1 7.8 17.0 20.7 1,110 2009 39.6 7 2.3 3.9 8.0 17.0 20.7 1,110
County:
Hawaii 2005 0 * 1.6 4.1 3.8 8 2.7 820 2006 0 * 1.1 3.8 3.8 8 2.9 820 2007 0 7 .9 4.3 3.8 8 3.2 680 2008 0 7 .8 3.0 3.8 8 3.1 670 2009 0 7 9 9 8 8 9 9
Honolulu
2005 0 8 3.5 .8 10 4.1 8 2.6 70 2006 0 8 3.5 .9 10 4.4 8 2.7 70 2007 0 7 1.6 .9 10 4.0 8 8.1 60 2008 0 7 .9 .6 10 4.0 8 9.5 60 2009 0 7 9 9 8 8 9 9
Kauai 2005 7.1 * .2 .8 10 8 1.7 150 2006 7.2 * .1 .8 10 8 1.9 150 2007 6.9 7 .1 .7 10 8 2.5 150 2008 5.2 7 * .2 10 8 2.3 150 2009 5.2 7 9 9 8 8 9 9
Maui 2005 33.0 8 1.0 .5 10 8 2.2 260 2006 34.9 8 .8 .6 10 8 1.7 260 2007 32.4 7 .7 .6 10 8 6.7 230 2008 34.5 7 .4 .3 10 8 5.8 230 2009 34.4 7 9 9 8 8 9 9
* Less than 50 acres 1 Land used for pineapple. 2 Harvested acreage. 3 Includes ginger root and herbs, 2005-2006. 4 Beginning 2007, includes non-published vegetable commodities, and ginger root. Includes taro, seed crops, feed and forage crops (excluding
pineapple feed products), flowers, nursery products, noni, kava (`awa), and others. 5 Includes land not in crop and pasture such as farm house lots, roads, woodlots, etc. 6 Sum of county estimates may not add to State total due to rounding. 7 Data not shown separately to avoid disclosure of individual operations but combined and included with “All other crops”. 8 Data not shown separately to avoid disclosure of individual operations but combined and included in the State total. 9 County estimates not published due to staff reduction-in-force but combined and included in the State total. 10 Kauai and Maui combined with Honolulu to avoid disclosure of individual operations.
Statistics of Hawaii Agriculture 8
SUMMARIES
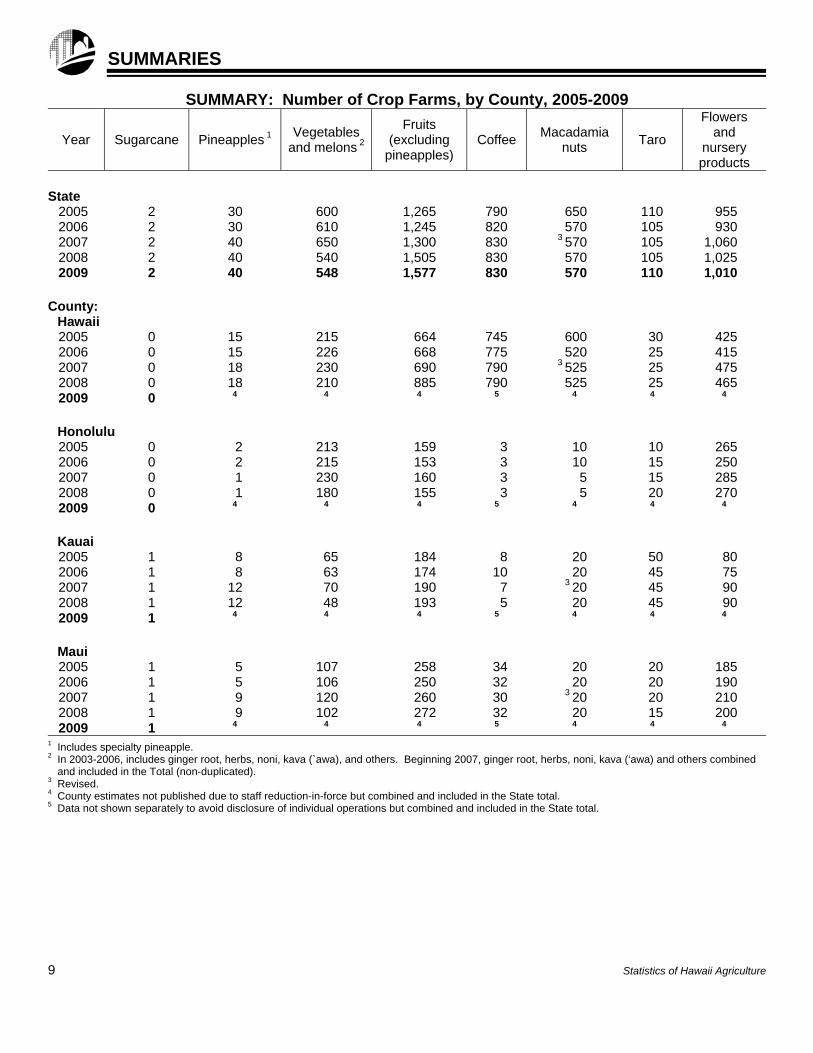
SUMMARY: Number of Crop Farms, by County, 2005-2009
Year Sugarcane Pineapples 1 Vegetables
and melons 2
Fruits (excluding
pineapples) Coffee
Macadamia nuts
Taro
Flowers and
nursery products
State
2005 2 30 600 1,265 790 650 110 955 2006 2 30 610 1,245 820 570 105 930 2007 2 40 650 1,300 830 3 570 105 1,060 2008 2 40 540 1,505 830 570 105 1,025 2009 2 40 548 1,577 830 570 110 1,010
County:
Hawaii 2005 0 15 215 664 745 600 30 425 2006 0 15 226 668 775 520 25 415 2007 0 18 230 690 790 3 525 25 475 2008 0 18 210 885 790 525 25 465 2009 0 4 4 4 5 4 4 4
Honolulu
2005 0 2 213 159 3 10 10 265 2006 0 2 215 153 3 10 15 250 2007 0 1 230 160 3 5 15 285 2008 0 1 180 155 3 5 20 270 2009 0 4 4 4 5 4 4 4
Kauai 2005 1 8 65 184 8 20 50 80 2006 1 8 63 174 10 20 45 75 2007 1 12 70 190 7 3 20 45 90 2008 1 12 48 193 5 20 45 90 2009 1 4 4 4 5 4 4 4
Maui 2005 1 5 107 258 34 20 20 185 2006 1 5 106 250 32 20 20 190 2007 1 9 120 260 30 3 20 20 210 2008 1 9 102 272 32 20 15 200 2009 1 4 4 4 5 4 4 4
1 Includes specialty pineapple. 2 In 2003-2006, includes ginger root, herbs, noni, kava (`awa), and others. Beginning 2007, ginger root, herbs, noni, kava (‘awa) and others combined
and included in the Total (non-duplicated). 3 Revised. 4 County estimates not published due to staff reduction-in-force but combined and included in the State total. 5 Data not shown separately to avoid disclosure of individual operations but combined and included in the State total.
9 Statistics of Hawaii Agriculture
SUMMARIES
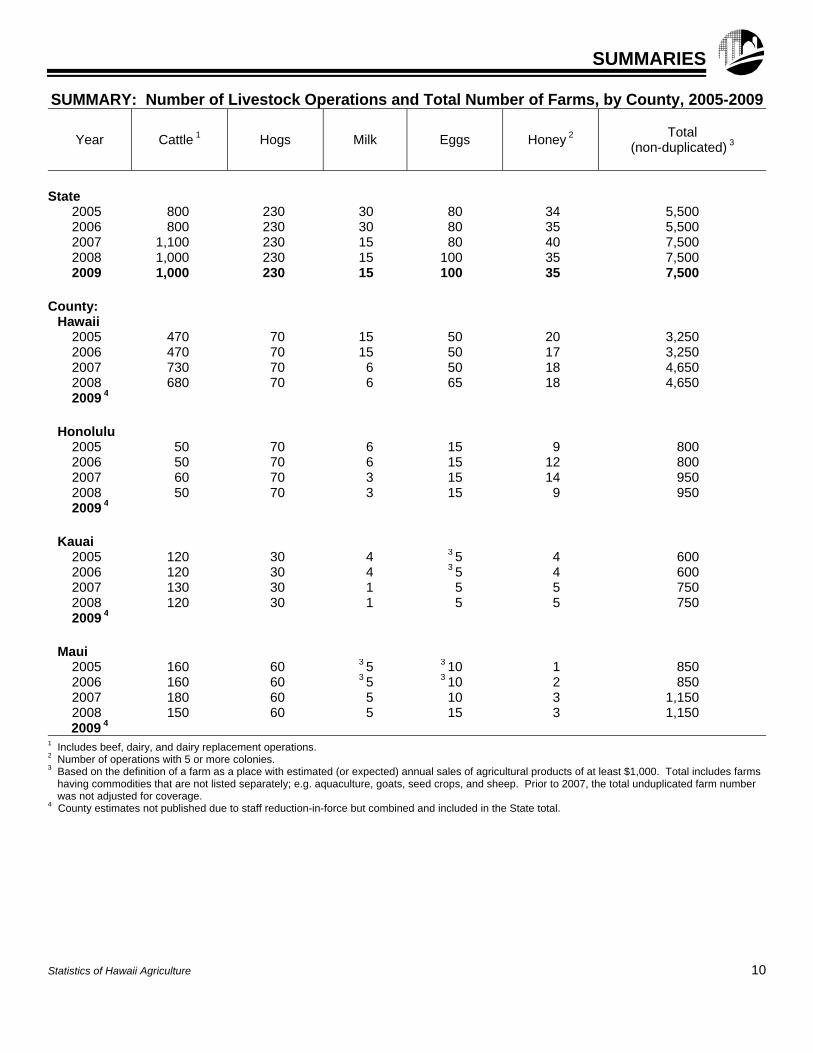
SUMMARY: Number of Livestock Operations and Total Number of Farms, by County, 2005-2009
Year Cattle 1 Hogs Milk Eggs Honey 2
Total
(non-duplicated) 3
State
2005 800 230 30 80 34 5,500 2006 800 230 30 80 35 5,500 2007 1,100 230 15 80 40 7,500 2008 1,000 230 15 100 35 7,500 2009 1,000 230 15 100 35 7,500
County: Hawaii
2005 470 70 15 50 20 3,250 2006 470 70 15 50 17 3,250 2007 730 70 6 50 18 4,650 2008 680 70 6 65 18 4,650 2009 4
Honolulu 2005 50 70 6 15 9 800 2006 50 70 6 15 12 800 2007 60 70 3 15 14 950 2008 50 70 3 15 9 950 2009 4
Kauai 2005 120 30 4 3 5 4 600 2006 120 30 4 3 5 4 600 2007 130 30 1 5 5 750 2008 120 30 1 5 5 750 2009 4
Maui 2005 160 60 3 5 3 10 1 850 2006 160 60 3 5 3 10 2 850 2007 180 60 5 10 3 1,150 2008 150 60 5 15 3 1,150 2009 4
1 Includes beef, dairy, and dairy replacement operations. 2 Number of operations with 5 or more colonies. 3 Based on the definition of a farm as a place with estimated (or expected) annual sales of agricultural products of at least $1,000. Total includes farms
having commodities that are not listed separately; e.g. aquaculture, goats, seed crops, and sheep. Prior to 2007, the total unduplicated farm number was not adjusted for coverage.
4 County estimates not published due to staff reduction-in-force but combined and included in the State total.
Statistics of Hawaii Agriculture 10
SUMMARIES
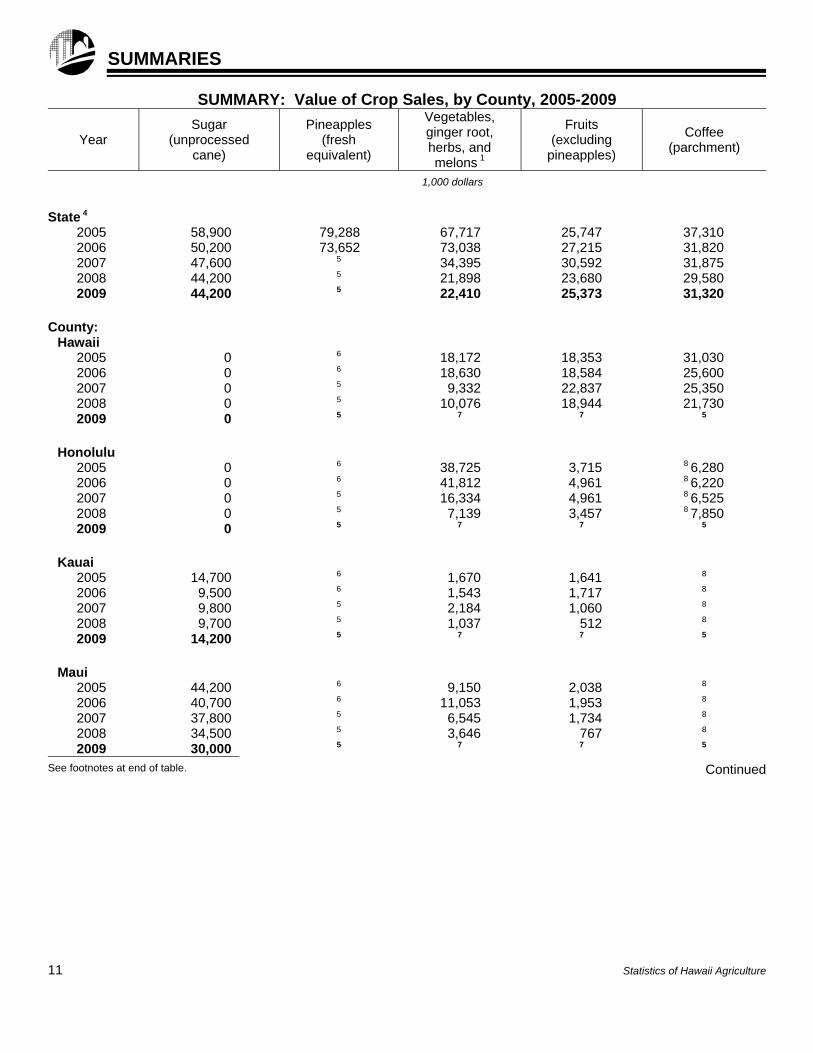
SUMMARY: Value of Crop Sales, by County, 2005-2009
Year Sugar
(unprocessed cane)
Pineapples (fresh
equivalent)
Vegetables, ginger root, herbs, and melons 1
Fruits (excluding
pineapples)
Coffee (parchment)
1,000 dollars
State 4
2005 58,900 79,288 67,717 25,747 37,310 2006 50,200 73,652 73,038 27,215 31,820 2007 47,600 5 34,395 30,592 31,875 2008 44,200 5 21,898 23,680 29,580 2009 44,200 5 22,410 25,373 31,320
County: Hawaii
2005 0 6 18,172 18,353 31,030 2006 0 6 18,630 18,584 25,600 2007 0 5 9,332 22,837 25,350 2008 0 5 10,076 18,944 21,730 2009 0 5 7 7 5
Honolulu 2005 0 6 38,725 3,715 8 6,280 2006 0 6 41,812 4,961 8 6,220 2007 0 5 16,334 4,961 8 6,525 2008 0 5 7,139 3,457 8 7,850 2009 0 5 7 7 5
Kauai 2005 14,700 6 1,670 1,641 8
2006 9,500 6 1,543 1,717 8
2007 9,800 5 2,184 1,060 8
2008 9,700 5 1,037 512 8
2009 14,200 5 7 7 5
Maui 2005 44,200 6 9,150 2,038 8
2006 40,700 6 11,053 1,953 8
2007 37,800 5 6,545 1,734 8
2008 34,500 5 3,646 767 8
2009 30,000 5 7 7 5
See footnotes at end of table. Continued
11 Statistics of Hawaii Agriculture
SUMMARIES
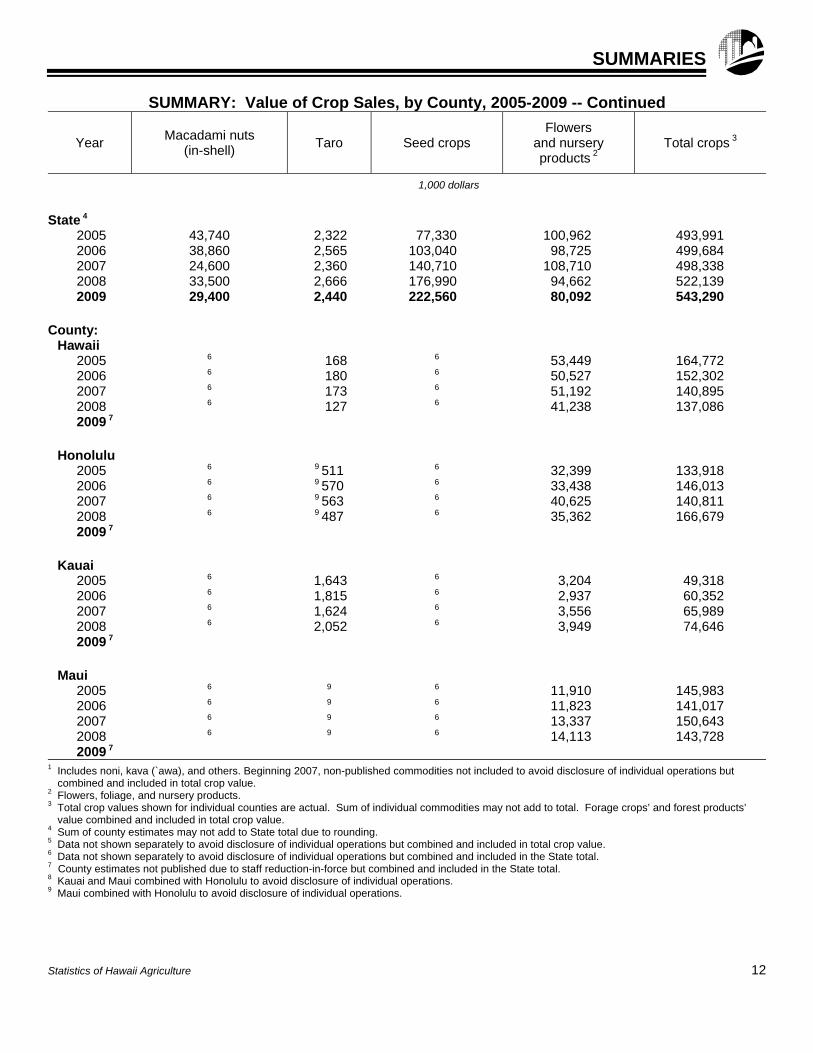
SUMMARY: Value of Crop Sales, by County, 2005-2009 -- Continued
Year
Macadami nuts
(in-shell)
Taro Seed crops Flowers
and nursery products 2
Total crops 3
1,000 dollars
State 4
2005 43,740 2,322 77,330 100,962 493,991 2006 38,860 2,565 103,040 98,725 499,684 2007 24,600 2,360 140,710 108,710 498,338 2008 33,500 2,666 176,990 94,662 522,139 2009 29,400 2,440 222,560 80,092 543,290
County: Hawaii
2005 6 168 6 53,449 164,772 2006 6 180 6 50,527 152,302 2007 6 173 6 51,192 140,895 2008 6 127 6 41,238 137,086 2009 7
Honolulu 2005 6 9 511 6 32,399 133,918 2006 6 9 570 6 33,438 146,013 2007 6 9 563 6 40,625 140,811 2008 6 9 487 6 35,362 166,679 2009 7
Kauai 2005 6 1,643 6 3,204 49,318 2006 6 1,815 6 2,937 60,352 2007 6 1,624 6 3,556 65,989 2008 6 2,052 6 3,949 74,646 2009 7
Maui 2005 6 9 6 11,910 145,983 2006 6 9 6 11,823 141,017 2007 6 9 6 13,337 150,643 2008 6 9 6 14,113 143,728 2009 7
1 Includes noni, kava (`awa), and others. Beginning 2007, non-published commodities not included to avoid disclosure of individual operations but combined and included in total crop value.
2 Flowers, foliage, and nursery products. 3 Total crop values shown for individual counties are actual. Sum of individual commodities may not add to total. Forage crops’ and forest products’
value combined and included in total crop value. 4 Sum of county estimates may not add to State total due to rounding. 5 Data not shown separately to avoid disclosure of individual operations but combined and included in total crop value. 6 Data not shown separately to avoid disclosure of individual operations but combined and included in the State total. 7 County estimates not published due to staff reduction-in-force but combined and included in the State total. 8 Kauai and Maui combined with Honolulu to avoid disclosure of individual operations. 9 Maui combined with Honolulu to avoid disclosure of individual operations.
Statistics of Hawaii Agriculture 12
SUMMARIES
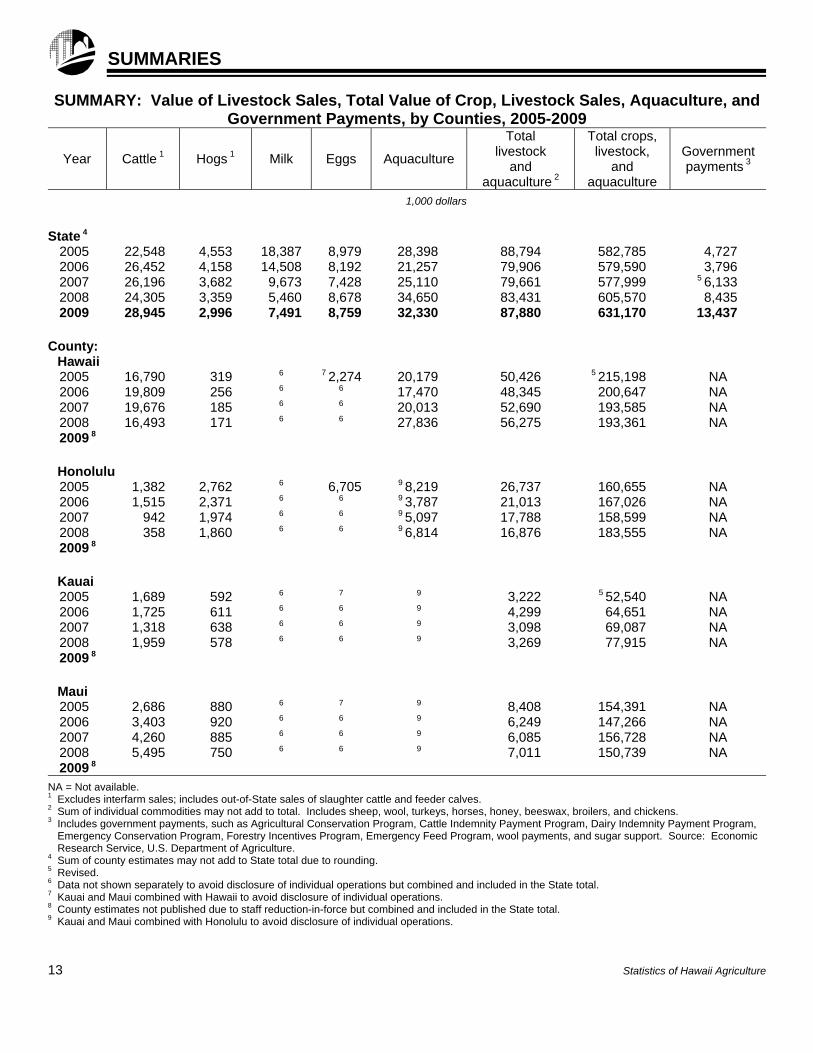
SUMMARY: Value of Livestock Sales, Total Value of Crop, Livestock Sales, Aquaculture, and Government Payments, by Counties, 2005-2009
Year Cattle 1 Hogs 1 Milk Eggs Aquaculture
Total livestock
and aquaculture 2
Total crops, livestock,
and aquaculture
Government payments 3
1,000 dollars
State 4
2005 22,548 4,553 18,387 8,979 28,398 88,794 582,785 4,727 2006 26,452 4,158 14,508 8,192 21,257 79,906 579,590 3,796 2007 26,196 3,682 9,673 7,428 25,110 79,661 577,999 5 6,133 2008 24,305 3,359 5,460 8,678 34,650 83,431 605,570 8,435 2009 28,945 2,996 7,491 8,759 32,330 87,880 631,170 13,437
County: Hawaii 2005 16,790 319 6 7 2,274 20,179 50,426 5 215,198 NA 2006 19,809 256 6 6 17,470 48,345 200,647 NA 2007 19,676 185 6 6 20,013 52,690 193,585 NA 2008 16,493 171 6 6 27,836 56,275 193,361 NA 2009 8
Honolulu 2005 1,382 2,762 6 6,705 9 8,219 26,737 160,655 NA 2006 1,515 2,371 6 6 9 3,787 21,013 167,026 NA 2007 942 1,974 6 6 9 5,097 17,788 158,599 NA 2008 358 1,860 6 6 9 6,814 16,876 183,555 NA 2009 8
Kauai 2005 1,689 592 6 7 9 3,222 5 52,540 NA 2006 1,725 611 6 6 9 4,299 64,651 NA 2007 1,318 638 6 6 9 3,098 69,087 NA 2008 1,959 578 6 6 9 3,269 77,915 NA 2009 8
Maui 2005 2,686 880 6 7 9 8,408 154,391 NA 2006 3,403 920 6 6 9 6,249 147,266 NA 2007 4,260 885 6 6 9 6,085 156,728 NA 2008 5,495 750 6 6 9 7,011 150,739 NA 2009 8
NA = Not available. 1 Excludes interfarm sales; includes out-of-State sales of slaughter cattle and feeder calves. 2 Sum of individual commodities may not add to total. Includes sheep, wool, turkeys, horses, honey, beeswax, broilers, and chickens. 3 Includes government payments, such as Agricultural Conservation Program, Cattle Indemnity Payment Program, Dairy Indemnity Payment Program,
Emergency Conservation Program, Forestry Incentives Program, Emergency Feed Program, wool payments, and sugar support. Source: Economic Research Service, U.S. Department of Agriculture.
4 Sum of county estimates may not add to State total due to rounding. 5 Revised. 6 Data not shown separately to avoid disclosure of individual operations but combined and included in the State total. 7 Kauai and Maui combined with Hawaii to avoid disclosure of individual operations. 8 County estimates not published due to staff reduction-in-force but combined and included in the State total. 9 Kauai and Maui combined with Honolulu to avoid disclosure of individual operations.
13 Statistics of Hawaii Agriculture

FOOD EXPENDITURES
FOOD: U.S. Expenditures by Families and Individuals, Selected Years, 1935-2009
Year Disposable
personal income
Expenditures for food
At home 1 Away from home 2 Total 3
Billion dollars Billion dollars Percent Billion dollars Percent Billion dollars Percent
1935 59.3 12.1 20.4 1.8 3.0 13.9 23.4 1940 76.8 13.5 17.6 2.4 3.1 15.9 20.7 1950 210.1 35.7 17.0 7.6 3.6 43.3 20.6 1960 365.4 51.5 14.1 12.6 3.4 64.0 17.5 1970 735.7 75.5 10.3 26.4 3.6 102.0 13.9 1980 2,009.0 180.8 9.0 85.2 4.2 266.0 13.2 1981 2,246.1 195.5 8.7 95.8 4.3 291.3 13.0 1982 2,421.2 201.0 8.3 104.5 4.3 305.5 12.6 1983 2,608.4 211.4 8.1 113.7 4.4 325.1 12.5 1984 2,912.0 224.0 7.7 121.9 4.2 345.8 11.9 1985 3,109.3 234.0 7.5 128.6 4.1 362.6 11.7 1986 3,285.1 242.7 7.4 137.9 4.2 380.6 11.6 1987 3,458.1 252.7 7.3 146.4 4.2 399.0 11.5 1988 3,748.7 255.9 6.8 157.5 4.2 413.4 11.0 1989 4,021.7 274.8 6.8 165.4 4.1 440.2 10.9 1990 4,285.8 299.7 7.0 177.4 4.1 477.1 11.1 1991 4,464.3 313.5 7.0 186.3 4.2 499.8 11.2 1992 4,751.4 313.6 6.6 191.9 4.0 505.5 10.6 1993 4,911.9 323.3 6.6 205.9 4.2 529.1 10.8 1994 5,151.8 337.1 6.5 216.5 4.2 553.5 10.7 1995 5,408.2 345.5 6.4 226.2 4.2 571.7 10.6 1996 5,688.5 360.6 6.3 233.2 4.1 593.8 10.4 1997 5,988.8 377.2 6.3 246.3 4.1 623.5 10.4 1998 6,395.9 387.1 6.1 259.7 4.1 646.8 10.1 1999 6,695.0 408.8 6.1 272.0 4.1 680.8 10.2 2000 7,194.0 420.1 5.8 291.3 4.0 711.4 9.9 2001 7,486.8 442.5 5.9 301.3 4.0 743.8 9.9 2002 7,830.1 455.0 5.8 313.9 4.0 768.9 9.8 2003 8,162.5 473.1 5.8 329.6 4.0 802.8 9.8 2004 8,680.9 491.1 5.7 347.9 4.0 839.1 9.7 2005 9,092.0 518.2 5.7 367.2 4.0 885.4 9.7 2006 9,640.7 550.9 5.7 4 390.8 4 4.1 4 941.7 9.8 2007 4 10,403.1 576.2 5.5 409.3 3.9 985.5 9.5 2008 10,806.4 594.9 5.5 422.6 3.9 1,017.5 9.4 2009 10,923.6 605.4 5.5 429.2 3.9 1,034.6 9.5
1 Food-at-home includes cash purchases from grocery stores and other retail outlets, including purchases with food stamps and WIC vouchers and food produced and consumed on farms (valued at farm prices), but excludes government-donated foods.
2 Food-away-from-home includes meals and snacks purchased by families and individuals and food furnished to employees, but excludes food paid for by government and business, such as donated foods to schools, meals in prisons and other institutions, and expense-account meals.
3 Total may not add due to rounding. 4 Revised. Source: Economic Research Service, USDA.
Statistics of Hawaii Agriculture 14
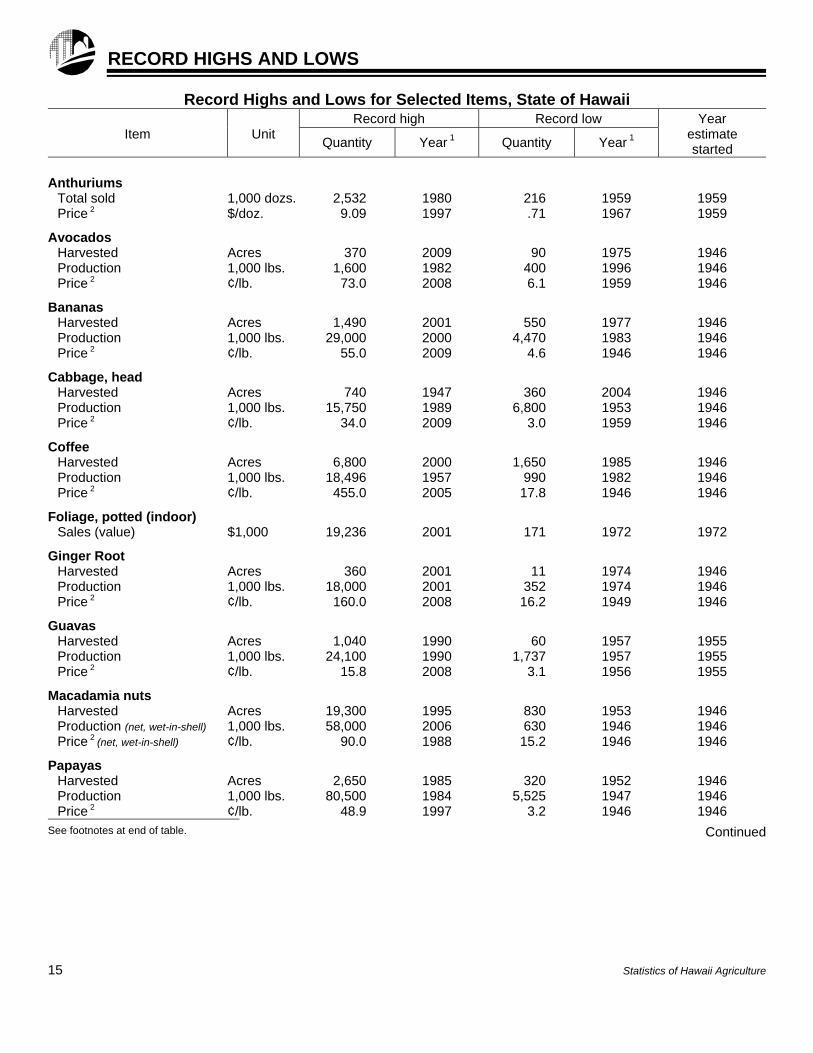
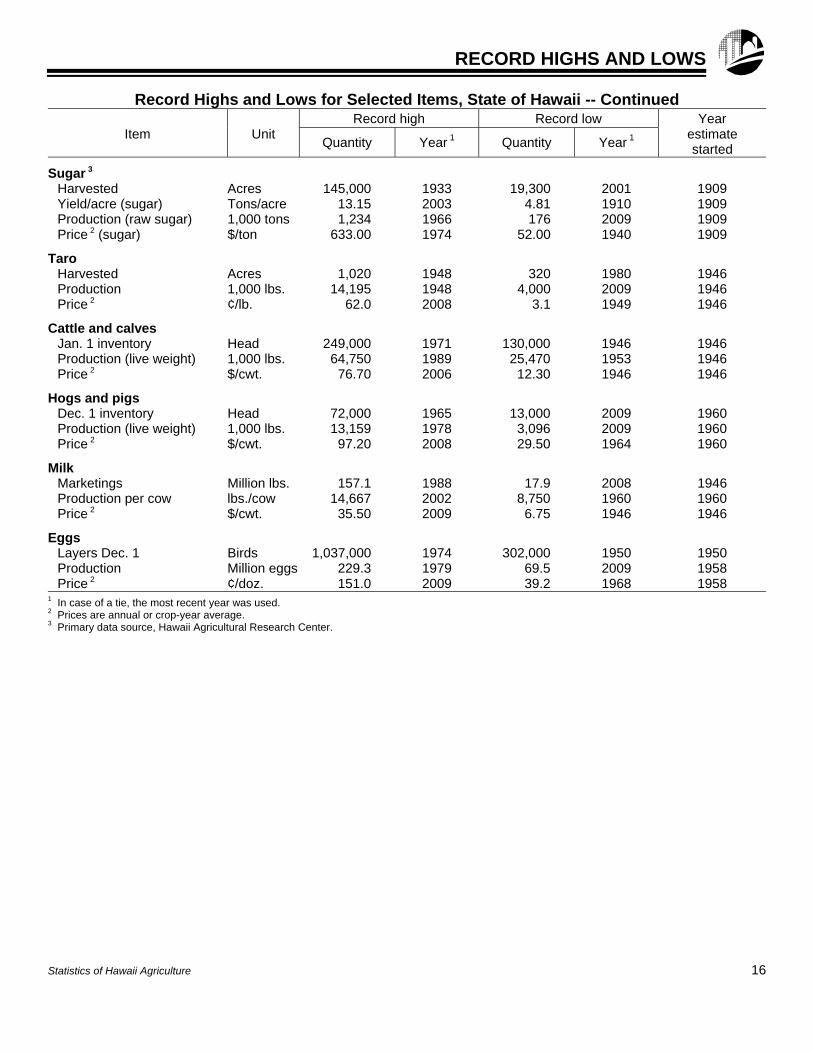
RECORD HIGHS AND LOWS
Record Highs and Lows for Selected Items, State of Hawaii
Item Unit Record high Record low Year
estimate started Quantity Year 1 Quantity Year 1
Anthuriums
Total sold 1,000 dozs. 2,532 1980 216 1959 1959 Price 2 $/doz. 9.09 1997 .71 1967 1959
Avocados Harvested Acres 370 2009 90 1975 1946 Production 1,000 lbs. 1,600 1982 400 1996 1946 Price 2 ¢/lb. 73.0 2008 6.1 1959 1946
Bananas Harvested Acres 1,490 2001 550 1977 1946 Production 1,000 lbs. 29,000 2000 4,470 1983 1946 Price 2 ¢/lb. 55.0 2009 4.6 1946 1946
Cabbage, head Harvested Acres 740 1947 360 2004 1946 Production 1,000 lbs. 15,750 1989 6,800 1953 1946 Price 2 ¢/lb. 34.0 2009 3.0 1959 1946
Coffee Harvested Acres 6,800 2000 1,650 1985 1946 Production 1,000 lbs. 18,496 1957 990 1982 1946 Price 2 ¢/lb. 455.0 2005 17.8 1946 1946
Foliage, potted (indoor) Sales (value) $1,000 19,236 2001 171 1972 1972
Ginger Root Harvested Acres 360 2001 11 1974 1946 Production 1,000 lbs. 18,000 2001 352 1974 1946 Price 2 ¢/lb. 160.0 2008 16.2 1949 1946
Guavas Harvested Acres 1,040 1990 60 1957 1955 Production 1,000 lbs. 24,100 1990 1,737 1957 1955 Price 2 ¢/lb. 15.8 2008 3.1 1956 1955
Macadamia nuts Harvested Acres 19,300 1995 830 1953 1946 Production (net, wet-in-shell) 1,000 lbs. 58,000 2006 630 1946 1946 Price 2
(net, wet-in-shell) ¢/lb. 90.0 1988 15.2 1946 1946
Papayas Harvested Acres 2,650 1985 320 1952 1946 Production 1,000 lbs. 80,500 1984 5,525 1947 1946 Price 2 ¢/lb. 48.9 1997 3.2 1946 1946
See footnotes at end of table. Continued
15 Statistics of Hawaii Agriculture
RECORD HIGHS AND LOWS
Record Highs and Lows for Selected Items, State of Hawaii -- Continued
Item Unit Record high Record low Year
estimate started Quantity Year 1 Quantity Year 1
Sugar 3 Harvested Acres 145,000 1933 19,300 2001 1909 Yield/acre (sugar) Tons/acre 13.15 2003 4.81 1910 1909 Production (raw sugar) 1,000 tons 1,234 1966 176 2009 1909 Price 2 (sugar) $/ton 633.00 1974 52.00 1940 1909
Taro Harvested Acres 1,020 1948 320 1980 1946 Production 1,000 lbs. 14,195 1948 4,000 2009 1946 Price 2 ¢/lb. 62.0 2008 3.1 1949 1946
Cattle and calves Jan. 1 inventory Head 249,000 1971 130,000 1946 1946 Production (live weight) 1,000 lbs. 64,750 1989 25,470 1953 1946 Price 2 $/cwt. 76.70 2006 12.30 1946 1946
Hogs and pigs Dec. 1 inventory Head 72,000 1965 13,000 2009 1960 Production (live weight) 1,000 lbs. 13,159 1978 3,096 2009 1960 Price 2 $/cwt. 97.20 2008 29.50 1964 1960
Milk Marketings Million lbs. 157.1 1988 17.9 2008 1946 Production per cow lbs./cow 14,667 2002 8,750 1960 1960 Price 2 $/cwt. 35.50 2009 6.75 1946 1946
Eggs Layers Dec. 1 Birds 1,037,000 1974 302,000 1950 1950 Production Million eggs 229.3 1979 69.5 2009 1958 Price 2 ¢/doz. 151.0 2009 39.2 1968 1958
1 In case of a tie, the most recent year was used. 2 Prices are annual or crop-year average. 3 Primary data source, Hawaii Agricultural Research Center.
Statistics of Hawaii Agriculture 16
AGRICULTURE’S CONTRIBUTIONS TO HAWAII’S ECONOMY, 2005 This sequel to two previous CTAHR publications, EI-2 (2000) and EI-3 (2002), provides an update to the estimates of agriculture’s contribution to Hawai`i’s economy. As mentioned in the earlier publications, estimates of agriculture’s contributions vary depending on what is defined as “agriculture” and on the methodology used to develop those estimates. Agriculture as defined in this current publication uses the latest industry classification based on the North American Industry Classification System (NAICS) including crop and animal production; forestry, fishing and related activities; and food (including beverage and tobacco) product manufacturing. The most comprehensive measure of the contribution of an industry is the value added or industry’s gross domestic product1 (GDP) as it avoids possible double-counting. The inclusion of other economic yardsticks such as employment, labor income and sales value provides a fuller picture of the performance of an industry. Industry sales value is probably the most common measure of economic activities. For example, the Hawaii Department of Agriculture reports routinely the farmgate values of production agriculture. Despite its double counting problem, sales value measures the size of economic transactions of an industry based on which general excise and use taxes are generally levied. Employment (number of full- and part-time wage-and- salary plus proprietors’ jobs) provides another good indicator for measuring the contribution of an industry to the economy. Labor income (earnings), which primarily consists of the income received by persons from participation in production, provides yet another measure of an industry’s contribution to the economy. Against this background, the purpose of this publication is to summarize and compare the four measures described above – value-added or GDP, employment, labor income and sales value – in assessing the contribution of agriculture to Hawaii’s economy for the years 1997, 2002 and 2005. Agriculture’s contribution to GDP Hawaii’s overall economy as measured by total GDP increased at an annual rate of 3.0% from 1997 to 2002 but has since grown quite rapidly at an annual rate of 8.0%. Agriculture GDP on the other hand reveals an opposite trend, growing at an annual rate of 2.8% from $594 million in 1997 to $682 million in 2002 but since then decreasing at an annual rate of 0.9% to $664 million in 2005. While farm production was relatively stable
throughout the period 1997-2005, food product manufacturing steadily increased and forestry, fishing and related activities decreased quite rapidly. For the entire period, agriculture increased slightly at an average annual rate of 1.4%, while the overall economy grew at the faster rate of 4.8% per year. Hawaii seems to be following the national trend where agriculture’s growth falls behind the overall growth of the economy. Agriculture’s contribution to employment Total employment in the State increased at an annual rate of 1.6% from 740,028 jobs in 1997 to 838,740 jobs in 2005. However, total employment in agriculture decreased at an annual rate of 1.3% from 25,809 jobs in 1997 to 23,200 jobs in 2005. The decrease can be attributed primarily to decreases in the forestry, fishing and related activities sector, and to a lesser extent the food product manufacturing sector. Agriculture’s contribution to labor income The trends of labor income for the economy, farm production, forestry, fishing and related activities, and food product manufacturing closely follow the corresponding employment trends. The share of agriculture labor income to total labor income declined from 2.1% in 1997 to 1.5% in 2005. Thus, the share of labor income for agriculture would tend to be lower than its employment share, reflecting the lower income of agricultural jobs. Agriculture sales Total agriculture sales (including farm production, forestry, fishing and related activities, and food product manufacturing) increased from $1,643 million in 1997 to $1,836 million in 2002 and further increased slightly to $1,900 in 2005. The share of agriculture sales as compared to the total Hawaii sales decreased slightly from 2.8% in 1997 to 2.6% in 2002 and further decreased in 2005 to 2.1%. This is similar to the GDP trend, since agricultural sales have been increasing at a slower rate than total sales of the economy. To summarize, in 2005, agriculture contributed to 2.1% of total Hawaii sales, 1.2% of GDP, 2.8% of employment, and 1.5% of labor income. The complete publication, including an analysis on the total economic contributions with distribution margins is available at http://www.ctahr.hawaii.edu/oc/freepubs/pdf/EI-13.pdf 1 GDP by industry for each state replaces the former GSP (Gross State
Product) by industry reported by the U.S. Bureau of Economic Analysis. Source: PingSun Leung, UH-CTAHR Department of Molecular Biosciences & Bioengineering, and Matthew K. Loke, Hawaii Department of Agriculture, Agricultural Development Division.
17 Statistics of Hawaii Agriculture
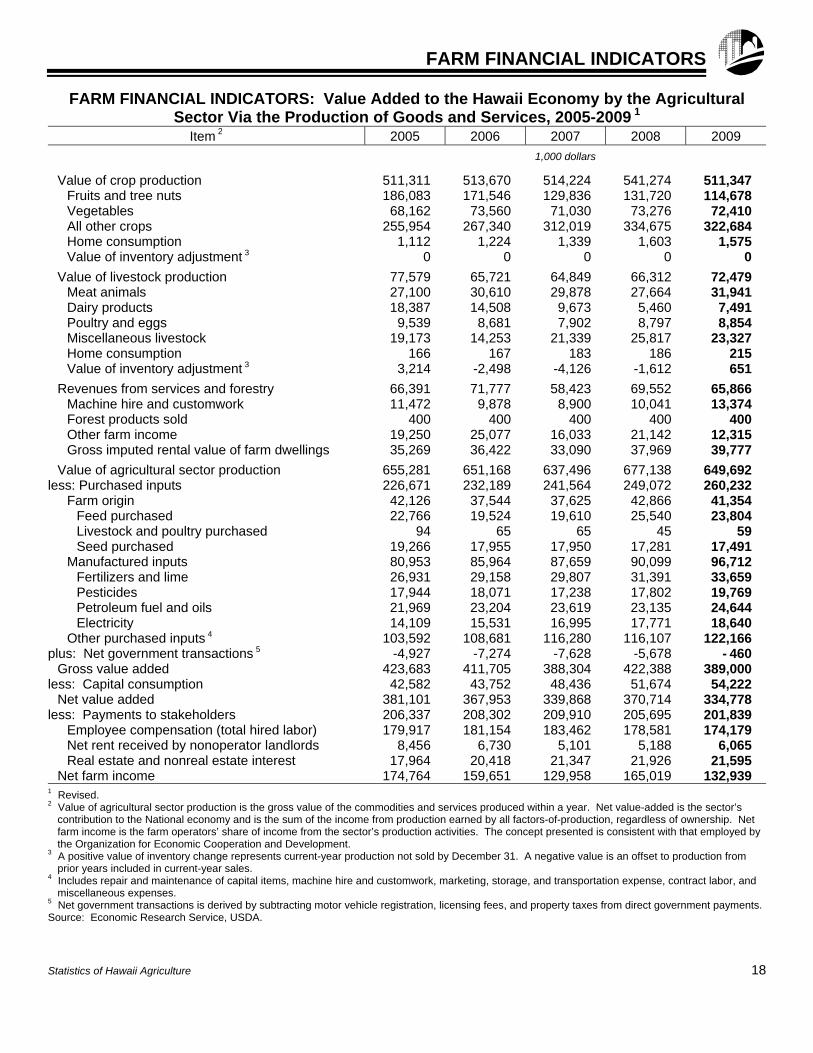
FARM FINANCIAL INDICATORS
FARM FINANCIAL INDICATORS: Value Added to the Hawaii Economy by the Agricultural Sector Via the Production of Goods and Services, 2005-2009 1
Item 2 2005 2006 2007 2008 2009
1,000 dollars
Value of crop production 511,311 513,670 514,224 541,274 511,347 Fruits and tree nuts 186,083 171,546 129,836 131,720 114,678 Vegetables 68,162 73,560 71,030 73,276 72,410 All other crops 255,954 267,340 312,019 334,675 322,684 Home consumption 1,112 1,224 1,339 1,603 1,575 Value of inventory adjustment 3 0 0 0 0 0
Value of livestock production 77,579 65,721 64,849 66,312 72,479 Meat animals 27,100 30,610 29,878 27,664 31,941 Dairy products 18,387 14,508 9,673 5,460 7,491 Poultry and eggs 9,539 8,681 7,902 8,797 8,854 Miscellaneous livestock 19,173 14,253 21,339 25,817 23,327 Home consumption 166 167 183 186 215 Value of inventory adjustment 3 3,214 -2,498 -4,126 -1,612 651
Revenues from services and forestry 66,391 71,777 58,423 69,552 65,866 Machine hire and customwork 11,472 9,878 8,900 10,041 13,374 Forest products sold 400 400 400 400 400 Other farm income 19,250 25,077 16,033 21,142 12,315 Gross imputed rental value of farm dwellings 35,269 36,422 33,090 37,969 39,777
Value of agricultural sector production 655,281 651,168 637,496 677,138 649,692 less: Purchased inputs 226,671 232,189 241,564 249,072 260,232
Farm origin 42,126 37,544 37,625 42,866 41,354 Feed purchased 22,766 19,524 19,610 25,540 23,804 Livestock and poultry purchased 94 65 65 45 59 Seed purchased 19,266 17,955 17,950 17,281 17,491
Manufactured inputs 80,953 85,964 87,659 90,099 96,712 Fertilizers and lime 26,931 29,158 29,807 31,391 33,659 Pesticides 17,944 18,071 17,238 17,802 19,769 Petroleum fuel and oils 21,969 23,204 23,619 23,135 24,644 Electricity 14,109 15,531 16,995 17,771 18,640
Other purchased inputs 4 103,592 108,681 116,280 116,107 122,166 plus: Net government transactions 5 -4,927 -7,274 -7,628 -5,678 - 460
Gross value added 423,683 411,705 388,304 422,388 389,000 less: Capital consumption 42,582 43,752 48,436 51,674 54,222
Net value added 381,101 367,953 339,868 370,714 334,778 less: Payments to stakeholders 206,337 208,302 209,910 205,695 201,839
Employee compensation (total hired labor) 179,917 181,154 183,462 178,581 174,179 Net rent received by nonoperator landlords 8,456 6,730 5,101 5,188 6,065 Real estate and nonreal estate interest 17,964 20,418 21,347 21,926 21,595
Net farm income 174,764 159,651 129,958 165,019 132,939 1 Revised. 2 Value of agricultural sector production is the gross value of the commodities and services produced within a year. Net value-added is the sector’s
contribution to the National economy and is the sum of the income from production earned by all factors-of-production, regardless of ownership. Net farm income is the farm operators’ share of income from the sector’s production activities. The concept presented is consistent with that employed by the Organization for Economic Cooperation and Development.
3 A positive value of inventory change represents current-year production not sold by December 31. A negative value is an offset to production from prior years included in current-year sales.
4 Includes repair and maintenance of capital items, machine hire and customwork, marketing, storage, and transportation expense, contract labor, and miscellaneous expenses.
5 Net government transactions is derived by subtracting motor vehicle registration, licensing fees, and property taxes from direct government payments. Source: Economic Research Service, USDA.
Statistics of Hawaii Agriculture 18
2009 SUGAR AND SPECIALTY CROP HIGHLIGHTS
♦ Sugar Sugar production for 2009 was 176,000 tons of 96o raw sugar, a decrease of 5 percent from the previous year. This was the seventh consecutive year for which raw sugar production levels decreased. Sugar price during 2009 increased 5 percent to $374 per ton of 96o raw sugar, with a total value of $65.8 million, slightly less than the 2008 level of $66.1 million. Hawaii’s sugar plantations were able to harvest 1.3 million tons of sugarcane from 20,300 acres. This production level was 6 percent less than 2008 and also was the seventh year of decline. The average yield for sugarcane harvested in 2009 was 65.6 tons per acre. Going into 2010, Hawaii has only one remaining sugar plantation. The sugar plantation on Kauai County shut down their growing operation in 2009. This operation has continuously grown sugarcane since 1892.
♦ Coffee
Coffee growers harvested 6,300 acres of coffee during the 2009-2010 growing season, unchanged from the previous year. Production levels, at 8.7 million pounds (parchment equivalent basis), were identical to the 2008-2009 production estimate. The average farm price for coffee from the 2009-2010 season was $3.60 (parchment equivalent basis), up 20.0 cents from the 2008-2009 average price. Total farm revenues generated was an estimated $31.3 million (parchment equivalent basis), 6 percent higher than the revised 2008-2009 value of $29.6 million.
Macadamia Nuts Hawaii Macadamia nut growers delivered an estimated 50.0 million pounds of macadamia nuts (wet-in-shell) to processors during the 2009-2010 season. About 16 percent of the harvest was culled, resulting in 42.0 million pounds (net, wet-in-shell), which represents an 8.0 million pound or 16 percent decrease from last season. Losses from immature and moldy, rotten nuts accounted for more than half of the losses. Damage from insects, Koa Seed Worm, Tropical Nut Borer, and Stink Bug, was another cause being reported by growers and processors. Dry weather contributed to this season’s lower output. Other factors contributing to the smaller harvest were higher cost of inputs, wild pigs consuming nuts on the ground, and damage to flowers due to the vog. The macadamia nut industry has experienced difficult marketing conditions during these past years. Growers commented that harvesting their nuts has not been feasible and processors have limited their nut purchases. Overall yields averaged 2,800 pounds per acre (net, wet-in-shell basis) for the 2009-2010 season, or 500 pounds less than the previous season. Total acreage and harvested acreage for the 2009-2010 season remained unchanged at 17,000 and 15,000 acres, respectively. The farm price for (net, wet-in-shell) macadamia nuts averaged 70.0 cents per pound, 3.0 cents higher than the 2008-2009 average and highest since the 81.0 cents average price estimated for the 2005-2006 season. The record-high average price is 90.0 cents set in 1988.
19 Statistics of Hawaii Agriculture
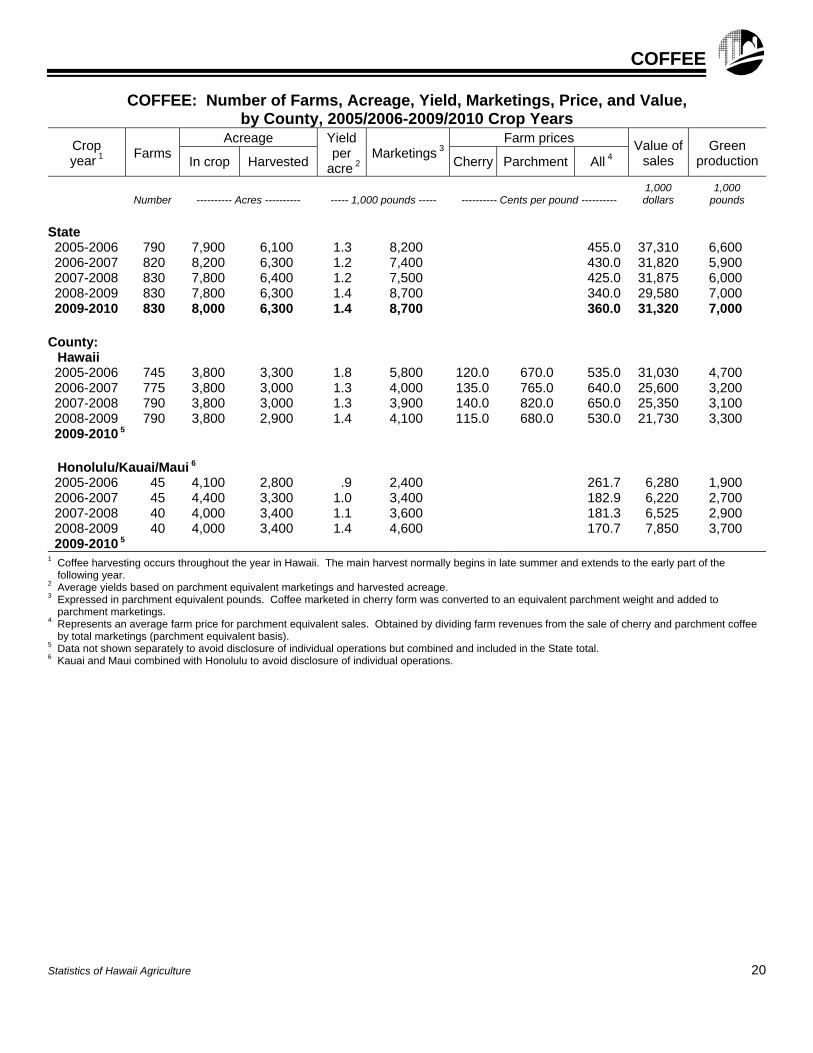
COFFEE
COFFEE: Number of Farms, Acreage, Yield, Marketings, Price, and Value, by County, 2005/2006-2009/2010 Crop Years
Crop year 1
Farms Acreage Yield
per acre 2
Marketings 3Farm prices
Value ofsales
Green production In crop Harvested Cherry Parchment All 4
Number
---------- Acres ----------
----- 1,000 pounds -----
---------- Cents per pound ----------
1,000 dollars
1,000 pounds
State
2005-2006 790 7,900 6,100 1.3 8,200 455.0 37,310 6,600 2006-2007 820 8,200 6,300 1.2 7,400 430.0 31,820 5,900 2007-2008 830 7,800 6,400 1.2 7,500 425.0 31,875 6,000 2008-2009 830 7,800 6,300 1.4 8,700 340.0 29,580 7,000 2009-2010 830 8,000 6,300 1.4 8,700 360.0 31,320 7,000
County: Hawaii 2005-2006 745 3,800 3,300 1.8 5,800 120.0 670.0 535.0 31,030 4,700 2006-2007 775 3,800 3,000 1.3 4,000 135.0 765.0 640.0 25,600 3,200 2007-2008 790 3,800 3,000 1.3 3,900 140.0 820.0 650.0 25,350 3,100 2008-2009 790 3,800 2,900 1.4 4,100 115.0 680.0 530.0 21,730 3,300 2009-2010 5
Honolulu/Kauai/Maui 6 2005-2006 45 4,100 2,800 .9 2,400 261.7 6,280 1,900 2006-2007 45 4,400 3,300 1.0 3,400 182.9 6,220 2,700 2007-2008 40 4,000 3,400 1.1 3,600 181.3 6,525 2,900 2008-2009 40 4,000 3,400 1.4 4,600 170.7 7,850 3,700 2009-2010 5
1 Coffee harvesting occurs throughout the year in Hawaii. The main harvest normally begins in late summer and extends to the early part of the following year.
2 Average yields based on parchment equivalent marketings and harvested acreage. 3 Expressed in parchment equivalent pounds. Coffee marketed in cherry form was converted to an equivalent parchment weight and added to
parchment marketings. 4 Represents an average farm price for parchment equivalent sales. Obtained by dividing farm revenues from the sale of cherry and parchment coffee
by total marketings (parchment equivalent basis). 5 Data not shown separately to avoid disclosure of individual operations but combined and included in the State total. 6 Kauai and Maui combined with Honolulu to avoid disclosure of individual operations.
Statistics of Hawaii Agriculture 20

GINGER ROOT The ginger root estimating program was discontinued beginning with the 2009-2010 season. Harvested acreage, yield, and production will continue to be available every five years in the Census of Agriculture with the
upcoming reference year of 2012. Estimated acreage for the 2008-2009 season was half the area devoted for ginger root production when compared to the 2005-2006.
GINGER ROOT: Acreage, Yield, Production, Price, and Value, State of Hawaii, 2005/2006-2009/2010 Crop Years
Crop year 1 Harvested acres Yield per acre Production Farm price Value of sales
------------------ 1,000 pounds ------------------ Cents per pound 1,000 dollars
2005-2006 100 43.0 4,300 70.0 3,010 2006-2007 80 35.0 2,800 85.0 2,380 2007-2008 60 30.0 1,800 160.0 2,880 2008-2009 50 32.0 1,600 140.0 2,240 2009-2010 2
1 Harvesting normally begins in December and continues into the following year. 2 Beginning 2009, data series discontinued.
GINGER ROOT: U.S. Imports, 2005-2009
Year Unground (including
fresh) 1 Ground 2 Sweet 3 Candied 4 Total
1,000 pounds
2005 5 66,863 3,742 7,578 3,472 5 81,655 2006 5 66,738 3,029 8,034 4,268 5 84,069 2007 5 75,082 3,206 9,468 4,568 5 92,324 2008 91,456 2,119 12,064 4,068 109,707 2009 92,102 1,651 10,971 3,569 108,293
1 Harmonized number 0910.10.2000. 2 Harmonized number 0910.10.4000. 3 Preserved by Nesoi, harmonized number 2008.99.6300. 4 Harmonized number 2006.00.3000. 5 Revised. Source: USDA – Foreign Agriculture Services, Global Agricultural Trade System.
21 Statistics of Hawaii Agriculture
HERBS, SEED CROPS
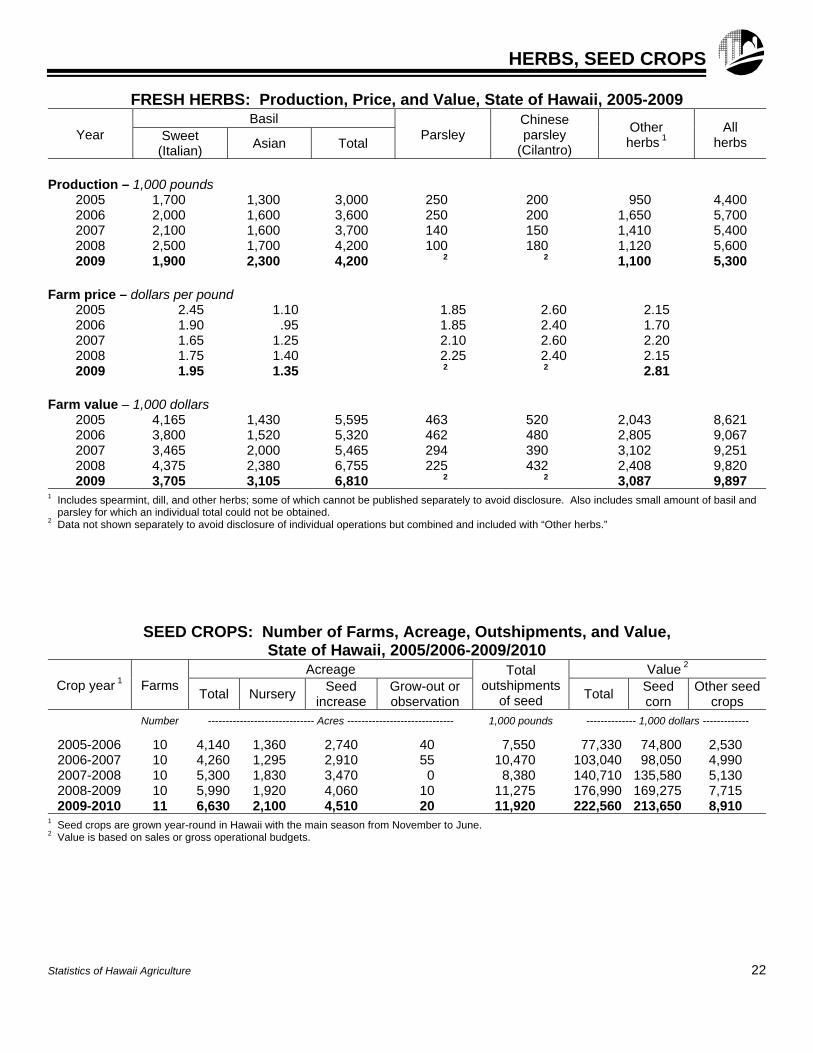
FRESH HERBS: Production, Price, and Value, State of Hawaii, 2005-2009
Year Basil
Parsley Chinese parsley
(Cilantro)
Other herbs 1
All herbs Sweet
(Italian) Asian Total
Production – 1,000 pounds
2005 1,700 1,300 3,000 250 200 950 4,400 2006 2,000 1,600 3,600 250 200 1,650 5,700 2007 2,100 1,600 3,700 140 150 1,410 5,400 2008 2,500 1,700 4,200 100 180 1,120 5,600 2009 1,900 2,300 4,200 2 2 1,100 5,300
Farm price – dollars per pound
2005 2.45 1.10 1.85 2.60 2.15 2006 1.90 .95 1.85 2.40 1.70 2007 1.65 1.25 2.10 2.60 2.20 2008 1.75 1.40 2.25 2.40 2.15 2009 1.95 1.35 2 2 2.81
Farm value – 1,000 dollars
2005 4,165 1,430 5,595 463 520 2,043 8,621 2006 3,800 1,520 5,320 462 480 2,805 9,067 2007 3,465 2,000 5,465 294 390 3,102 9,251 2008 4,375 2,380 6,755 225 432 2,408 9,820 2009 3,705 3,105 6,810 2 2 3,087 9,897
1 Includes spearmint, dill, and other herbs; some of which cannot be published separately to avoid disclosure. Also includes small amount of basil and parsley for which an individual total could not be obtained.
2 Data not shown separately to avoid disclosure of individual operations but combined and included with “Other herbs.”
SEED CROPS: Number of Farms, Acreage, Outshipments, and Value, State of Hawaii, 2005/2006-2009/2010
Crop year 1 Farms Acreage Total
outshipments of seed
Value 2
Total Nursery Seed
increase Grow-out or observation
Total Seed corn
Other seed crops
Number ------------------------------ Acres ------------------------------ 1,000 pounds -------------- 1,000 dollars -------------
2005-2006 10 4,140 1,360 2,740 40 7,550 77,330 74,800 2,530 2006-2007 10 4,260 1,295 2,910 55 10,470 103,040 98,050 4,990 2007-2008 10 5,300 1,830 3,470 0 8,380 140,710 135,580 5,130 2008-2009 10 5,990 1,920 4,060 10 11,275 176,990 169,275 7,715 2009-2010 11 6,630 2,100 4,510 20 11,920 222,560 213,650 8,910
1 Seed crops are grown year-round in Hawaii with the main season from November to June. 2 Value is based on sales or gross operational budgets.
Statistics of Hawaii Agriculture 22
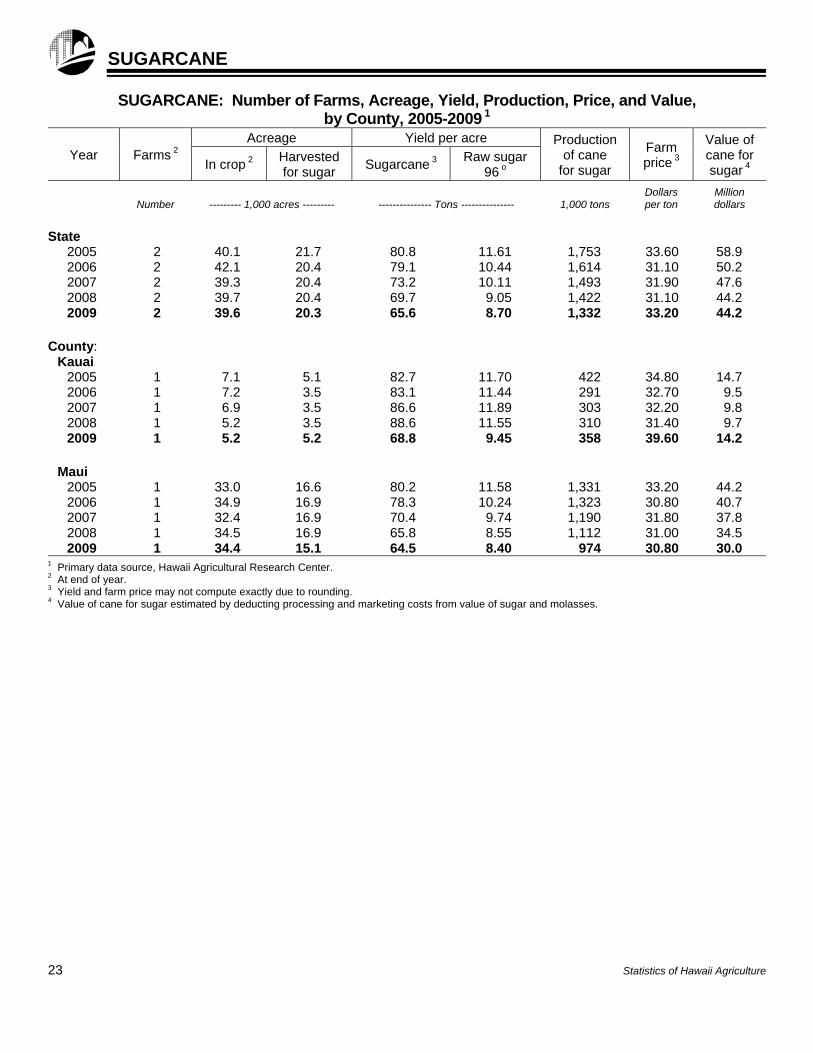
SUGARCANE
SUGARCANE: Number of Farms, Acreage, Yield, Production, Price, and Value, by County, 2005-2009 1
Year Farms 2 Acreage Yield per acre Production
of cane for sugar
Farm price 3
Value of cane for sugar 4 In crop 2
Harvested for sugar
Sugarcane 3 Raw sugar
96 o
Number
--------- 1,000 acres ---------
--------------- Tons ---------------
1,000 tons
Dollars per ton
Million dollars
State
2005 2 40.1 21.7 80.8 11.61 1,753 33.60 58.9 2006 2 42.1 20.4 79.1 10.44 1,614 31.10 50.2 2007 2 39.3 20.4 73.2 10.11 1,493 31.90 47.6 2008 2 39.7 20.4 69.7 9.05 1,422 31.10 44.2 2009 2 39.6 20.3 65.6 8.70 1,332 33.20 44.2
County: Kauai
2005 1 7.1 5.1 82.7 11.70 422 34.80 14.7 2006 1 7.2 3.5 83.1 11.44 291 32.70 9.5 2007 1 6.9 3.5 86.6 11.89 303 32.20 9.8 2008 1 5.2 3.5 88.6 11.55 310 31.40 9.7 2009 1 5.2 5.2 68.8 9.45 358 39.60 14.2
Maui 2005 1 33.0 16.6 80.2 11.58 1,331 33.20 44.2 2006 1 34.9 16.9 78.3 10.24 1,323 30.80 40.7 2007 1 32.4 16.9 70.4 9.74 1,190 31.80 37.8 2008 1 34.5 16.9 65.8 8.55 1,112 31.00 34.5 2009 1 34.4 15.1 64.5 8.40 974 30.80 30.0
1 Primary data source, Hawaii Agricultural Research Center. 2 At end of year. 3 Yield and farm price may not compute exactly due to rounding. 4 Value of cane for sugar estimated by deducting processing and marketing costs from value of sugar and molasses.
23 Statistics of Hawaii Agriculture
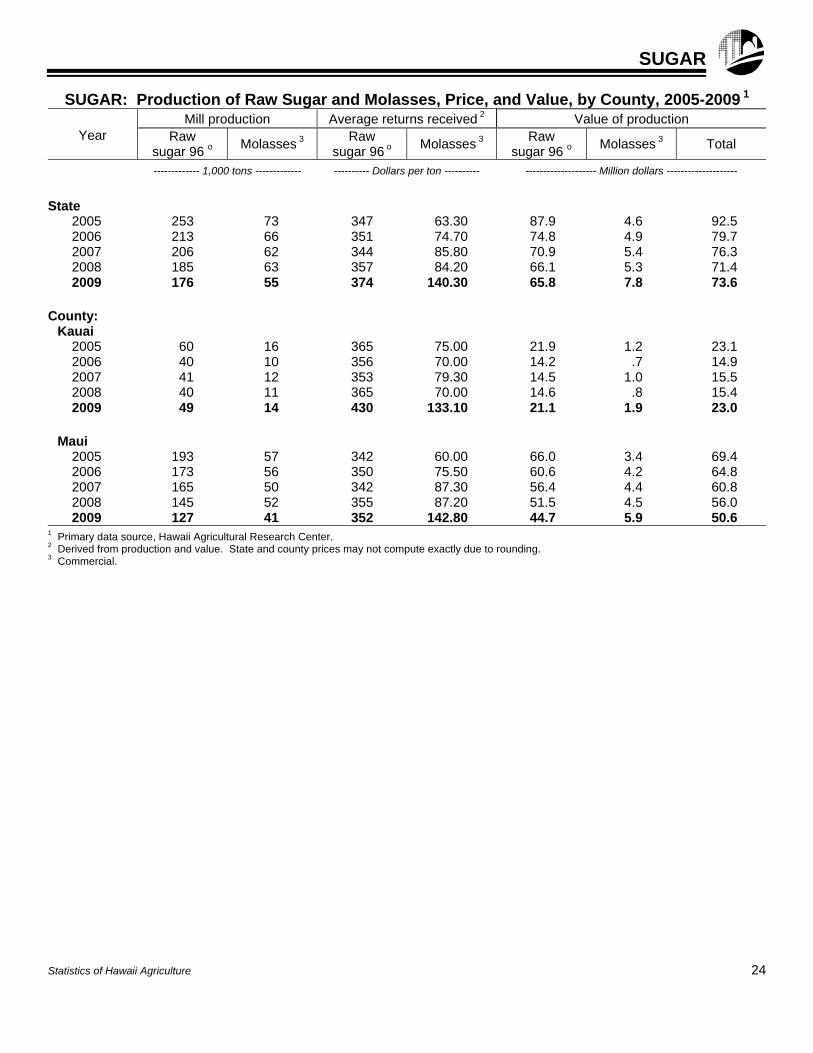
SUGAR
SUGAR: Production of Raw Sugar and Molasses, Price, and Value, by County, 2005-2009 1
Year Mill production Average returns received 2 Value of production
Raw sugar 96 o
Molasses 3 Raw
sugar 96 o Molasses 3
Raw sugar 96 o
Molasses 3 Total
------------- 1,000 tons ------------- ---------- Dollars per ton ---------- -------------------- Million dollars --------------------
State
2005 253 73 347 63.30 87.9 4.6 92.5 2006 213 66 351 74.70 74.8 4.9 79.7 2007 206 62 344 85.80 70.9 5.4 76.3 2008 185 63 357 84.20 66.1 5.3 71.4 2009 176 55 374 140.30 65.8 7.8 73.6
County:
Kauai 2005 60 16 365 75.00 21.9 1.2 23.1 2006 40 10 356 70.00 14.2 .7 14.9 2007 41 12 353 79.30 14.5 1.0 15.5 2008 40 11 365 70.00 14.6 .8 15.4 2009 49 14 430 133.10 21.1 1.9 23.0
Maui 2005 193 57 342 60.00 66.0 3.4 69.4 2006 173 56 350 75.50 60.6 4.2 64.8 2007 165 50 342 87.30 56.4 4.4 60.8 2008 145 52 355 87.20 51.5 4.5 56.0 2009 127 41 352 142.80 44.7 5.9 50.6
1 Primary data source, Hawaii Agricultural Research Center. 2 Derived from production and value. State and county prices may not compute exactly due to rounding. 3 Commercial.
Statistics of Hawaii Agriculture 24
0
10
20
30
40
50
60
70
0
5
10
15
20
25
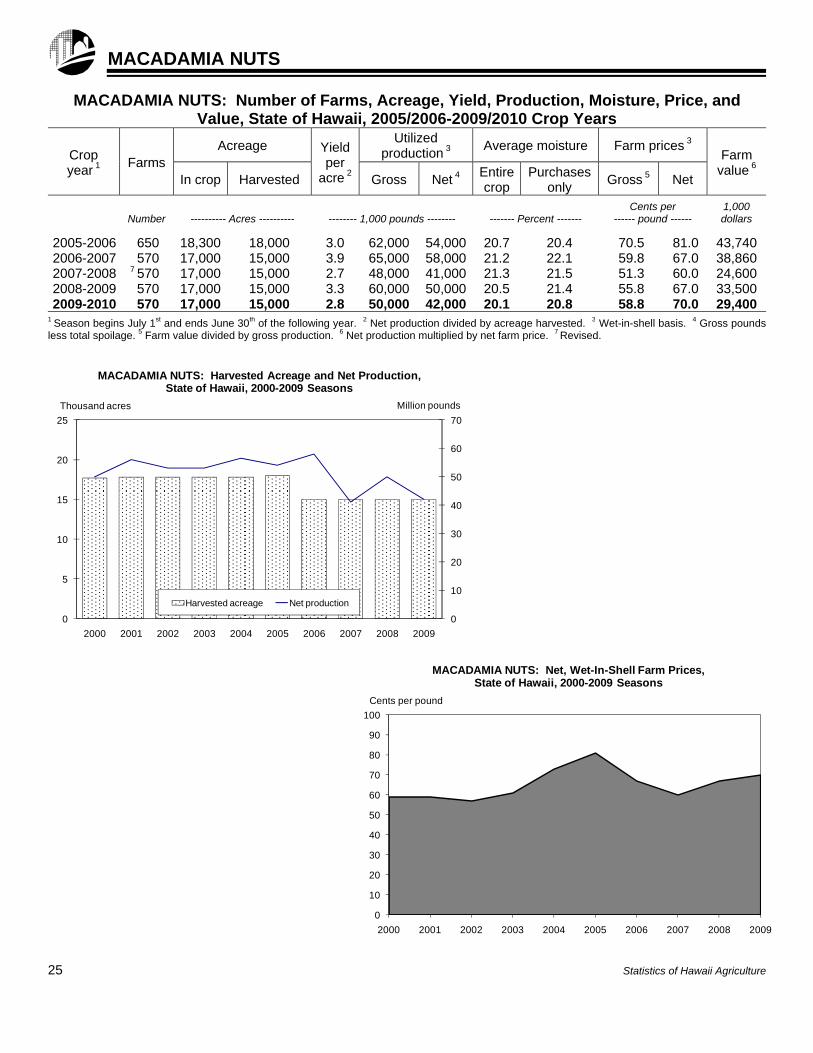
2000 2001 2002 2003 2004 2005 2006 2007 2008 2009
Million poundsThousand acres
MACADAMIA NUTS: Harvested Acreage and Net Production,State of Hawaii, 2000-2009 Seasons
Harvested acreage Net production
0
10
20
30
40
50
60
70
80
90
100
2000 2001 2002 2003 2004 2005 2006 2007 2008 2009
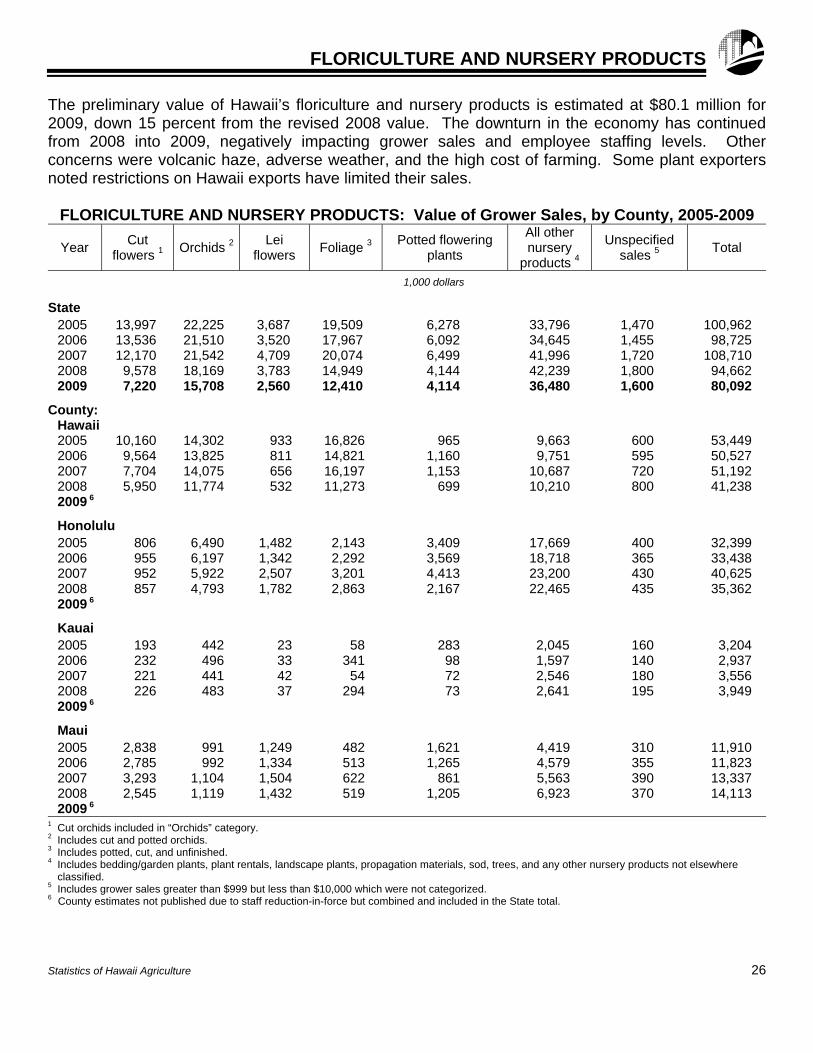
Cents per pound
MACADAMIA NUTS: Net, Wet-In-Shell Farm Prices,State of Hawaii, 2000-2009 Seasons
MACADAMIA NUTS
MACADAMIA NUTS: Number of Farms, Acreage, Yield, Production, Moisture, Price, and Value, State of Hawaii, 2005/2006-2009/2010 Crop Years
Crop year 1
Farms Acreage Yield
per acre 2
Utilized production 3
Average moisture Farm prices 3 Farm
value 6 In crop Harvested Gross Net 4
Entirecrop
Purchases only
Gross 5 Net
Number
---------- Acres ----------
-------- 1,000 pounds --------
------- Percent -------
Cents per ------ pound ------
1,000 dollars
2005-2006 650 18,300 18,000 3.0 62,000 54,000 20.7 20.4 70.5 81.0 43,740 2006-2007 570 17,000 15,000 3.9 65,000 58,000 21.2 22.1 59.8 67.0 38,860 2007-2008 7 570 17,000 15,000 2.7 48,000 41,000 21.3 21.5 51.3 60.0 24,600 2008-2009 570 17,000 15,000 3.3 60,000 50,000 20.5 21.4 55.8 67.0 33,500 2009-2010 570 17,000 15,000 2.8 50,000 42,000 20.1 20.8 58.8 70.0 29,400
1 Season begins July 1st and ends June 30th of the following year. 2 Net production divided by acreage harvested. 3 Wet-in-shell basis. 4 Gross pounds less total spoilage. 5 Farm value divided by gross production. 6 Net production multiplied by net farm price. 7 Revised.
25 Statistics of Hawaii Agriculture
FLORICULTURE AND NURSERY PRODUCTS
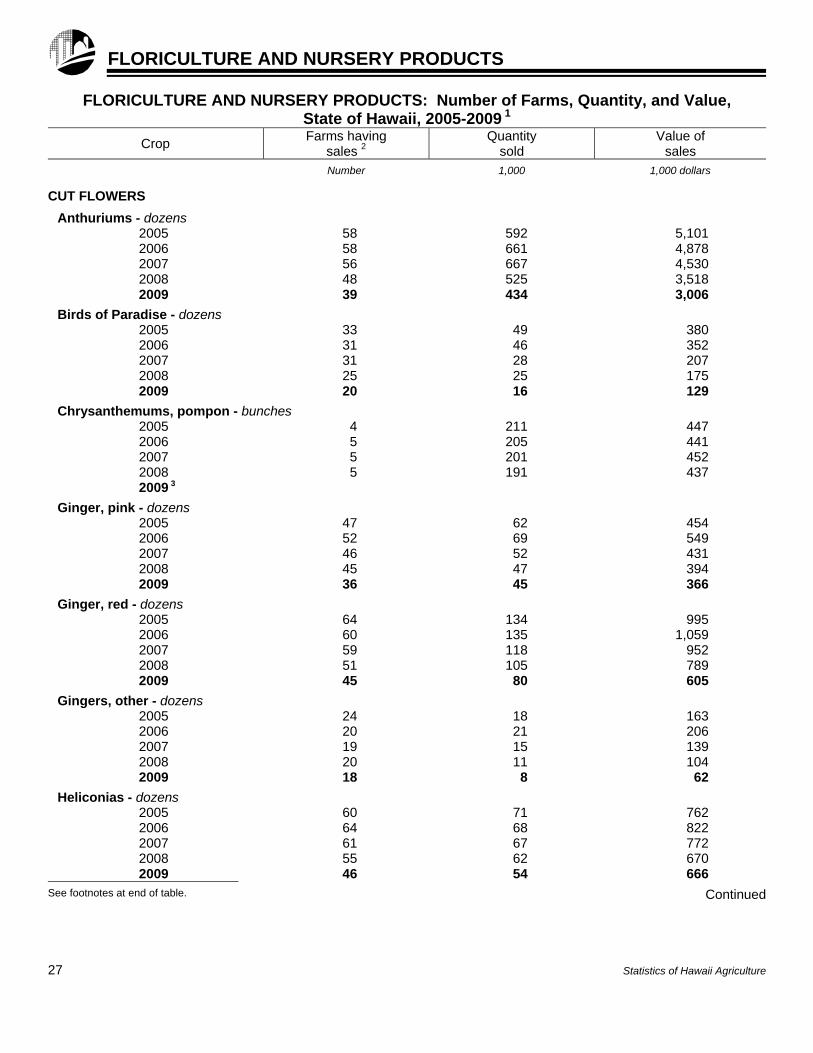
The preliminary value of Hawaii’s floriculture and nursery products is estimated at $80.1 million for 2009, down 15 percent from the revised 2008 value. The downturn in the economy has continued from 2008 into 2009, negatively impacting grower sales and employee staffing levels. Other concerns were volcanic haze, adverse weather, and the high cost of farming. Some plant exporters noted restrictions on Hawaii exports have limited their sales.
FLORICULTURE AND NURSERY PRODUCTS: Value of Grower Sales, by County, 2005-2009
Year Cut
flowers 1 Orchids 2
Lei flowers
Foliage 3 Potted flowering
plants
All other nursery
products 4
Unspecified sales 5
Total
1,000 dollars
State
2005 13,997 22,225 3,687 19,509 6,278 33,796 1,470 100,962 2006 13,536 21,510 3,520 17,967 6,092 34,645 1,455 98,725 2007 12,170 21,542 4,709 20,074 6,499 41,996 1,720 108,710 2008 9,578 18,169 3,783 14,949 4,144 42,239 1,800 94,662 2009 7,220 15,708 2,560 12,410 4,114 36,480 1,600 80,092
County:
Hawaii 2005 10,160 14,302 933 16,826 965 9,663 600 53,449 2006 9,564 13,825 811 14,821 1,160 9,751 595 50,527 2007 7,704 14,075 656 16,197 1,153 10,687 720 51,192 2008 5,950 11,774 532 11,273 699 10,210 800 41,238 2009 6
Honolulu
2005 806 6,490 1,482 2,143 3,409 17,669 400 32,399 2006 955 6,197 1,342 2,292 3,569 18,718 365 33,438 2007 952 5,922 2,507 3,201 4,413 23,200 430 40,625 2008 857 4,793 1,782 2,863 2,167 22,465 435 35,362 2009 6
Kauai
2005 193 442 23 58 283 2,045 160 3,204 2006 232 496 33 341 98 1,597 140 2,937 2007 221 441 42 54 72 2,546 180 3,556 2008 226 483 37 294 73 2,641 195 3,949 2009 6
Maui
2005 2,838 991 1,249 482 1,621 4,419 310 11,910 2006 2,785 992 1,334 513 1,265 4,579 355 11,823 2007 3,293 1,104 1,504 622 861 5,563 390 13,337 2008 2,545 1,119 1,432 519 1,205 6,923 370 14,113 2009 6
1 Cut orchids included in “Orchids” category. 2 Includes cut and potted orchids. 3 Includes potted, cut, and unfinished. 4 Includes bedding/garden plants, plant rentals, landscape plants, propagation materials, sod, trees, and any other nursery products not elsewhere
classified. 5 Includes grower sales greater than $999 but less than $10,000 which were not categorized. 6 County estimates not published due to staff reduction-in-force but combined and included in the State total.
Statistics of Hawaii Agriculture 26
FLORICULTURE AND NURSERY PRODUCTS
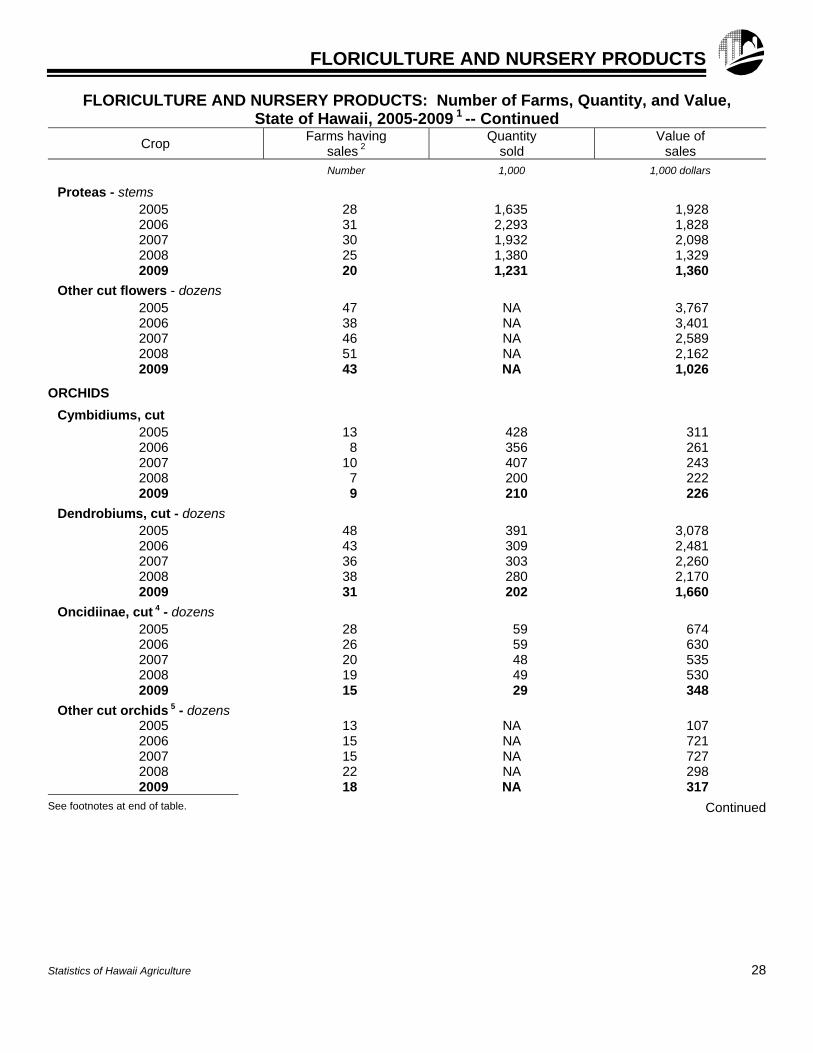
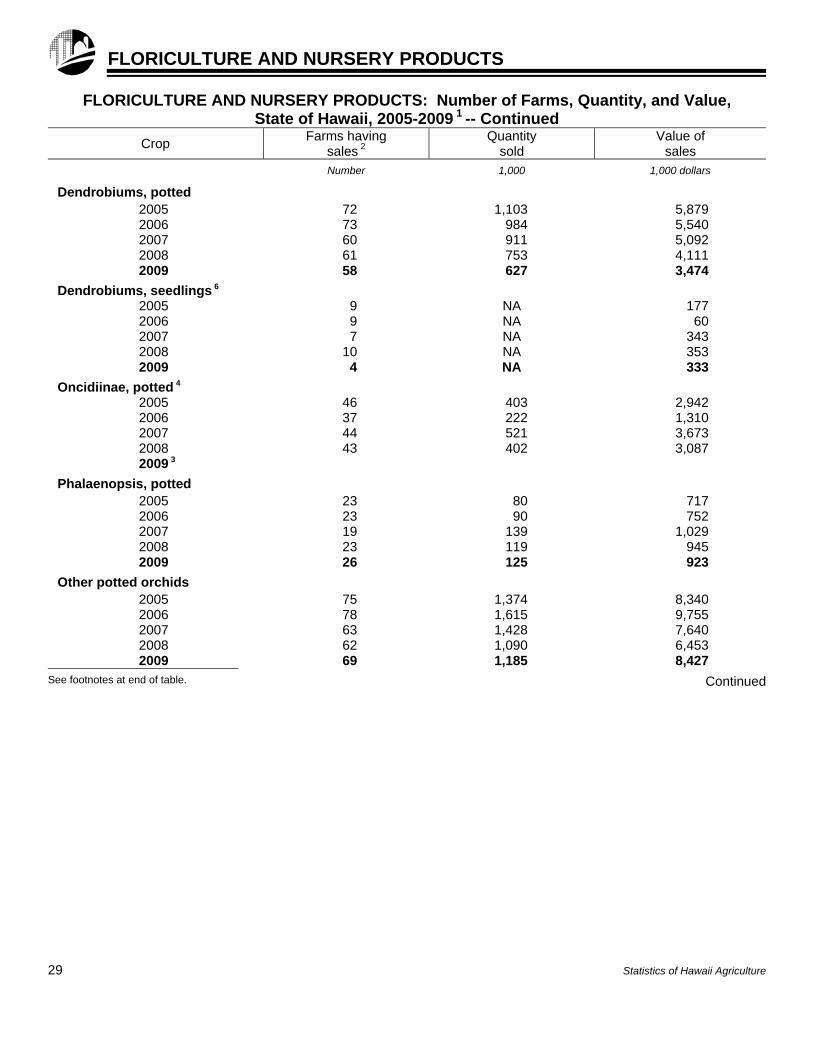
FLORICULTURE AND NURSERY PRODUCTS: Number of Farms, Quantity, and Value, State of Hawaii, 2005-2009 1
Crop Farms having
sales 2 Quantity
sold Value of
sales
Number 1,000 1,000 dollars
CUT FLOWERS
Anthuriums - dozens 2005 58 592 5,101 2006 58 661 4,878 2007 56 667 4,530 2008 48 525 3,518 2009 39 434 3,006
Birds of Paradise - dozens 2005 33 49 380 2006 31 46 352 2007 31 28 207 2008 25 25 175 2009 20 16 129
Chrysanthemums, pompon - bunches 2005 4 211 447 2006 5 205 441 2007 5 201 452 2008 5 191 437 2009 3
Ginger, pink - dozens 2005 47 62 454 2006 52 69 549 2007 46 52 431 2008 45 47 394 2009 36 45 366
Ginger, red - dozens 2005 64 134 995 2006 60 135 1,059 2007 59 118 952 2008 51 105 789 2009 45 80 605
Gingers, other - dozens 2005 24 18 163 2006 20 21 206 2007 19 15 139 2008 20 11 104 2009 18 8 62
Heliconias - dozens 2005 60 71 762 2006 64 68 822 2007 61 67 772 2008 55 62 670 2009 46 54 666
See footnotes at end of table. Continued
27 Statistics of Hawaii Agriculture
FLORICULTURE AND NURSERY PRODUCTS
FLORICULTURE AND NURSERY PRODUCTS: Number of Farms, Quantity, and Value, State of Hawaii, 2005-2009 1 -- Continued
Crop Farms having
sales 2 Quantity
sold Value of
sales
Number 1,000 1,000 dollars
Proteas - stems 2005 28 1,635 1,928 2006 31 2,293 1,828 2007 30 1,932 2,098 2008 25 1,380 1,329 2009 20 1,231 1,360
Other cut flowers - dozens 2005 47 NA 3,767 2006 38 NA 3,401 2007 46 NA 2,589 2008 51 NA 2,162 2009 43 NA 1,026
ORCHIDS
Cymbidiums, cut 2005 13 428 311 2006 8 356 261 2007 10 407 243 2008 7 200 222 2009 9 210 226
Dendrobiums, cut - dozens 2005 48 391 3,078 2006 43 309 2,481 2007 36 303 2,260 2008 38 280 2,170 2009 31 202 1,660
Oncidiinae, cut 4 - dozens 2005 28 59 674 2006 26 59 630 2007 20 48 535 2008 19 49 530 2009 15 29 348
Other cut orchids 5 - dozens 2005 13 NA 107 2006 15 NA 721 2007 15 NA 727 2008 22 NA 298 2009 18 NA 317
See footnotes at end of table. Continued
Statistics of Hawaii Agriculture 28
FLORICULTURE AND NURSERY PRODUCTS
FLORICULTURE AND NURSERY PRODUCTS: Number of Farms, Quantity, and Value, State of Hawaii, 2005-2009 1 -- Continued
Crop Farms having
sales 2 Quantity
sold Value of
sales
Number 1,000 1,000 dollars
Dendrobiums, potted 2005 72 1,103 5,879 2006 73 984 5,540 2007 60 911 5,092 2008 61 753 4,111 2009 58 627 3,474
Dendrobiums, seedlings 6 2005 9 NA 177 2006 9 NA 60 2007 7 NA 343 2008 10 NA 353 2009 4 NA 333
Oncidiinae, potted 4 2005 46 403 2,942 2006 37 222 1,310 2007 44 521 3,673 2008 43 402 3,087 2009 3
Phalaenopsis, potted 2005 23 80 717 2006 23 90 752 2007 19 139 1,029 2008 23 119 945 2009 26 125 923
Other potted orchids 2005 75 1,374 8,340 2006 78 1,615 9,755 2007 63 1,428 7,640 2008 62 1,090 6,453 2009 69 1,185 8,427
See footnotes at end of table. Continued
29 Statistics of Hawaii Agriculture
FLORICULTURE AND NURSERY PRODUCTS
FLORICULTURE AND NURSERY PRODUCTS: Number of Farms, Quantity, and Value, State of Hawaii, 2005-2009 1 -- Continued
Crop Farms having
sales 2 Quantity
sold Value of
sales
Number 1,000 1,000 dollars
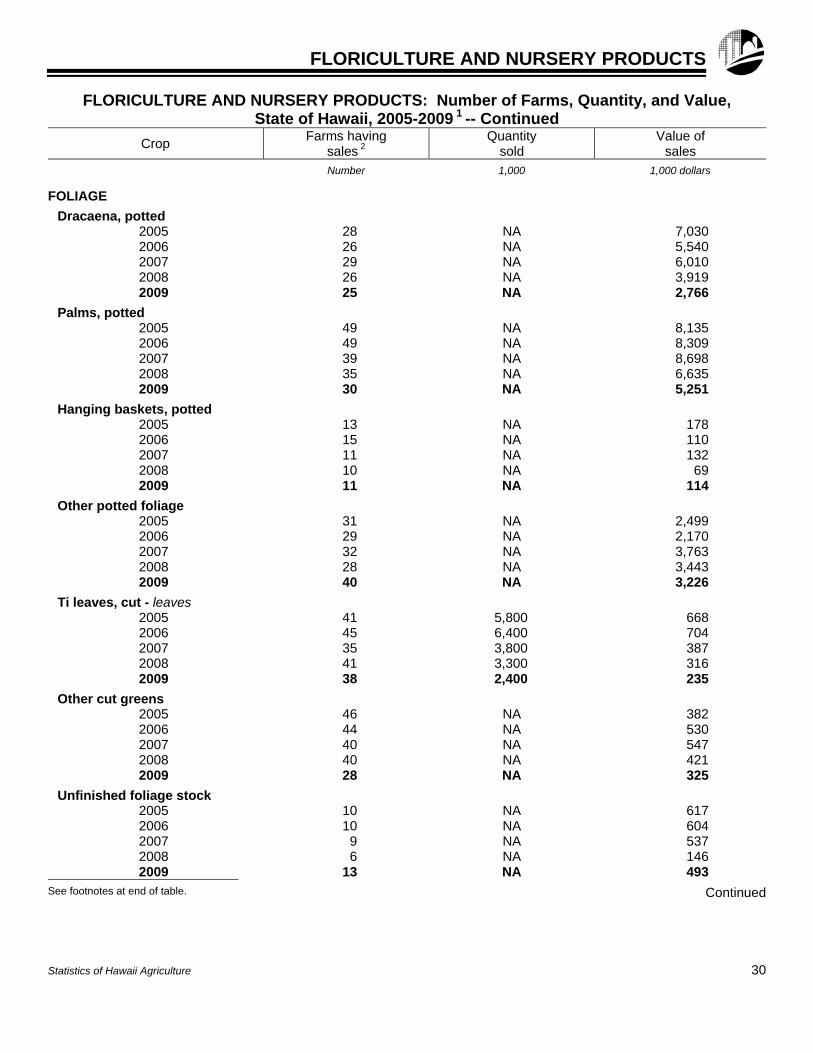
FOLIAGE
Dracaena, potted 2005 28 NA 7,030 2006 26 NA 5,540 2007 29 NA 6,010 2008 26 NA 3,919 2009 25 NA 2,766
Palms, potted 2005 49 NA 8,135 2006 49 NA 8,309 2007 39 NA 8,698 2008 35 NA 6,635 2009 30 NA 5,251
Hanging baskets, potted 2005 13 NA 178 2006 15 NA 110 2007 11 NA 132 2008 10 NA 69 2009 11 NA 114
Other potted foliage 2005 31 NA 2,499 2006 29 NA 2,170 2007 32 NA 3,763 2008 28 NA 3,443 2009 40 NA 3,226
Ti leaves, cut - leaves 2005 41 5,800 668 2006 45 6,400 704 2007 35 3,800 387 2008 41 3,300 316 2009 38 2,400 235
Other cut greens 2005 46 NA 382 2006 44 NA 530 2007 40 NA 547 2008 40 NA 421 2009 28 NA 325
Unfinished foliage stock 2005 10 NA 617 2006 10 NA 604 2007 9 NA 537 2008 6 NA 146 2009 13 NA 493
See footnotes at end of table. Continued
Statistics of Hawaii Agriculture 30
FLORICULTURE AND NURSERY PRODUCTS
FLORICULTURE AND NURSERY PRODUCTS: Number of Farms, Quantity, and Value, State of Hawaii, 2005-2009 1 -- Continued
Crop Farms having
sales 2 Quantity
sold Value of
sales
Number 1,000 1,000 dollars
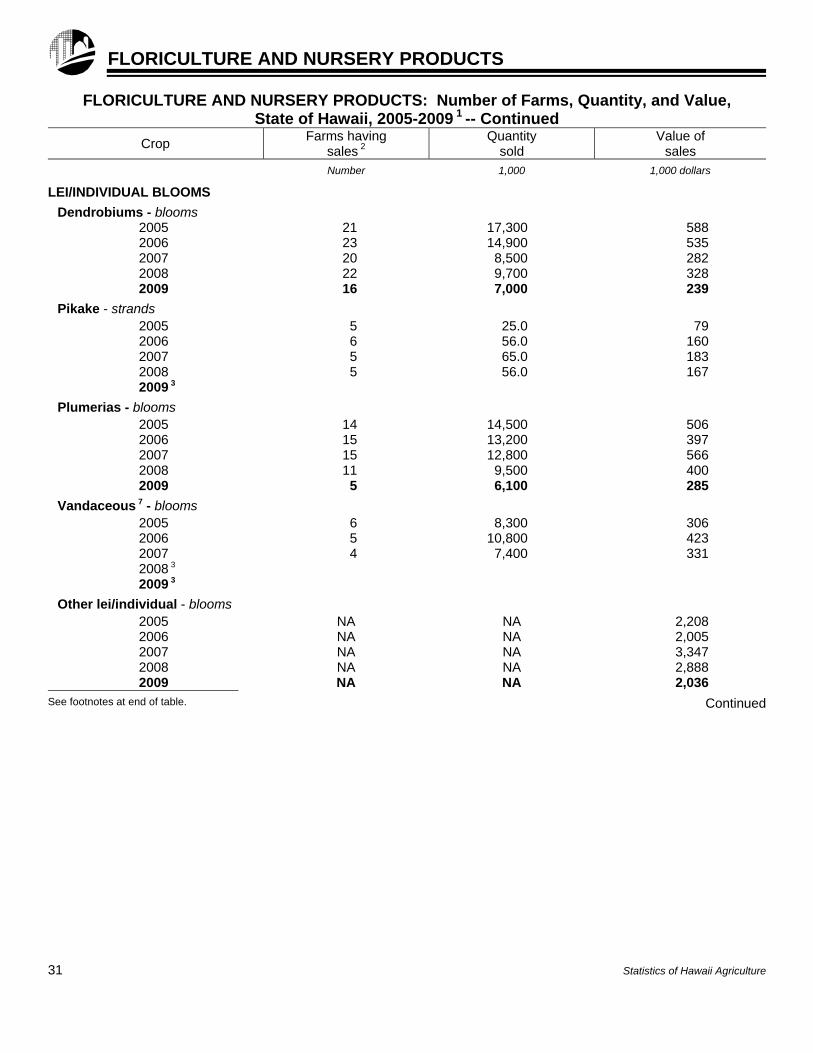
LEI/INDIVIDUAL BLOOMS
Dendrobiums - blooms 2005 21 17,300 588 2006 23 14,900 535 2007 20 8,500 282 2008 22 9,700 328 2009 16 7,000 239
Pikake - strands 2005 5 25.0 79 2006 6 56.0 160 2007 5 65.0 183 2008 5 56.0 167 2009 3
Plumerias - blooms 2005 14 14,500 506 2006 15 13,200 397 2007 15 12,800 566 2008 11 9,500 400 2009 5 6,100 285
Vandaceous 7 - blooms 2005 6 8,300 306 2006 5 10,800 423 2007 4 7,400 331 2008 3 2009 3
Other lei/individual - blooms 2005 NA NA 2,208 2006 NA NA 2,005 2007 NA NA 3,347 2008 NA NA 2,888 2009 NA NA 2,036
See footnotes at end of table. Continued
31 Statistics of Hawaii Agriculture
FLORICULTURE AND NURSERY PRODUCTS
FLORICULTURE AND NURSERY PRODUCTS: Number of Farms, Quantity, and Value, State of Hawaii, 2005-2009 1 -- Continued
Crop Farms having
sales 2 Quantity
sold Value of
sales
Number 1,000 1,000 dollars
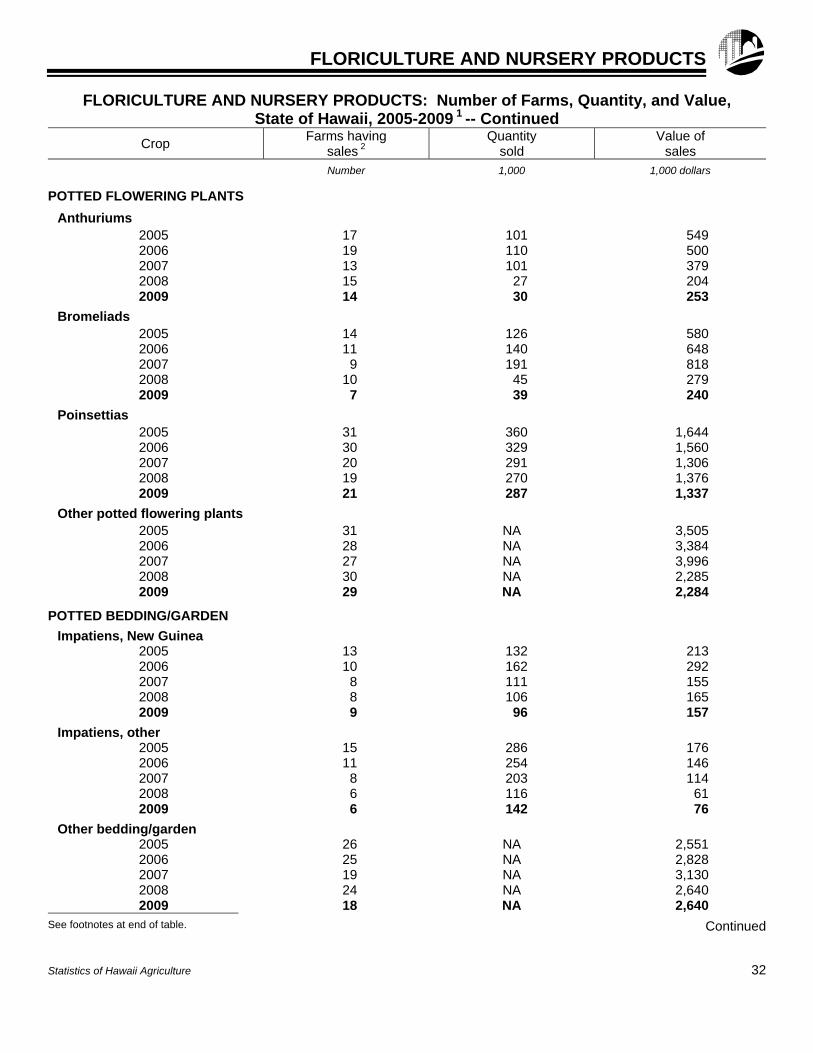
POTTED FLOWERING PLANTS
Anthuriums 2005 17 101 549 2006 19 110 500 2007 13 101 379 2008 15 27 204 2009 14 30 253
Bromeliads 2005 14 126 580 2006 11 140 648 2007 9 191 818 2008 10 45 279 2009 7 39 240
Poinsettias 2005 31 360 1,644 2006 30 329 1,560 2007 20 291 1,306 2008 19 270 1,376 2009 21 287 1,337
Other potted flowering plants 2005 31 NA 3,505 2006 28 NA 3,384 2007 27 NA 3,996 2008 30 NA 2,285 2009 29 NA 2,284
POTTED BEDDING/GARDEN
Impatiens, New Guinea 2005 13 132 213 2006 10 162 292 2007 8 111 155 2008 8 106 165 2009 9 96 157
Impatiens, other 2005 15 286 176 2006 11 254 146 2007 8 203 114 2008 6 116 61 2009 6 142 76
Other bedding/garden 2005 26 NA 2,551 2006 25 NA 2,828 2007 19 NA 3,130 2008 24 NA 2,640 2009 18 NA 2,640
See footnotes at end of table. Continued
Statistics of Hawaii Agriculture 32
FLORICULTURE AND NURSERY PRODUCTS
FLORICULTURE AND NURSERY PRODUCTS: Number of Farms, Quantity, and Value, State of Hawaii, 2005-2009 1 -- Continued
Crop Farms having
sales 2 Quantity
sold Value of
sales
Number 1,000 1,000 dollars
PLANT RENTALS 2005 43 NA 4,931 2006 42 NA 5,199 2007 43 NA 6,830 2008 56 NA 5,943 2009 38 NA 5,309
LANDSCAPE PLANT MATERIAL 8 2005 154 20,887 2006 138 20,813 2007 164 27,660 2008 163 29,112 2009 119 24,018
OTHER NURSERY PRODUCTS 9 2005 5,038 2006 5,367 2007 4,107 2008 4,318 2009 4,280
UNSPECIFIED SALES 10 2005 1,470 2006 1,455 2007 1,720 2008 1,800 2009 1,600
TOTAL 2005 955 100,962 2006 930 98,725 2007 1,060 108,710 2008 1,025 94,662 2009 1,010 80,092
NA = Not available. 1 Includes only producers having total sales of $10,000 or more. 2 Number of farms having sales during that year; “Total” is unduplicated count. 3 Data not shown separately to avoid disclosure of individual operations but combined and included with “Other” category in each section. 4 Prior to 2007, formerly called Oncidium. 5 Includes cattleyas, vandaceous, phalaenopsis, and others. 6 Includes community pots, liners, tissue culture flasks, plugs, etc. 7 Prior to 2007, formerly called Vanda, Miss Joaquim. 8 Includes broadleaf and coniferous evergreens, deciduous and flower trees, palms, and citrus, fruit and nut trees, and sod. Does not include palms or
potted foliage for indoor or patio use, bedding and garden plants, propagative floriculture material, and items which are included in publishedcategories.
9 Includes other flowers or nursery products not elsewhere classified. 10 Includes grower sales greater than $999 but less than $10,000 which were not categorized.
33 Statistics of Hawaii Agriculture
FLORICULTURE AND NURSERY PRODUCTS
FLORICULTURE AND NURSERY PRODUCTS: Number of Farms and Growing Area, by County, 2005-2009
Year Farms Greenhouse1 Artificial shade Open field Total area
Number --------------- 1,000 square feet --------------- ---------------- Acres ----------------
State
2005 955 2,095 27,015 3,320 3,988 2006 930 2,190 25,410 3,430 4,064 2007 1,060 2,020 25,015 3,755 4,376 2008 1,025 2,120 23,570 2,580 3,170 2009 1,010 1,905 24,445 2,140 2,745
County: Hawaii
2005 425 1,445 20,980 1,940 2,455 2006 415 1,450 20,165 2,085 2,581 2007 475 1,435 19,805 2,200 2,688 2008 465 1,520 18,100 1,080 1,530 2009 2
Honolulu 2005 265 275 4,715 660 774 2006 250 255 3,980 610 707 2007 285 140 4,215 695 795 2008 270 165 4,270 600 700 2009 2
Kauai 2005 80 110 525 195 210 2006 75 205 530 215 232 2007 90 90 505 220 234 2008 90 155 500 240 255 2009 2
Maui 2005 185 265 795 525 549 2006 190 280 735 520 544 2007 210 355 490 640 659 2008 200 280 700 660 685 2009 2
1 Glass or glass substitute structure. 2 County estimates not published due to staff reduction-in-force but combined and included in the State total.
Statistics of Hawaii Agriculture 34
FLORICULTURE AND NURSERY PRODUCTS
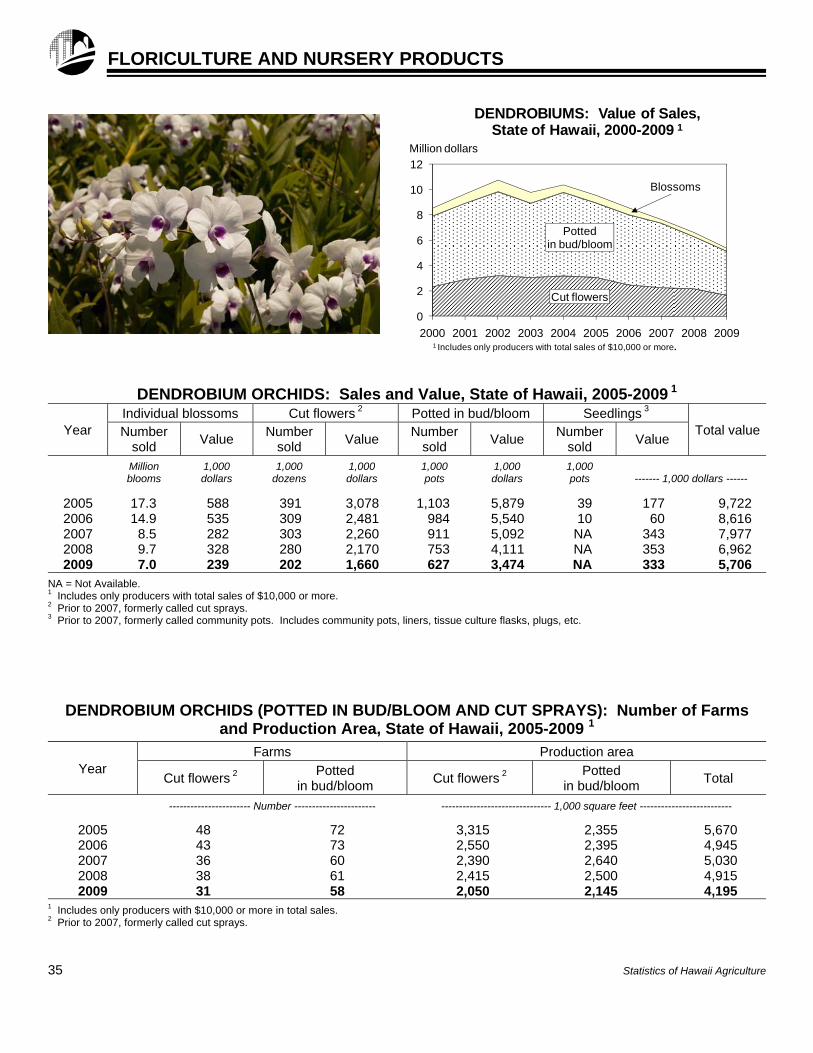
DENDROBIUM ORCHIDS: Sales and Value, State of Hawaii, 2005-2009 1
Year Individual blossoms Cut flowers 2 Potted in bud/bloom Seedlings 3
Total valueNumber sold
Value Number
sold Value
Number sold
Value Number
sold Value
Million blooms
1,000 dollars
1,000 dozens
1,000 dollars
1,000 pots
1,000 dollars
1,000 pots
------- 1,000 dollars ------
2005 17.3 588 391 3,078 1,103 5,879 39 177 9,722 2006 14.9 535 309 2,481 984 5,540 10 60 8,616 2007 8.5 282 303 2,260 911 5,092 NA 343 7,977 2008 9.7 328 280 2,170 753 4,111 NA 353 6,962 2009 7.0 239 202 1,660 627 3,474 NA 333 5,706
NA = Not Available. 1 Includes only producers with total sales of $10,000 or more. 2 Prior to 2007, formerly called cut sprays. 3 Prior to 2007, formerly called community pots. Includes community pots, liners, tissue culture flasks, plugs, etc.
DENDROBIUM ORCHIDS (POTTED IN BUD/BLOOM AND CUT SPRAYS): Number of Farms and Production Area, State of Hawaii, 2005-2009 1
Year Farms Production area
Cut flowers 2 Potted
in bud/bloom Cut flowers 2
Potted in bud/bloom
Total
----------------------- Number ----------------------- ------------------------------- 1,000 square feet --------------------------
2005 48 72 3,315 2,355 5,670 2006 43 73 2,550 2,395 4,945 2007 36 60 2,390 2,640 5,030 2008 38 61 2,415 2,500 4,915 2009 31 58 2,050 2,145 4,195
1 Includes only producers with $10,000 or more in total sales. 2 Prior to 2007, formerly called cut sprays.
35 Statistics of Hawaii Agriculture
Cut flowers
Pottedin bud/bloom
0
2
4
6
8
10
12
2000 2001 2002 2003 2004 2005 2006 2007 2008 2009
Million dollars
1 Includes only producers with total sales of $10,000 or more.
DENDROBIUMS: Value of Sales,State of Hawaii, 2000-2009 1
Blossoms
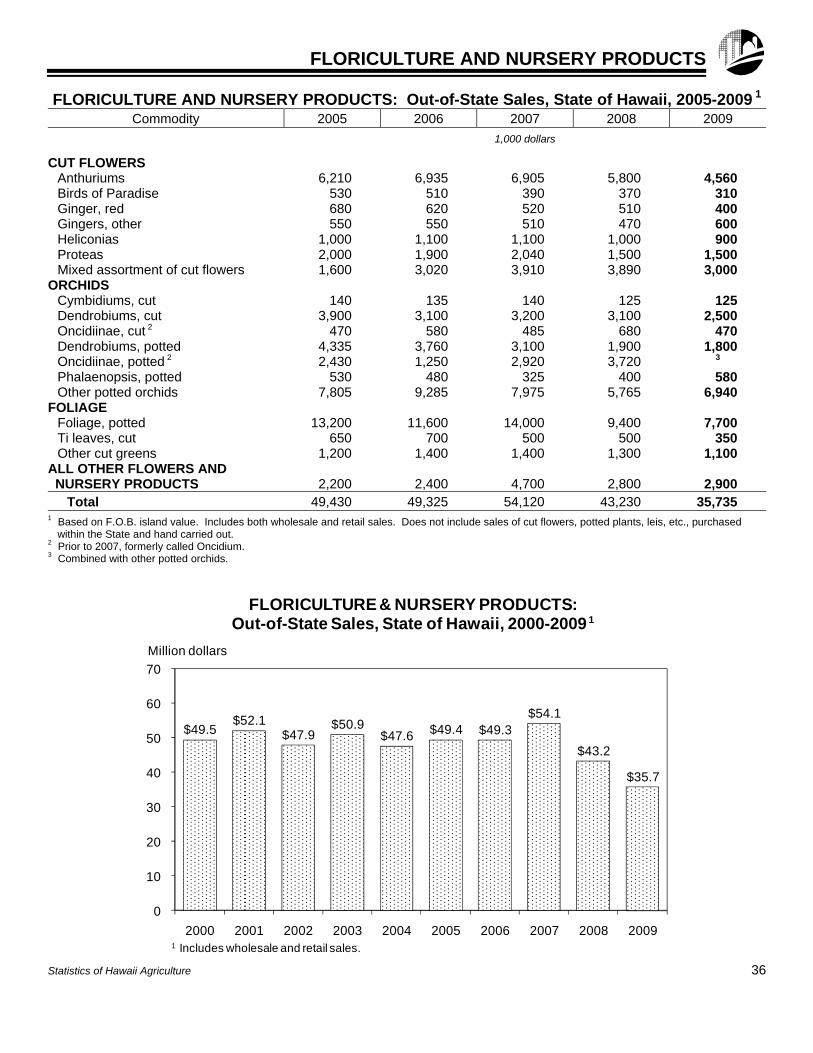
FLORICULTURE AND NURSERY PRODUCTS
FLORICULTURE AND NURSERY PRODUCTS: Out-of-State Sales, State of Hawaii, 2005-2009 1
Commodity 2005 2006 2007 2008 2009
1,000 dollars
CUT FLOWERS Anthuriums 6,210 6,935 6,905 5,800 4,560 Birds of Paradise 530 510 390 370 310 Ginger, red 680 620 520 510 400 Gingers, other 550 550 510 470 600 Heliconias 1,000 1,100 1,100 1,000 900 Proteas 2,000 1,900 2,040 1,500 1,500 Mixed assortment of cut flowers 1,600 3,020 3,910 3,890 3,000
ORCHIDS Cymbidiums, cut 140 135 140 125 125 Dendrobiums, cut 3,900 3,100 3,200 3,100 2,500 Oncidiinae, cut 2 470 580 485 680 470 Dendrobiums, potted 4,335 3,760 3,100 1,900 1,800 Oncidiinae, potted 2 2,430 1,250 2,920 3,720 3
Phalaenopsis, potted 530 480 325 400 580 Other potted orchids 7,805 9,285 7,975 5,765 6,940
FOLIAGE Foliage, potted 13,200 11,600 14,000 9,400 7,700 Ti leaves, cut 650 700 500 500 350 Other cut greens 1,200 1,400 1,400 1,300 1,100
ALL OTHER FLOWERS AND NURSERY PRODUCTS 2,200 2,400 4,700 2,800 2,900
Total 49,430 49,325 54,120 43,230 35,735 1 Based on F.O.B. island value. Includes both wholesale and retail sales. Does not include sales of cut flowers, potted plants, leis, etc., purchased
within the State and hand carried out. 2 Prior to 2007, formerly called Oncidium. 3 Combined with other potted orchids.
Statistics of Hawaii Agriculture 36
$49.5$52.1
$47.9$50.9
$47.6 $49.4 $49.3$54.1
$43.2
$35.7
0
10
20
30
40
50
60
70
2000 2001 2002 2003 2004 2005 2006 2007 2008 2009
Million dollars
1 Includes wholesale and retail sales.
FLORICULTURE & NURSERY PRODUCTS:Out-of-State Sales, State of Hawaii, 2000-2009 1

2009 FRUIT HIGHLIGHTS
Hawaii fruit growers harvested 53.1 million pounds of fruit, excluding pineapples, for fresh and processed utilization in 2009. This was a 4 percent decrease in contrast to comparable levels in 2008. Tropical specialty fruit information was not collected for 2009 due to the loss of state employees from the reduction-in-force action. Overall value, excluding pineapple, rose 7 percent to $25.4 million due to higher banana production and price levels. In 2009, fruit acreage, excluding pineapple, totaled 3,940 acres, 3 percent less than the previous year’s total. Harvested area, excluding pineapple, was down 1 percent to 2,930 acres or a decrease of 40 acres when compared to 2008. The major contributor to this acreage decline was papaya. ♦ Avocado
In 2009, the in crop acreage for avocado increased 10 percent and harvested acreage increased 12 percent when compared to the preceding year with acreage increases of 40 acres for each category. Production increased by 4 percent compared to 2008 levels. Average avocado price received by producers during 2009 fell 4.0 cents or
5 percent below the previous year. Value of sales for 2009 totaled $718 thousand which was $12 thousand or 2 percent below the 2008 crop.
♦ Banana
Both banana in crop and harvested acreage levels for 2009 were unchanged from the previous year. Utilized production was estimated at 18.5 million pounds, up 6 percent or 1.1 million pounds from the 2008 crop. Value of sales for 2009 totaled $10.2 million, up 27 percent or $2.2 million compared to the preceding year’s crop. This notable rise not only attributed increased production, but also a 20 percent or 9.0 cents increase in the average price per pound received by producers.
♦ Guava
Processed guava production was estimated at 2.1 million pounds which was 1.4 million pounds or 40 percent below 2008’s crop. Total acreage for 2009 was estimated at 175 acres, down 5 acres. Harvested acres totaled 135, down 25 acres or 16 percent compared to the previous year. The 2009 value of sales was estimated at $294 thousand which fell $259 thousand or 47 percent lower compared to 2008 levels.
Papaya The State’s papaya growers devoted 2,025 acres toward papaya production, an 8 percent decline from the previous year. Harvested area totaled 1,325 acres, down 4 percent from 2008. Papaya output was also down 6 percent at 31.5 million pounds and the value of sales totaled $14.2 million, 1 percent below 2008.
37 Statistics of Hawaii Agriculture
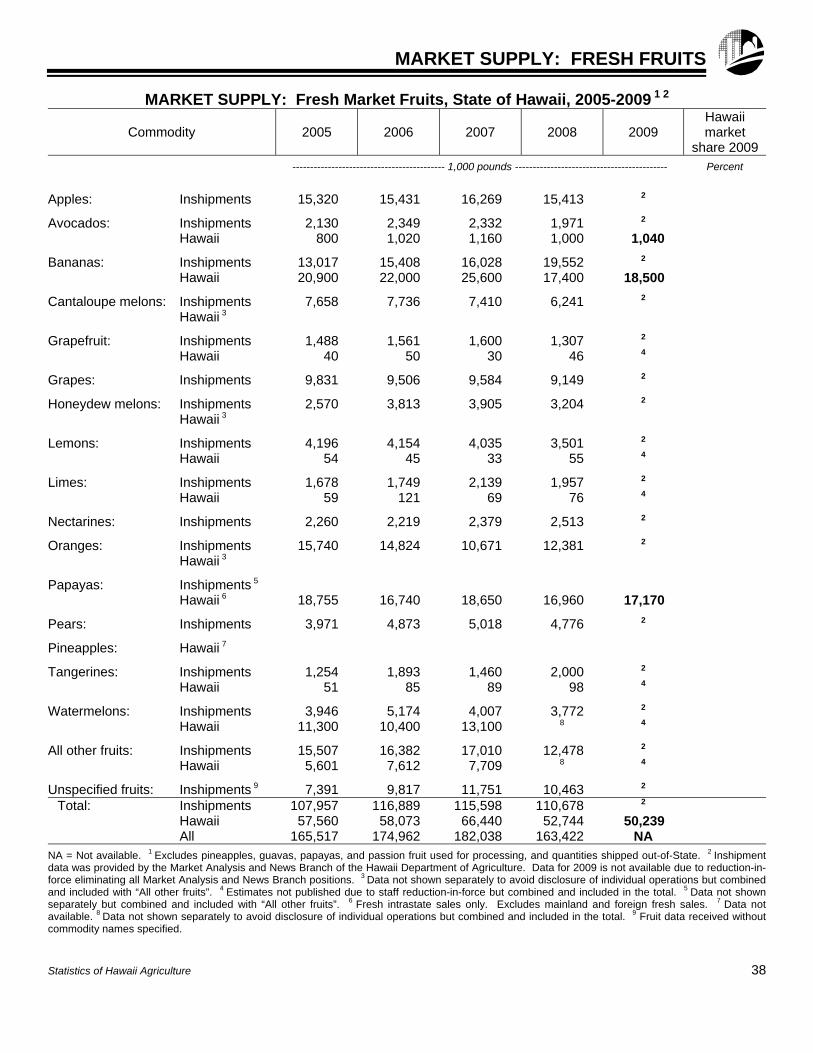
MARKET SUPPLY: FRESH FRUITS
MARKET SUPPLY: Fresh Market Fruits, State of Hawaii, 2005-2009 1 2
Commodity 2005 2006 2007 2008 2009 Hawaii market
share 2009
------------------------------------------- 1,000 pounds ------------------------------------------- Percent
Apples: Inshipments 15,320 15,431 16,269 15,413 2
Avocados: Inshipments 2,130 2,349 2,332 1,971 2 Hawaii 800 1,020 1,160 1,000 1,040
Bananas: Inshipments 13,017 15,408 16,028 19,552 2 Hawaii 20,900 22,000 25,600 17,400 18,500
Cantaloupe melons: Inshipments 7,658 7,736 7,410 6,241 2 Hawaii 3
Grapefruit: Inshipments 1,488 1,561 1,600 1,307 2 Hawaii 40 50 30 46 4
Grapes: Inshipments 9,831 9,506 9,584 9,149 2
Honeydew melons: Inshipments 2,570 3,813 3,905 3,204 2 Hawaii 3
Lemons: Inshipments 4,196 4,154 4,035 3,501 2 Hawaii 54 45 33 55 4
Limes: Inshipments 1,678 1,749 2,139 1,957 2 Hawaii 59 121 69 76 4
Nectarines: Inshipments 2,260 2,219 2,379 2,513 2
Oranges: Inshipments 15,740 14,824 10,671 12,381 2 Hawaii 3
Papayas: Inshipments 5 Hawaii 6 18,755 16,740 18,650 16,960 17,170
Pears: Inshipments 3,971 4,873 5,018 4,776 2
Pineapples: Hawaii 7
Tangerines: Inshipments 1,254 1,893 1,460 2,000 2 Hawaii 51 85 89 98 4
Watermelons: Inshipments 3,946 5,174 4,007 3,772 2 Hawaii 11,300 10,400 13,100 8 4
All other fruits: Inshipments 15,507 16,382 17,010 12,478 2 Hawaii 5,601 7,612 7,709 8 4
Unspecified fruits: Inshipments 9 7,391 9,817 11,751 10,463 2 Total: Inshipments 107,957 116,889 115,598 110,678 2
Hawaii 57,560 58,073 66,440 52,744 50,239 All 165,517 174,962 182,038 163,422 NA NA = Not available. 1 Excludes pineapples, guavas, papayas, and passion fruit used for processing, and quantities shipped out-of-State. 2 Inshipment data was provided by the Market Analysis and News Branch of the Hawaii Department of Agriculture. Data for 2009 is not available due to reduction-in-force eliminating all Market Analysis and News Branch positions. 3 Data not shown separately to avoid disclosure of individual operations but combinedand included with “All other fruits”. 4 Estimates not published due to staff reduction-in-force but combined and included in the total. 5 Data not shown separately but combined and included with “All other fruits”. 6 Fresh intrastate sales only. Excludes mainland and foreign fresh sales. 7 Data not available. 8 Data not shown separately to avoid disclosure of individual operations but combined and included in the total. 9 Fruit data received without commodity names specified.
Statistics of Hawaii Agriculture 38
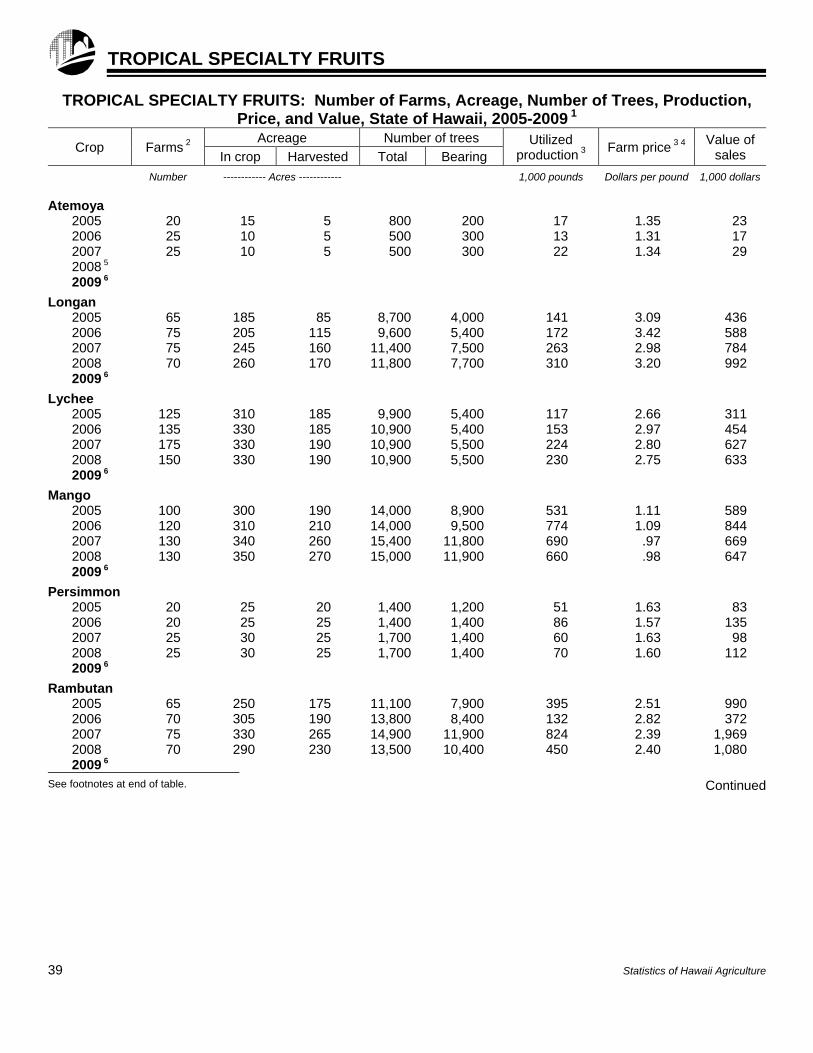
TROPICAL SPECIALTY FRUITS
TROPICAL SPECIALTY FRUITS: Number of Farms, Acreage, Number of Trees, Production, Price, and Value, State of Hawaii, 2005-2009 1
Crop Farms 2 Acreage Number of trees Utilized
production 3 Farm price 3 4
Value of sales In crop Harvested Total Bearing
Number ------------ Acres ------------ 1,000 pounds Dollars per pound 1,000 dollars
Atemoya 2005 20 15 5 800 200 17 1.35 23 2006 25 10 5 500 300 13 1.31 17 2007 25 10 5 500 300 22 1.34 29 2008 5 2009 6
Longan 2005 65 185 85 8,700 4,000 141 3.09 436 2006 75 205 115 9,600 5,400 172 3.42 588 2007 75 245 160 11,400 7,500 263 2.98 784 2008 70 260 170 11,800 7,700 310 3.20 992 2009 6
Lychee 2005 125 310 185 9,900 5,400 117 2.66 311 2006 135 330 185 10,900 5,400 153 2.97 454 2007 175 330 190 10,900 5,500 224 2.80 627 2008 150 330 190 10,900 5,500 230 2.75 633 2009 6
Mango 2005 100 300 190 14,000 8,900 531 1.11 589 2006 120 310 210 14,000 9,500 774 1.09 844 2007 130 340 260 15,400 11,800 690 .97 669 2008 130 350 270 15,000 11,900 660 .98 647 2009 6
Persimmon 2005 20 25 20 1,400 1,200 51 1.63 83 2006 20 25 25 1,400 1,400 86 1.57 135 2007 25 30 25 1,700 1,400 60 1.63 98 2008 25 30 25 1,700 1,400 70 1.60 112 2009 6
Rambutan 2005 65 250 175 11,100 7,900 395 2.51 990 2006 70 305 190 13,800 8,400 132 2.82 372 2007 75 330 265 14,900 11,900 824 2.39 1,969 2008 70 290 230 13,500 10,400 450 2.40 1,080 2009 6
See footnotes at end of table. Continued
39 Statistics of Hawaii Agriculture

TROPICAL SPECIALTY FRUITS
TROPICAL SPECIALTY FRUITS: Number of farms, acreage, number of trees, production, price, and value, State of Hawaii, 2005-2009 1 -- Continued
Crop Farms 2 Acreage Number of trees Utilized
production 3 Farm price 3 4
Value of sales In crop Harvested Total Bearing
Number ------------ Acres ------------ 1,000 pounds Dollars per pound 1,000 dollars
Other 2005 -- 185 70 7 7 204 -- 298 2006 -- 195 80 7 7 100 -- 215 2007 -- 185 65 7 7 197 -- 309 2008 -- 220 85 7 7 330 -- 528 2009 6
Total 2005 265 1,270 730 7 7 1,456 -- 2,730 2006 305 1,380 810 7 7 1,430 -- 2,625 2007 310 1,470 970 7 7 2,280 -- 4,485 2008 320 1,480 970 7 7 2,050 -- 3,992 2009 6
-- = Not applicable. 1 Tropical specialty fruits include: abiu, atemoya, breadfruit, caimito, canistel, cherimoya, durian, jaboticaba, jackfruit, langsat, longan, loquat, lychee,
mango, mangosteen, persimmon, poha, rambutan, rollina, sapodilla, soursop, starfruit, white sapote, and other fruits. If not shown separately, thencombined and included in “Other” category.
2 A farm may grow more than one type of fruit. Total farms is an unduplicated count; excludes home use. 3 Includes fresh and processed utilization when applicable. 4 Price shown reflects average prices received as sold by farmers (loose, packed, etc.), excluding any value added through processing. 5 Data not shown separately to avoid disclosure of individual operations but combined and included with “Other”. 6 Estimates not published due to staff reduction-in-force but combined and included in the State total on page 7.
7 Data series discontinued.
Statistics of Hawaii Agriculture 40
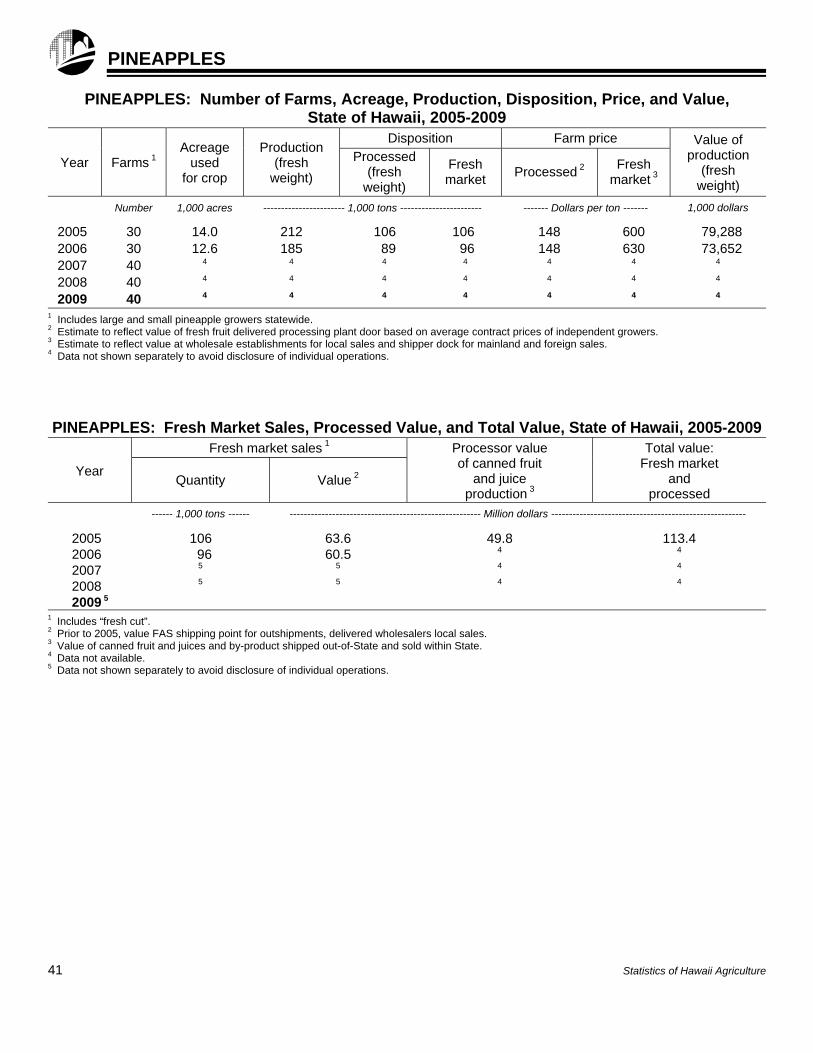
PINEAPPLES
PINEAPPLES: Number of Farms, Acreage, Production, Disposition, Price, and Value, State of Hawaii, 2005-2009
Year Farms 1 Acreage
used for crop
Production (fresh
weight)
Disposition Farm price Value of production
(fresh weight)
Processed (fresh
weight)
Fresh market
Processed 2 Fresh
market 3
Number 1,000 acres ----------------------- 1,000 tons ----------------------- ------- Dollars per ton ------- 1,000 dollars
2005 30 14.0 212 106 106 148 600 79,288 2006 30 12.6 185 89 96 148 630 73,652 2007 40 4 4 4 4 4 4 4
2008 40 4 4 4 4 4 4 4
2009 40 4 4 4 4 4 4 4
1 Includes large and small pineapple growers statewide. 2 Estimate to reflect value of fresh fruit delivered processing plant door based on average contract prices of independent growers. 3 Estimate to reflect value at wholesale establishments for local sales and shipper dock for mainland and foreign sales. 4 Data not shown separately to avoid disclosure of individual operations.
PINEAPPLES: Fresh Market Sales, Processed Value, and Total Value, State of Hawaii, 2005-2009
Year
Fresh market sales 1 Processor value of canned fruit
and juice production 3
Total value: Fresh market
and processed
Quantity Value 2
------ 1,000 tons ------ ------------------------------------------------------ Million dollars -------------------------------------------------------
2005 106 63.6 49.8 113.4 2006 96 60.5 4 4
2007 5 5 4 4
2008 5 5 4 4
2009 5
1 Includes “fresh cut”. 2 Prior to 2005, value FAS shipping point for outshipments, delivered wholesalers local sales. 3 Value of canned fruit and juices and by-product shipped out-of-State and sold within State. 4 Data not available. 5 Data not shown separately to avoid disclosure of individual operations.
41 Statistics of Hawaii Agriculture
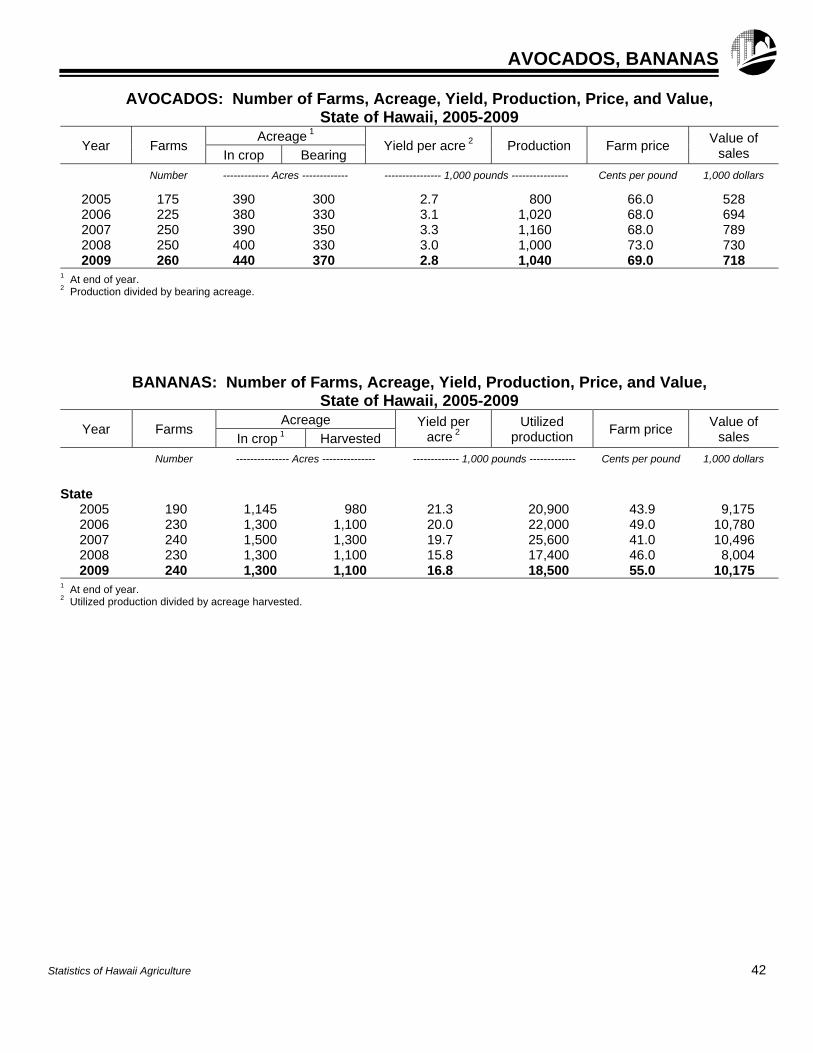
AVOCADOS, BANANAS
AVOCADOS: Number of Farms, Acreage, Yield, Production, Price, and Value, State of Hawaii, 2005-2009
Year Farms Acreage 1
Yield per acre 2 Production Farm price Value of
sales In crop Bearing
Number ------------- Acres ------------- ---------------- 1,000 pounds ---------------- Cents per pound 1,000 dollars
2005 175 390 300 2.7 800 66.0 528 2006 225 380 330 3.1 1,020 68.0 694 2007 250 390 350 3.3 1,160 68.0 789 2008 250 400 330 3.0 1,000 73.0 730 2009 260 440 370 2.8 1,040 69.0 718
1 At end of year. 2 Production divided by bearing acreage.
BANANAS: Number of Farms, Acreage, Yield, Production, Price, and Value, State of Hawaii, 2005-2009
Year Farms Acreage Yield per
acre 2 Utilized
production Farm price
Value of sales In crop 1 Harvested
Number --------------- Acres --------------- ------------- 1,000 pounds ------------- Cents per pound 1,000 dollars
State 2005 190 1,145 980 21.3 20,900 43.9 9,175 2006 230 1,300 1,100 20.0 22,000 49.0 10,780 2007 240 1,500 1,300 19.7 25,600 41.0 10,496 2008 230 1,300 1,100 15.8 17,400 46.0 8,004 2009 240 1,300 1,100 16.8 18,500 55.0 10,175
1 At end of year. 2 Utilized production divided by acreage harvested.
Statistics of Hawaii Agriculture 42
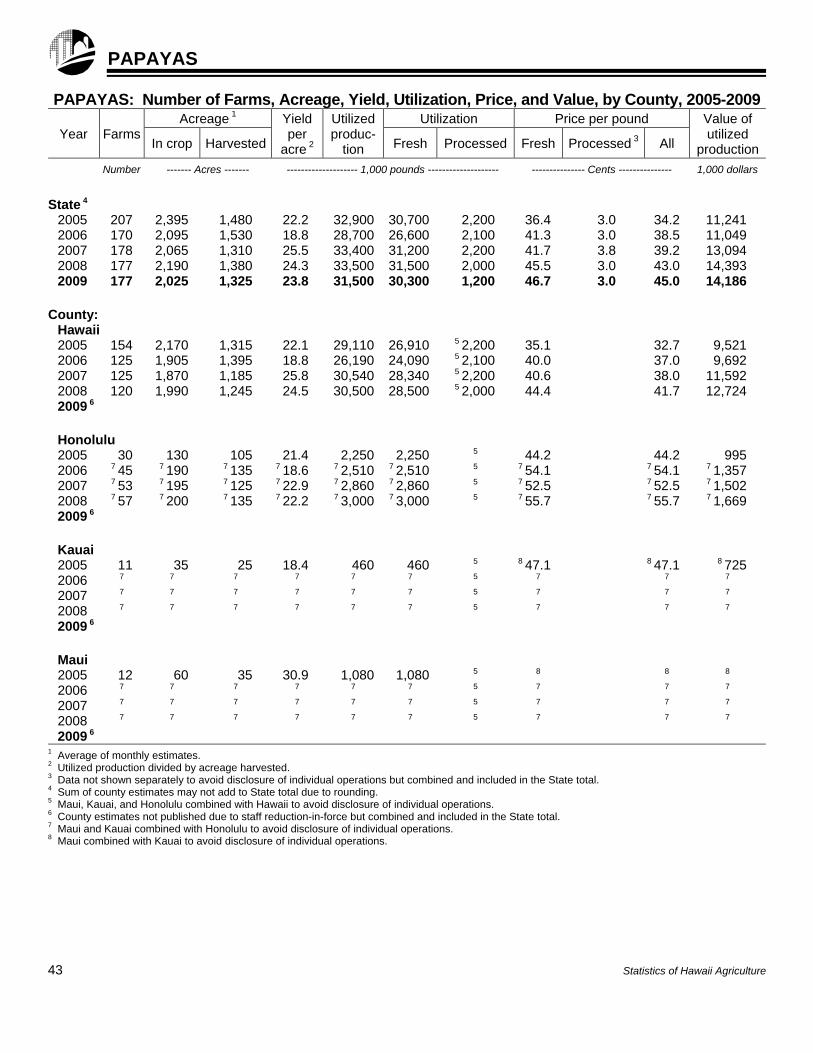
PAPAYAS
PAPAYAS: Number of Farms, Acreage, Yield, Utilization, Price, and Value, by County, 2005-2009
Year Farms Acreage 1 Yield
per acre 2
Utilized produc-
tion
Utilization Price per pound Value of utilized
productionIn crop Harvested Fresh Processed Fresh Processed 3 All
Number ------- Acres ------- -------------------- 1,000 pounds -------------------- --------------- Cents --------------- 1,000 dollars
State 4
2005 207 2,395 1,480 22.2 32,900 30,700 2,200 36.4 3.0 34.2 11,241 2006 170 2,095 1,530 18.8 28,700 26,600 2,100 41.3 3.0 38.5 11,049 2007 178 2,065 1,310 25.5 33,400 31,200 2,200 41.7 3.8 39.2 13,094 2008 177 2,190 1,380 24.3 33,500 31,500 2,000 45.5 3.0 43.0 14,393 2009 177 2,025 1,325 23.8 31,500 30,300 1,200 46.7 3.0 45.0 14,186
County:
Hawaii 2005 154 2,170 1,315 22.1 29,110 26,910 5 2,200 35.1 32.7 9,521 2006 125 1,905 1,395 18.8 26,190 24,090 5 2,100 40.0 37.0 9,692 2007 125 1,870 1,185 25.8 30,540 28,340 5 2,200 40.6 38.0 11,592 2008 120 1,990 1,245 24.5 30,500 28,500 5 2,000 44.4 41.7 12,724 2009 6
Honolulu
2005 30 130 105 21.4 2,250 2,250 5 44.2 44.2 995 2006 7 45 7 190 7 135 7 18.6 7 2,510 7 2,510 5 7 54.1 7 54.1 7 1,357 2007 7 53 7 195 7 125 7 22.9 7 2,860 7 2,860 5 7 52.5 7 52.5 7 1,5022008 7 57 7 200 7 135 7 22.2 7 3,000 7 3,000 5 7 55.7 7 55.7 7 1,6692009 6
Kauai
2005 11 35 25 18.4 460 460 5 8 47.1 8 47.1 8 725 2006 7 7 7 7 7 7 5 7 7 7
2007 7 7 7 7 7 7 5 7 7 7
2008 7 7 7 7 7 7 5 7 7 7
2009 6
Maui
2005 12 60 35 30.9 1,080 1,080 5 8 8 8
2006 7 7 7 7 7 7 5 7 7 7
2007 7 7 7 7 7 7 5 7 7 7
2008 7 7 7 7 7 7 5 7 7 7
2009 6
1 Average of monthly estimates. 2 Utilized production divided by acreage harvested. 3 Data not shown separately to avoid disclosure of individual operations but combined and included in the State total. 4 Sum of county estimates may not add to State total due to rounding. 5 Maui, Kauai, and Honolulu combined with Hawaii to avoid disclosure of individual operations. 6 County estimates not published due to staff reduction-in-force but combined and included in the State total. 7 Maui and Kauai combined with Honolulu to avoid disclosure of individual operations. 8 Maui combined with Kauai to avoid disclosure of individual operations.
43 Statistics of Hawaii Agriculture

PAPAYAS
PAPAYAS: Acreage, Utilization, Outshipments, and Price, State of Hawaii, 2005-2009
Year Jan. Feb. Mar. Apr. May June July Aug. Sep. Oct. Nov. Dec. Total oraverage
Harvested acres 1
2005 1,410 1,410 1,435 1,440 1,440 1,580 1,570 1,435 1,445 1,415 1,405 1,780 1,4802006 1,790 1,795 1,785 1,785 1,760 1,510 1,510 1,330 1,325 1,320 1,315 1,135 1,5302007 1,400 1,160 1,295 1,260 1,315 1,200 1,190 1,370 1,375 1,535 1,365 1,255 1,3102008 1,430 1,430 1,430 1,310 1,315 1,315 1,350 1,350 1,320 1,405 1,450 1,460 1,3802009 1,420 1,400 1,400 1,320 1,310 1,315 1,265 1,260 1,260 1,310 1,320 1,320 1,325
Utilization (fresh and processed) – 1,000 pounds
2005 2,810 2,645 2,875 2,815 3,000 2,740 2,945 2,540 2,810 2,935 2,135 2,650 32,9002006 3,145 2,370 2,340 1,880 2,020 2,380 1,905 2,340 2,855 2,390 2,665 2,410 28,7002007 2,530 2,235 2,605 2,750 2,610 2,260 2,820 3,020 2,885 3,380 3,220 3,085 33,4002008 3,280 2,875 2,780 2,820 3,010 2,660 2,215 2,630 2,525 3,100 2,755 2,850 33,5002009 2,200 2,330 2,760 2,710 2,795 2,795 3,090 2,100 2,545 2,715 2,750 2,710 31,500
Total fresh papaya utilization – 1,000 pounds
2005 2,580 2,425 2,715 2,700 2,740 2,595 2,745 2,360 2,665 2,605 2,020 2,550 30,7002006 2,920 2,240 2,210 1,725 1,785 2,095 1,705 2,215 2,615 2,185 2,605 2,300 26,6002007 2,465 2,015 2,345 2,445 2,365 2,170 2,590 2,815 2,765 3,340 3,075 2,810 31,2002008 2,880 2,645 2,620 2,615 2,785 2,350 2,095 2,380 2,460 3,075 2,745 2,850 31,5002009 2,190 2,270 2,615 2,520 2,595 2,585 2,775 2,075 2,545 2,710 2,710 2,710 30,300
Intrastate fresh papaya utilization – 1,000 pounds
2005 1,545 1,510 1,780 1,680 1,525 1,590 1,625 1,455 1,575 1,630 1,295 1,545 18,7552006 1,730 1,450 1,315 1,065 1,120 1,285 1,050 1,400 1,730 1,375 1,705 1,515 16,7402007 1,615 1,310 1,510 1,570 1,440 1,380 1,580 1,630 1,655 1,750 1,610 1,600 18,6502008 1,680 1,410 1,415 1,440 1,460 1,230 1,150 1,305 1,290 1,645 1,505 1,430 16,9602009 1,170 1,350 1,410 1,410 1,555 1,415 1,530 1,145 1,565 1,540 1,540 1,540 17,170
Outshipments of fresh papaya – 1,000 pounds
2005 1,035 915 935 1,020 1,215 1,005 1,120 905 1,090 975 725 1,005 11,9452006 1,190 790 895 660 665 810 655 815 885 810 900 785 9,8602007 850 705 835 875 925 790 1,010 1,185 1,110 1,590 1,465 1,210 12,5502008 1,200 1,235 1,205 1,175 1,325 1,120 945 1,075 1,170 1,430 1,240 1,420 14,5402009 1,020 920 1,205 1,110 1,040 1,170 1,245 930 980 1,170 1,170 1,170 13,130
Farm price for fresh market sales (to all markets) – cents per pound
2005 33.0 37.4 40.0 37.6 37.0 37.2 36.2 36.5 34.3 33.2 37.1 36.9 36.4 2006 34.1 36.5 42.1 46.3 51.5 47.1 47.0 48.1 38.6 38.1 38.3 36.4 41.3 2007 39.8 41.9 45.0 46.1 46.6 49.4 45.8 38.1 37.1 37.8 38.3 39.7 41.7 2008 43.0 44.8 47.4 47.8 49.7 49.2 50.3 49.4 47.4 42.1 39.1 39.0 45.5 2009 48.2 50.5 46.8 44.0 43.8 44.3 45.0 44.6 49.8 47.7 47.7 48.0 46.7
1 Total is average of monthly data.
Statistics of Hawaii Agriculture 44
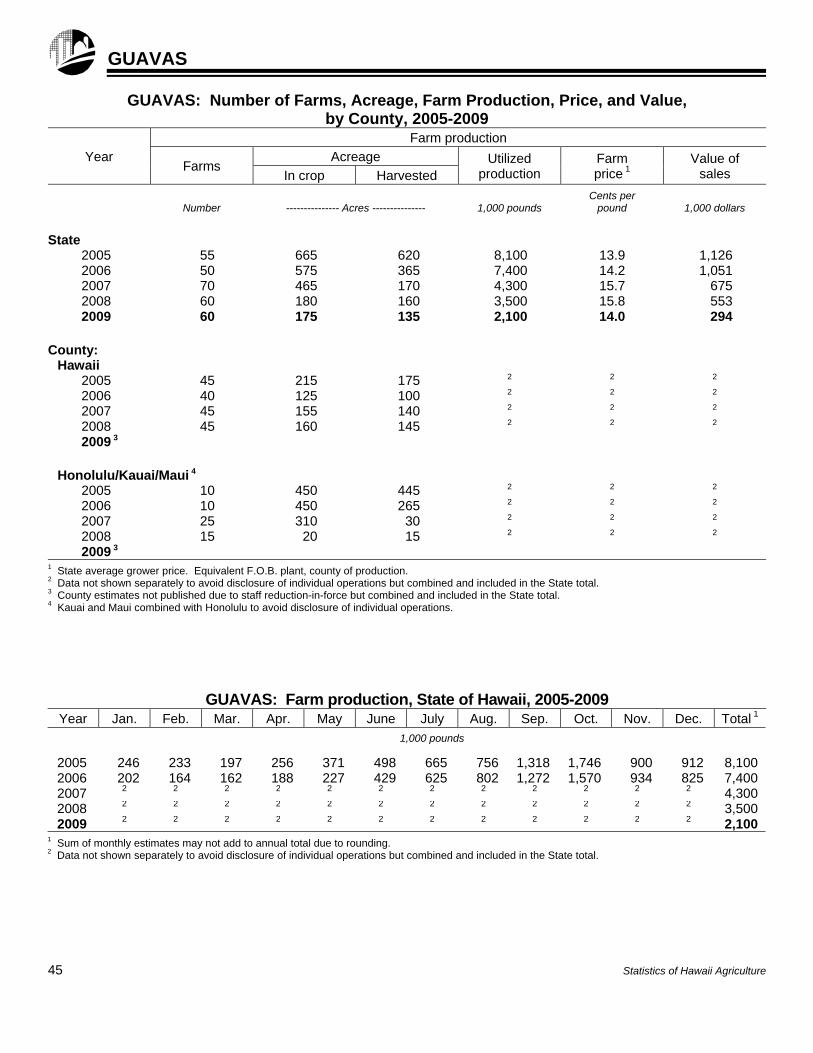
GUAVAS
GUAVAS: Number of Farms, Acreage, Farm Production, Price, and Value, by County, 2005-2009
Year
Farm production
Farms Acreage Utilized
production Farm price 1
Value of sales In crop Harvested
Number
--------------- Acres ---------------
1,000 pounds
Cents per pound
1,000 dollars
State 2005 55 665 620 8,100 13.9 1,126 2006 50 575 365 7,400 14.2 1,051 2007 70 465 170 4,300 15.7 675 2008 60 180 160 3,500 15.8 553 2009 60 175 135 2,100 14.0 294
County: Hawaii
2005 45 215 175 2 2 2
2006 40 125 100 2 2 2
2007 45 155 140 2 2 2
2008 45 160 145 2 2 2
2009 3
Honolulu/Kauai/Maui 4 2005 10 450 445 2 2 2
2006 10 450 265 2 2 2
2007 25 310 30 2 2 2
2008 15 20 15 2 2 2
2009 3
1 State average grower price. Equivalent F.O.B. plant, county of production. 2 Data not shown separately to avoid disclosure of individual operations but combined and included in the State total. 3 County estimates not published due to staff reduction-in-force but combined and included in the State total. 4 Kauai and Maui combined with Honolulu to avoid disclosure of individual operations.
GUAVAS: Farm production, State of Hawaii, 2005-2009 Year Jan. Feb. Mar. Apr. May June July Aug. Sep. Oct. Nov. Dec. Total 1
1,000 pounds
2005 246 233 197 256 371 498 665 756 1,318 1,746 900 912 8,100 2006 202 164 162 188 227 429 625 802 1,272 1,570 934 825 7,400 2007 2 2 2 2 2 2 2 2 2 2 2 2 4,300 2008 2 2 2 2 2 2 2 2 2 2 2 2 3,500 2009 2 2 2 2 2 2 2 2 2 2 2 2 2,100
1 Sum of monthly estimates may not add to annual total due to rounding. 2 Data not shown separately to avoid disclosure of individual operations but combined and included in the State total.
45 Statistics of Hawaii Agriculture
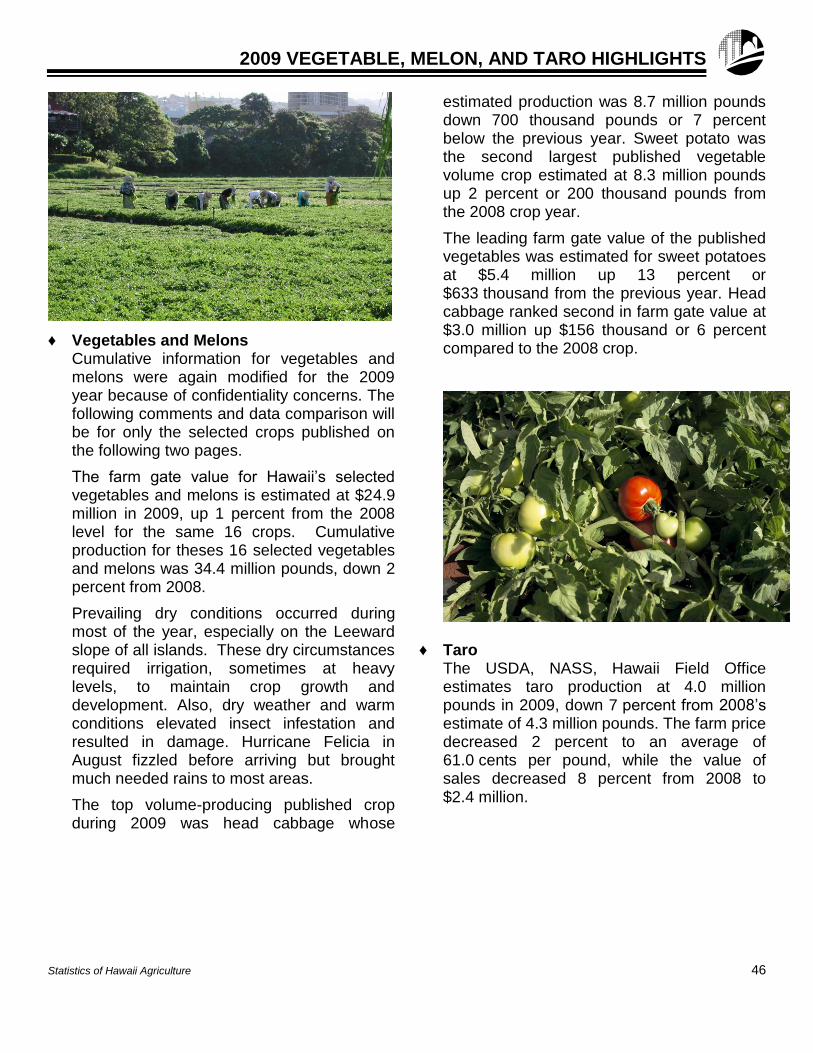
2009 VEGETABLE, MELON, AND TARO HIGHLIGHTS
♦ Vegetables and Melons Cumulative information for vegetables and melons were again modified for the 2009 year because of confidentiality concerns. The following comments and data comparison will be for only the selected crops published on the following two pages.
The farm gate value for Hawaii’s selected vegetables and melons is estimated at $24.9 million in 2009, up 1 percent from the 2008 level for the same 16 crops. Cumulative production for theses 16 selected vegetables and melons was 34.4 million pounds, down 2 percent from 2008.
Prevailing dry conditions occurred during most of the year, especially on the Leeward slope of all islands. These dry circumstances required irrigation, sometimes at heavy levels, to maintain crop growth and development. Also, dry weather and warm conditions elevated insect infestation and resulted in damage. Hurricane Felicia in August fizzled before arriving but brought much needed rains to most areas.
The top volume-producing published crop during 2009 was head cabbage whose
estimated production was 8.7 million pounds down 700 thousand pounds or 7 percent below the previous year. Sweet potato was the second largest published vegetable volume crop estimated at 8.3 million pounds up 2 percent or 200 thousand pounds from the 2008 crop year.
The leading farm gate value of the published vegetables was estimated for sweet potatoes at $5.4 million up 13 percent or $633 thousand from the previous year. Head cabbage ranked second in farm gate value at $3.0 million up $156 thousand or 6 percent compared to the 2008 crop.
♦ Taro The USDA, NASS, Hawaii Field Office estimates taro production at 4.0 million pounds in 2009, down 7 percent from 2008’s estimate of 4.3 million pounds. The farm price decreased 2 percent to an average of 61.0 cents per pound, while the value of sales decreased 8 percent from 2008 to $2.4 million.
Statistics of Hawaii Agriculture 46
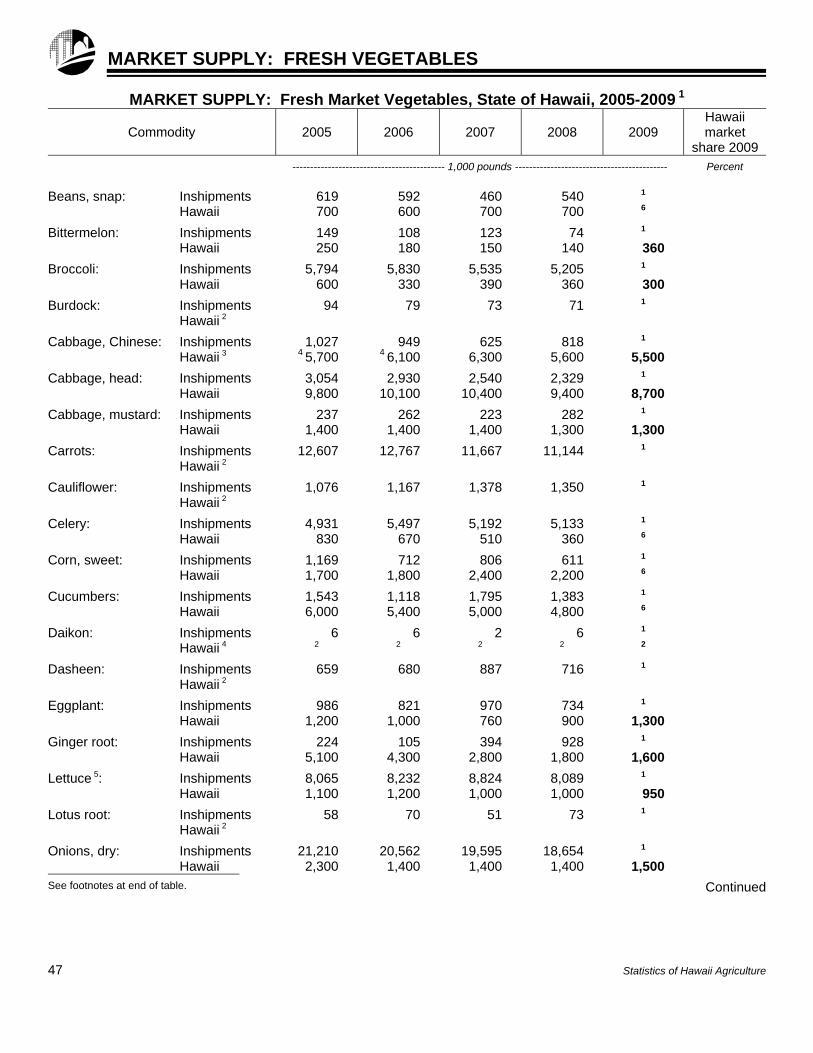
47 Statistics of Hawaii Agriculture
MARKET SUPPLY: FRESH VEGETABLES
MARKET SUPPLY: Fresh Market Vegetables, State of Hawaii, 2005-2009 1
Commodity 2005 2006 2007 2008 2009 Hawaii market
share 2009
------------------------------------------- 1,000 pounds ------------------------------------------- Percent
Beans, snap: Inshipments 619 592 460 540 1 Hawaii 700 600 700 700 6
Bittermelon: Inshipments 149 108 123 74 1 Hawaii 250 180 150 140 360
Broccoli: Inshipments 5,794 5,830 5,535 5,205 1 Hawaii 600 330 390 360 300
Burdock: Inshipments 94 79 73 71 1 Hawaii 2
Cabbage, Chinese: Inshipments 1,027 949 625 818 1 Hawaii 3 4 5,700 4 6,100 6,300 5,600 5,500
Cabbage, head: Inshipments 3,054 2,930 2,540 2,329 1 Hawaii 9,800 10,100 10,400 9,400 8,700
Cabbage, mustard: Inshipments 237 262 223 282 1 Hawaii 1,400 1,400 1,400 1,300 1,300
Carrots: Inshipments 12,607 12,767 11,667 11,144 1 Hawaii 2
Cauliflower: Inshipments 1,076 1,167 1,378 1,350 1 Hawaii 2
Celery: Inshipments 4,931 5,497 5,192 5,133 1 Hawaii 830 670 510 360 6
Corn, sweet: Inshipments 1,169 712 806 611 1 Hawaii 1,700 1,800 2,400 2,200 6
Cucumbers: Inshipments 1,543 1,118 1,795 1,383 1 Hawaii 6,000 5,400 5,000 4,800 6
Daikon: Inshipments 6 6 2 6 1 Hawaii 4 2 2 2 2 2
Dasheen: Inshipments 659 680 887 716 1 Hawaii 2
Eggplant: Inshipments 986 821 970 734 1 Hawaii 1,200 1,000 760 900 1,300
Ginger root: Inshipments 224 105 394 928 1 Hawaii 5,100 4,300 2,800 1,800 1,600
Lettuce 5: Inshipments 8,065 8,232 8,824 8,089 1 Hawaii 1,100 1,200 1,000 1,000 950
Lotus root: Inshipments 58 70 51 73 1 Hawaii 2
Onions, dry: Inshipments 21,210 20,562 19,595 18,654 1 Hawaii 2,300 1,400 1,400 1,400 1,500 See footnotes at end of table. Continued
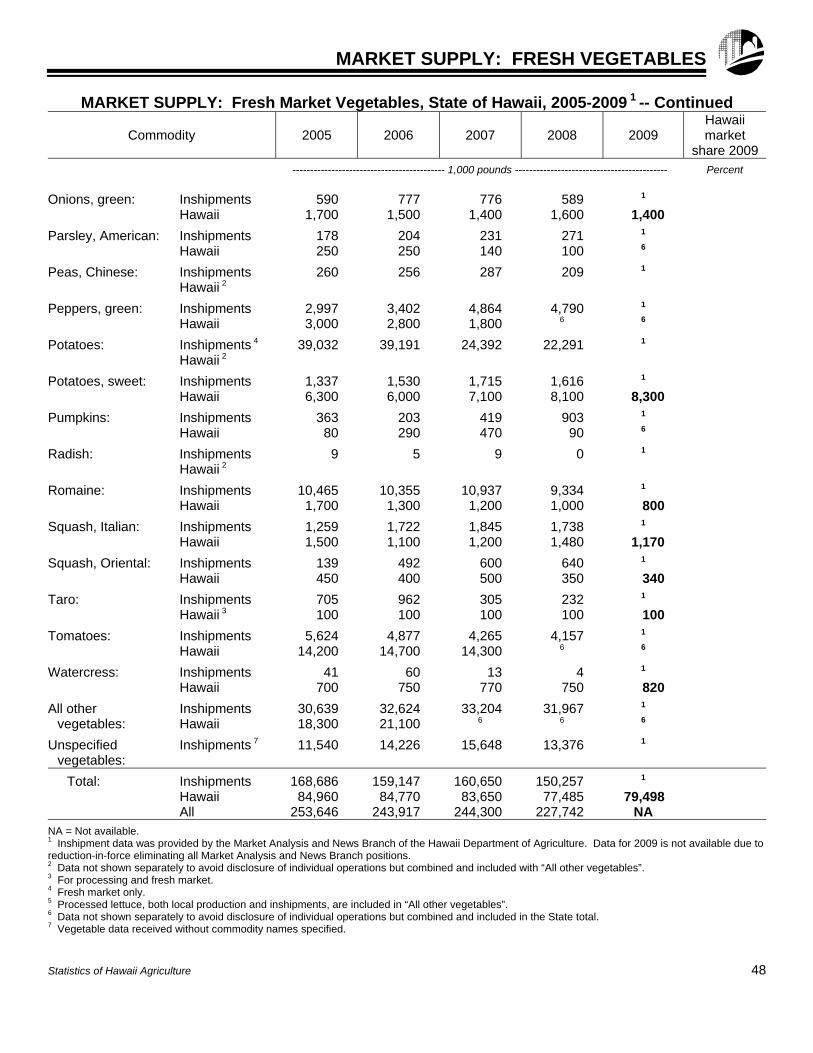
MARKET SUPPLY: FRESH VEGETABLES
MARKET SUPPLY: Fresh Market Vegetables, State of Hawaii, 2005-2009 1 -- Continued
Commodity 2005 2006 2007 2008 2009 Hawaii market
share 2009
------------------------------------------- 1,000 pounds ------------------------------------------- Percent
Onions, green: Inshipments 590 777 776 589 1 Hawaii 1,700 1,500 1,400 1,600 1,400
Parsley, American: Inshipments 178 204 231 271 1 Hawaii 250 250 140 100 6
Peas, Chinese: Inshipments 260 256 287 209 1 Hawaii 2
Peppers, green: Inshipments 2,997 3,402 4,864 4,790 1 Hawaii 3,000 2,800 1,800 6 6
Potatoes: Inshipments 4 39,032 39,191 24,392 22,291 1 Hawaii 2
Potatoes, sweet: Inshipments 1,337 1,530 1,715 1,616 1 Hawaii 6,300 6,000 7,100 8,100 8,300
Pumpkins: Inshipments 363 203 419 903 1 Hawaii 80 290 470 90 6
Radish: Inshipments 9 5 9 0 1 Hawaii 2
Romaine: Inshipments 10,465 10,355 10,937 9,334 1 Hawaii 1,700 1,300 1,200 1,000 800
Squash, Italian: Inshipments 1,259 1,722 1,845 1,738 1 Hawaii 1,500 1,100 1,200 1,480 1,170
Squash, Oriental: Inshipments 139 492 600 640 1 Hawaii 450 400 500 350 340
Taro: Inshipments 705 962 305 232 1 Hawaii 3 100 100 100 100 100
Tomatoes: Inshipments 5,624 4,877 4,265 4,157 1 Hawaii 14,200 14,700 14,300 6 6
Watercress: Inshipments 41 60 13 4 1 Hawaii 700 750 770 750 820
All other Inshipments 30,639 32,624 33,204 31,967 1 vegetables: Hawaii 18,300 21,100 6 6 6
Unspecified Inshipments 7 11,540 14,226 15,648 13,376 1 vegetables:
Total: Inshipments 168,686 159,147 160,650 150,257 1 Hawaii 84,960 84,770 83,650 77,485 79,498 All 253,646 243,917 244,300 227,742 NA NA = Not available. 1 Inshipment data was provided by the Market Analysis and News Branch of the Hawaii Department of Agriculture. Data for 2009 is not available due to reduction-in-force eliminating all Market Analysis and News Branch positions. 2 Data not shown separately to avoid disclosure of individual operations but combined and included with “All other vegetables”. 3 For processing and fresh market. 4 Fresh market only. 5 Processed lettuce, both local production and inshipments, are included in “All other vegetables”. 6 Data not shown separately to avoid disclosure of individual operations but combined and included in the State total. 7 Vegetable data received without commodity names specified. Statistics of Hawaii Agriculture 48
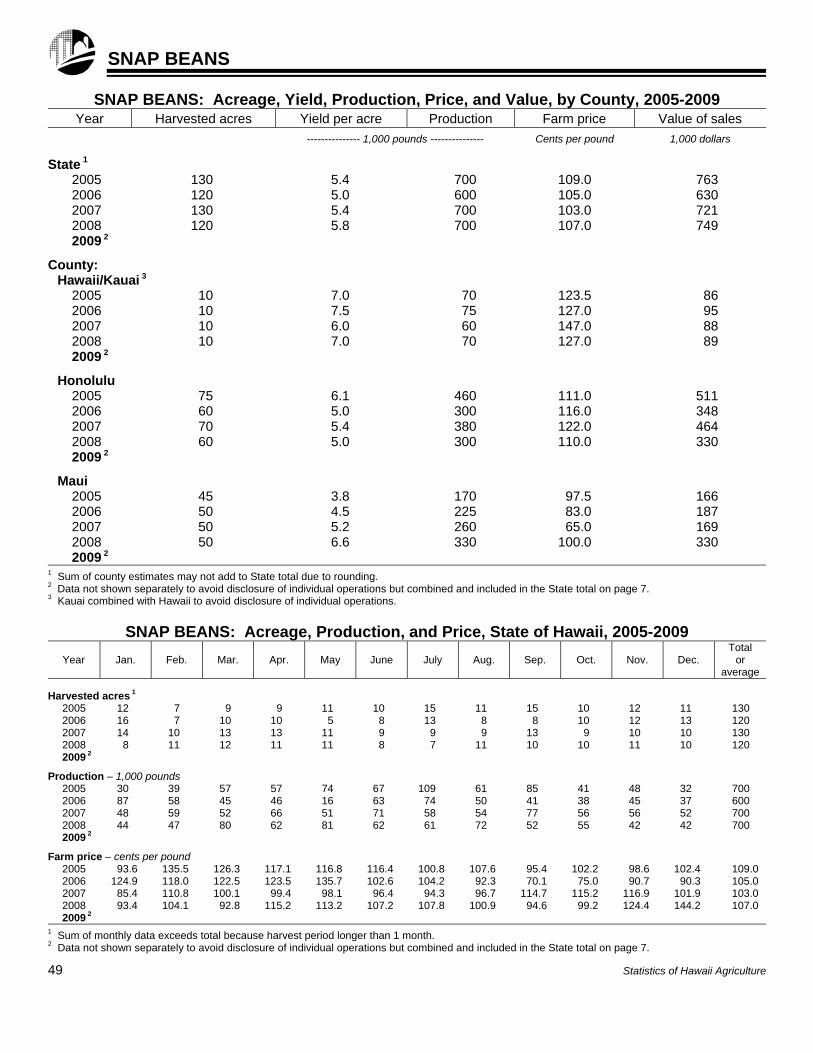
SNAP BEANS
SNAP BEANS: Acreage, Yield, Production, Price, and Value, by County, 2005-2009 Year Harvested acres Yield per acre Production Farm price Value of sales
--------------- 1,000 pounds --------------- Cents per pound 1,000 dollars
State 1
2005 130 5.4 700 109.0 763 2006 120 5.0 600 105.0 630 2007 130 5.4 700 103.0 721 2008 120 5.8 700 107.0 749 2009 2
County:
Hawaii/Kauai 3 2005 10 7.0 70 123.5 86 2006 10 7.5 75 127.0 95 2007 10 6.0 60 147.0 88 2008 10 7.0 70 127.0 89 2009 2
Honolulu 2005 75 6.1 460 111.0 511 2006 60 5.0 300 116.0 348 2007 70 5.4 380 122.0 464 2008 60 5.0 300 110.0 330 2009 2
Maui 2005 45 3.8 170 97.5 166 2006 50 4.5 225 83.0 187 2007 50 5.2 260 65.0 169 2008 50 6.6 330 100.0 330 2009 2
1 Sum of county estimates may not add to State total due to rounding. 2 Data not shown separately to avoid disclosure of individual operations but combined and included in the State total on page 7. 3 Kauai combined with Hawaii to avoid disclosure of individual operations.
SNAP BEANS: Acreage, Production, and Price, State of Hawaii, 2005-2009
Year Jan. Feb. Mar. Apr. May June July Aug. Sep. Oct. Nov. Dec. Total
or average
Harvested acres 1
2005 12 7 9 9 11 10 15 11 15 10 12 11 130 2006 16 7 10 10 5 8 13 8 8 10 12 13 120 2007 14 10 13 13 11 9 9 9 13 9 10 10 130 2008 8 11 12 11 11 8 7 11 10 10 11 10 120 2009 2
Production – 1,000 pounds
2005 30 39 57 57 74 67 109 61 85 41 48 32 700 2006 87 58 45 46 16 63 74 50 41 38 45 37 600 2007 48 59 52 66 51 71 58 54 77 56 56 52 700 2008 44 47 80 62 81 62 61 72 52 55 42 42 700 2009 2
Farm price – cents per pound
2005 93.6 135.5 126.3 117.1 116.8 116.4 100.8 107.6 95.4 102.2 98.6 102.4 109.0 2006 124.9 118.0 122.5 123.5 135.7 102.6 104.2 92.3 70.1 75.0 90.7 90.3 105.0 2007 85.4 110.8 100.1 99.4 98.1 96.4 94.3 96.7 114.7 115.2 116.9 101.9 103.0 2008 93.4 104.1 92.8 115.2 113.2 107.2 107.8 100.9 94.6 99.2 124.4 144.2 107.0 2009 2
1 Sum of monthly data exceeds total because harvest period longer than 1 month. 2 Data not shown separately to avoid disclosure of individual operations but combined and included in the State total on page 7. 49 Statistics of Hawaii Agriculture
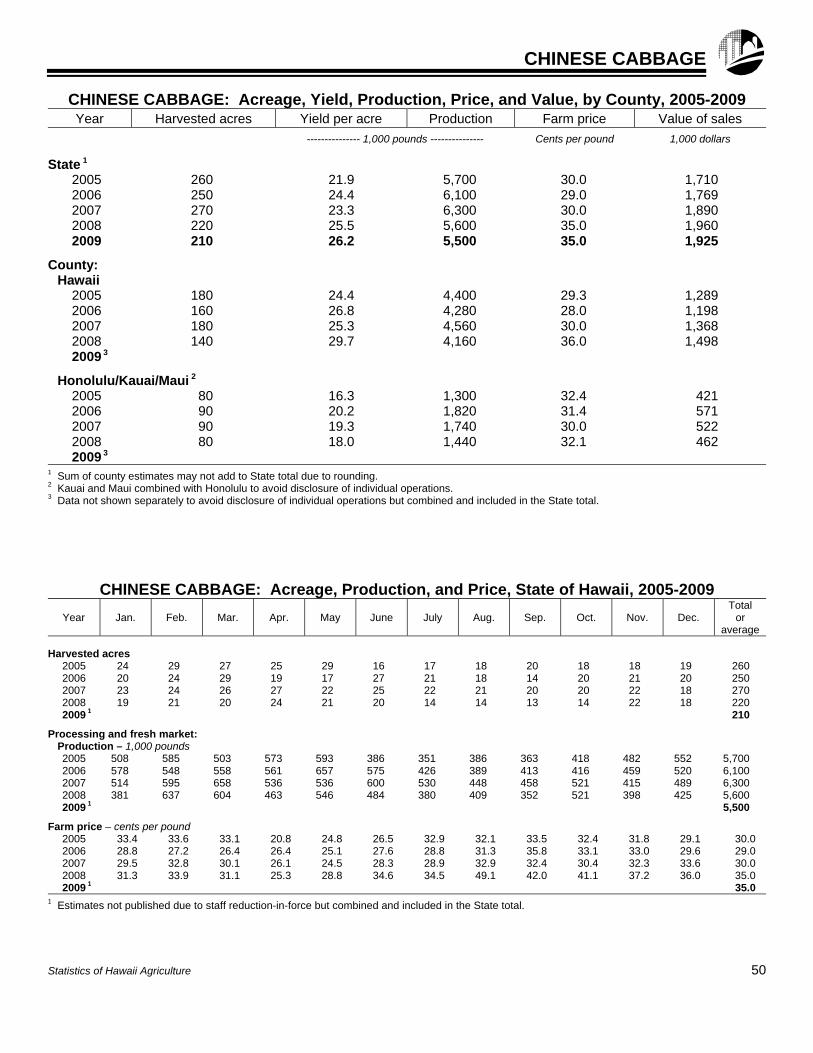
CHINESE CABBAGE
CHINESE CABBAGE: Acreage, Yield, Production, Price, and Value, by County, 2005-2009 Year Harvested acres Yield per acre Production Farm price Value of sales
--------------- 1,000 pounds --------------- Cents per pound 1,000 dollars
State 1
2005 260 21.9 5,700 30.0 1,710 2006 250 24.4 6,100 29.0 1,769 2007 270 23.3 6,300 30.0 1,890 2008 220 25.5 5,600 35.0 1,960 2009 210 26.2 5,500 35.0 1,925
County:
Hawaii 2005 180 24.4 4,400 29.3 1,289 2006 160 26.8 4,280 28.0 1,198 2007 180 25.3 4,560 30.0 1,368 2008 140 29.7 4,160 36.0 1,498 2009 3
Honolulu/Kauai/Maui 2 2005 80 16.3 1,300 32.4 421 2006 90 20.2 1,820 31.4 571 2007 90 19.3 1,740 30.0 522 2008 80 18.0 1,440 32.1 462 2009 3
1 Sum of county estimates may not add to State total due to rounding. 2 Kauai and Maui combined with Honolulu to avoid disclosure of individual operations. 3 Data not shown separately to avoid disclosure of individual operations but combined and included in the State total.
CHINESE CABBAGE: Acreage, Production, and Price, State of Hawaii, 2005-2009
Year Jan. Feb. Mar. Apr. May June July Aug. Sep. Oct. Nov. Dec. Total
or average
Harvested acres
2005 24 29 27 25 29 16 17 18 20 18 18 19 260 2006 20 24 29 19 17 27 21 18 14 20 21 20 250 2007 23 24 26 27 22 25 22 21 20 20 22 18 270 2008 19 21 20 24 21 20 14 14 13 14 22 18 220 2009 1 210
Processing and fresh market:
Production – 1,000 pounds 2005 508 585 503 573 593 386 351 386 363 418 482 552 5,700 2006 578 548 558 561 657 575 426 389 413 416 459 520 6,100 2007 514 595 658 536 536 600 530 448 458 521 415 489 6,300 2008 381 637 604 463 546 484 380 409 352 521 398 425 5,600 2009 1 5,500
Farm price – cents per pound
2005 33.4 33.6 33.1 20.8 24.8 26.5 32.9 32.1 33.5 32.4 31.8 29.1 30.0 2006 28.8 27.2 26.4 26.4 25.1 27.6 28.8 31.3 35.8 33.1 33.0 29.6 29.0 2007 29.5 32.8 30.1 26.1 24.5 28.3 28.9 32.9 32.4 30.4 32.3 33.6 30.0 2008 31.3 33.9 31.1 25.3 28.8 34.6 34.5 49.1 42.0 41.1 37.2 36.0 35.0 2009 1 35.0
1 Estimates not published due to staff reduction-in-force but combined and included in the State total.
Statistics of Hawaii Agriculture 50
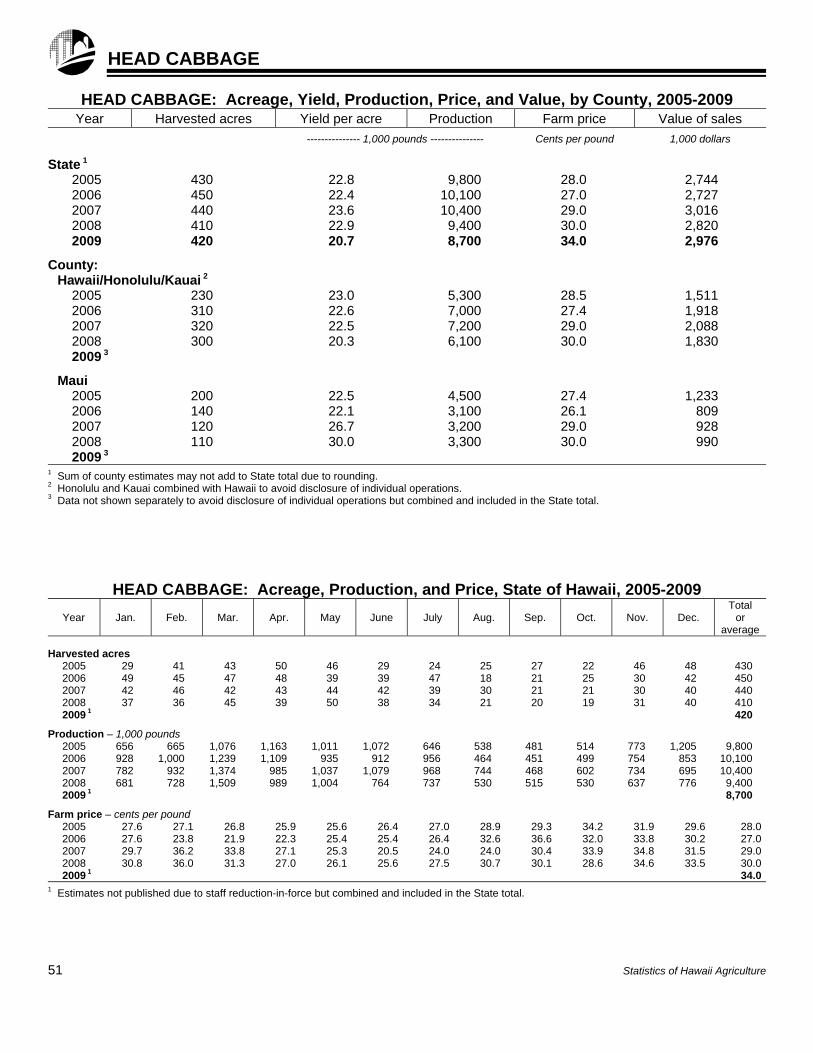
HEAD CABBAGE
HEAD CABBAGE: Acreage, Yield, Production, Price, and Value, by County, 2005-2009 Year Harvested acres Yield per acre Production Farm price Value of sales
--------------- 1,000 pounds --------------- Cents per pound 1,000 dollars
State 1
2005 430 22.8 9,800 28.0 2,744 2006 450 22.4 10,100 27.0 2,727 2007 440 23.6 10,400 29.0 3,016 2008 410 22.9 9,400 30.0 2,820 2009 420 20.7 8,700 34.0 2,976
County:
Hawaii/Honolulu/Kauai 2 2005 230 23.0 5,300 28.5 1,511 2006 310 22.6 7,000 27.4 1,918 2007 320 22.5 7,200 29.0 2,088 2008 300 20.3 6,100 30.0 1,830 2009 3
Maui 2005 200 22.5 4,500 27.4 1,233 2006 140 22.1 3,100 26.1 809 2007 120 26.7 3,200 29.0 928 2008 110 30.0 3,300 30.0 990 2009 3
1 Sum of county estimates may not add to State total due to rounding. 2 Honolulu and Kauai combined with Hawaii to avoid disclosure of individual operations. 3 Data not shown separately to avoid disclosure of individual operations but combined and included in the State total.
HEAD CABBAGE: Acreage, Production, and Price, State of Hawaii, 2005-2009
Year Jan. Feb. Mar. Apr. May June July Aug. Sep. Oct. Nov. Dec. Total
or average
Harvested acres
2005 29 41 43 50 46 29 24 25 27 22 46 48 430 2006 49 45 47 48 39 39 47 18 21 25 30 42 450 2007 42 46 42 43 44 42 39 30 21 21 30 40 440 2008 37 36 45 39 50 38 34 21 20 19 31 40 410 2009 1 420
Production – 1,000 pounds
2005 656 665 1,076 1,163 1,011 1,072 646 538 481 514 773 1,205 9,800 2006 928 1,000 1,239 1,109 935 912 956 464 451 499 754 853 10,100 2007 782 932 1,374 985 1,037 1,079 968 744 468 602 734 695 10,400 2008 681 728 1,509 989 1,004 764 737 530 515 530 637 776 9,400 2009 1 8,700
Farm price – cents per pound
2005 27.6 27.1 26.8 25.9 25.6 26.4 27.0 28.9 29.3 34.2 31.9 29.6 28.02006 27.6 23.8 21.9 22.3 25.4 25.4 26.4 32.6 36.6 32.0 33.8 30.2 27.02007 29.7 36.2 33.8 27.1 25.3 20.5 24.0 24.0 30.4 33.9 34.8 31.5 29.02008 30.8 36.0 31.3 27.0 26.1 25.6 27.5 30.7 30.1 28.6 34.6 33.5 30.02009 1 34.0
1 Estimates not published due to staff reduction-in-force but combined and included in the State total.
51 Statistics of Hawaii Agriculture
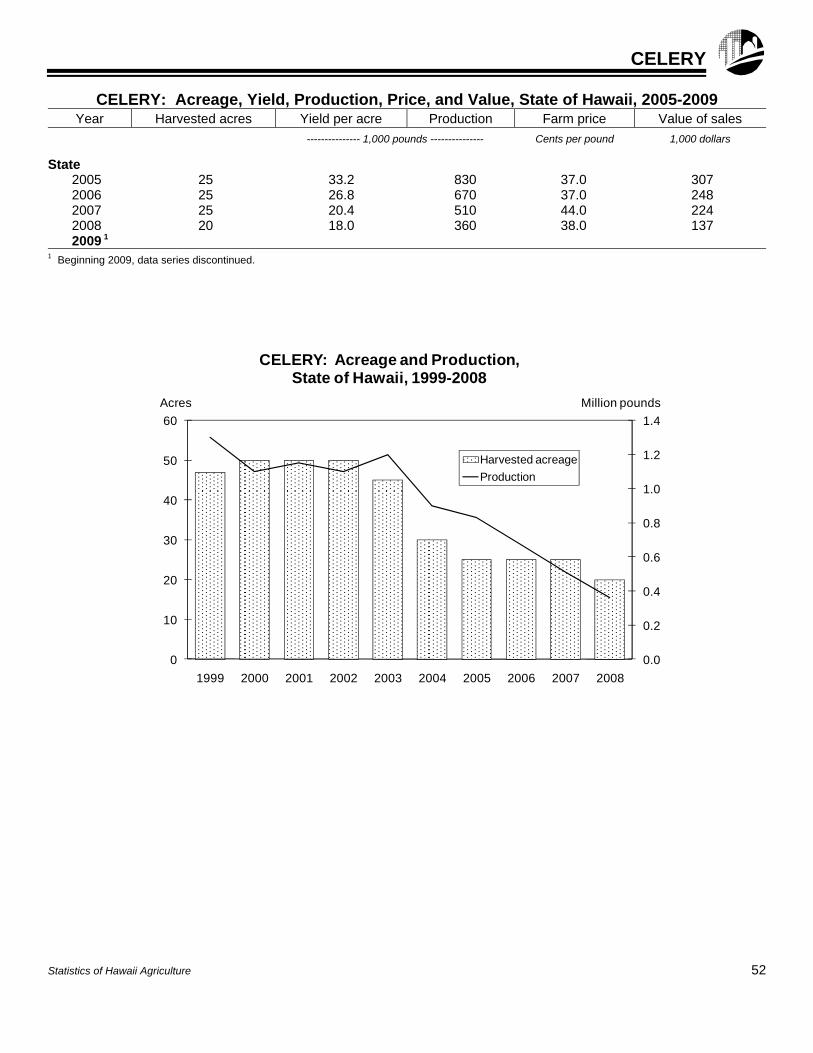
CELERY
CELERY: Acreage, Yield, Production, Price, and Value, State of Hawaii, 2005-2009 Year Harvested acres Yield per acre Production Farm price Value of sales
--------------- 1,000 pounds --------------- Cents per pound 1,000 dollars
State
2005 25 33.2 830 37.0 307 2006 25 26.8 670 37.0 248 2007 25 20.4 510 44.0 224 2008 20 18.0 360 38.0 137 2009 1
1 Beginning 2009, data series discontinued.
Statistics of Hawaii Agriculture 52
0.0
0.2
0.4
0.6
0.8
1.0
1.2
1.4
0
10
20
30
40
50
60
1999 2000 2001 2002 2003 2004 2005 2006 2007 2008
Million poundsAcres
CELERY: Acreage and Production,State of Hawaii, 1999-2008
Harvested acreage
Production
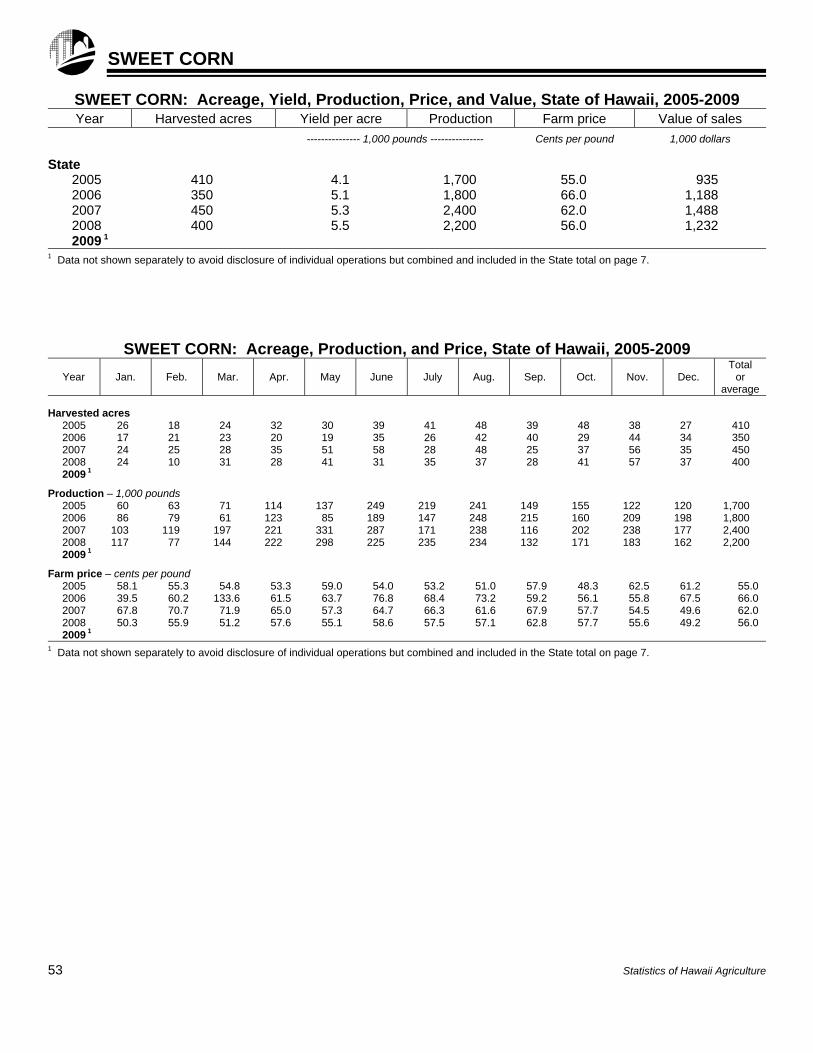
SWEET CORN
SWEET CORN: Acreage, Yield, Production, Price, and Value, State of Hawaii, 2005-2009 Year Harvested acres Yield per acre Production Farm price Value of sales
--------------- 1,000 pounds --------------- Cents per pound 1,000 dollars
State
2005 410 4.1 1,700 55.0 935 2006 350 5.1 1,800 66.0 1,188 2007 450 5.3 2,400 62.0 1,488 2008 400 5.5 2,200 56.0 1,232 2009 1
1 Data not shown separately to avoid disclosure of individual operations but combined and included in the State total on page 7.
SWEET CORN: Acreage, Production, and Price, State of Hawaii, 2005-2009
Year Jan. Feb. Mar. Apr. May June July Aug. Sep. Oct. Nov. Dec. Total
or average
Harvested acres
2005 26 18 24 32 30 39 41 48 39 48 38 27 410 2006 17 21 23 20 19 35 26 42 40 29 44 34 350 2007 24 25 28 35 51 58 28 48 25 37 56 35 450 2008 24 10 31 28 41 31 35 37 28 41 57 37 400 2009 1
Production – 1,000 pounds
2005 60 63 71 114 137 249 219 241 149 155 122 120 1,700 2006 86 79 61 123 85 189 147 248 215 160 209 198 1,800 2007 103 119 197 221 331 287 171 238 116 202 238 177 2,400 2008 117 77 144 222 298 225 235 234 132 171 183 162 2,200 2009 1
Farm price – cents per pound
2005 58.1 55.3 54.8 53.3 59.0 54.0 53.2 51.0 57.9 48.3 62.5 61.2 55.0 2006 39.5 60.2 133.6 61.5 63.7 76.8 68.4 73.2 59.2 56.1 55.8 67.5 66.0 2007 67.8 70.7 71.9 65.0 57.3 64.7 66.3 61.6 67.9 57.7 54.5 49.6 62.0 2008 50.3 55.9 51.2 57.6 55.1 58.6 57.5 57.1 62.8 57.7 55.6 49.2 56.0 2009 1
1 Data not shown separately to avoid disclosure of individual operations but combined and included in the State total on page 7.
53 Statistics of Hawaii Agriculture
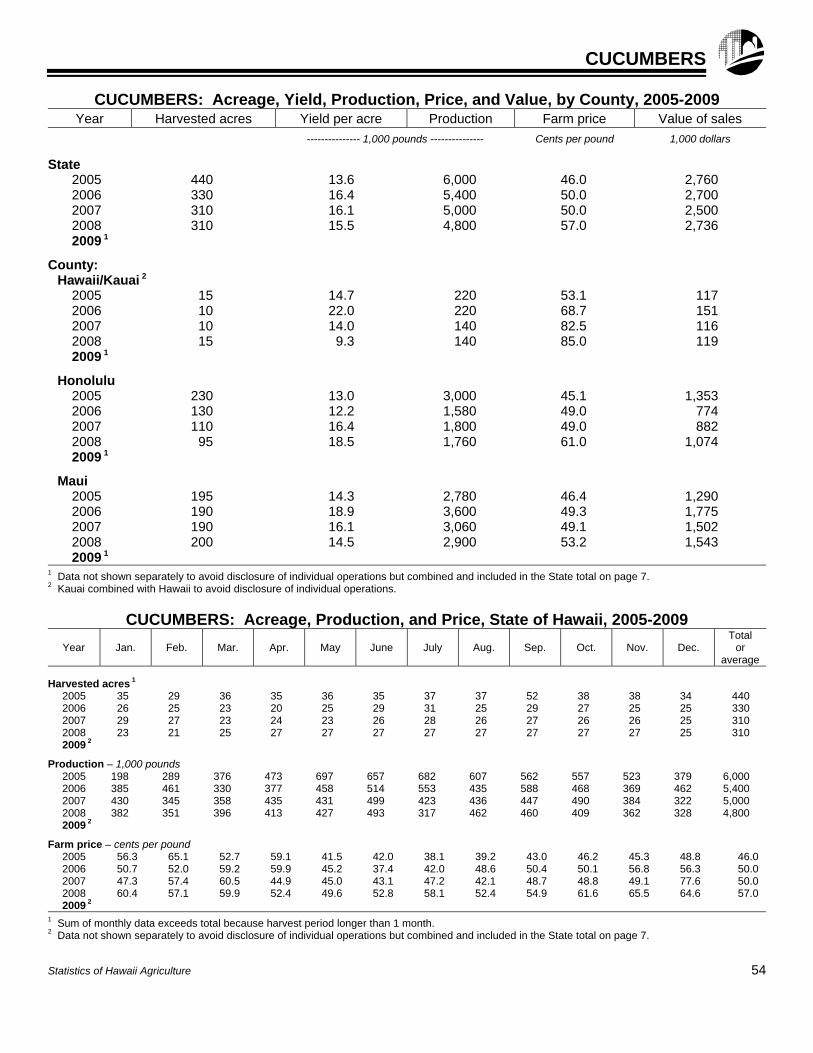
CUCUMBERS
CUCUMBERS: Acreage, Yield, Production, Price, and Value, by County, 2005-2009 Year Harvested acres Yield per acre Production Farm price Value of sales
--------------- 1,000 pounds --------------- Cents per pound 1,000 dollars
State
2005 440 13.6 6,000 46.0 2,760 2006 330 16.4 5,400 50.0 2,700 2007 310 16.1 5,000 50.0 2,500 2008 310 15.5 4,800 57.0 2,736 2009 1
County:
Hawaii/Kauai 2 2005 15 14.7 220 53.1 117 2006 10 22.0 220 68.7 151 2007 10 14.0 140 82.5 116 2008 15 9.3 140 85.0 119 2009 1
Honolulu 2005 230 13.0 3,000 45.1 1,353 2006 130 12.2 1,580 49.0 774 2007 110 16.4 1,800 49.0 882 2008 95 18.5 1,760 61.0 1,074 2009 1
Maui 2005 195 14.3 2,780 46.4 1,290 2006 190 18.9 3,600 49.3 1,775 2007 190 16.1 3,060 49.1 1,502 2008 200 14.5 2,900 53.2 1,543 2009 1
1 Data not shown separately to avoid disclosure of individual operations but combined and included in the State total on page 7. 2 Kauai combined with Hawaii to avoid disclosure of individual operations.
CUCUMBERS: Acreage, Production, and Price, State of Hawaii, 2005-2009
Year Jan. Feb. Mar. Apr. May June July Aug. Sep. Oct. Nov. Dec. Total
or average
Harvested acres 1
2005 35 29 36 35 36 35 37 37 52 38 38 34 440 2006 26 25 23 20 25 29 31 25 29 27 25 25 330 2007 29 27 23 24 23 26 28 26 27 26 26 25 310 2008 23 21 25 27 27 27 27 27 27 27 27 25 310 2009 2
Production – 1,000 pounds
2005 198 289 376 473 697 657 682 607 562 557 523 379 6,000 2006 385 461 330 377 458 514 553 435 588 468 369 462 5,400 2007 430 345 358 435 431 499 423 436 447 490 384 322 5,000 2008 382 351 396 413 427 493 317 462 460 409 362 328 4,800 2009 2
Farm price – cents per pound
2005 56.3 65.1 52.7 59.1 41.5 42.0 38.1 39.2 43.0 46.2 45.3 48.8 46.0 2006 50.7 52.0 59.2 59.9 45.2 37.4 42.0 48.6 50.4 50.1 56.8 56.3 50.0 2007 47.3 57.4 60.5 44.9 45.0 43.1 47.2 42.1 48.7 48.8 49.1 77.6 50.0 2008 60.4 57.1 59.9 52.4 49.6 52.8 58.1 52.4 54.9 61.6 65.5 64.6 57.0 2009 2
1 Sum of monthly data exceeds total because harvest period longer than 1 month. 2 Data not shown separately to avoid disclosure of individual operations but combined and included in the State total on page 7.
Statistics of Hawaii Agriculture 54
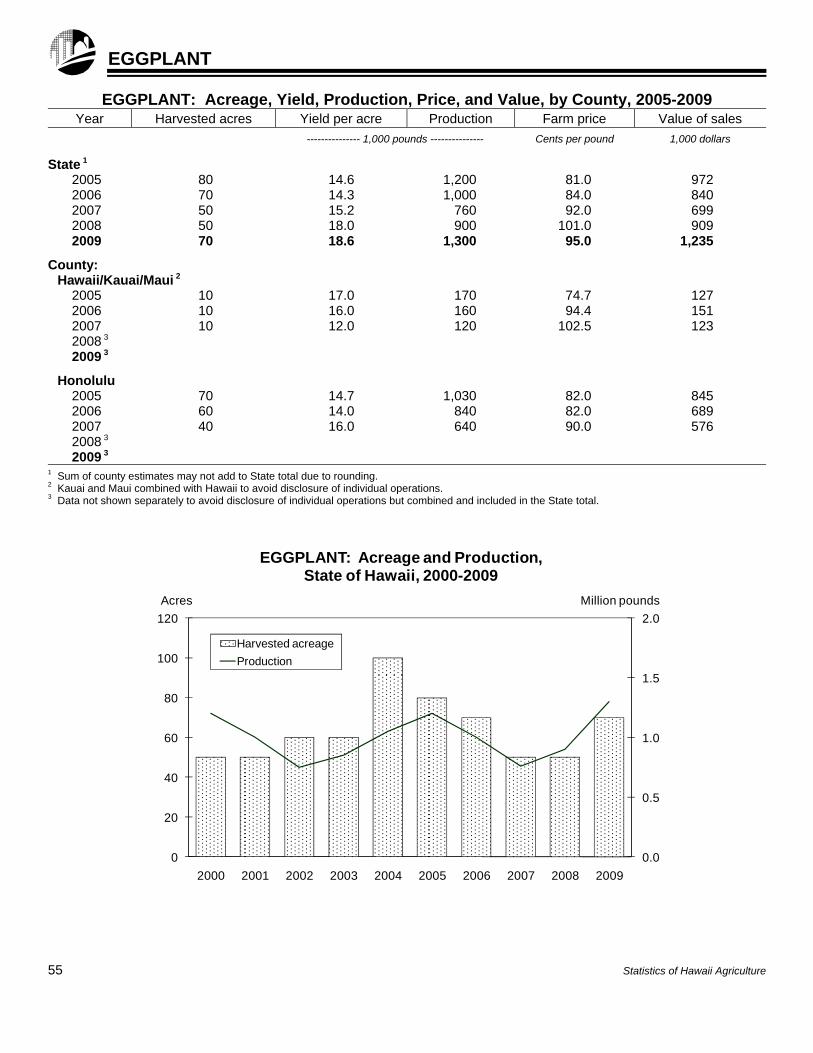
EGGPLANT
EGGPLANT: Acreage, Yield, Production, Price, and Value, by County, 2005-2009 Year Harvested acres Yield per acre Production Farm price Value of sales
--------------- 1,000 pounds --------------- Cents per pound 1,000 dollars
State 1
2005 80 14.6 1,200 81.0 972 2006 70 14.3 1,000 84.0 840 2007 50 15.2 760 92.0 699 2008 50 18.0 900 101.0 909 2009 70 18.6 1,300 95.0 1,235
County:
Hawaii/Kauai/Maui 2 2005 10 17.0 170 74.7 127 2006 10 16.0 160 94.4 151 2007 10 12.0 120 102.5 123 2008 3 2009 3
Honolulu 2005 70 14.7 1,030 82.0 845 2006 60 14.0 840 82.0 689 2007 40 16.0 640 90.0 576 2008 3 2009 3
1 Sum of county estimates may not add to State total due to rounding. 2 Kauai and Maui combined with Hawaii to avoid disclosure of individual operations. 3 Data not shown separately to avoid disclosure of individual operations but combined and included in the State total.
55 Statistics of Hawaii Agriculture
0.0
0.5
1.0
1.5
2.0
0
20
40
60
80
100
120
2000 2001 2002 2003 2004 2005 2006 2007 2008 2009
Million poundsAcres
EGGPLANT: Acreage and Production,State of Hawaii, 2000-2009
Harvested acreage
Production
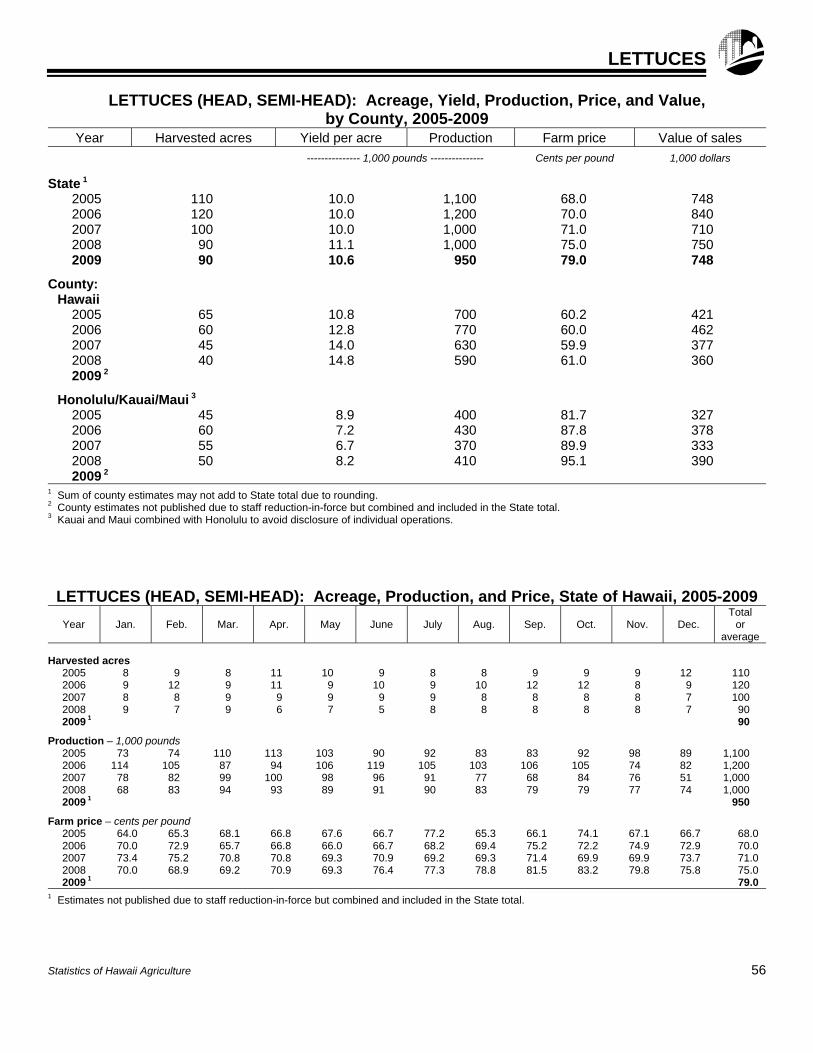
LETTUCES
LETTUCES (HEAD, SEMI-HEAD): Acreage, Yield, Production, Price, and Value, by County, 2005-2009
Year Harvested acres Yield per acre Production Farm price Value of sales
--------------- 1,000 pounds --------------- Cents per pound 1,000 dollars
State 1
2005 110 10.0 1,100 68.0 748 2006 120 10.0 1,200 70.0 840 2007 100 10.0 1,000 71.0 710 2008 90 11.1 1,000 75.0 750 2009 90 10.6 950 79.0 748
County:
Hawaii 2005 65 10.8 700 60.2 421 2006 60 12.8 770 60.0 462 2007 45 14.0 630 59.9 377 2008 40 14.8 590 61.0 360 2009 2
Honolulu/Kauai/Maui 3 2005 45 8.9 400 81.7 327 2006 60 7.2 430 87.8 378 2007 55 6.7 370 89.9 333 2008 50 8.2 410 95.1 390 2009 2
1 Sum of county estimates may not add to State total due to rounding. 2 County estimates not published due to staff reduction-in-force but combined and included in the State total. 3 Kauai and Maui combined with Honolulu to avoid disclosure of individual operations. LETTUCES (HEAD, SEMI-HEAD): Acreage, Production, and Price, State of Hawaii, 2005-2009
Year Jan. Feb. Mar. Apr. May June July Aug. Sep. Oct. Nov. Dec. Total
or average
Harvested acres
2005 8 9 8 11 10 9 8 8 9 9 9 12 110 2006 9 12 9 11 9 10 9 10 12 12 8 9 120 2007 8 8 9 9 9 9 9 8 8 8 8 7 100 2008 9 7 9 6 7 5 8 8 8 8 8 7 90 2009 1 90
Production – 1,000 pounds
2005 73 74 110 113 103 90 92 83 83 92 98 89 1,100 2006 114 105 87 94 106 119 105 103 106 105 74 82 1,200 2007 78 82 99 100 98 96 91 77 68 84 76 51 1,000 2008 68 83 94 93 89 91 90 83 79 79 77 74 1,000 2009 1 950
Farm price – cents per pound
2005 64.0 65.3 68.1 66.8 67.6 66.7 77.2 65.3 66.1 74.1 67.1 66.7 68.0 2006 70.0 72.9 65.7 66.8 66.0 66.7 68.2 69.4 75.2 72.2 74.9 72.9 70.0 2007 73.4 75.2 70.8 70.8 69.3 70.9 69.2 69.3 71.4 69.9 69.9 73.7 71.0 2008 70.0 68.9 69.2 70.9 69.3 76.4 77.3 78.8 81.5 83.2 79.8 75.8 75.0 2009 1 79.0
1 Estimates not published due to staff reduction-in-force but combined and included in the State total.
Statistics of Hawaii Agriculture 56
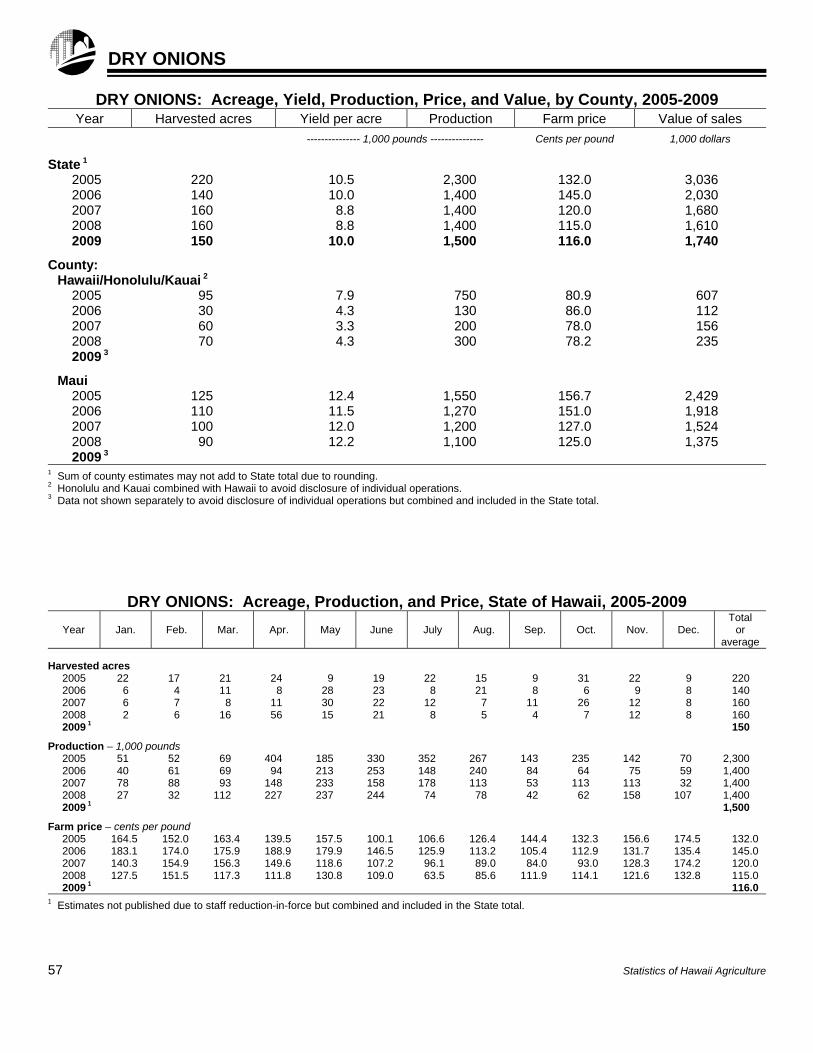
DRY ONIONS
DRY ONIONS: Acreage, Yield, Production, Price, and Value, by County, 2005-2009 Year Harvested acres Yield per acre Production Farm price Value of sales
--------------- 1,000 pounds --------------- Cents per pound 1,000 dollars
State 1
2005 220 10.5 2,300 132.0 3,036 2006 140 10.0 1,400 145.0 2,030 2007 160 8.8 1,400 120.0 1,680 2008 160 8.8 1,400 115.0 1,610 2009 150 10.0 1,500 116.0 1,740
County:
Hawaii/Honolulu/Kauai 2 2005 95 7.9 750 80.9 607 2006 30 4.3 130 86.0 112 2007 60 3.3 200 78.0 156 2008 70 4.3 300 78.2 235 2009 3
Maui 2005 125 12.4 1,550 156.7 2,429 2006 110 11.5 1,270 151.0 1,918 2007 100 12.0 1,200 127.0 1,524 2008 90 12.2 1,100 125.0 1,375 2009 3
1 Sum of county estimates may not add to State total due to rounding. 2 Honolulu and Kauai combined with Hawaii to avoid disclosure of individual operations. 3 Data not shown separately to avoid disclosure of individual operations but combined and included in the State total.
DRY ONIONS: Acreage, Production, and Price, State of Hawaii, 2005-2009
Year Jan. Feb. Mar. Apr. May June July Aug. Sep. Oct. Nov. Dec. Total
or average
Harvested acres
2005 22 17 21 24 9 19 22 15 9 31 22 9 220 2006 6 4 11 8 28 23 8 21 8 6 9 8 140 2007 6 7 8 11 30 22 12 7 11 26 12 8 160 2008 2 6 16 56 15 21 8 5 4 7 12 8 160 2009 1 150
Production – 1,000 pounds
2005 51 52 69 404 185 330 352 267 143 235 142 70 2,300 2006 40 61 69 94 213 253 148 240 84 64 75 59 1,400 2007 78 88 93 148 233 158 178 113 53 113 113 32 1,400 2008 27 32 112 227 237 244 74 78 42 62 158 107 1,400 2009 1 1,500
Farm price – cents per pound
2005 164.5 152.0 163.4 139.5 157.5 100.1 106.6 126.4 144.4 132.3 156.6 174.5 132.0 2006 183.1 174.0 175.9 188.9 179.9 146.5 125.9 113.2 105.4 112.9 131.7 135.4 145.0 2007 140.3 154.9 156.3 149.6 118.6 107.2 96.1 89.0 84.0 93.0 128.3 174.2 120.0 2008 127.5 151.5 117.3 111.8 130.8 109.0 63.5 85.6 111.9 114.1 121.6 132.8 115.0 2009 1 116.0
1 Estimates not published due to staff reduction-in-force but combined and included in the State total.
57 Statistics of Hawaii Agriculture

GREEN ONIONS
GREEN ONIONS: Acreage, Yield, Production, Price, and Value, by County, 2005-2009 Year Harvested acres Yield per acre Production Farm price Value of sales
--------------- 1,000 pounds --------------- Cents per pound 1,000 dollars
State 1
2005 155 11.0 1,700 99.0 1,683 2006 130 11.5 1,500 100.0 1,500 2007 135 10.4 1,400 114.0 1,596 2008 125 12.8 1,600 124.0 1,984 2009 120 11.7 1,400 129.0 1,810
County:
Hawaii/Kauai/Maui 2 2005 15 13.3 200 114.0 228 2006 15 18.0 270 113.8 307 2007 15 13.3 200 137.8 276 2008 20 15.0 300 145.5 437 2009 3
Honolulu 2005 140 10.7 1,500 97.0 1,455 2006 115 10.7 1,230 97.0 1,193 2007 120 10.0 1,200 110.0 1,320 2008 105 12.4 1,300 119.0 1,547 2009 3
1 Sum of county estimates may not add to State total due to rounding. 2 Kauai and Maui combined with Hawaii to avoid disclosure of individual operations. 3 County estimates not published due to staff reduction-in-force but combined and included in the State total.
GREEN ONIONS: Acreage, Production, and Price, State of Hawaii, 2005-2009
Year Jan. Feb. Mar. Apr. May June July Aug. Sep. Oct. Nov. Dec. Total
or average
Harvested acres
2005 15 14 13 15 14 14 9 10 11 11 12 17 155 2006 12 10 11 9 9 9 12 12 11 11 11 13 130 2007 10 13 12 13 11 11 11 10 11 11 11 11 135 2008 11 9 10 10 10 11 11 10 10 11 11 11 125 2009 1 120
Production – 1,000 pounds
2005 104 88 131 132 157 145 147 141 148 148 161 198 1,700 2006 123 129 114 58 135 143 125 135 117 128 167 126 1,500 2007 109 136 122 122 124 106 105 117 117 119 124 99 1,400 2008 128 131 143 124 150 129 140 132 142 141 126 114 1,600 2009 1 1,400
Farm price – cents per pound
2005 112.6 127.3 126.3 107.2 100.4 93.6 91.3 87.3 84.6 91.6 91.6 94.9 99.0 2006 98.8 101.4 108.4 132.8 104.9 91.7 92.0 91.0 90.3 92.3 107.2 106.5 100.0 2007 137.5 112.4 107.6 104.4 96.2 112.0 104.9 113.1 119.1 113.8 113.2 140.5 114.0 2008 138.8 134.6 119.9 114.9 113.8 113.8 118.8 128.5 129.1 126.2 122.1 129.1 124.0 2009 1 129.0
1 Estimates not published due to staff reduction-in-force but combined and included in the State total.
Statistics of Hawaii Agriculture 58
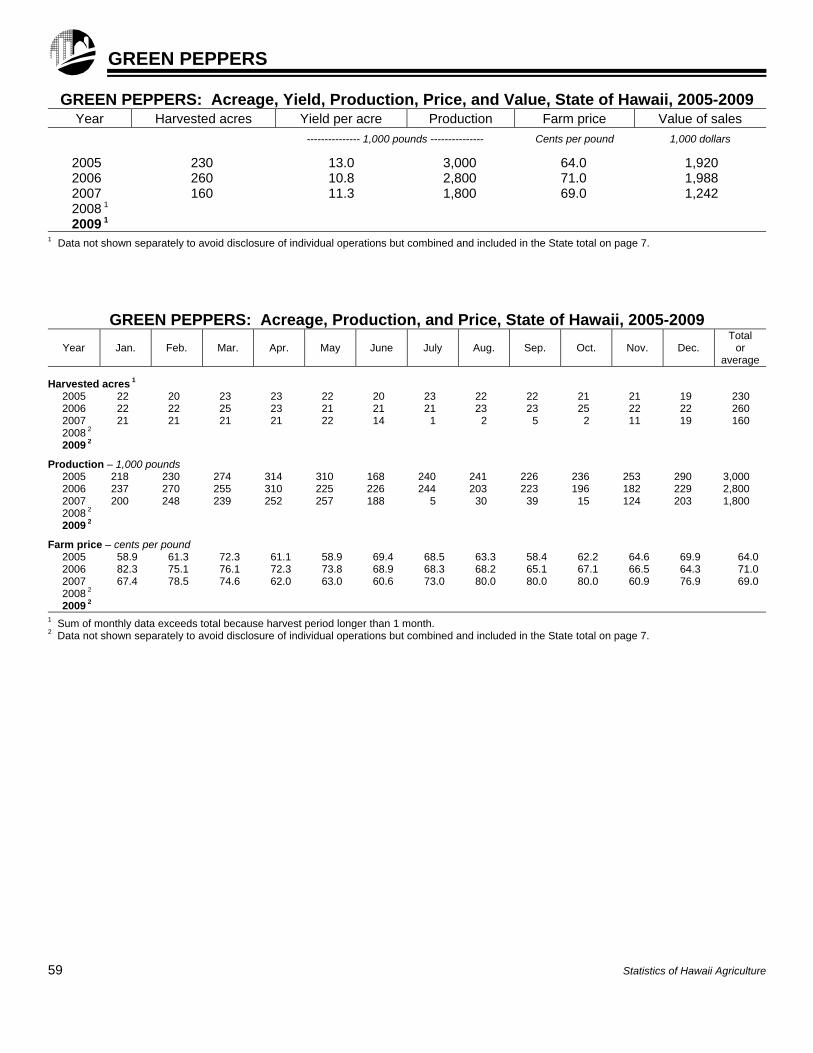
GREEN PEPPERS
GREEN PEPPERS: Acreage, Yield, Production, Price, and Value, State of Hawaii, 2005-2009 Year Harvested acres Yield per acre Production Farm price Value of sales
--------------- 1,000 pounds --------------- Cents per pound 1,000 dollars
2005 230 13.0 3,000 64.0 1,920 2006 260 10.8 2,800 71.0 1,988 2007 160 11.3 1,800 69.0 1,242 2008 1 2009 1
1 Data not shown separately to avoid disclosure of individual operations but combined and included in the State total on page 7.
GREEN PEPPERS: Acreage, Production, and Price, State of Hawaii, 2005-2009
Year Jan. Feb. Mar. Apr. May June July Aug. Sep. Oct. Nov. Dec. Total
or average
Harvested acres 1
2005 22 20 23 23 22 20 23 22 22 21 21 19 230 2006 22 22 25 23 21 21 21 23 23 25 22 22 260 2007 21 21 21 21 22 14 1 2 5 2 11 19 160 2008 2 2009 2
Production – 1,000 pounds
2005 218 230 274 314 310 168 240 241 226 236 253 290 3,000 2006 237 270 255 310 225 226 244 203 223 196 182 229 2,800 2007 200 248 239 252 257 188 5 30 39 15 124 203 1,800 2008 2 2009 2
Farm price – cents per pound
2005 58.9 61.3 72.3 61.1 58.9 69.4 68.5 63.3 58.4 62.2 64.6 69.9 64.0 2006 82.3 75.1 76.1 72.3 73.8 68.9 68.3 68.2 65.1 67.1 66.5 64.3 71.0 2007 67.4 78.5 74.6 62.0 63.0 60.6 73.0 80.0 80.0 80.0 60.9 76.9 69.0 2008 2 2009 2
1 Sum of monthly data exceeds total because harvest period longer than 1 month. 2 Data not shown separately to avoid disclosure of individual operations but combined and included in the State total on page 7.
59 Statistics of Hawaii Agriculture
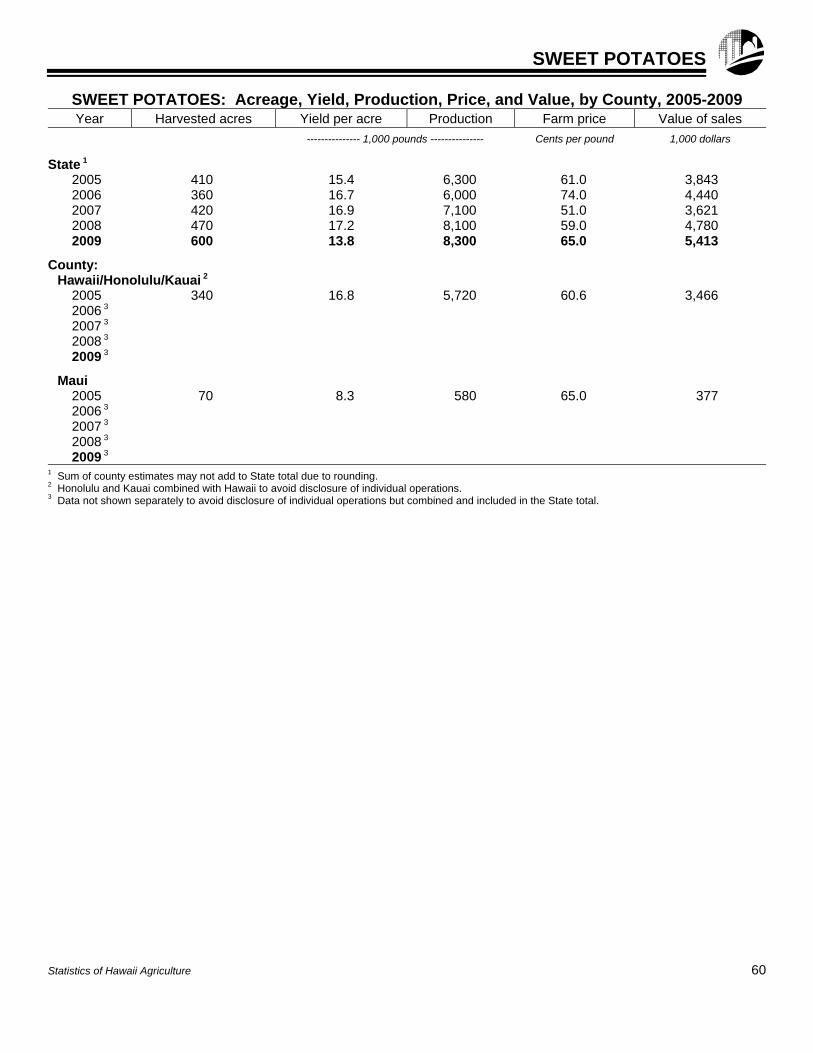
SWEET POTATOES
SWEET POTATOES: Acreage, Yield, Production, Price, and Value, by County, 2005-2009 Year Harvested acres Yield per acre Production Farm price Value of sales
--------------- 1,000 pounds --------------- Cents per pound 1,000 dollars
State 1
2005 410 15.4 6,300 61.0 3,843 2006 360 16.7 6,000 74.0 4,440 2007 420 16.9 7,100 51.0 3,621 2008 470 17.2 8,100 59.0 4,780 2009 600 13.8 8,300 65.0 5,413
County:
Hawaii/Honolulu/Kauai 2 2005 340 16.8 5,720 60.6 3,466 2006 3 2007 3 2008 3 2009 3
Maui 2005 70 8.3 580 65.0 377 2006 3 2007 3 2008 3 2009 3
1 Sum of county estimates may not add to State total due to rounding. 2 Honolulu and Kauai combined with Hawaii to avoid disclosure of individual operations. 3 Data not shown separately to avoid disclosure of individual operations but combined and included in the State total.
Statistics of Hawaii Agriculture 60
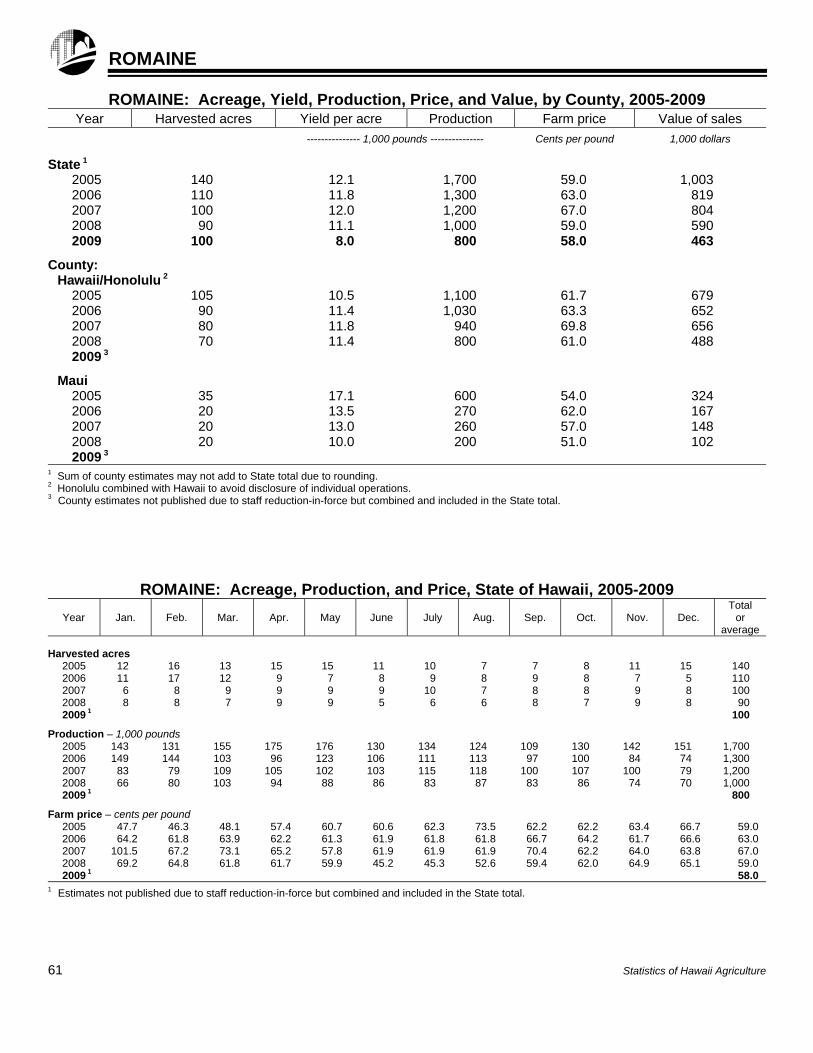
ROMAINE
ROMAINE: Acreage, Yield, Production, Price, and Value, by County, 2005-2009 Year Harvested acres Yield per acre Production Farm price Value of sales
--------------- 1,000 pounds --------------- Cents per pound 1,000 dollars
State 1
2005 140 12.1 1,700 59.0 1,003 2006 110 11.8 1,300 63.0 819 2007 100 12.0 1,200 67.0 804 2008 90 11.1 1,000 59.0 590 2009 100 8.0 800 58.0 463
County:
Hawaii/Honolulu 2 2005 105 10.5 1,100 61.7 679 2006 90 11.4 1,030 63.3 652 2007 80 11.8 940 69.8 656 2008 70 11.4 800 61.0 488 2009 3
Maui 2005 35 17.1 600 54.0 324 2006 20 13.5 270 62.0 167 2007 20 13.0 260 57.0 148 2008 20 10.0 200 51.0 102 2009 3
1 Sum of county estimates may not add to State total due to rounding. 2 Honolulu combined with Hawaii to avoid disclosure of individual operations. 3 County estimates not published due to staff reduction-in-force but combined and included in the State total.
ROMAINE: Acreage, Production, and Price, State of Hawaii, 2005-2009
Year Jan. Feb. Mar. Apr. May June July Aug. Sep. Oct. Nov. Dec. Total
or average
Harvested acres
2005 12 16 13 15 15 11 10 7 7 8 11 15 140 2006 11 17 12 9 7 8 9 8 9 8 7 5 110 2007 6 8 9 9 9 9 10 7 8 8 9 8 100 2008 8 8 7 9 9 5 6 6 8 7 9 8 90 2009 1 100
Production – 1,000 pounds
2005 143 131 155 175 176 130 134 124 109 130 142 151 1,700 2006 149 144 103 96 123 106 111 113 97 100 84 74 1,300 2007 83 79 109 105 102 103 115 118 100 107 100 79 1,200 2008 66 80 103 94 88 86 83 87 83 86 74 70 1,000 2009 1 800
Farm price – cents per pound
2005 47.7 46.3 48.1 57.4 60.7 60.6 62.3 73.5 62.2 62.2 63.4 66.7 59.0 2006 64.2 61.8 63.9 62.2 61.3 61.9 61.8 61.8 66.7 64.2 61.7 66.6 63.0 2007 101.5 67.2 73.1 65.2 57.8 61.9 61.9 61.9 70.4 62.2 64.0 63.8 67.0 2008 69.2 64.8 61.8 61.7 59.9 45.2 45.3 52.6 59.4 62.0 64.9 65.1 59.0 2009 1 58.0
1 Estimates not published due to staff reduction-in-force but combined and included in the State total.
61 Statistics of Hawaii Agriculture
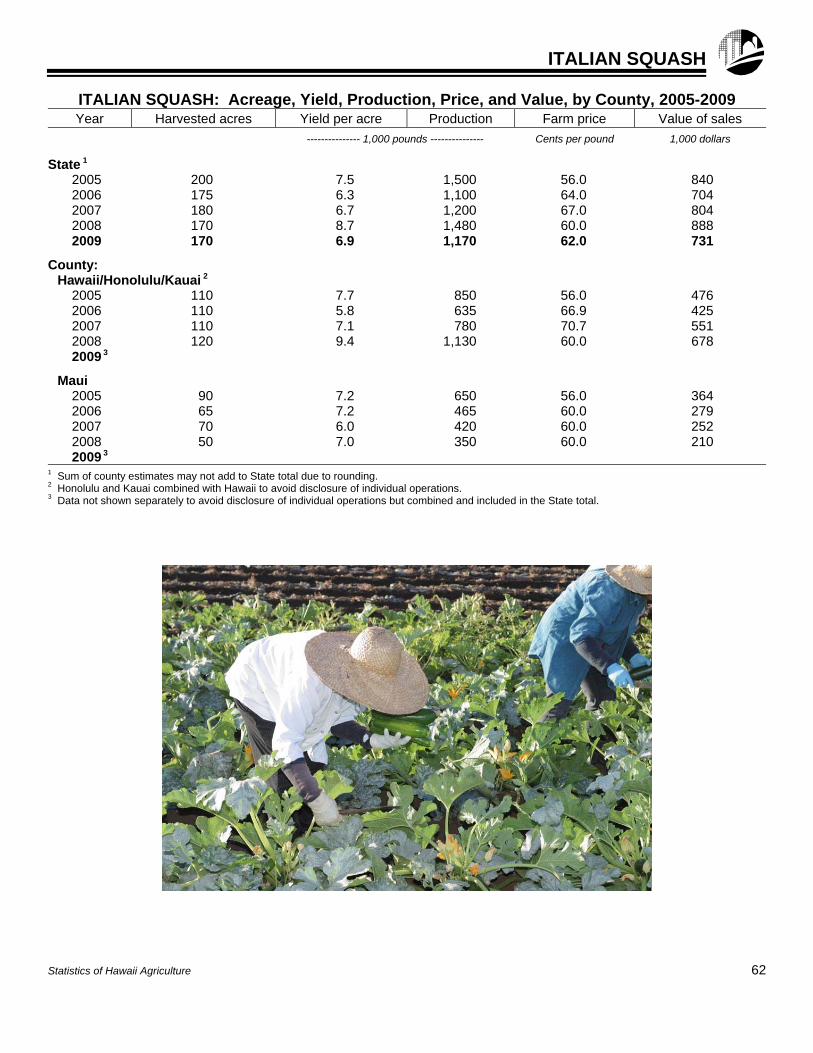
ITALIAN SQUASH
ITALIAN SQUASH: Acreage, Yield, Production, Price, and Value, by County, 2005-2009 Year Harvested acres Yield per acre Production Farm price Value of sales
--------------- 1,000 pounds --------------- Cents per pound 1,000 dollars
State 1
2005 200 7.5 1,500 56.0 840 2006 175 6.3 1,100 64.0 704 2007 180 6.7 1,200 67.0 804 2008 170 8.7 1,480 60.0 888 2009 170 6.9 1,170 62.0 731
County:
Hawaii/Honolulu/Kauai 2 2005 110 7.7 850 56.0 476 2006 110 5.8 635 66.9 425 2007 110 7.1 780 70.7 551 2008 120 9.4 1,130 60.0 678 2009 3
Maui 2005 90 7.2 650 56.0 364 2006 65 7.2 465 60.0 279 2007 70 6.0 420 60.0 252 2008 50 7.0 350 60.0 210 2009 3
1 Sum of county estimates may not add to State total due to rounding. 2 Honolulu and Kauai combined with Hawaii to avoid disclosure of individual operations. 3 Data not shown separately to avoid disclosure of individual operations but combined and included in the State total.
Statistics of Hawaii Agriculture 62
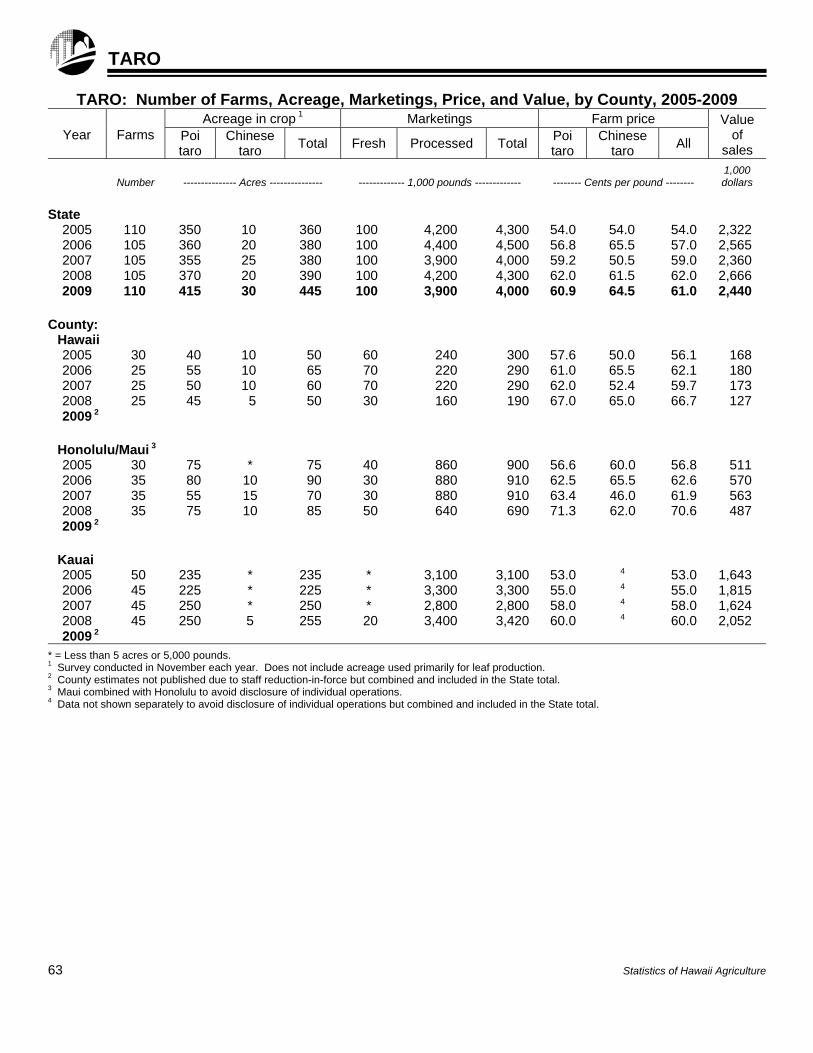
TARO
TARO: Number of Farms, Acreage, Marketings, Price, and Value, by County, 2005-2009
Year Farms Acreage in crop 1 Marketings Farm price Value
of sales
Poi taro
Chinese taro
Total Fresh Processed Total Poi taro
Chinese taro
All
Number
--------------- Acres ---------------
------------- 1,000 pounds -------------
-------- Cents per pound --------
1,000 dollars
State
2005 110 350 10 360 100 4,200 4,300 54.0 54.0 54.0 2,322 2006 105 360 20 380 100 4,400 4,500 56.8 65.5 57.0 2,565 2007 105 355 25 380 100 3,900 4,000 59.2 50.5 59.0 2,360 2008 105 370 20 390 100 4,200 4,300 62.0 61.5 62.0 2,666 2009 110 415 30 445 100 3,900 4,000 60.9 64.5 61.0 2,440
County: Hawaii 2005 30 40 10 50 60 240 300 57.6 50.0 56.1 168 2006 25 55 10 65 70 220 290 61.0 65.5 62.1 180 2007 25 50 10 60 70 220 290 62.0 52.4 59.7 173 2008 25 45 5 50 30 160 190 67.0 65.0 66.7 127 2009 2
Honolulu/Maui 3
2005 30 75 * 75 40 860 900 56.6 60.0 56.8 511 2006 35 80 10 90 30 880 910 62.5 65.5 62.6 570 2007 35 55 15 70 30 880 910 63.4 46.0 61.9 563 2008 35 75 10 85 50 640 690 71.3 62.0 70.6 487 2009 2
Kauai 2005 50 235 * 235 * 3,100 3,100 53.0 4 53.0 1,643 2006 45 225 * 225 * 3,300 3,300 55.0 4 55.0 1,815 2007 45 250 * 250 * 2,800 2,800 58.0 4 58.0 1,624 2008 45 250 5 255 20 3,400 3,420 60.0 4 60.0 2,052 2009 2
* = Less than 5 acres or 5,000 pounds. 1 Survey conducted in November each year. Does not include acreage used primarily for leaf production. 2 County estimates not published due to staff reduction-in-force but combined and included in the State total. 3 Maui combined with Honolulu to avoid disclosure of individual operations. 4 Data not shown separately to avoid disclosure of individual operations but combined and included in the State total.
63 Statistics of Hawaii Agriculture
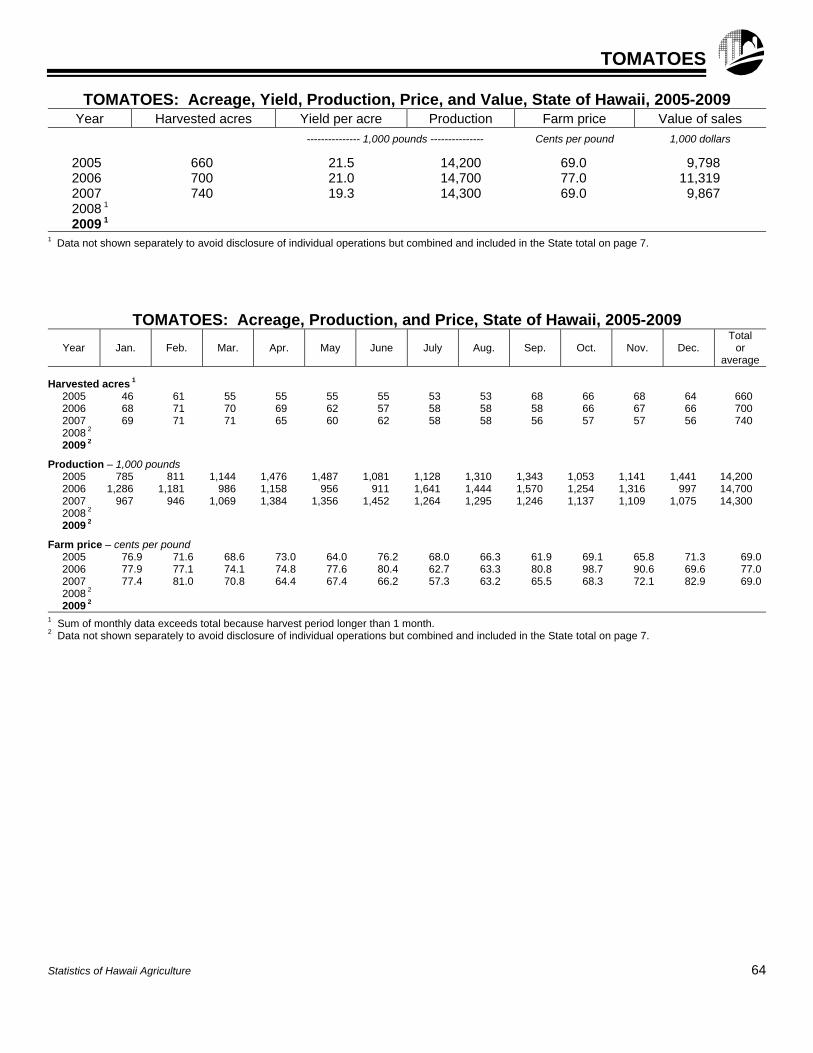
TOMATOES
TOMATOES: Acreage, Yield, Production, Price, and Value, State of Hawaii, 2005-2009 Year Harvested acres Yield per acre Production Farm price Value of sales
--------------- 1,000 pounds --------------- Cents per pound 1,000 dollars
2005 660 21.5 14,200 69.0 9,798 2006 700 21.0 14,700 77.0 11,319 2007 740 19.3 14,300 69.0 9,867 2008 1 2009 1
1 Data not shown separately to avoid disclosure of individual operations but combined and included in the State total on page 7.
TOMATOES: Acreage, Production, and Price, State of Hawaii, 2005-2009
Year Jan. Feb. Mar. Apr. May June July Aug. Sep. Oct. Nov. Dec. Total
or average
Harvested acres 1
2005 46 61 55 55 55 55 53 53 68 66 68 64 660 2006 68 71 70 69 62 57 58 58 58 66 67 66 700 2007 69 71 71 65 60 62 58 58 56 57 57 56 740 2008 2 2009 2
Production – 1,000 pounds
2005 785 811 1,144 1,476 1,487 1,081 1,128 1,310 1,343 1,053 1,141 1,441 14,200 2006 1,286 1,181 986 1,158 956 911 1,641 1,444 1,570 1,254 1,316 997 14,700 2007 967 946 1,069 1,384 1,356 1,452 1,264 1,295 1,246 1,137 1,109 1,075 14,300 2008 2 2009 2
Farm price – cents per pound
2005 76.9 71.6 68.6 73.0 64.0 76.2 68.0 66.3 61.9 69.1 65.8 71.3 69.02006 77.9 77.1 74.1 74.8 77.6 80.4 62.7 63.3 80.8 98.7 90.6 69.6 77.02007 77.4 81.0 70.8 64.4 67.4 66.2 57.3 63.2 65.5 68.3 72.1 82.9 69.02008 2 2009 2
1 Sum of monthly data exceeds total because harvest period longer than 1 month. 2 Data not shown separately to avoid disclosure of individual operations but combined and included in the State total on page 7.
Statistics of Hawaii Agriculture 64
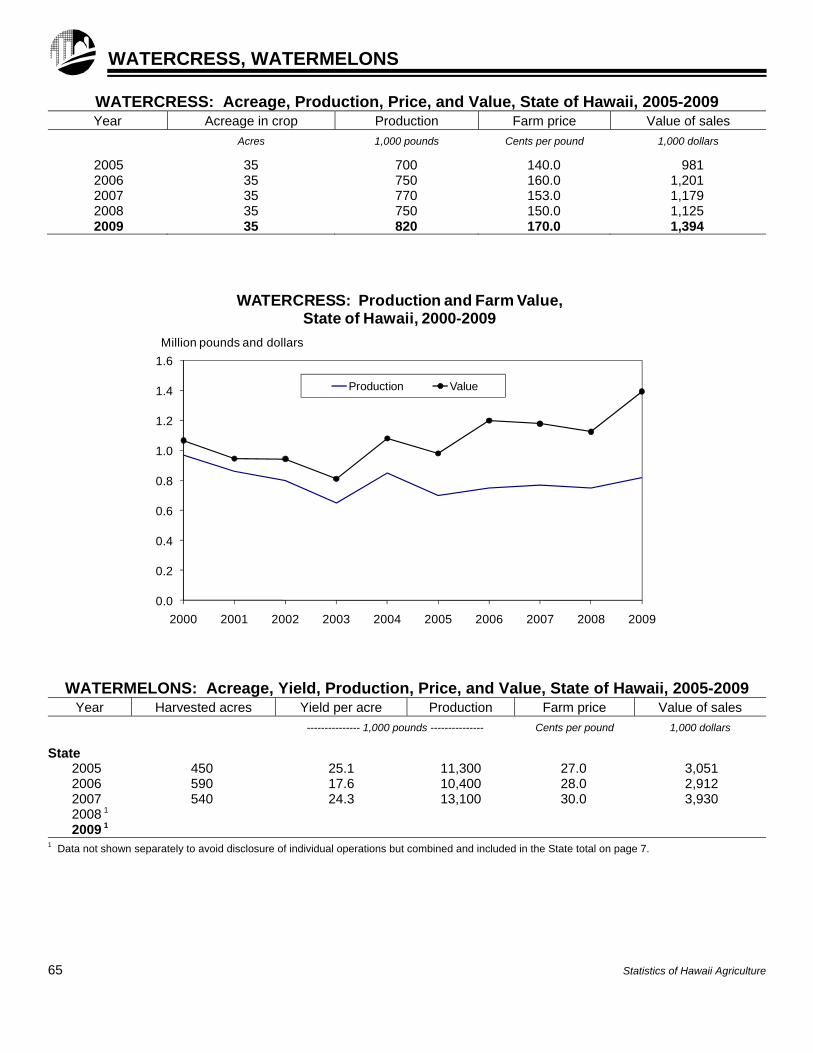
WATERCRESS, WATERMELONS
WATERCRESS: Acreage, Production, Price, and Value, State of Hawaii, 2005-2009 Year Acreage in crop Production Farm price Value of sales
Acres 1,000 pounds Cents per pound 1,000 dollars
2005 35 700 140.0 981 2006 35 750 160.0 1,201 2007 35 770 153.0 1,179 2008 35 750 150.0 1,125 2009 35 820 170.0 1,394
WATERMELONS: Acreage, Yield, Production, Price, and Value, State of Hawaii, 2005-2009 Year Harvested acres Yield per acre Production Farm price Value of sales
--------------- 1,000 pounds --------------- Cents per pound 1,000 dollars
State
2005 450 25.1 11,300 27.0 3,051 2006 590 17.6 10,400 28.0 2,912 2007 540 24.3 13,100 30.0 3,930 2008 1 2009 1
1 Data not shown separately to avoid disclosure of individual operations but combined and included in the State total on page 7.
65 Statistics of Hawaii Agriculture
0.0
0.2
0.4
0.6
0.8
1.0
1.2
1.4
1.6
2000 2001 2002 2003 2004 2005 2006 2007 2008 2009
Million pounds and dollars
WATERCRESS: Production and Farm Value,State of Hawaii, 2000-2009
Production Value
OTHER VEGETABLES
OTHER VEGETABLES: Acreage, Yield, Production, Price, and Value, State of Hawaii, 2005-2009
Crop and year
Harvested acres Yield per acre Production Farm price Value of sales
--------------- 1,000 pounds --------------- Cents per pound 1,000 dollars
Bittermelon
2005 30 8.3 250 93.0 233 2006 25 7.2 180 80.0 144 2007 20 7.5 150 82.0 123 2008 20 7.0 140 90.0 126 2009 20 18.0 360 99.0 358
Broccoli
2005 125 4.8 600 73.0 438 2006 60 5.5 330 84.0 277 2007 80 4.9 390 93.0 363 2008 80 4.5 360 97.0 349 2009 115 2.6 300 80.0 240
Cabbage, mustard 2005 110 12.7 1,400 56.0 784 2006 115 12.2 1,400 58.0 812 2007 105 13.3 1,400 63.0 882 2008 95 13.7 1,300 70.0 910 2009 95 13.7 1,300 73.0 952
Pumpkins 2005 35 2.3 80 63.0 50 2006 25 11.6 290 60.0 174 2007 40 11.8 470 52.0 244 2008 30 3.0 90 66.0 59 2009 1
Squash, Oriental (Hyotan and Togan) 2005 40 11.3 450 55.0 247 2006 40 10.0 400 46.0 184 2007 40 12.5 500 44.0 220 2008 40 8.8 350 62.0 217 2009 40 8.5 340 54.0 185
1 Data not shown separately to avoid disclosure of individual operations but combined and included in the State total on page 7.
Statistics of Hawaii Agriculture 66
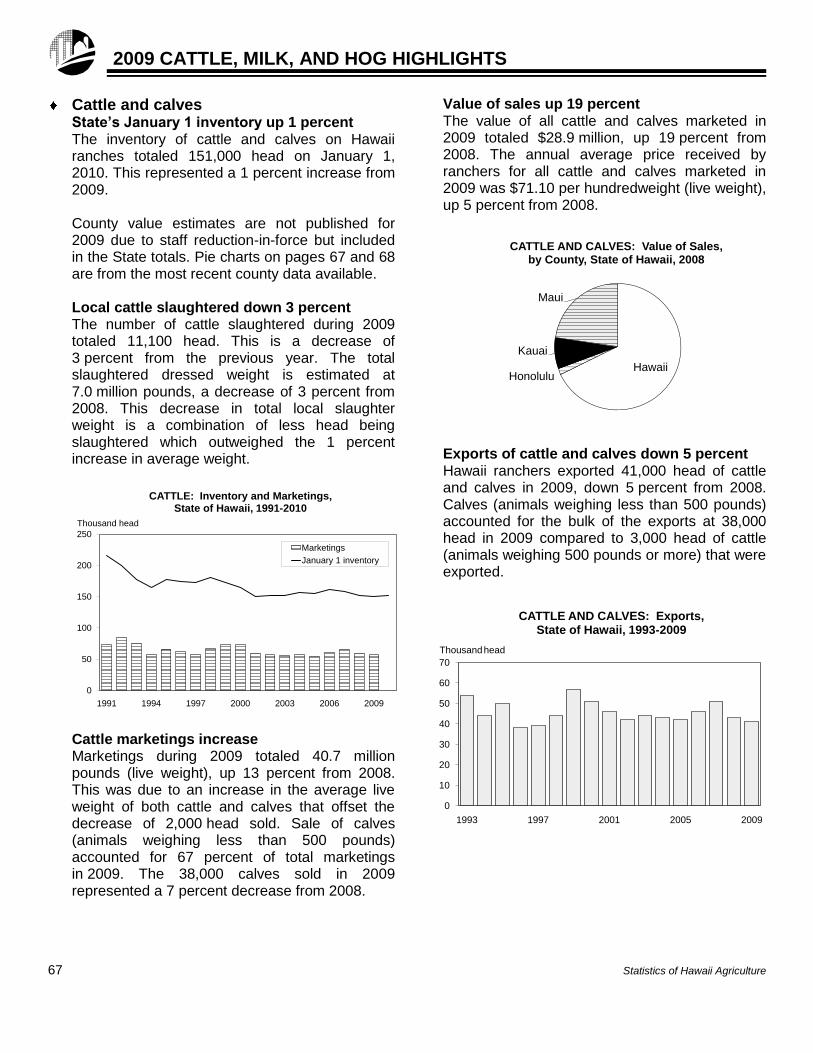
2009 CATTLE, MILK, AND HOG HIGHLIGHTS
Cattle and calves
State’s January 1 inventory up 1 percent The inventory of cattle and calves on Hawaii ranches totaled 151,000 head on January 1, 2010. This represented a 1 percent increase from 2009. County value estimates are not published for 2009 due to staff reduction-in-force but included in the State totals. Pie charts on pages 67 and 68 are from the most recent county data available. Local cattle slaughtered down 3 percent The number of cattle slaughtered during 2009 totaled 11,100 head. This is a decrease of 3 percent from the previous year. The total slaughtered dressed weight is estimated at 7.0 million pounds, a decrease of 3 percent from 2008. This decrease in total local slaughter weight is a combination of less head being slaughtered which outweighed the 1 percent increase in average weight.
0
50
100
150
200
250
1991 1994 1997 2000 2003 2006 2009
Thousand head
CATTLE: Inventory and Marketings,State of Hawaii, 1991-2010
Marketings
January 1 inventory
Cattle marketings increase Marketings during 2009 totaled 40.7 million pounds (live weight), up 13 percent from 2008. This was due to an increase in the average live weight of both cattle and calves that offset the decrease of 2,000 head sold. Sale of calves (animals weighing less than 500 pounds) accounted for 67 percent of total marketings in 2009. The 38,000 calves sold in 2009 represented a 7 percent decrease from 2008.
Value of sales up 19 percent The value of all cattle and calves marketed in 2009 totaled $28.9 million, up 19 percent from 2008. The annual average price received by ranchers for all cattle and calves marketed in 2009 was $71.10 per hundredweight (live weight), up 5 percent from 2008.
HawaiiHonolulu
Kauai
Maui
CATTLE AND CALVES: Value of Sales,by County, State of Hawaii, 2008
Exports of cattle and calves down 5 percent Hawaii ranchers exported 41,000 head of cattle and calves in 2009, down 5 percent from 2008. Calves (animals weighing less than 500 pounds) accounted for the bulk of the exports at 38,000 head in 2009 compared to 3,000 head of cattle (animals weighing 500 pounds or more) that were exported.
0
10
20
30
40
50
60
70
1993 1997 2001 2005 2009
Thousandhead
CATTLE AND CALVES: Exports,State of Hawaii, 1993-2009
67 Statistics of Hawaii Agriculture
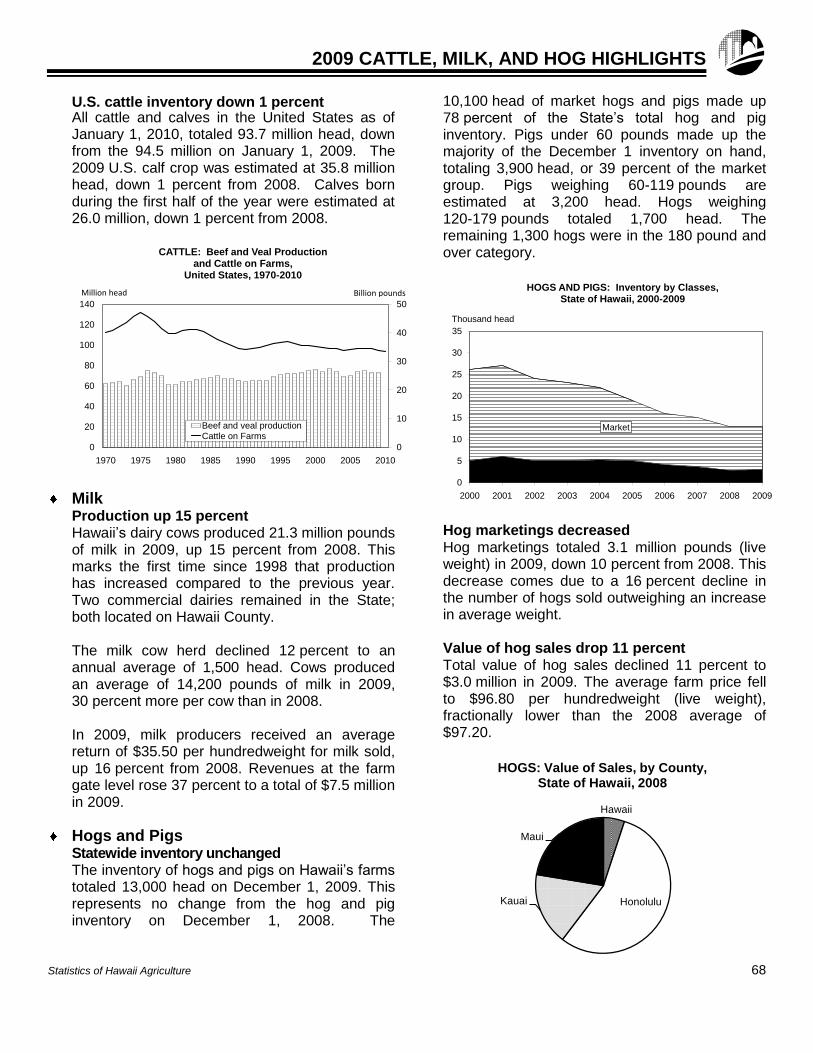
2009 CATTLE, MILK, AND HOG HIGHLIGHTS
U.S. cattle inventory down 1 percent All cattle and calves in the United States as of January 1, 2010, totaled 93.7 million head, down from the 94.5 million on January 1, 2009. The 2009 U.S. calf crop was estimated at 35.8 million head, down 1 percent from 2008. Calves born during the first half of the year were estimated at 26.0 million, down 1 percent from 2008.
0
10
20
30
40
50
0
20
40
60
80
100
120
140
1970 1975 1980 1985 1990 1995 2000 2005 2010
CATTLE: Beef and Veal Productionand Cattle on Farms,
United States, 1970-2010
Beef and veal productionCattle on Farms
Million head Billion pounds
Milk Production up 15 percent Hawaii’s dairy cows produced 21.3 million pounds of milk in 2009, up 15 percent from 2008. This marks the first time since 1998 that production has increased compared to the previous year. Two commercial dairies remained in the State; both located on Hawaii County. The milk cow herd declined 12 percent to an annual average of 1,500 head. Cows produced an average of 14,200 pounds of milk in 2009, 30 percent more per cow than in 2008. In 2009, milk producers received an average return of $35.50 per hundredweight for milk sold, up 16 percent from 2008. Revenues at the farm gate level rose 37 percent to a total of $7.5 million in 2009.
Hogs and Pigs Statewide inventory unchanged The inventory of hogs and pigs on Hawaii’s farms totaled 13,000 head on December 1, 2009. This represents no change from the hog and pig inventory on December 1, 2008. The
10,100 head of market hogs and pigs made up 78 percent of the State’s total hog and pig inventory. Pigs under 60 pounds made up the majority of the December 1 inventory on hand, totaling 3,900 head, or 39 percent of the market group. Pigs weighing 60-119 pounds are estimated at 3,200 head. Hogs weighing 120-179 pounds totaled 1,700 head. The remaining 1,300 hogs were in the 180 pound and over category.
Breeding
Market
0
5
10
15
20
25
30
35
2000 2001 2002 2003 2004 2005 2006 2007 2008 2009
Thousand head
HOGS AND PIGS: Inventory by Classes,State of Hawaii, 2000-2009
Hog marketings decreased Hog marketings totaled 3.1 million pounds (live weight) in 2009, down 10 percent from 2008. This decrease comes due to a 16 percent decline in the number of hogs sold outweighing an increase in average weight. Value of hog sales drop 11 percent Total value of hog sales declined 11 percent to $3.0 million in 2009. The average farm price fell to $96.80 per hundredweight (live weight), fractionally lower than the 2008 average of $97.20.
Hawaii
HonoluluKauai
Maui
HOGS: Value of Sales, by County,State of Hawaii, 2008
Statistics of Hawaii Agriculture 68
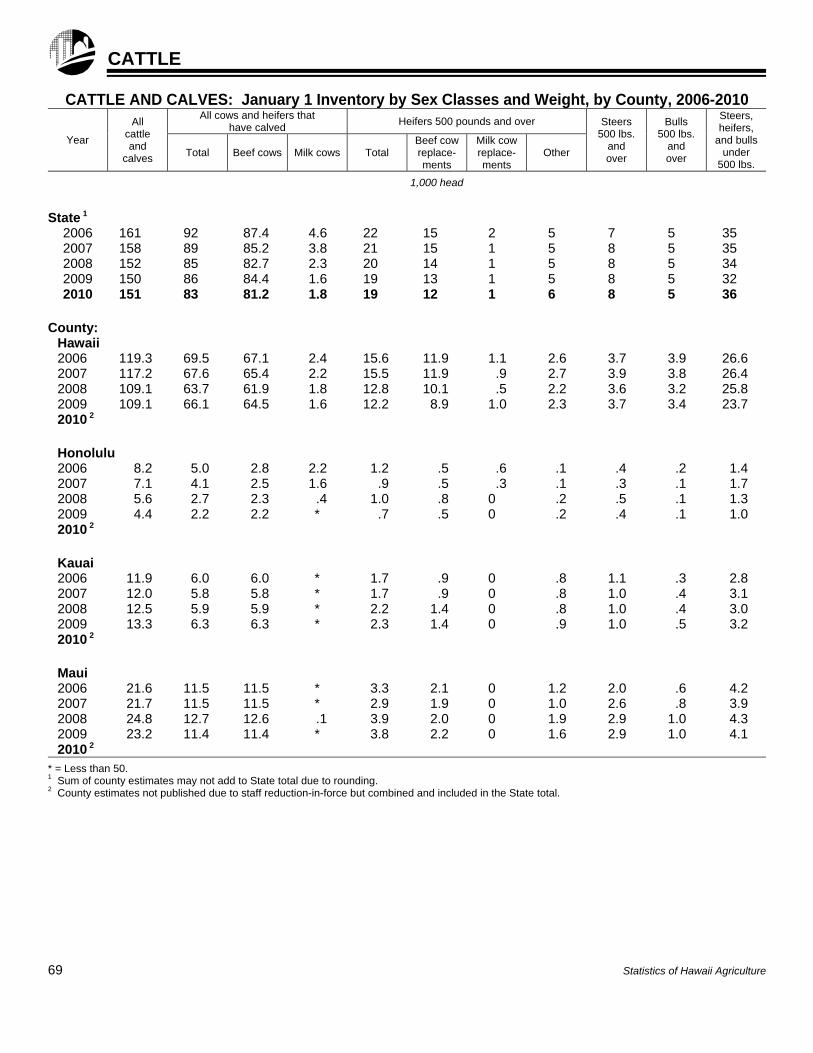
CATTLE
CATTLE AND CALVES: January 1 Inventory by Sex Classes and Weight, by County, 2006-2010
Year
All cattle and
calves
All cows and heifers that have calved
Heifers 500 pounds and over Steers 500 lbs.
and over
Bulls 500 lbs.
and over
Steers, heifers,
and bulls under
500 lbs. Total Beef cows Milk cows Total
Beef cow replace-ments
Milk cow replace-ments
Other
1,000 head
State 1 2006 161 92 87.4 4.6 22 15 2 5 7 5 35 2007 158 89 85.2 3.8 21 15 1 5 8 5 35 2008 152 85 82.7 2.3 20 14 1 5 8 5 34 2009 150 86 84.4 1.6 19 13 1 5 8 5 32 2010 151 83 81.2 1.8 19 12 1 6 8 5 36
County: Hawaii 2006 119.3 69.5 67.1 2.4 15.6 11.9 1.1 2.6 3.7 3.9 26.6 2007 117.2 67.6 65.4 2.2 15.5 11.9 .9 2.7 3.9 3.8 26.4 2008 109.1 63.7 61.9 1.8 12.8 10.1 .5 2.2 3.6 3.2 25.8 2009 109.1 66.1 64.5 1.6 12.2 8.9 1.0 2.3 3.7 3.4 23.7 2010 2
Honolulu 2006 8.2 5.0 2.8 2.2 1.2 .5 .6 .1 .4 .2 1.4 2007 7.1 4.1 2.5 1.6 .9 .5 .3 .1 .3 .1 1.7 2008 5.6 2.7 2.3 .4 1.0 .8 0 .2 .5 .1 1.3 2009 4.4 2.2 2.2 * .7 .5 0 .2 .4 .1 1.0 2010 2
Kauai 2006 11.9 6.0 6.0 * 1.7 .9 0 .8 1.1 .3 2.8 2007 12.0 5.8 5.8 * 1.7 .9 0 .8 1.0 .4 3.1 2008 12.5 5.9 5.9 * 2.2 1.4 0 .8 1.0 .4 3.0 2009 13.3 6.3 6.3 * 2.3 1.4 0 .9 1.0 .5 3.2 2010 2
Maui 2006 21.6 11.5 11.5 * 3.3 2.1 0 1.2 2.0 .6 4.2 2007 21.7 11.5 11.5 * 2.9 1.9 0 1.0 2.6 .8 3.9 2008 24.8 12.7 12.6 .1 3.9 2.0 0 1.9 2.9 1.0 4.3 2009 23.2 11.4 11.4 * 3.8 2.2 0 1.6 2.9 1.0 4.1 2010 2
* = Less than 50. 1 Sum of county estimates may not add to State total due to rounding. 2 County estimates not published due to staff reduction-in-force but combined and included in the State total.
69 Statistics of Hawaii Agriculture
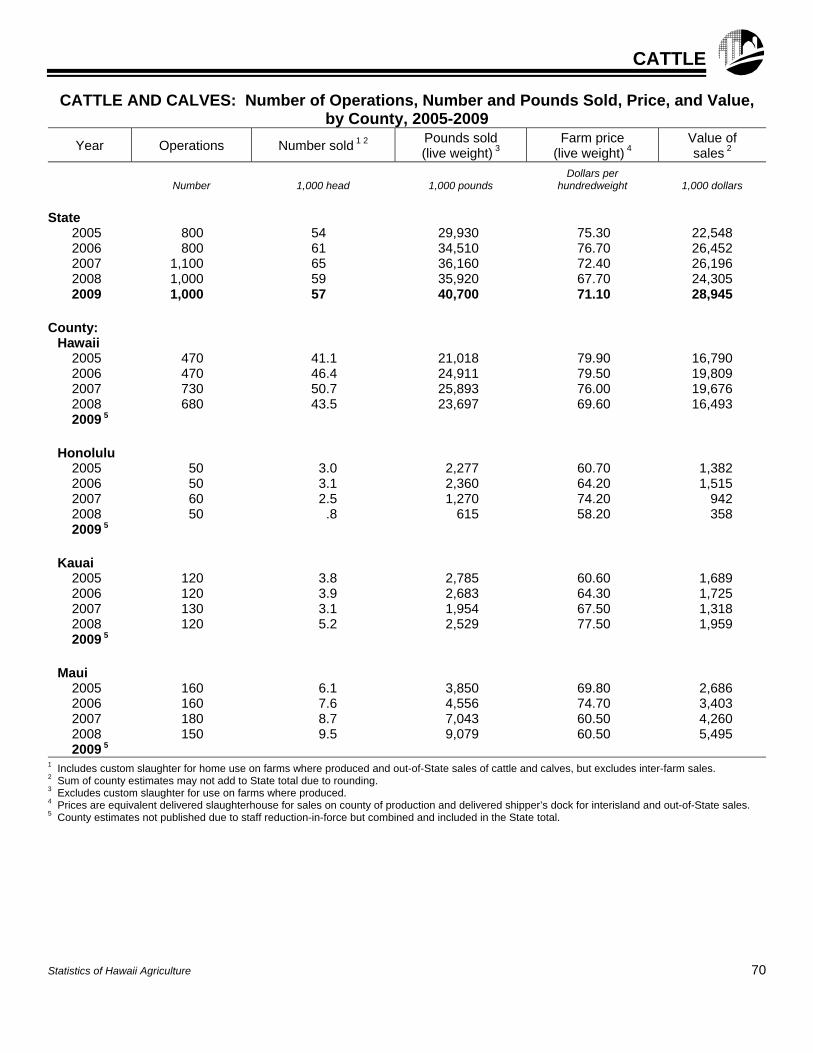
CATTLE
CATTLE AND CALVES: Number of Operations, Number and Pounds Sold, Price, and Value, by County, 2005-2009
Year Operations Number sold 1 2 Pounds sold (live weight) 3
Farm price (live weight) 4
Value of sales 2
Number
1,000 head
1,000 pounds
Dollars per hundredweight
1,000 dollars
State
2005 800 54 29,930 75.30 22,548 2006 800 61 34,510 76.70 26,452 2007 1,100 65 36,160 72.40 26,196 2008 1,000 59 35,920 67.70 24,305 2009 1,000 57 40,700 71.10 28,945
County:
Hawaii 2005 470 41.1 21,018 79.90 16,790 2006 470 46.4 24,911 79.50 19,809 2007 730 50.7 25,893 76.00 19,676 2008 680 43.5 23,697 69.60 16,493 2009 5
Honolulu 2005 50 3.0 2,277 60.70 1,382 2006 50 3.1 2,360 64.20 1,515 2007 60 2.5 1,270 74.20 942 2008 50 .8 615 58.20 358 2009 5
Kauai 2005 120 3.8 2,785 60.60 1,689 2006 120 3.9 2,683 64.30 1,725 2007 130 3.1 1,954 67.50 1,318 2008 120 5.2 2,529 77.50 1,959 2009 5
Maui 2005 160 6.1 3,850 69.80 2,686 2006 160 7.6 4,556 74.70 3,403 2007 180 8.7 7,043 60.50 4,260 2008 150 9.5 9,079 60.50 5,495 2009 5
1 Includes custom slaughter for home use on farms where produced and out-of-State sales of cattle and calves, but excludes inter-farm sales. 2 Sum of county estimates may not add to State total due to rounding. 3 Excludes custom slaughter for use on farms where produced. 4 Prices are equivalent delivered slaughterhouse for sales on county of production and delivered shipper’s dock for interisland and out-of-State sales. 5 County estimates not published due to staff reduction-in-force but combined and included in the State total.
Statistics of Hawaii Agriculture 70
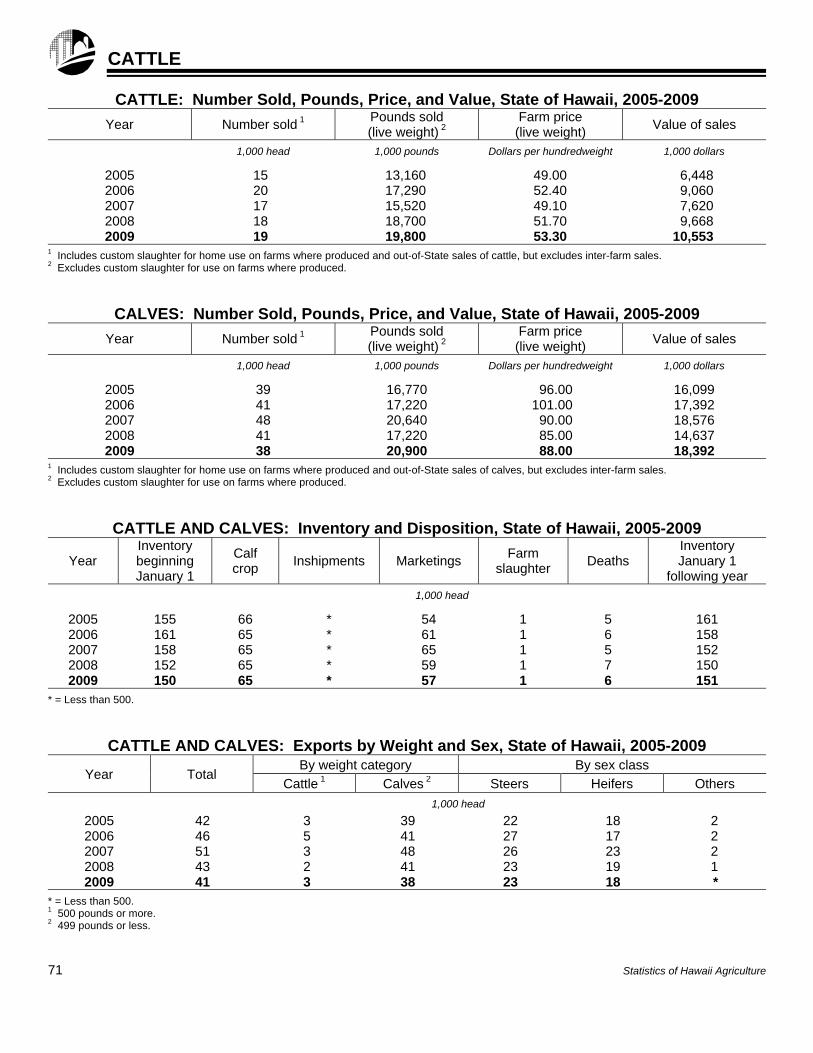
CATTLE
CATTLE: Number Sold, Pounds, Price, and Value, State of Hawaii, 2005-2009
Year Number sold 1 Pounds sold (live weight) 2
Farm price (live weight)
Value of sales
1,000 head 1,000 pounds Dollars per hundredweight 1,000 dollars
2005 15 13,160 49.00 6,448 2006 20 17,290 52.40 9,060 2007 17 15,520 49.10 7,620 2008 18 18,700 51.70 9,668 2009 19 19,800 53.30 10,553
1 Includes custom slaughter for home use on farms where produced and out-of-State sales of cattle, but excludes inter-farm sales. 2 Excludes custom slaughter for use on farms where produced.
CALVES: Number Sold, Pounds, Price, and Value, State of Hawaii, 2005-2009
Year Number sold 1 Pounds sold (live weight) 2
Farm price (live weight)
Value of sales
1,000 head 1,000 pounds Dollars per hundredweight 1,000 dollars
2005 39 16,770 96.00 16,099 2006 41 17,220 101.00 17,392 2007 48 20,640 90.00 18,576 2008 41 17,220 85.00 14,637 2009 38 20,900 88.00 18,392
1 Includes custom slaughter for home use on farms where produced and out-of-State sales of calves, but excludes inter-farm sales. 2 Excludes custom slaughter for use on farms where produced.
CATTLE AND CALVES: Inventory and Disposition, State of Hawaii, 2005-2009
Year Inventory beginning January 1
Calf crop
Inshipments Marketings Farm
slaughter Deaths
Inventory January 1
following year
1,000 head
2005 155 66 * 54 1 5 161 2006 161 65 * 61 1 6 158 2007 158 65 * 65 1 5 152 2008 152 65 * 59 1 7 150 2009 150 65 * 57 1 6 151
* = Less than 500.
CATTLE AND CALVES: Exports by Weight and Sex, State of Hawaii, 2005-2009
Year Total By weight category By sex class
Cattle 1 Calves 2 Steers Heifers Others
1,000 head
2005 42 3 39 22 18 2 2006 46 5 41 27 17 2 2007 51 3 48 26 23 2 2008 43 2 41 23 19 1 2009 41 3 38 23 18 *
* = Less than 500. 1 500 pounds or more. 2 499 pounds or less.
71 Statistics of Hawaii Agriculture
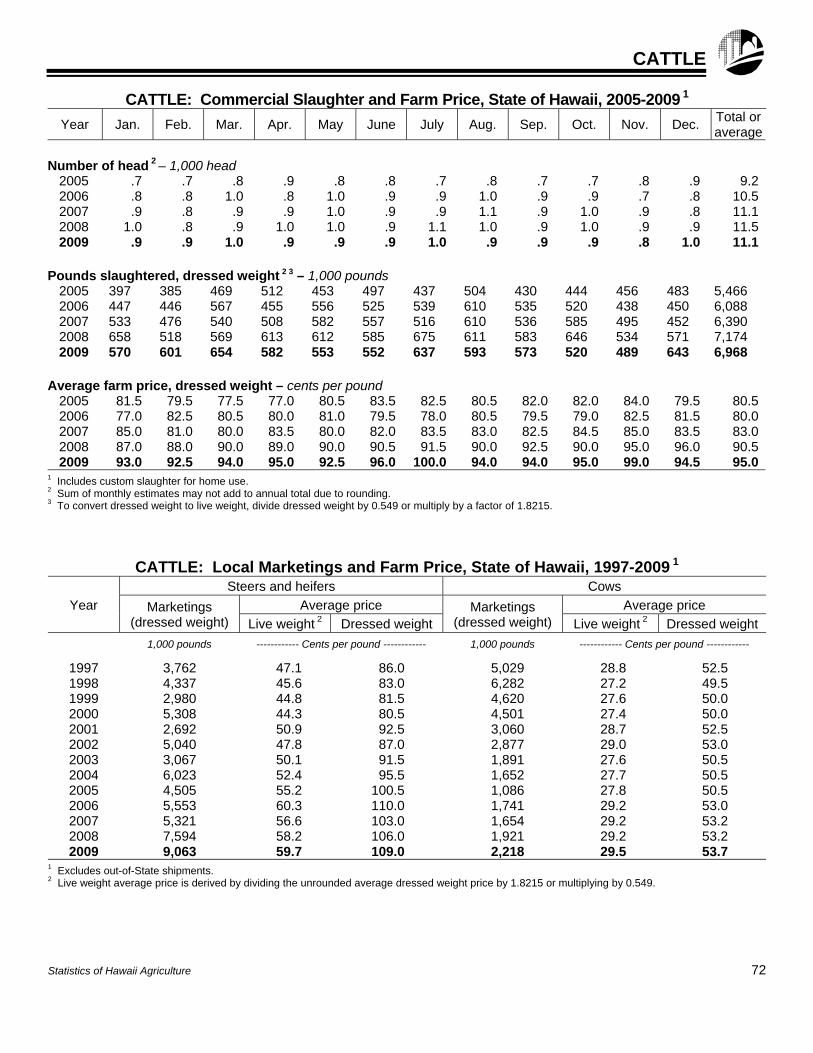
CATTLE
CATTLE: Commercial Slaughter and Farm Price, State of Hawaii, 2005-2009 1
Year Jan. Feb. Mar. Apr. May June July Aug. Sep. Oct. Nov. Dec. Total oraverage
Number of head 2 – 1,000 head
2005 .7 .7 .8 .9 .8 .8 .7 .8 .7 .7 .8 .9 9.22006 .8 .8 1.0 .8 1.0 .9 .9 1.0 .9 .9 .7 .8 10.52007 .9 .8 .9 .9 1.0 .9 .9 1.1 .9 1.0 .9 .8 11.12008 1.0 .8 .9 1.0 1.0 .9 1.1 1.0 .9 1.0 .9 .9 11.52009 .9 .9 1.0 .9 .9 .9 1.0 .9 .9 .9 .8 1.0 11.1
Pounds slaughtered, dressed weight 2 3 – 1,000 pounds
2005 397 385 469 512 453 497 437 504 430 444 456 483 5,466 2006 447 446 567 455 556 525 539 610 535 520 438 450 6,088 2007 533 476 540 508 582 557 516 610 536 585 495 452 6,390 2008 658 518 569 613 612 585 675 611 583 646 534 571 7,174 2009 570 601 654 582 553 552 637 593 573 520 489 643 6,968
Average farm price, dressed weight – cents per pound
2005 81.5 79.5 77.5 77.0 80.5 83.5 82.5 80.5 82.0 82.0 84.0 79.5 80.52006 77.0 82.5 80.5 80.0 81.0 79.5 78.0 80.5 79.5 79.0 82.5 81.5 80.02007 85.0 81.0 80.0 83.5 80.0 82.0 83.5 83.0 82.5 84.5 85.0 83.5 83.02008 87.0 88.0 90.0 89.0 90.0 90.5 91.5 90.0 92.5 90.0 95.0 96.0 90.52009 93.0 92.5 94.0 95.0 92.5 96.0 100.0 94.0 94.0 95.0 99.0 94.5 95.0
1 Includes custom slaughter for home use. 2 Sum of monthly estimates may not add to annual total due to rounding. 3 To convert dressed weight to live weight, divide dressed weight by 0.549 or multiply by a factor of 1.8215.
CATTLE: Local Marketings and Farm Price, State of Hawaii, 1997-2009 1
Year
Steers and heifers Cows
Marketings (dressed weight)
Average price Marketings (dressed weight)
Average price
Live weight 2 Dressed weight Live weight 2 Dressed weight
1,000 pounds ------------ Cents per pound ------------ 1,000 pounds ------------ Cents per pound ------------
1997 3,762 47.1 86.0 5,029 28.8 52.5 1998 4,337 45.6 83.0 6,282 27.2 49.5 1999 2,980 44.8 81.5 4,620 27.6 50.0 2000 5,308 44.3 80.5 4,501 27.4 50.0 2001 2,692 50.9 92.5 3,060 28.7 52.5 2002 5,040 47.8 87.0 2,877 29.0 53.0 2003 3,067 50.1 91.5 1,891 27.6 50.5 2004 6,023 52.4 95.5 1,652 27.7 50.5 2005 4,505 55.2 100.5 1,086 27.8 50.5 2006 5,553 60.3 110.0 1,741 29.2 53.0 2007 5,321 56.6 103.0 1,654 29.2 53.2 2008 7,594 58.2 106.0 1,921 29.2 53.2 2009 9,063 59.7 109.0 2,218 29.5 53.7
1 Excludes out-of-State shipments. 2 Live weight average price is derived by dividing the unrounded average dressed weight price by 1.8215 or multiplying by 0.549.
Statistics of Hawaii Agriculture 72
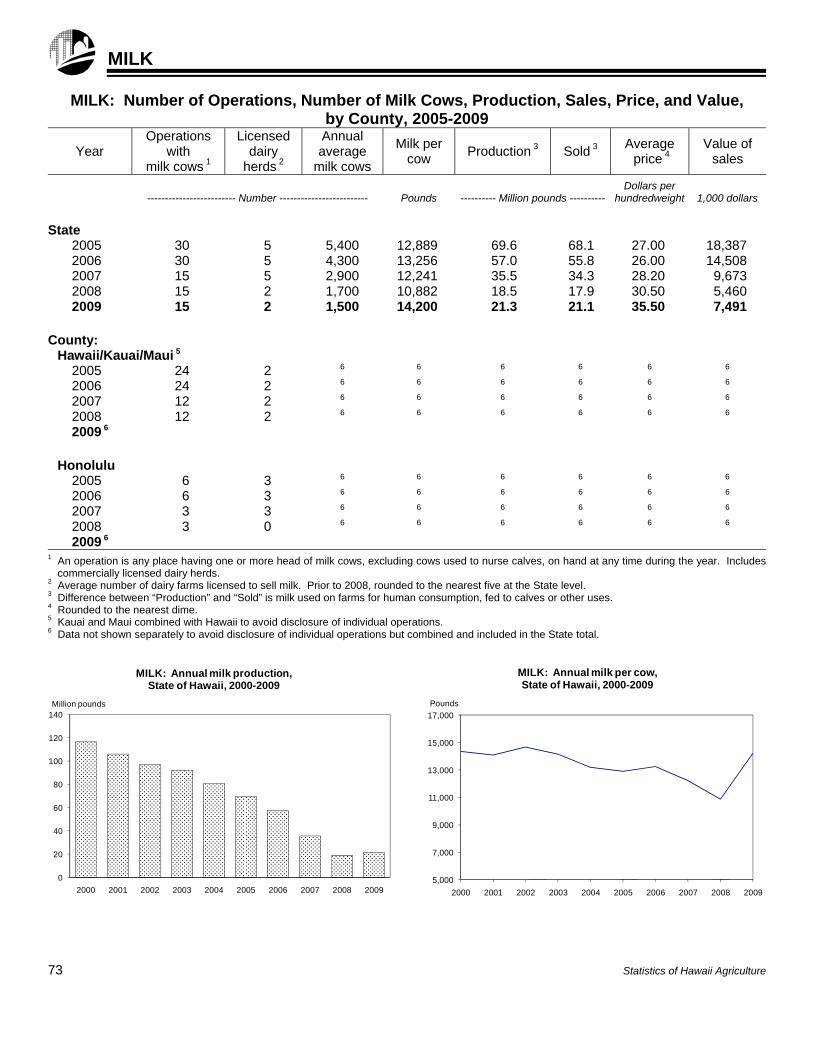
MILK
MILK: Number of Operations, Number of Milk Cows, Production, Sales, Price, and Value, by County, 2005-2009
Year Operations
with milk cows 1
Licensed dairy
herds 2
Annual average
milk cows
Milk per cow
Production 3 Sold 3 Average price 4
Value of sales
------------------------- Number -------------------------
Pounds
---------- Million pounds ----------
Dollars per hundredweight
1,000 dollars
State
2005 30 5 5,400 12,889 69.6 68.1 27.00 18,387 2006 30 5 4,300 13,256 57.0 55.8 26.00 14,508 2007 15 5 2,900 12,241 35.5 34.3 28.20 9,673 2008 15 2 1,700 10,882 18.5 17.9 30.50 5,460 2009 15 2 1,500 14,200 21.3 21.1 35.50 7,491
County:
Hawaii/Kauai/Maui 5 2005 24 2 6 6 6 6 6 6
2006 24 2 6 6 6 6 6 6
2007 12 2 6 6 6 6 6 6
2008 12 2 6 6 6 6 6 6
2009 6
Honolulu 2005 6 3 6 6 6 6 6 6
2006 6 3 6 6 6 6 6 6
2007 3 3 6 6 6 6 6 6
2008 3 0 6 6 6 6 6 6
2009 6
1 An operation is any place having one or more head of milk cows, excluding cows used to nurse calves, on hand at any time during the year. Includes commercially licensed dairy herds.
2 Average number of dairy farms licensed to sell milk. Prior to 2008, rounded to the nearest five at the State level. 3 Difference between “Production” and “Sold” is milk used on farms for human consumption, fed to calves or other uses. 4 Rounded to the nearest dime. 5 Kauai and Maui combined with Hawaii to avoid disclosure of individual operations. 6 Data not shown separately to avoid disclosure of individual operations but combined and included in the State total.
73 Statistics of Hawaii Agriculture
5,000
7,000
9,000
11,000
13,000
15,000
17,000
2000 2001 2002 2003 2004 2005 2006 2007 2008 2009
Pounds
MILK: Annual milk per cow,State of Hawaii, 2000-2009
0
20
40
60
80
100
120
140
2000 2001 2002 2003 2004 2005 2006 2007 2008 2009
Million pounds
MILK: Annual milk production,State of Hawaii, 2000-2009
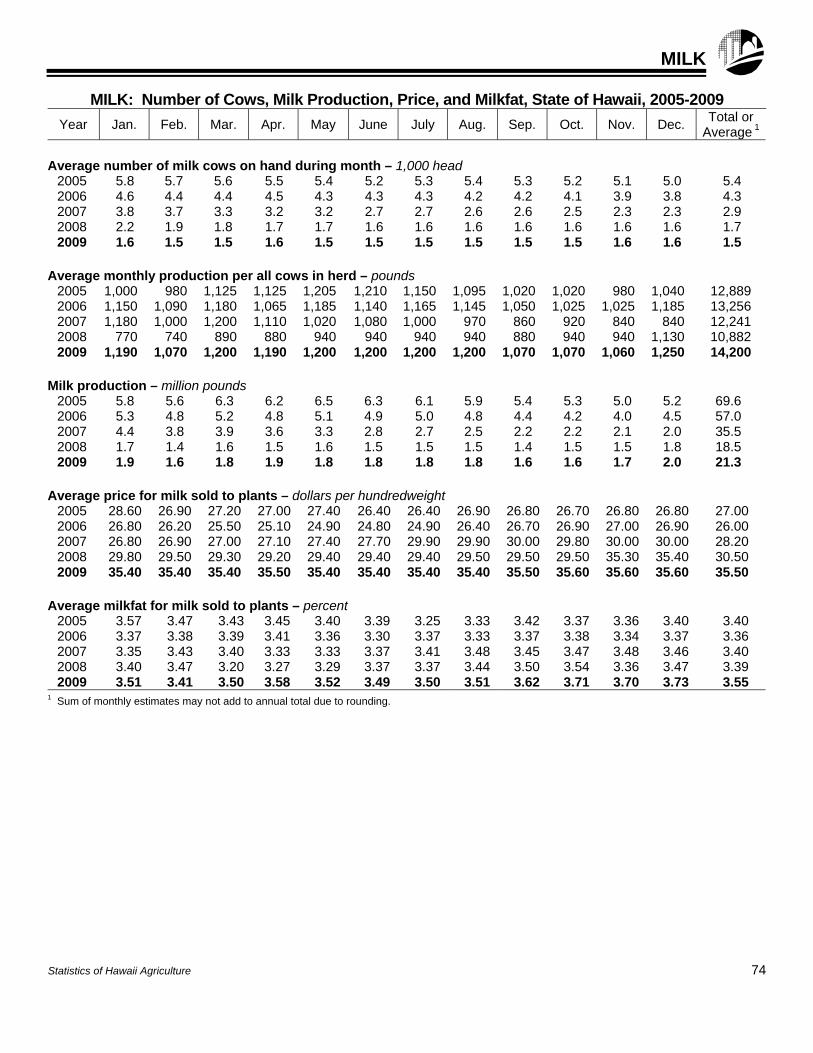
MILK
MILK: Number of Cows, Milk Production, Price, and Milkfat, State of Hawaii, 2005-2009
Year Jan. Feb. Mar. Apr. May June July Aug. Sep. Oct. Nov. Dec. Total or
Average 1
Average number of milk cows on hand during month – 1,000 head
2005 5.8 5.7 5.6 5.5 5.4 5.2 5.3 5.4 5.3 5.2 5.1 5.0 5.4 2006 4.6 4.4 4.4 4.5 4.3 4.3 4.3 4.2 4.2 4.1 3.9 3.8 4.3 2007 3.8 3.7 3.3 3.2 3.2 2.7 2.7 2.6 2.6 2.5 2.3 2.3 2.9 2008 2.2 1.9 1.8 1.7 1.7 1.6 1.6 1.6 1.6 1.6 1.6 1.6 1.7 2009 1.6 1.5 1.5 1.6 1.5 1.5 1.5 1.5 1.5 1.5 1.6 1.6 1.5
Average monthly production per all cows in herd – pounds
2005 1,000 980 1,125 1,125 1,205 1,210 1,150 1,095 1,020 1,020 980 1,040 12,889 2006 1,150 1,090 1,180 1,065 1,185 1,140 1,165 1,145 1,050 1,025 1,025 1,185 13,256 2007 1,180 1,000 1,200 1,110 1,020 1,080 1,000 970 860 920 840 840 12,241 2008 770 740 890 880 940 940 940 940 880 940 940 1,130 10,882 2009 1,190 1,070 1,200 1,190 1,200 1,200 1,200 1,200 1,070 1,070 1,060 1,250 14,200
Milk production – million pounds
2005 5.8 5.6 6.3 6.2 6.5 6.3 6.1 5.9 5.4 5.3 5.0 5.2 69.6 2006 5.3 4.8 5.2 4.8 5.1 4.9 5.0 4.8 4.4 4.2 4.0 4.5 57.0 2007 4.4 3.8 3.9 3.6 3.3 2.8 2.7 2.5 2.2 2.2 2.1 2.0 35.5 2008 1.7 1.4 1.6 1.5 1.6 1.5 1.5 1.5 1.4 1.5 1.5 1.8 18.5 2009 1.9 1.6 1.8 1.9 1.8 1.8 1.8 1.8 1.6 1.6 1.7 2.0 21.3
Average price for milk sold to plants – dollars per hundredweight
2005 28.60 26.90 27.20 27.00 27.40 26.40 26.40 26.90 26.80 26.70 26.80 26.80 27.00 2006 26.80 26.20 25.50 25.10 24.90 24.80 24.90 26.40 26.70 26.90 27.00 26.90 26.00 2007 26.80 26.90 27.00 27.10 27.40 27.70 29.90 29.90 30.00 29.80 30.00 30.00 28.20 2008 29.80 29.50 29.30 29.20 29.40 29.40 29.40 29.50 29.50 29.50 35.30 35.40 30.50 2009 35.40 35.40 35.40 35.50 35.40 35.40 35.40 35.40 35.50 35.60 35.60 35.60 35.50
Average milkfat for milk sold to plants – percent
2005 3.57 3.47 3.43 3.45 3.40 3.39 3.25 3.33 3.42 3.37 3.36 3.40 3.40 2006 3.37 3.38 3.39 3.41 3.36 3.30 3.37 3.33 3.37 3.38 3.34 3.37 3.36 2007 3.35 3.43 3.40 3.33 3.33 3.37 3.41 3.48 3.45 3.47 3.48 3.46 3.40 2008 3.40 3.47 3.20 3.27 3.29 3.37 3.37 3.44 3.50 3.54 3.36 3.47 3.39 2009 3.51 3.41 3.50 3.58 3.52 3.49 3.50 3.51 3.62 3.71 3.70 3.73 3.55
1 Sum of monthly estimates may not add to annual total due to rounding.
Statistics of Hawaii Agriculture 74

HOGS
HOGS AND PIGS: December 1 Inventory by Classes and Weight, State of Hawaii, 2005-2009
Year All hogs and pigs
Breeding Market
Total Under 60lbs.
60-119 lbs.
120-179 lbs.
180 lbs. and over
1,000 head
2005 19 5.0 14.0 6.0 3.9 2.4 1.7 2006 16 4.1 11.9 5.5 3.0 2.0 1.4 2007 15 3.6 11.4 5.8 2.7 1.8 1.1 2008 1 13 2.8 10.2 3.8 3.3 1.9 1.2 2009 1 13 2.9 10.1 3.9 3.2 1.7 1.3
1 Beginning 2008, the market weight group under 60 pounds has been changed to under 50 pounds. The market weight group 60-119 pounds has been changed to 50-119 pounds.
HOGS AND PIGS: December 1 Inventory by Class, by County, 2005-2009
Year All hogs and pigs
Breeding Total
market Year
All hogs and pigs
Breeding Total
market
1,000 head 1,000 head
County:
Hawaii Kauai 2005 1.1 .3 .8 2005 2.0 .4 1.6 2006 .9 .3 .6 2006 2.0 .3 1.7 2007 1.1 .4 .7 2007 2.0 .3 1.7 2008 .6 .2 .4 2008 1.5 .2 1.3 2009 1 2009 1
Honolulu Maui 2005 11.4 2.8 8.6 2005 4.5 1.5 3.0 2006 9.6 2.5 7.1 2006 3.5 1.0 2.5 2007 9.2 2.4 6.8 2007 2.7 .5 2.2 2008 9.4 2.1 7.3 2008 1.5 .3 1.2 2009 1 2009 1
1 County estimates not published due to staff reduction-in-force but combined and included in the State total.
75 Statistics of Hawaii Agriculture
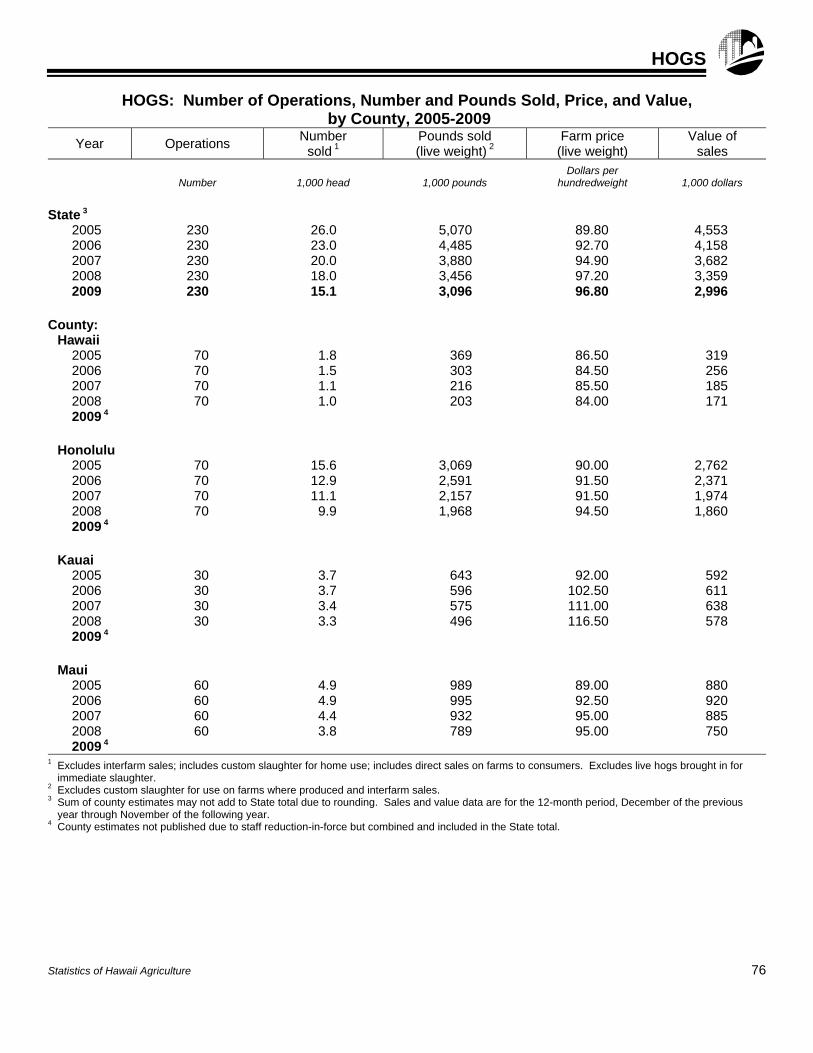
HOGS
HOGS: Number of Operations, Number and Pounds Sold, Price, and Value, by County, 2005-2009
Year Operations Number
sold 1 Pounds sold (live weight) 2
Farm price (live weight)
Value of sales
Number
1,000 head
1,000 pounds
Dollars per hundredweight
1,000 dollars
State 3
2005 230 26.0 5,070 89.80 4,553 2006 230 23.0 4,485 92.70 4,158 2007 230 20.0 3,880 94.90 3,682 2008 230 18.0 3,456 97.20 3,359 2009 230 15.1 3,096 96.80 2,996
County:
Hawaii 2005 70 1.8 369 86.50 319 2006 70 1.5 303 84.50 256 2007 70 1.1 216 85.50 185 2008 70 1.0 203 84.00 171 2009 4
Honolulu 2005 70 15.6 3,069 90.00 2,762 2006 70 12.9 2,591 91.50 2,371 2007 70 11.1 2,157 91.50 1,974 2008 70 9.9 1,968 94.50 1,860 2009 4
Kauai 2005 30 3.7 643 92.00 592 2006 30 3.7 596 102.50 611 2007 30 3.4 575 111.00 638 2008 30 3.3 496 116.50 578 2009 4
Maui 2005 60 4.9 989 89.00 880 2006 60 4.9 995 92.50 920 2007 60 4.4 932 95.00 885 2008 60 3.8 789 95.00 750 2009 4
1 Excludes interfarm sales; includes custom slaughter for home use; includes direct sales on farms to consumers. Excludes live hogs brought in for immediate slaughter.
2 Excludes custom slaughter for use on farms where produced and interfarm sales. 3 Sum of county estimates may not add to State total due to rounding. Sales and value data are for the 12-month period, December of the previous
year through November of the following year. 4 County estimates not published due to staff reduction-in-force but combined and included in the State total.
Statistics of Hawaii Agriculture 76
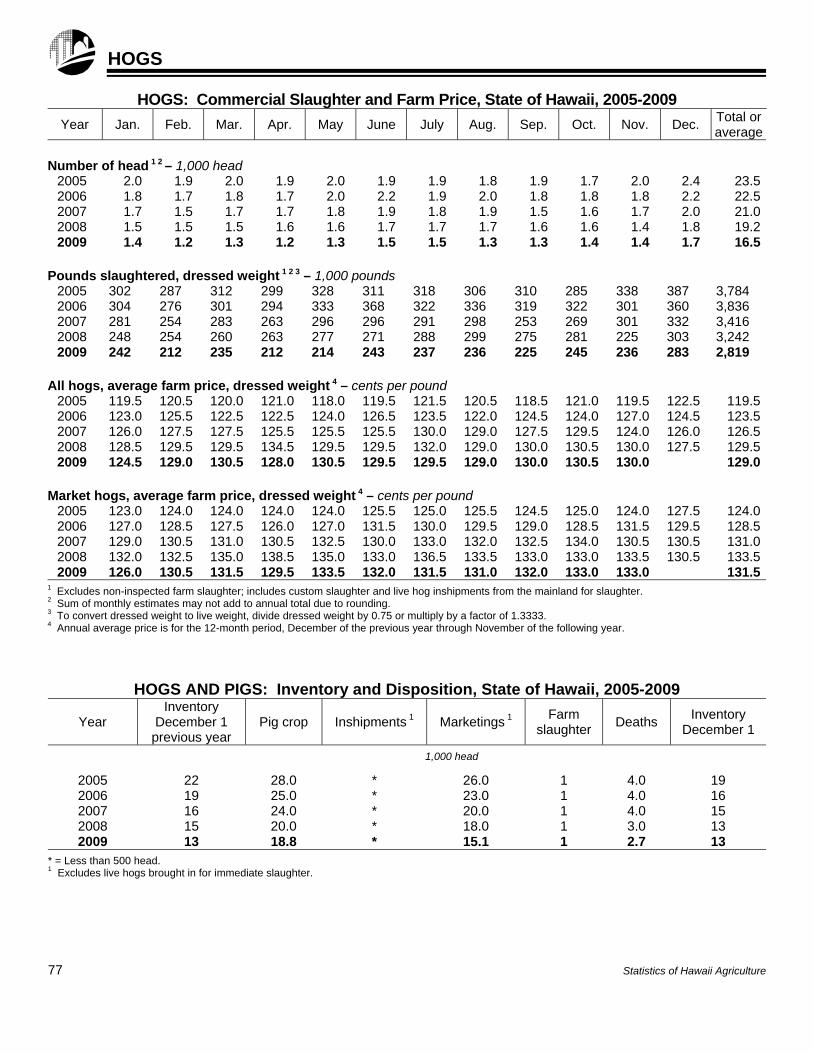
HOGS
HOGS: Commercial Slaughter and Farm Price, State of Hawaii, 2005-2009
Year Jan. Feb. Mar. Apr. May June July Aug. Sep. Oct. Nov. Dec. Total oraverage
Number of head 1 2 – 1,000 head
2005 2.0 1.9 2.0 1.9 2.0 1.9 1.9 1.8 1.9 1.7 2.0 2.4 23.52006 1.8 1.7 1.8 1.7 2.0 2.2 1.9 2.0 1.8 1.8 1.8 2.2 22.52007 1.7 1.5 1.7 1.7 1.8 1.9 1.8 1.9 1.5 1.6 1.7 2.0 21.02008 1.5 1.5 1.5 1.6 1.6 1.7 1.7 1.7 1.6 1.6 1.4 1.8 19.22009 1.4 1.2 1.3 1.2 1.3 1.5 1.5 1.3 1.3 1.4 1.4 1.7 16.5
Pounds slaughtered, dressed weight 1 2 3 – 1,000 pounds
2005 302 287 312 299 328 311 318 306 310 285 338 387 3,784 2006 304 276 301 294 333 368 322 336 319 322 301 360 3,836 2007 281 254 283 263 296 296 291 298 253 269 301 332 3,416 2008 248 254 260 263 277 271 288 299 275 281 225 303 3,242 2009 242 212 235 212 214 243 237 236 225 245 236 283 2,819
All hogs, average farm price, dressed weight 4 – cents per pound
2005 119.5 120.5 120.0 121.0 118.0 119.5 121.5 120.5 118.5 121.0 119.5 122.5 119.52006 123.0 125.5 122.5 122.5 124.0 126.5 123.5 122.0 124.5 124.0 127.0 124.5 123.52007 126.0 127.5 127.5 125.5 125.5 125.5 130.0 129.0 127.5 129.5 124.0 126.0 126.52008 128.5 129.5 129.5 134.5 129.5 129.5 132.0 129.0 130.0 130.5 130.0 127.5 129.52009 124.5 129.0 130.5 128.0 130.5 129.5 129.5 129.0 130.0 130.5 130.0 129.0
Market hogs, average farm price, dressed weight 4 – cents per pound
2005 123.0 124.0 124.0 124.0 124.0 125.5 125.0 125.5 124.5 125.0 124.0 127.5 124.02006 127.0 128.5 127.5 126.0 127.0 131.5 130.0 129.5 129.0 128.5 131.5 129.5 128.52007 129.0 130.5 131.0 130.5 132.5 130.0 133.0 132.0 132.5 134.0 130.5 130.5 131.02008 132.0 132.5 135.0 138.5 135.0 133.0 136.5 133.5 133.0 133.0 133.5 130.5 133.52009 126.0 130.5 131.5 129.5 133.5 132.0 131.5 131.0 132.0 133.0 133.0 131.5
1 Excludes non-inspected farm slaughter; includes custom slaughter and live hog inshipments from the mainland for slaughter. 2 Sum of monthly estimates may not add to annual total due to rounding. 3 To convert dressed weight to live weight, divide dressed weight by 0.75 or multiply by a factor of 1.3333. 4 Annual average price is for the 12-month period, December of the previous year through November of the following year.
HOGS AND PIGS: Inventory and Disposition, State of Hawaii, 2005-2009
Year Inventory
December 1 previous year
Pig crop Inshipments 1 Marketings 1 Farm
slaughter Deaths
Inventory December 1
1,000 head
2005 22 28.0 * 26.0 1 4.0 19 2006 19 25.0 * 23.0 1 4.0 16 2007 16 24.0 * 20.0 1 4.0 15 2008 15 20.0 * 18.0 1 3.0 13 2009 13 18.8 * 15.1 1 2.7 13
* = Less than 500 head. 1 Excludes live hogs brought in for immediate slaughter.
77 Statistics of Hawaii Agriculture
2009 POULTRY AND EGG HIGHLIGHTS
State’s December 1 inventory Rose 2 percent
Hawaii farmers had 379,000 egg-type chickens on hand on December 1, 2009, up 6,000 or 2 percent from 2008. Of the total chickens, 319,000 or 84 percent were layers and 60,000 were non-laying pullets. Egg Production for 2009 totaled 69.5 million, down 5 percent from the 2008 total of 73.3 million eggs. The average number of layers on hand during 2009 was 330,000, a decrease of 4 percent compared to the previous year. Production per layer also declined to an
average of 211 eggs in 2009, down 1 percent from the 2008 rate of 214 eggs per layer.
Record high average farm price helps offset lower production
The farm price of a dozen eggs averaged a new record high $1.51 in 2009, up 9.0 cents a dozen from the previous record high set in 2008. Total cash receipts from the sale of eggs, increased 1 percent to $8.8 million in 2009 as higher farm prices more than offset lower egg production.
CHICKENS: December 1 Inventory by Class, by County, 2005-2009
Year All chickens (excluding broilers)
Number of layers Non-laying pullets Other chickens
(excluding broilers)
Hens 1 year +
Pullets under 1 year
Total Over 3 months
Under 3 months
Thousands
State
2005 547 369 117 486 25 36 * 2006 470 293 122 415 20 35 * 2007 398 265 90 355 20 23 * 2008 373 250 84 334 18 21 * 2009 379 235 84 319 29 31 *
County: Hawaii/Kauai/Maui 1 2005 104 67 30 97 3 4 * 2006 2 2007 2 2008 2 2009 2
Honolulu 2005 443 302 87 389 22 32 * 2006 2 2007 2 2008 2 2009 2
* = Less than 500. 1 Kauai and Maui combined with Hawaii to avoid disclosure of individual operations. 2 Data not shown separately to avoid disclosure of individual operations but combined and included in the State total.
Statistics of Hawaii Agriculture 78
POULTRY
EGGS: December 1 Number of Operations, Number of Layers, Production, Price, and Value, by County, 2005-2009 1
Year Operations Average
number of layers
Average production per layer
Production 2 Average price 3
Value of sales All
3,000 layers or more
Number
1,000 birds
Eggs
Million eggs
Cents per dozen
1,000 dollars
State 4
2005 80 8 498 230 114.5 94.1 8,979 2006 80 6 448 219 98.3 100.0 8,192 2007 80 5 378 216 81.8 109.0 7,428 2008 100 5 343 214 73.3 142.0 8,678 2009 100 5 330 211 69.5 151.0 8,759
County: Hawaii/Kauai/Maui 5
2005 65 4 112 220 24.8 110.0 2,274 2006 65 2 6 6 6 6 6
2007 65 1 6 6 6 6 6
2008 85 1 6 6 6 6 6
2009 7
Honolulu 2005 15 4 386 232 89.7 89.5 6,705 2006 15 4 6 6 6 6 6
2007 15 4 6 6 6 6 6
2008 15 4 6 6 6 6 6
2009 7
1 Annual number of layers, egg production, sales, price, and value are for the 12-month period, December of the previous year through November of thefollowing year. 2 Home consumption less than 0.5 million eggs included. 3 Equivalent delivered processing plant. 4 Sum of county estimates may not add to State total due to rounding. 5 Kauai and Maui combined with Hawaii to avoid disclosure of individual operations. 6 Data not shown separately to avoid disclosure of individual operations but combined and included in the State total. 7 County estimates not published due to staff reduction-in-force but combined and included in the State total.
79 Statistics of Hawaii Agriculture
6
8
10
12
14
50
70
90
110
130
150
170
2000 2001 2002 2003 2004 2005 2006 2007 2008 2009
Million dollarsMillion eggs
EGGS: Production and Value of Sales,State of Hawaii, 2000-2009
Production
Value
POULTRY
EGGS: Number of Layers, Production, and Price, State of Hawaii, 2005-2009
Year Jan. Feb. Mar. Apr. May June July Aug. Sep. Oct. Nov. Dec. Total or
average 1
Average number of layers on hand during month – 1,000 layers
2005 511 500 506 504 486 488 487 491 496 496 495 479 498 2006 478 475 467 461 446 445 438 429 427 419 417 409 448 2007 403 395 388 380 367 368 369 368 366 365 362 360 378 2008 361 353 352 351 336 335 333 329 330 333 338 338 343 2009 339 334 337 339 333 325 327 326 315 319 323 330
Egg production 2 – million eggs
2005 10.4 9.4 10.1 9.4 9.4 9.3 9.9 9.5 8.8 9.2 9.0 8.8 114.5 2006 8.8 7.9 8.7 8.3 8.3 8.2 8.6 8.2 7.6 7.6 7.3 7.4 98.3 2007 7.3 6.4 6.9 6.7 6.9 6.9 7.0 6.8 6.4 6.7 6.4 6.4 81.8 2008 6.5 6.1 6.5 6.1 6.1 6.0 6.3 6.1 5.8 5.8 5.6 6.0 73.3 2009 6.0 5.2 5.9 5.9 6.1 5.7 6.0 5.9 5.6 5.7 5.5 69.5
Average farm price 3 – cents per dozen
2005 99.5 98.0 94.0 94.0 88.5 88.5 91.5 89.5 87.0 102.5 98.5 106.0 94.1 2006 108.0 105.0 96.0 100.0 98.0 97.0 97.0 93.5 98.5 100.5 100.0 110.0 100.0 2007 106.0 113.0 110.0 108.0 109.0 104.0 104.0 100.0 108.0 116.0 121.0 132.0 109.0 2008 132.0 138.0 142.0 147.0 147.0 138.0 145.0 142.0 145.0 149.0 150.0 150.0 142.0 2009 156.0 161.0 158.0 161.0 155.0 133.0 148.0 146.0 146.0 150.0 151.0 151.0
1 Annual data are for the 12-month period, December of the previous year through November of the following year. 2 Sum of monthly estimates may not add to annual total due to rounding. 3 Equivalent delivered processing plant.
Statistics of Hawaii Agriculture 80
300
500
700
900
1,100
1,300
1,500
50
100
150
200
2000 2001 2002 2003 2004 2005 2006 2007 2008 2009
Thousand birdsMillion eggs
CHICKENS: Production and Average Numberof Layers, State of Hawaii, 2000-2009
Production
Avg. Layers
EQUINE, GOATS, HONEY AND BEESWAX, SHEEP EQUINE: January 1 Inventory and Number Sold,
State of Hawaii, 1992-2007
Year Inventory Number sold
1,000 head 1992 4.0 .2 1997 5.1 .2 2002 4.6 .3 2007 6.5 .4
Source: Census of Agriculture. Data just for on-farm equine, excludes non-farm equine. GOATS: January 1 Inventory and Number Sold,
State of Hawaii, 1992-2007
Year Inventory Number sold
1,000 head 1992 5.0 3.0 1997 3.3 3.6 2002 5.4 4.2 2007 9.2 2.8
Source: Census of Agriculture.
HONEY AND BEESWAX: Number of Operations, Colonies, Yield, Production, Price, and Value, State of Hawaii, 2005-2009
Year Opera- tions
Number of
colonies
Yield per
colony (honey)
Production Average price 1 Value of
production Honey
(extracted) Beeswax
Honey (extracted)
Beeswax Honey
(extracted) Beeswax
Number Thousands Pounds ----- 1,000 pounds ----- ----- Cents per pound ----- ----- 1,000 dollars -----
2005 34 9 131 1,179 10 143 182 1,686 18 2006 35 10 93 930 29 121 205 1,125 59 2007 40 10 92 920 6 170 294 1,564 18 2008 35 10 90 900 12 159 261 1,431 31 2009 35 10 95 950 10 163 315 1,549 30
1 Average of unprocessed bulk and processed packaged honey sold at wholesale and processed packaged honey sold at retail by farmers. SHEEP: January 1 Inventory and Number Sold,
State of Hawaii, 1992-2007
Year Inventory Number sold
1,000 head 1992 22,938 2,122 1997 22,541 2,484 2002 19,909 4,639 2007 22,376 4,784
Source: Census of Agriculture.
81 Statistics of Hawaii Agriculture
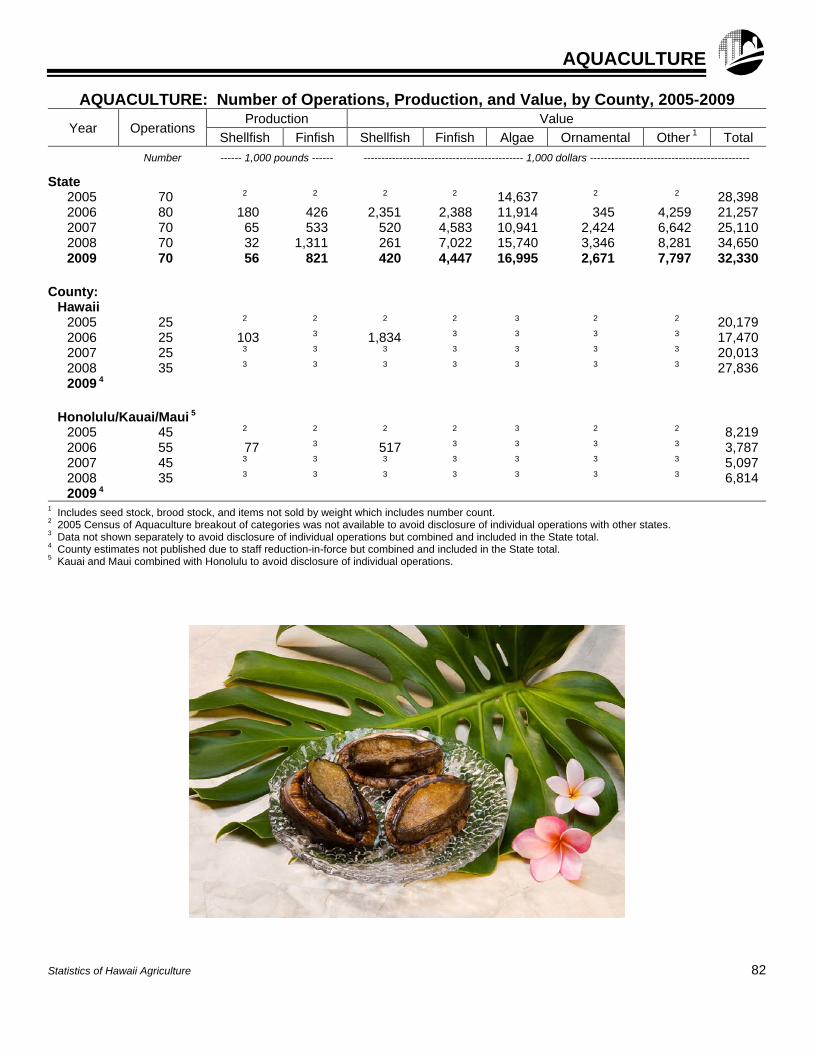
AQUACULTURE
AQUACULTURE: Number of Operations, Production, and Value, by County, 2005-2009
Year Operations Production Value
Shellfish Finfish Shellfish Finfish Algae Ornamental Other 1 Total
Number ------ 1,000 pounds ------ --------------------------------------------- 1,000 dollars ---------------------------------------------
State 2005 70 2 2 2 2 14,637 2 2 28,398 2006 80 180 426 2,351 2,388 11,914 345 4,259 21,257 2007 70 65 533 520 4,583 10,941 2,424 6,642 25,110 2008 70 32 1,311 261 7,022 15,740 3,346 8,281 34,650 2009 70 56 821 420 4,447 16,995 2,671 7,797 32,330
County:
Hawaii 2005 25 2 2 2 2 3 2 2 20,179 2006 25 103 3 1,834 3 3 3 3 17,470 2007 25 3 3 3 3 3 3 3 20,013 2008 35 3 3 3 3 3 3 3 27,836 2009 4
Honolulu/Kauai/Maui 5
2005 45 2 2 2 2 3 2 2 8,219 2006 55 77 3 517 3 3 3 3 3,787 2007 45 3 3 3 3 3 3 3 5,097 2008 35 3 3 3 3 3 3 3 6,814 2009 4
1 Includes seed stock, brood stock, and items not sold by weight which includes number count. 2 2005 Census of Aquaculture breakout of categories was not available to avoid disclosure of individual operations with other states. 3 Data not shown separately to avoid disclosure of individual operations but combined and included in the State total. 4 County estimates not published due to staff reduction-in-force but combined and included in the State total. 5 Kauai and Maui combined with Honolulu to avoid disclosure of individual operations.
Statistics of Hawaii Agriculture 82
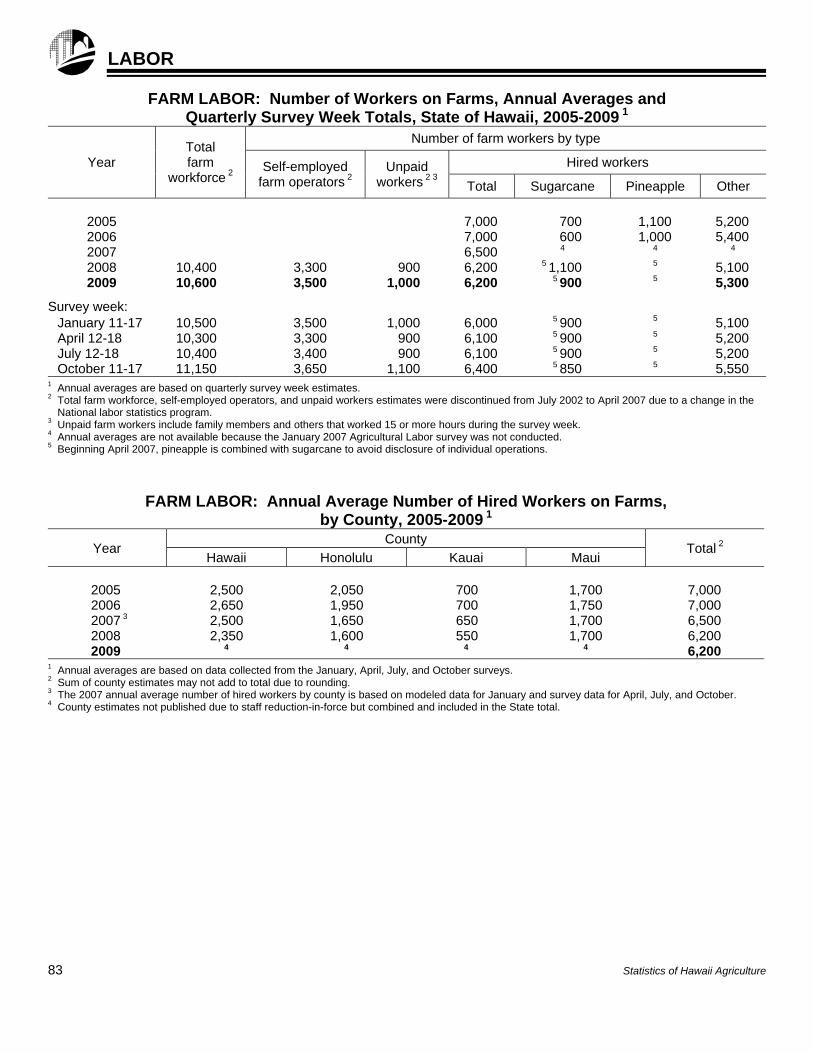
LABOR
FARM LABOR: Number of Workers on Farms, Annual Averages and Quarterly Survey Week Totals, State of Hawaii, 2005-2009 1
Year Total farm
workforce 2
Number of farm workers by type
Self-employed farm operators 2
Unpaid workers 2 3
Hired workers
Total Sugarcane Pineapple Other
2005 7,000 700 1,100 5,200 2006 7,000 600 1,000 5,400 2007 6,500 4 4 4
2008 10,400 3,300 900 6,200 5 1,100 5 5,100 2009 10,600 3,500 1,000 6,200 5 900 5 5,300
Survey week: January 11-17 10,500 3,500 1,000 6,000 5 900 5 5,100 April 12-18 10,300 3,300 900 6,100 5 900 5 5,200 July 12-18 10,400 3,400 900 6,100 5 900 5 5,200 October 11-17 11,150 3,650 1,100 6,400 5 850 5 5,550
1 Annual averages are based on quarterly survey week estimates. 2 Total farm workforce, self-employed operators, and unpaid workers estimates were discontinued from July 2002 to April 2007 due to a change in the
National labor statistics program. 3 Unpaid farm workers include family members and others that worked 15 or more hours during the survey week. 4 Annual averages are not available because the January 2007 Agricultural Labor survey was not conducted. 5 Beginning April 2007, pineapple is combined with sugarcane to avoid disclosure of individual operations.
FARM LABOR: Annual Average Number of Hired Workers on Farms, by County, 2005-2009 1
Year County
Total 2 Hawaii Honolulu Kauai Maui
2005 2,500 2,050 700 1,700 7,000 2006 2,650 1,950 700 1,750 7,000 2007 3 2,500 1,650 650 1,700 6,500 2008 2,350 1,600 550 1,700 6,200 2009 4 4 4 4 6,200
1 Annual averages are based on data collected from the January, April, July, and October surveys. 2 Sum of county estimates may not add to total due to rounding. 3 The 2007 annual average number of hired workers by county is based on modeled data for January and survey data for April, July, and October. 4 County estimates not published due to staff reduction-in-force but combined and included in the State total.
83 Statistics of Hawaii Agriculture
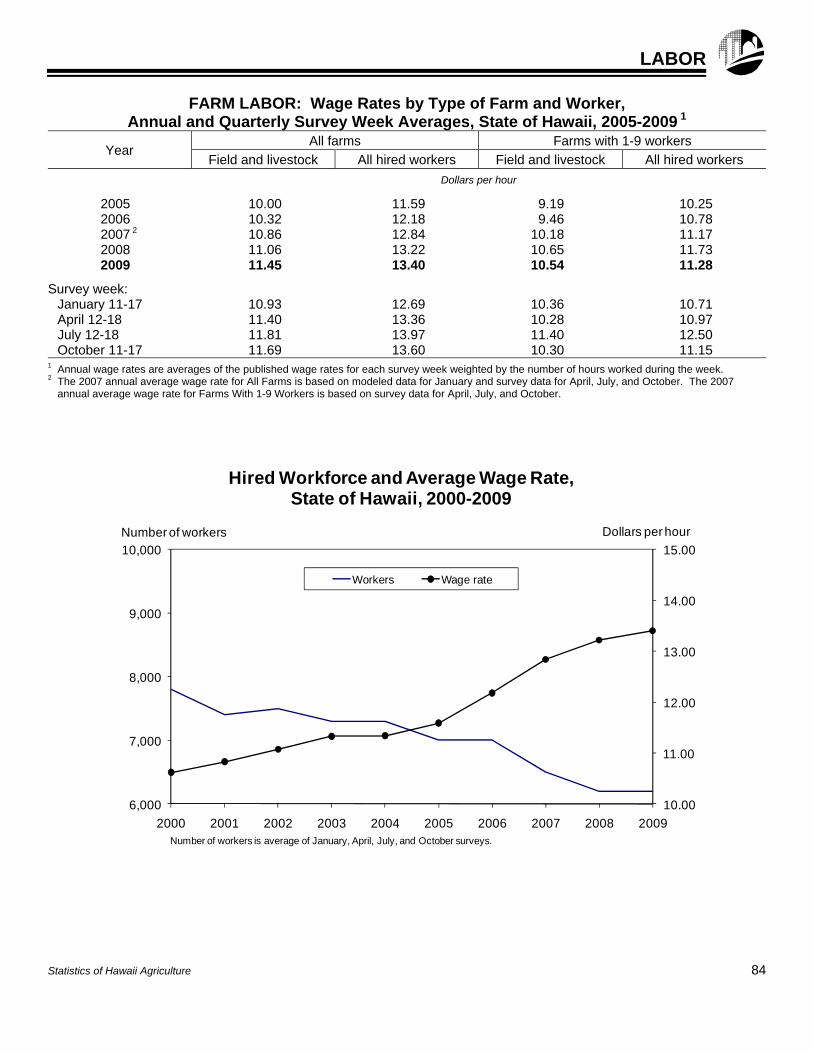
LABOR
FARM LABOR: Wage Rates by Type of Farm and Worker, Annual and Quarterly Survey Week Averages, State of Hawaii, 2005-2009 1
Year All farms Farms with 1-9 workers
Field and livestock All hired workers Field and livestock All hired workers
Dollars per hour
2005 10.00 11.59 9.19 10.25 2006 10.32 12.18 9.46 10.78 2007 2 10.86 12.84 10.18 11.17 2008 11.06 13.22 10.65 11.73 2009 11.45 13.40 10.54 11.28
Survey week:
January 11-17 10.93 12.69 10.36 10.71 April 12-18 11.40 13.36 10.28 10.97 July 12-18 11.81 13.97 11.40 12.50 October 11-17 11.69 13.60 10.30 11.15
1 Annual wage rates are averages of the published wage rates for each survey week weighted by the number of hours worked during the week. 2 The 2007 annual average wage rate for All Farms is based on modeled data for January and survey data for April, July, and October. The 2007
annual average wage rate for Farms With 1-9 Workers is based on survey data for April, July, and October.
Statistics of Hawaii Agriculture 84
10.00
11.00
12.00
13.00
14.00
15.00
6,000
7,000
8,000
9,000
10,000
2000 2001 2002 2003 2004 2005 2006 2007 2008 2009
Dollars per hourNumber of workers
Number of workers is average of January, April, July, and October surveys.
Hired Workforce and Average Wage Rate,State of Hawaii, 2000-2009
Workers Wage rate
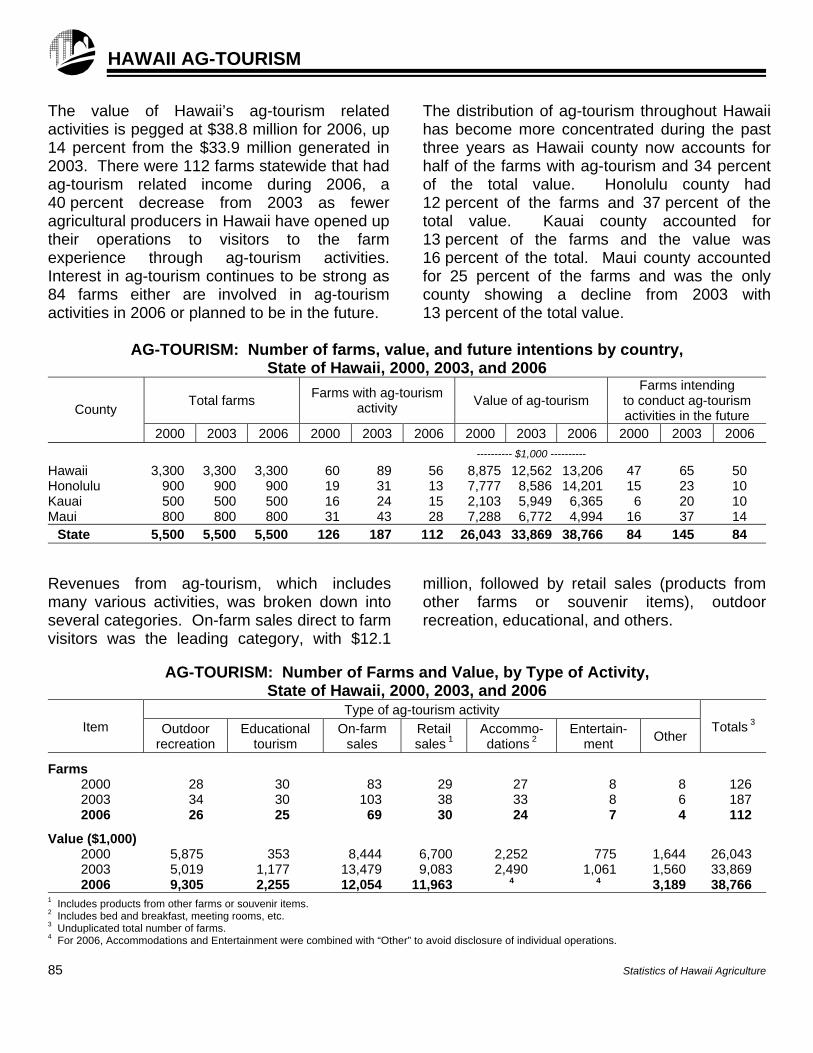
HAWAII AG-TOURISM
The value of Hawaii’s ag-tourism related activities is pegged at $38.8 million for 2006, up 14 percent from the $33.9 million generated in 2003. There were 112 farms statewide that had ag-tourism related income during 2006, a 40 percent decrease from 2003 as fewer agricultural producers in Hawaii have opened up their operations to visitors to the farm experience through ag-tourism activities. Interest in ag-tourism continues to be strong as 84 farms either are involved in ag-tourism activities in 2006 or planned to be in the future.
The distribution of ag-tourism throughout Hawaii has become more concentrated during the past three years as Hawaii county now accounts for half of the farms with ag-tourism and 34 percent of the total value. Honolulu county had 12 percent of the farms and 37 percent of the total value. Kauai county accounted for 13 percent of the farms and the value was 16 percent of the total. Maui county accounted for 25 percent of the farms and was the only county showing a decline from 2003 with 13 percent of the total value.
AG-TOURISM: Number of farms, value, and future intentions by country,
State of Hawaii, 2000, 2003, and 2006
County Total farms
Farms with ag-tourism activity
Value of ag-tourism Farms intending
to conduct ag-tourism activities in the future
2000 2003 2006 2000 2003 2006 2000 2003 2006 2000 2003 2006
---------- $1,000 ---------- Hawaii 3,300 3,300 3,300 60 89 56 8,875 12,562 13,206 47 65 50 Honolulu 900 900 900 19 31 13 7,777 8,586 14,201 15 23 10 Kauai 500 500 500 16 24 15 2,103 5,949 6,365 6 20 10 Maui 800 800 800 31 43 28 7,288 6,772 4,994 16 37 14
State 5,500 5,500 5,500 126 187 112 26,043 33,869 38,766 84 145 84 Revenues from ag-tourism, which includes many various activities, was broken down into several categories. On-farm sales direct to farm visitors was the leading category, with $12.1
million, followed by retail sales (products from other farms or souvenir items), outdoor recreation, educational, and others.
AG-TOURISM: Number of Farms and Value, by Type of Activity,
State of Hawaii, 2000, 2003, and 2006
Item Type of ag-tourism activity
Totals 3 Outdoor recreation
Educational tourism
On-farm sales
Retail sales 1
Accommo- dations 2
Entertain- ment
Other
Farms
2000 28 30 83 29 27 8 8 126 2003 34 30 103 38 33 8 6 187 2006 26 25 69 30 24 7 4 112
Value ($1,000)
2000 5,875 353 8,444 6,700 2,252 775 1,644 26,043 2003 5,019 1,177 13,479 9,083 2,490 1,061 1,560 33,869 2006 9,305 2,255 12,054 11,963 4 4 3,189 38,766
1 Includes products from other farms or souvenir items. 2 Includes bed and breakfast, meeting rooms, etc. 3 Unduplicated total number of farms. 4 For 2006, Accommodations and Entertainment were combined with “Other” to avoid disclosure of individual operations. 85 Statistics of Hawaii Agriculture
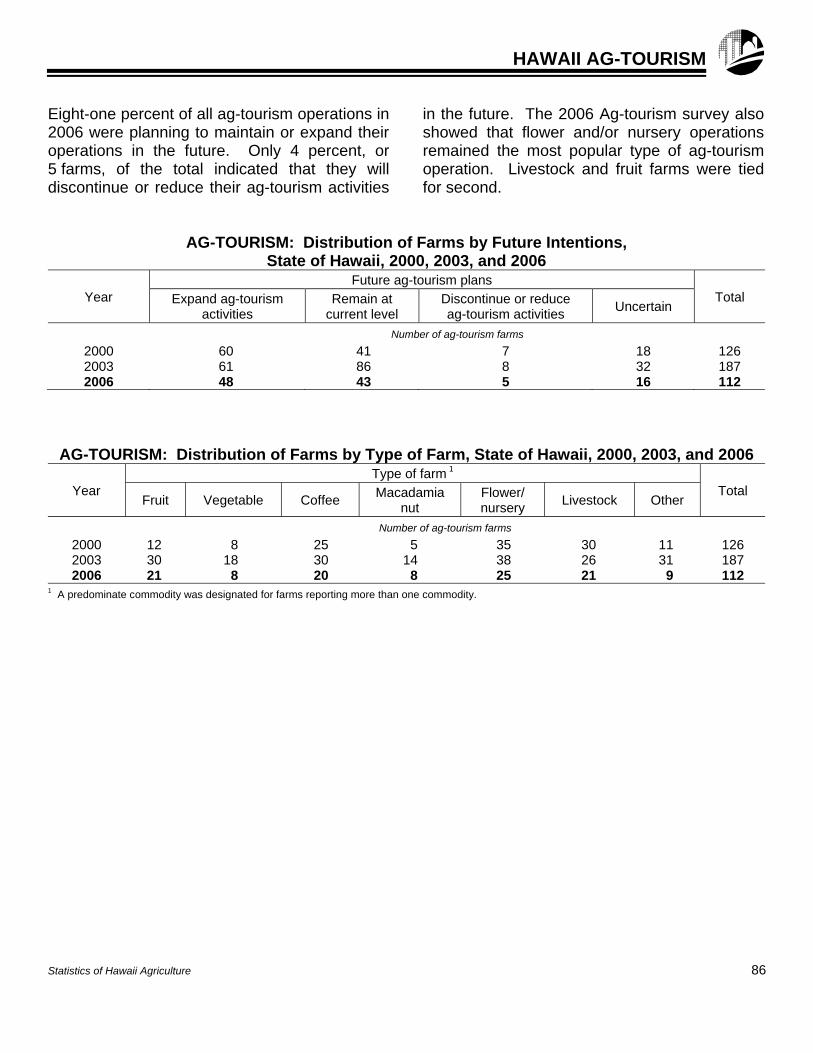
HAWAII AG-TOURISM Eight-one percent of all ag-tourism operations in 2006 were planning to maintain or expand their operations in the future. Only 4 percent, or 5 farms, of the total indicated that they will discontinue or reduce their ag-tourism activities
in the future. The 2006 Ag-tourism survey also showed that flower and/or nursery operations remained the most popular type of ag-tourism operation. Livestock and fruit farms were tied for second.
AG-TOURISM: Distribution of Farms by Future Intentions, State of Hawaii, 2000, 2003, and 2006
Year Future ag-tourism plans
Total Expand ag-tourism activities
Remain at current level
Discontinue or reduce ag-tourism activities
Uncertain
Number of ag-tourism farms
2000 60 41 7 18 126 2003 61 86 8 32 187 2006 48 43 5 16 112
AG-TOURISM: Distribution of Farms by Type of Farm, State of Hawaii, 2000, 2003, and 2006
Year Type of farm 1
Total Fruit Vegetable Coffee
Macadamia nut
Flower/ nursery
Livestock Other
Number of ag-tourism farms
2000 12 8 25 5 35 30 11 126 2003 30 18 30 14 38 26 31 187 2006 21 8 20 8 25 21 9 112
1 A predominate commodity was designated for farms reporting more than one commodity.
Statistics of Hawaii Agriculture 86
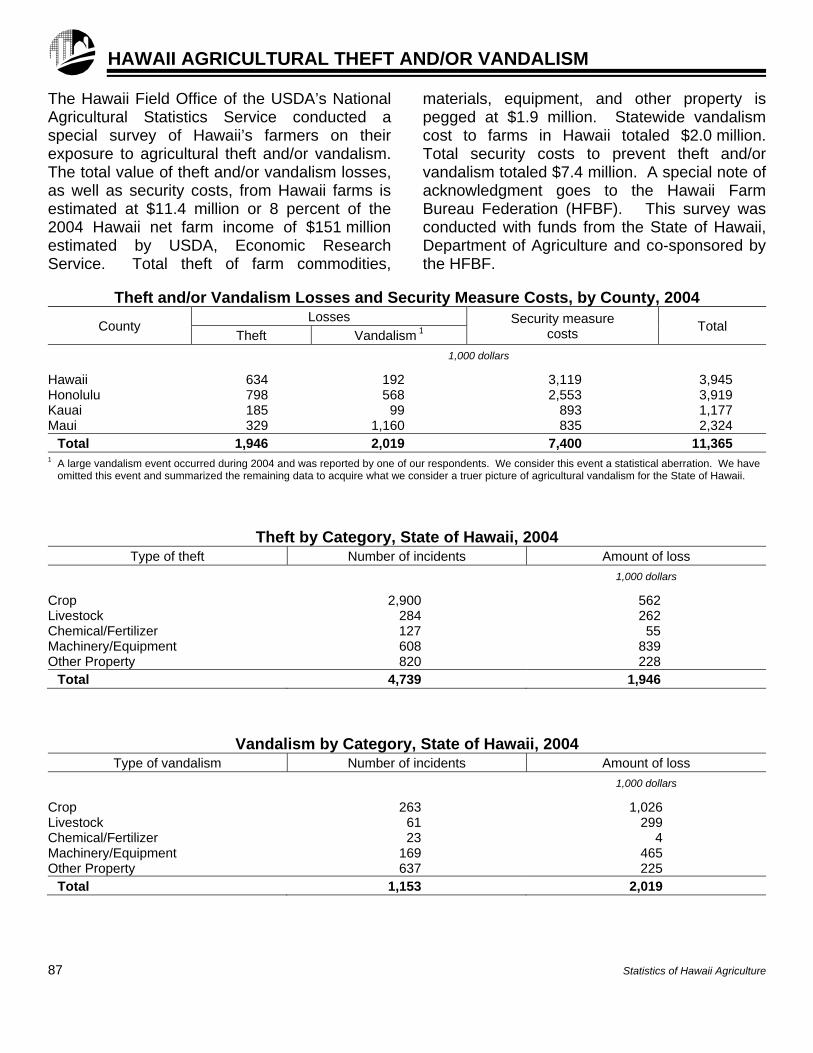
HAWAII AGRICULTURAL THEFT AND/OR VANDALISM
The Hawaii Field Office of the USDA’s National Agricultural Statistics Service conducted a special survey of Hawaii’s farmers on their exposure to agricultural theft and/or vandalism. The total value of theft and/or vandalism losses, as well as security costs, from Hawaii farms is estimated at $11.4 million or 8 percent of the 2004 Hawaii net farm income of $151 million estimated by USDA, Economic Research Service. Total theft of farm commodities,
materials, equipment, and other property is pegged at $1.9 million. Statewide vandalism cost to farms in Hawaii totaled $2.0 million. Total security costs to prevent theft and/or vandalism totaled $7.4 million. A special note of acknowledgment goes to the Hawaii Farm Bureau Federation (HFBF). This survey was conducted with funds from the State of Hawaii, Department of Agriculture and co-sponsored by the HFBF.
Theft and/or Vandalism Losses and Security Measure Costs, by County, 2004
County Losses Security measure
costs Total
Theft Vandalism 1
1,000 dollars
Hawaii 634 192 3,119 3,945 Honolulu 798 568 2,553 3,919 Kauai 185 99 893 1,177 Maui 329 1,160 835 2,324
Total 1,946 2,019 7,400 11,365 1 A large vandalism event occurred during 2004 and was reported by one of our respondents. We consider this event a statistical aberration. We have
omitted this event and summarized the remaining data to acquire what we consider a truer picture of agricultural vandalism for the State of Hawaii.
Theft by Category, State of Hawaii, 2004 Type of theft Number of incidents Amount of loss
1,000 dollars
Crop 2,900 562 Livestock 284 262 Chemical/Fertilizer 127 55 Machinery/Equipment 608 839 Other Property 820 228
Total 4,739 1,946
Vandalism by Category, State of Hawaii, 2004 Type of vandalism Number of incidents Amount of loss
1,000 dollars
Crop 263 1,026 Livestock 61 299 Chemical/Fertilizer 23 4 Machinery/Equipment 169 465 Other Property 637 225
Total 1,153 2,019
87 Statistics of Hawaii Agriculture
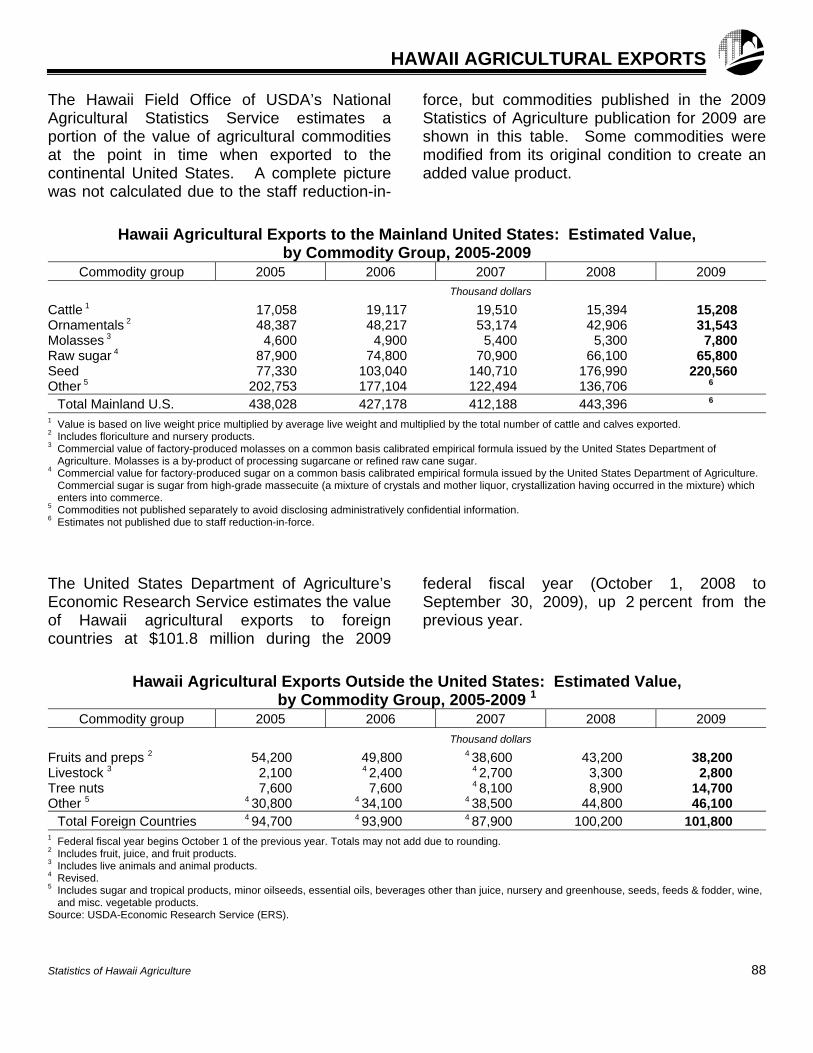
HAWAII AGRICULTURAL EXPORTS The Hawaii Field Office of USDA’s National Agricultural Statistics Service estimates a portion of the value of agricultural commodities at the point in time when exported to the continental United States. A complete picture was not calculated due to the staff reduction-in-
force, but commodities published in the 2009 Statistics of Agriculture publication for 2009 are shown in this table. Some commodities were modified from its original condition to create an added value product.
Hawaii Agricultural Exports to the Mainland United States: Estimated Value, by Commodity Group, 2005-2009
Commodity group 2005 2006 2007 2008 2009
Thousand dollars
Cattle 1 17,058 19,117 19,510 15,394 15,208 Ornamentals 2 48,387 48,217 53,174 42,906 31,543 Molasses 3 4,600 4,900 5,400 5,300 7,800 Raw sugar 4 87,900 74,800 70,900 66,100 65,800 Seed 77,330 103,040 140,710 176,990 220,560 Other 5 202,753 177,104 122,494 136,706 6
Total Mainland U.S. 438,028 427,178 412,188 443,396 6
1 Value is based on live weight price multiplied by average live weight and multiplied by the total number of cattle and calves exported. 2 Includes floriculture and nursery products. 3 Commercial value of factory-produced molasses on a common basis calibrated empirical formula issued by the United States Department of
Agriculture. Molasses is a by-product of processing sugarcane or refined raw cane sugar. 4 Commercial value for factory-produced sugar on a common basis calibrated empirical formula issued by the United States Department of Agriculture.
Commercial sugar is sugar from high-grade massecuite (a mixture of crystals and mother liquor, crystallization having occurred in the mixture) which enters into commerce.
5 Commodities not published separately to avoid disclosing administratively confidential information. 6 Estimates not published due to staff reduction-in-force.
The United States Department of Agriculture’s Economic Research Service estimates the value of Hawaii agricultural exports to foreign countries at $101.8 million during the 2009
federal fiscal year (October 1, 2008 to September 30, 2009), up 2 percent from the previous year.
Hawaii Agricultural Exports Outside the United States: Estimated Value, by Commodity Group, 2005-2009 1
Commodity group 2005 2006 2007 2008 2009
Thousand dollars
Fruits and preps 2 54,200 49,800 4 38,600 43,200 38,200 Livestock 3 2,100 4 2,400 4 2,700 3,300 2,800 Tree nuts 7,600 7,600 4 8,100 8,900 14,700 Other 5 4 30,800 4 34,100 4 38,500 44,800 46,100
Total Foreign Countries 4 94,700 4 93,900 4 87,900 100,200 101,800 1 Federal fiscal year begins October 1 of the previous year. Totals may not add due to rounding. 2 Includes fruit, juice, and fruit products. 3 Includes live animals and animal products. 4 Revised. 5 Includes sugar and tropical products, minor oilseeds, essential oils, beverages other than juice, nursery and greenhouse, seeds, feeds & fodder, wine,
and misc. vegetable products. Source: USDA-Economic Research Service (ERS).
Statistics of Hawaii Agriculture 88
DEFINITION OF TERMS ♦ Agriculture entails all operations performed
on a “farm” in connection with planting, growing, and harvesting of crops; raising and feeding of livestock and poultry, and management. All operations in connection with preparation of farm products for market where the preparation does not alter the form of the product and transportation to the first delivery point. In Hawaii, the first delivery point is defined as the processing plant or packinghouse door or other receivers’ establishment for marketings on the island of production. For off-island marketings, the first delivery point is generally the shipper’s warehouse.
Ag-tourism is a commercial enterprise on a
working farm conducted for the enjoyment, education, and/or active involvement of the visitor, generating supplemental income for the farm. Activities such as producing and selling products directly from the farm, operating a bed and breakfast, conducting educational farm tours, offering horseback riding, festivals, concerts, and many other on-farm activities qualify as ag-tourism.
♦ Farm is a place with estimated (or expected)
annual sales of agricultural products of at least $1,000.
♦ Crop Production is the estimated amount of
crop harvested and transferred at the first delivery point. Production estimates of vegetables and fruits include the quantity for fresh market and processing use.
♦ Acreage In Crop is the total acreage
standing in a specific crop regardless of age or condition unless it has been declared abandoned by the operator.
♦ Acreage Harvested is the total area
harvested or partially harvested during the reporting period. A permanent or semi-permanent planting that was harvested for only a portion of the year is counted in its entirety. Acreage lost before maturity due to natural or economic factors is not included. Acreage harvested and planted repeatedly during the year is counted each time.
♦ Yield is the average production per acre of
merchantable quality harvested and sold or utilized. This is derived by dividing total production by harvested acres.
♦ Livestock Operation is defined as a place
that has one or more head of the species on hand at any time during the year. It does not have to meet the definition of a farm.
♦ Livestock Production is the estimated
amount of livestock and livestock products sold. This includes allowance for amounts used on farms where produced.
♦ Farm Price is a computed price to value
agricultural production which may or may not reflect the average price at which actual transfer of ownership took place but which is comparable with the definition of “agriculture”. See “agriculture” for the definition of pricing point.
♦ Market Supply includes pounds of product
sold in Hawaii to both Armed Forces and civilians (outshipments excluded). Direct inshipments to the Armed Forces are excluded.
89 Statistics of Hawaii Agriculture
SAMPLING METHODS AND ESTIMATION
The Hawaii Field Office of USDA, National Agricultural Statistics Service, uses a variety of sampling techniques to produce current agricultural statistics about crops, livestock, prices, farm labor, and other information relating to the agricultural economy. Data is collected and summarized; estimates are prepared. These estimates then pass through the Agricultural Statistics Board of the U.S. Department of Agriculture where, for major items, Hawaii estimates become part of National totals and enter the official data base for agriculture. National and State estimates are published according to a schedule set one year in advance. The Hawaii Field Office conducts many of its surveys by virtually complete ENUMERATION of certain parts of the population. This is unusual compared to procedures in other states but is feasible in Hawaii due to the relatively small size of certain categories of the farm universe or the extreme concentration of ownership. List Sampling is a common means of data
collection. Lists of farm operators are well suited for the low cost collection of information by mail. Supplementary information is included within the frame that allows the use of efficient stratified sample designs. A major disadvantage of this method is the constant change in the list
frame which can never be perfect. In Hawaii, cattle, hog, macadamia nut, and coffee surveys are examples of stratified list sample designs.
Area Frame Sampling can be used alone or
in conjunction with the list frame. The frame consists of an aggregation of identifiable units of land or segments which may be sampled. The frame is complete and does not suffer the type of deterioration over time as does a list frame.
Multiple-Frame Sampling is the use of two
frames. It takes advantage of the best attributes of the area frame and the list frame, produces unbiased estimates, and allows measurement of the sampling error.
Objective Yield Surveys provide information
from direct counts, measurements and weights of the crop made from small plots in a probability selection of sample fields.
Administrative Data is used in addition to
producer surveys to establish final production and marketings. These include processor receipts, slaughter, vacuum cooler volume, and inspections. Unloads at Honolulu and wholesale prices, previously reported by the Market Analysis and News Branch, were an important check data source.
Statistics of Hawaii Agriculture 90
NEED MORE INFORMATION? www.usda.gov/nass/ Where can I get more statistics or economic analysis? National Agricultural Statistics Service (NASS) publications include weekly, monthly, quarterly, and annual estimates of production, stocks, inventories, dispositions, utilization, and process of agricultural commodities and other items. The Census of Agriculture is published every five years covering all commodities by state, county, and zip code. Other census reports include the Agricultural Atlas, Agricultural Economics & Land Ownership, Aquaculture, Census History, Congressional Tabulations, Farm & Ranch Irrigation, Horticulture Specialties, and Outlying Areas. Economic Research Service (ERS) Situation and Outlook Reports and periodicals analyze the current situation and forecast market conditions. ERS monographs offer economic analysis in the area of trade, production, rural development, farm inputs, and other topics. The World Agricultural Outlook Board (WAOB) issues regular forecasts of U.S. and world supply and demand prospects for major agricultural commodities. How can I get national publications from NASS & ERS? → For free e-mail subscriptions, visit usda.mannlib.cornell.edu/MannUsda/register.do or visit www.nass.usda.gov/Publications/index.asp. The NASS and ERS catalogs list all products and services available from each agency. The NASS catalog includes a calendar of publication dates for agricultural statistics reports throughout the year. How can I get state publications from NASS field offices? → For free e-mail subscriptions, visit www.nass.usda.gov/Publications/index.asp or view them online at www.nass.usda.gov/Statistics_by_State/index.asp → For paper subscriptions, contact us at (808) 973-9588. For other states, call 1-800-727-9540.
Sources of Agricultural Information in USDA USDA – NASS Room 5038 South Building 1400 Independence Ave., SW Washington, D.C. 20250-2001
1-800-727-9540 FAX: 202-690-2090
Washington, D.C. E-mail: [email protected] Hawaii E-mail: [email protected] Other Field Offices E-mail: [email protected] (xx is the state abbreviation) Internet: www.nass.usda.gov
USDA – ERS 1800 M Street, NW Washington, D.C. 20036-5831
202-694-5050 FAX: 202-694-5638
E-mail: [email protected] Internet: www.ers.usda.gov
USDA – WAOB Room 4426 South Building 1400 Independence Ave., SW, Stop 3812 Washington, D.C. 20250-3812
202-720-5447 FAX: 202-690-3160
E-mail: [email protected] Internet: www.usda.gov/oce/commodity
Small Farm Program: USDA – National Institute of Food & Agriculture 1400 Independence Ave., SW, Stop 2201 Washington, D.C. 20250-2201
202-720-4423 FAX: 202-690-0289
Internet: www.nifa.usda.gov/familysmallfarms.cfm
Farmer Direct Marketing Initiative: USDA – AMS – Transportation & Marketing Marketing Services Branch Room 2646 South Building 1400 Independence Ave., SW, Stop 0269 Washington, D.C. 20250-0269
202-720-8317 FAX: 202-690-0031
E-mail: [email protected] Internet: www.ams.usda.gov/farmersmarkets
National Specialists are available to answer your questions by phone or E-mail. See these internet sites for telephone numbers and E-mail addresses: Statistics from USDA, NASS Economists in USDA, ERS
Internet: www.nass.usda.gov Internet: www.ers.usda.gov
91 Statistics of Hawaii Agriculture
REPORTS
Title and Description Release Date
CROPS
AVOCADOS: Annual summary of acreage, yield, production, farm price, and value .................................. July
BANANAS: Annual summary of acreage, yield, production, farm price, and value ..................................... May
COFFEE:
- Preliminary season estimates of acreage, yield, production, farm price, and value .................................. February
- Final season estimates of acreage, yield, production, farm price, and value ............................................ August
GUAVAS: Annual summary of acreage, production, farm price, and value ................................................. June
MACADAMIA NUTS:
- Preliminary season estimates of acreage, yield, production, farm price, and value .................................. February
- Final season estimates of acreage, yield, production, farm price, and value ............................................ July
PAPAYA: Annual summary of acreage, yield, production, farm price, and value ........................................ July
SEED CROP: Annual summary of acreage, outshipments of seed, and value ............................................ October
SUGARCANE: Estimates of acreage and production for all major U.S. producing areas ............................ August-November
TARO:
- Quarterly report of taro milled for poi ......................................................................................................... Jan., Apr., Jul., Oct.
- Annual summary of acreage, production, and farm prices for Chinese and wetland taro varieties ........... April
VEGETABLES: Annual summary of acreage, production, and value for all vegetables and melons ........... December
FLORICULTURE AND NURSERY PRODUCTS
FLORICULTURE AND NURSERY PRODUCTS: Annual summary of acreage, production, and value ...... June
LIVESTOCK
AQUACULTURE: Annual summary of operations, production, and value ................................................... September
CATTLE: Annual summary of inventory and calf crop as of January 1 ........................................................ February
HOGS: Annual summary of inventory and pig crop as of December 1 ........................................................ January
HONEY: Annual summary of colonies, production, yield, farm price, and value .......................................... March
OTHER PUBLICATIONS
CROP WEATHER: Weekly comments on weather and crop conditions. Rainfall data for selected stations ...................................................................................................................................................... First working day of week
FARM LABOR: Quarterly report on number of workers by type and average wage rates ........................... Feb., May, Aug., Nov.
FARM REVENUE: Farm gate value of major commodities .......................................................................... January
STATISTICS OF HAWAII AGRICULTURE: Annual summary of the State’s agricultural sector ................. January
To order: Any of the above reports may be obtained by contacting the USDA, NASS, Hawaii Field Office, 1428 South King Street, Honolulu, HI 96814-2512, (808) 973-9588.
Most of our publications are available on the internet at: www.nass.usda.gov/Statistics_by_State/Hawaii/index.asp Now you can receive our latest publications by e-mail. Subscribe free over the internet at: www.nass.usda.gov/Statistics_by_State/Hawaii/Subscribe_to_HI_Reports/index.asp Statistics of Hawaii Agriculture 92
STATE FIELD OFFICES
TO REQUEST DATA FROM THE OTHER STATISTICAL OFFICES, WRITE: (STATE) FIELD OFFICE
ALABAMA
P.O. Box 240578 Montgomery 36124 (334) 279-3555
IDAHO
P.O. Box 1699 Boise 83701 (208) 334-1507
MINNESOTA
P.O. Box 7068 St. Paul 55107 (651) 296-2230
NEW YORK
10B Airline Drive Albany 12235 (518) 457-5570
SOUTH DAKOTA
P.O. Box 5068 Sioux Falls 57117 (605) 323-6500
ALASKA
P.O. Box 799 Palmer 99645 (907) 745-4272
ILLINOIS
P.O. Box 19283 Springfield 62794 (217) 492-4295
MISSISSIPPI
P.O. Box 980 Jackson 39205 (601) 965-4575
NORTH CAROLINA
P.O. Box 27767 Raleigh 27611 (919) 856-4394
TENNESSEE
P.O. Box 41505 Nashville 37204 (615) 781-5300
ARIZONA
230 N First Ave. Suite 303 Phoenix 85003 (602) 280-8850
INDIANA
1435 Win Hentschel Blvd. Suite 110 West Lafayette 47906 (765) 494-8371
MISSOURI
P.O. Box L Columbia 65205 (573) 876-0950
NORTH DAKOTA
P.O. Box 3166 Fargo 58108 (701) 239-5306
TEXAS
P.O. Box 70 Austin 78767 (512) 916-5581
ARKANSAS
10800 Financial Centre Pkwy. Suite 110 Little Rock 72211 (501) 228-9926
IOWA
210 Walnut St. Suite 833 Des Moines 50309 (515) 284-4340
MONTANA
10 West 15th
Suite 3100 Helena 59626 (406) 441-1240
OHIO
P.O. Box 686 Reynoldsburg 43068 (614) 728-2100
UTAH
P.O. Box 25007 Salt Lake City 84125 (801) 524-5003
CALIFORNIA
P.O. Box 1258 Sacramento 95812 (916) 498-5161
KANSAS
P.O. Box 3534 Topeka 66601 (785) 233-2230
NEBRASKA
P.O. Box 81069 Lincoln 68501 (402) 437-5541
OKLAHOMA
P.O. Box 528804 Oklahoma City 73152 (405) 522-6190
VIRGINIA
P.O. Box 1659 Richmond 23218 (804) 771-2493
COLORADO
P.O. Box 150969 Lakewood 80215 (303) 236-2300
KENTUCKY
P.O. Box 1120 Louisville 40201 (502) 582-5293
NEVADA
P.O. Box 8880 Reno 89507 (775) 972-6001
OREGON
805 SW Broadway Suite 90 Portland 97205 (503) 326-2131
WASHINGTON
P.O. Box 609 Olympia 98507 (360) 902-1940
DELAWARE
2320 S. Dupont Hwy. Dover 19901 (302) 698-4537
LOUISIANA
P.O. Box 65038 Baton Rouge 70896 (225) 922-1362
NEW HAMPSHIRE
53 Pleasant St. Rm 2100 Concord 03301 (603) 224-9639
PENNSYLVANIA
4050 Crums Mill Rd. Suite 203 Harrisburg 17112 (717) 787-3904
WEST VIRGINIA 1
1900 Kanawha Blvd. E Charleston 25305 (304) 345-5958
FLORIDA
P.O. Box 945200 Maitland 32794 (407) 648-6013
MARYLAND
50 Harry S. Truman Pkwy. Suite 202 Annapolis 21401 (410) 841-5740
NEW JERSEY
P.O. Box 330 Trenton 08625 (609) 292-6385
PUERTO RICO
P.O. Box 10163 San Juan 00907 (787) 723-3773
WISCONSIN
P.O. Box 8934 Madison 53708 (608) 224-4848
GEORGIA
355 East Hancock Ave. Suite 320 Athens 30601 (706) 546-2236
MICHIGAN
P.O. Box 26248 East Lansing 48909 (517) 324-5300
NEW MEXICO
P.O. Box 1809 Las Cruces 88004 (575) 522-6023
SOUTH CAROLINA
1835 Assembly St. Suit 1008 Columbia 29201 (803) 765-5333
WYOMING
P.O. Box 1148 Cheyenne 82003 (307) 432-5600
1
Send UPS/Fed Ex (BULK/FREIGHT) mail to: 217 Gus R. Douglass Lane, Charleston 25312. First class mail only will be delivered at the above address.
93 Statistics of Hawaii Agriculture
OTHER GOVERNMENT OFFICES
Cooperative Extension Service Hawaii County Office 875 Komohana St. Hilo, HI 96720 (808) 981-5199
Cooperative Extension Service Kaneohe Office 45-260 Waikalua Rd. Rm 101 Kaneohe, HI 96744 (808) 247-0421
Cooperative Extension Service Kamuela Office 67-5189 Kamamalu Rd. Kamuela, HI 96743 (808) 887-6183
Cooperative Extension Service Pearl City Office 955 Kamehameha Hwy. Pearl City, HI 96782 (808) 453-6050
Cooperative Extension Service Kona Office 79-7381 Mamalahoa Hwy. Kealakekua, HI 96750-7911 (808) 322-4892
Cooperative Extension Service Oahu County Office 1955 E West Rd. Ag Science Bldg. 217 Honolulu, HI 96822 (808) 956-7138
Cooperative Extension Service Maui Office 310 Kaahumanu Ave. Bldg. 214 Kahului, HI 96732 (808) 244-3242
USDA Hawaii County FSA Office Room 219 Federal Bldg. 154 Waianuenue Ave. Hilo, HI 96720 (808) 933-8340
Cooperative Extension Service Molokai Office P.O. Box 394 Hoolehua, HI 96729 (808) 567-6929
USDA Maui County FSA Office 77 Hookele St. Suite 201 Kahului, HI 96732 (808) 871-5500 Toll Free 1 (866) 465-0519
Cooperative Extension Service Kauai County Office 3060 Eiwa St. Rm 210 Lihue, HI 96766 (808) 274-3471
USDA Kauai County FSA Office Watumull Bldg. 4334 Rice St. Rm 103 Lihue, HI 96766 (808) 245-9014
Cooperative Extension Service Wahiawa Office 910 California Ave. Rm 108 Wahiawa, HI 96786 (808) 622-4185
USDA Honolulu County FSA Office 99-193 Aiea Heights Drive Suite 114 Aiea, HI 96701 (808) 483-8600
Statistics of Hawaii Agriculture 94

INDUSTRY ASSOCIATIONS
ANTHURIUM
Hawaiian Anthurium Industry Association P.O. Box 4755 Hilo, HI 96720 (808) 966-7427 AQUACULTURE
Hawaii Aquaculture and Aquaponics Association 47-215 Iuiu St. Kaneohe, HI 96744 (808) 429-3147 AVOCADO
Hawaii Avocado Association P.O. Box 925 Kealakekua, HI 96750 (808) 329-9729 AWA (KAVA)
Association for Hawaiian Awa P.O. Box 636 Pepeekeo, HI 96783 (808) 965-8394 Awa Development Council P.O. Box 26344 Honolulu, HI 96825 (808) 256-5605 BANANA
Hawaii Banana Industry Association 162 Maka Hinu St. Hilo, HI 96720 (808) 936-6617 BEEKEEPERS
Big Island Beekeepers Association HC 2 Box 9563 Keaau, HI 96749 (808) 966-4074 Hawaii Beekeepers’ Association 3081G Paty Drive Honolulu, HI 96822 (808) 988-7203
CATTLE
Hawaii Beef Industry & Cattlemen’s Council 64-957 Mamalahoa Hwy. Kamuela, HI 96743 (808) 885-5599 COFFEE
Hawaii Coffee Association 75-5629 Kuakini Hwy. Suite R#648 Kailua-Kona, HI 96740 (808) 847-3600 Ka`u Coffee Growers Cooperative P.O. Box 28 Pahala, HI 96781 (808) 928-8916 Kona Coffee Council P.O. Box 2077 Kealakekua, HI 96750 (808) 322-6575 Kona Coffee Farmers Association P.O. Box 5436 Kailua-Kona, HI 96745 (808) 322-1740 Kona Pacific Farmers Cooperative P.O. Box 309 Captain Cook, HI 96704 (808) 328-2411 CROP IMPROVEMENT
Hawaii Crop Improvement Association 91-1012 Kahiuka St. Ewa Beach, HI 96706 (808) 224-3648 EGG
Hawaii Egg Producers Association 841 Bishop St. Honolulu, HI 96813 (808) 841-2384 FARM (General)
Hawaii Farm Bureau Federation 2343 Rose St. Honolulu, HI 96819 (808) 848-2074
FLOWERS & NURSERY
Big Island Association of Nurserymen (BIAN) P.O. Box 4365 Hilo, HI 96720 (808) 966-7169 Dendrobium Orchid Growers Association of Hawaii (DOGAH) 94-457 Kiilani St. Mililani, HI 96789 (808) 668-1348 Hawaii Association of Nurserymen 1860 Ala Moana Blvd. Suite 420 Honolulu, HI 96815 (808) 951-0055 Hawaii Export Nursery Association (HENA) P.O. Box 11120 Hilo, HI 96721 (808) 969-2088 Hawaii Florists and Shippers Association (HFSA) P.O. Box 5640 Hilo, HI 96720 (808) 959-3535 Hawaii Island Landscape Association (HILA) P.O. Box 1594 Kailua Kona, HI 96745 (808) 323-9848 Hawaii Landscape & Irrigation Contractors Association (HLICA) 1860 Ala Moana Blvd. Suite 420 Honolulu, HI 96815 (808) 951-0055 Hawaii State Protea Growers Corporation P.O. Box 7180 Ocean View, HI 96737 (808) 939-9477 Hawaii Tropical Flower Council P.O. Box 4306 Hilo, HI 96720 (808) 961-5555 Hawaii Tropical Flowers & Foliage Association-Kauai Chapter P.O. Box 2015 Kapaa, HI 96746 (808) 332-7984
95 Statistics of Hawaii Agriculture
INDUSTRY ASSOCIATIONS
FLOWERS & NURSERY - Continued
Hawaii Turfgrass Association 1860 Ala Moana Blvd. Suite 420 Honolulu, HI 96815 (808) 951-0055 Landscape Industry Council of Hawaii (LICH) P.O. Box 22938 Honolulu, HI 96823 (808) 951-0055 Maui Flower Growers Association 176 Mehani Circle Kihei, HI 96753 (808) 573-5878 Orchid Growers of Hawaii (OGOH) P.O. Box 4153 Hilo, HI 96720 (808) 965-9570 FOOD
Hawaii Food Manufacturers Association (HFMA) P.O. Box 30812 Honolulu, HI 96820 (808) 456-5929 Hawaii Food Industry Association (HFIA) 1050 Bishop St., Box 235 Honolulu, HI 96813 (808) 533-1292 FOREST
Hawaii Forest Industry Association P.O. Box 66 O`okala, HI 96774 (808) 933-9411 GUAVA
Hawaii Guava Growers Cooperative P.O. Box 4833 Hilo, HI 96720 (808) 217-7210 MACADAMIA NUT
Hawaii Macadamia Nut Association P.O. Box 4983 Hilo, HI 96720 (808) 969-8033
MILK
Fresh Milk Industry of Hawaii P.O. Box 190 Hawi, HI 96719 (808) 889-5838 ONION
Maui Onion Growers Association (MOGA) 755 Naele Rd. Kula, HI 96790 (808) 281-4596 ORGANIC
Hawaii Cooperative of Organic Farmers (HICOF) P.O. Box 728 Waialua, HI 96791 (808) 637-4555 Hawaii Organic Farmers Association (HOFA) P.O. Box 6863 Hilo, HI 96720 (808) 969-7789 Toll Free (877) 674-4753 PAPAYA
Hawaii Papaya Industry Association (HPIA) P.O. Box 6959 Hilo, HI 96720 (808) 969-1160 PINEAPPLE
Pineapple Growers Association of Hawaii (PGAH) 1116 Whitmore Ave. Wahiawa, HI 96786 (808) 621-1221 PORK
Hawaii Pork Industry Association (HPIA) C/o Hawaii Food Products 87-1550 Kanahale Rd. Waianae, HI 96792 (808) 676-9100
SHEEP
Sheep Producer’s Association of Hawaii P.O. Box 523 Honokaa, HI 96727 (808) 775-0401 TARO
Kauai Taro Growers Association P.O. Box 427 Hanalei, HI 96714 (808) 826-6202 TEA
Hawaii Tea Society P.O. Box 10644 Hilo, HI 96721 TROPICAL FRUITS
Hawaii Tropical Fruit Growers Association P.O. Box 1162 Captain Cook, HI 96704 (808) 969-7926 Hawaii Tropical Fruit Cooperative P.O. Box 388 Kurtistown, HI 96760 (808) 966-6633 VEGETABLE
Kamuela Vacuum Cooling Cooperative, LTD P.O. Box 514 Kamuela, HI 96743 (808) 885-4271 Maui Farmer’s Cooperative Exchange 970 B Lower Main St. Wailuku, HI 96793 (808) 242-9767
Statistics of Hawaii Agriculture 96
PHOTOGRAPHY ACKNOWLEDGEMENTS
Cover Photo: Taro, W T Haraguchi Farm Inc, courtesy of the Market Development Branch, Hawaii Department of Agriculture.
Aquaculture: Abalone, courtesy of Aquaculture Development, Hawaii Department of Agriculture, page 82.
Floriculture: Dendrobium orchid, courtesy of the Market Development Branch, Hawaii Department of Agriculture, page 35.
Fruits: Papaya, courtesy of the Market Development Branch, Hawaii Department of Agriculture, page 37. Rambutan, courtesy of the Market Development Branch, Hawaii Department of Agriculture, page 40.
Vegetables: Watercress, courtesy of HAS staff, page 46. Tomatoes, courtesy of the Market Development Branch, Hawaii Department of Agriculture, page 46. Italian squash, courtesy of the Market Development Branch, Hawaii Department of Agriculture, page 62.
97 Statistics of Hawaii Agriculture