Embed Size (px)
Citation preview
172
Statistics of Income Studies of International Income and Taxesby Melissa Costa and Nuria E. McGrath
Melissa Costa and Nuria E. McGrath are economists with the Special Studies Returns Analysis Section. This article was prepared under the direction of Chris Carson, Chief.
T he United States generally taxes U.S. persons on their worldwide income and foreign persons on their U.S.-source income or the portion of
their income that, by defi nition, is considered to be connected with a U.S. source. A U.S. person is any citizen or resident of the United States, a domestic partnership or corporation, or any estate or trust that is not considered foreign. Any person who does not fi t the defi nition of a U.S. person is considered a foreign person.1
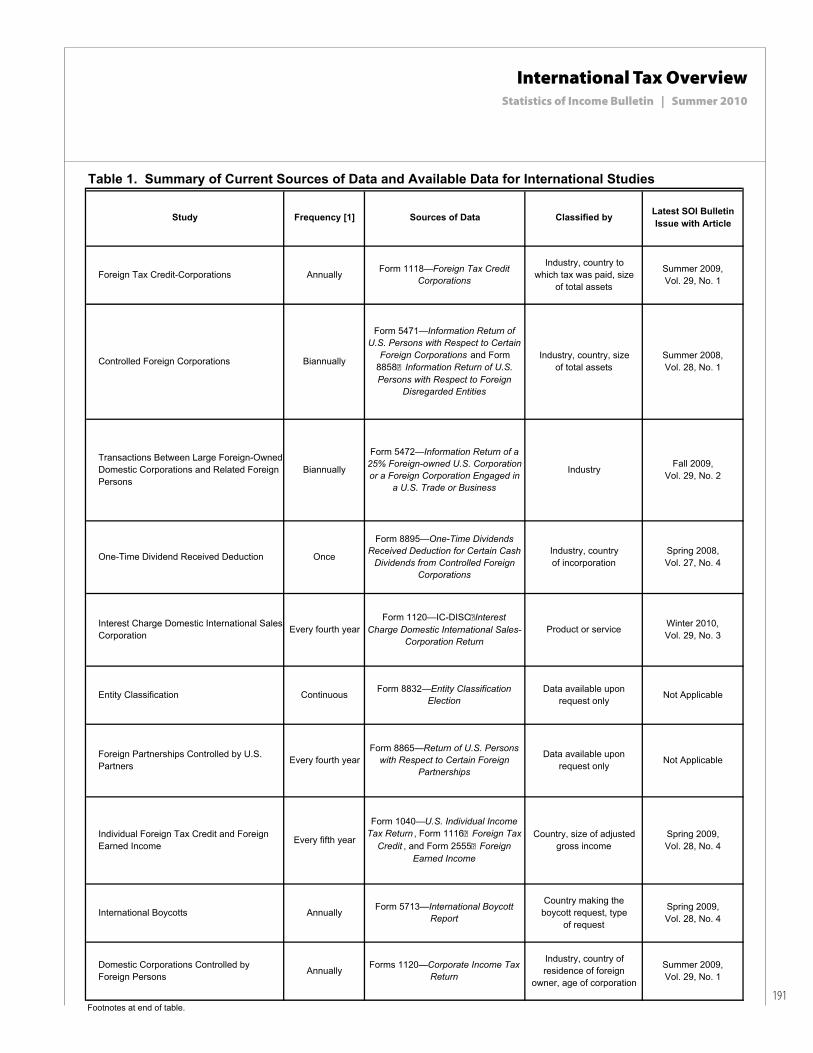
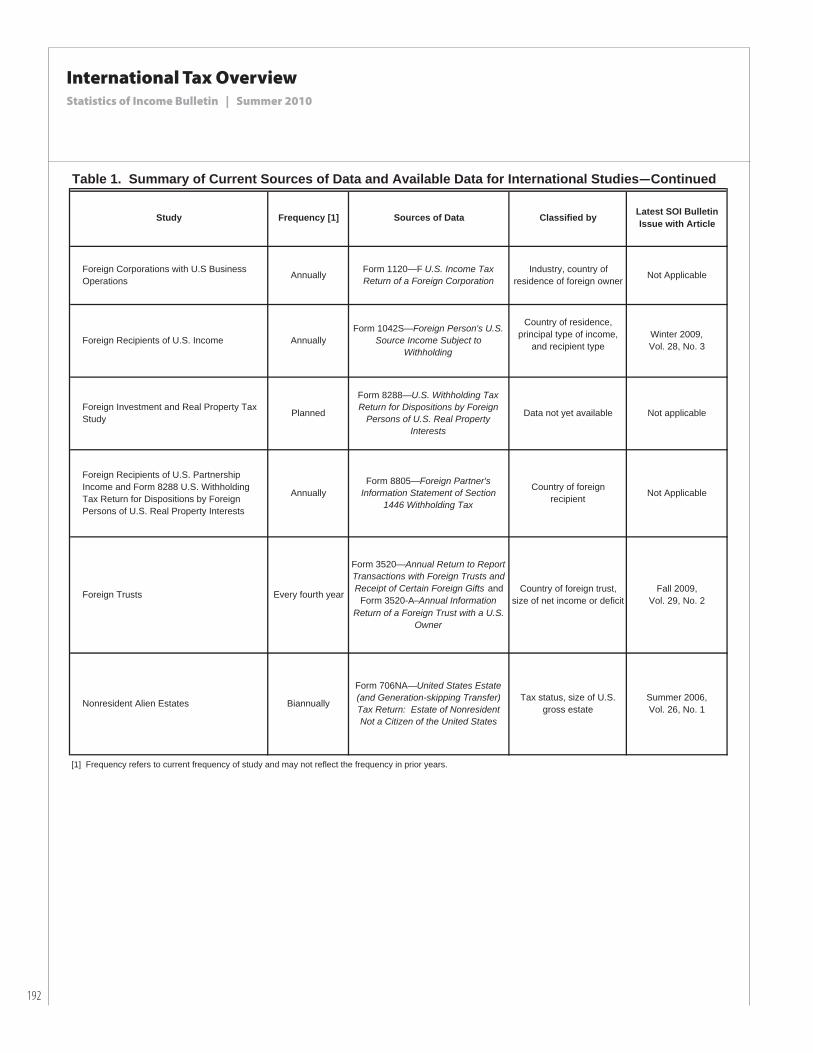
The Statistics of Income ( SOI ) Division of the IRS conducts 15 studies of international income and taxes. These studies provide data on the foreign activity of U.S. persons, as well as the U.S. activity of foreign persons. Table 1 lists the data sources for each of the studies mentioned in this article, as well as the current frequency of each study. Data for re-cent study years can be found on SOI’s Web pages (www.irs.gov/taxstats).
Foreign Activities of U.S. PersonsCorporate Foreign Tax Credit
In 1918, Congress designed the corporate foreign tax credit provisions Federal tax law to prevent potential double taxation on the foreign-source income of U.S. corporations, as U.S. corporations are taxed on their worldwide income. Double taxation occurs when an item of income is taxed by both the United States, as a corporation’s country of residence, as well as by the country from which the income originates. The current provisions allow U.S. businesses to credit their foreign taxes paid, accrued, or deemed paid against their U.S. income tax liability. Currently, the credit is limited to the amount of U.S. tax a corpora-tion would have otherwise paid on foreign-source taxable income. This limitation prevents taxpayers from using taxes paid at higher tax rates than the
U.S. rate to offset their tax liability on other U.S. in-come. Taxes that exceed the limitation can be carried back for 1 year or carried forward for 10 years.
Corporations are required to calculate the credit separately for different income categories to prevent taxpayers from shifting nonbusiness, lower-taxed income (for example, investment income) overseas. Typically, these investments generate additional foreign income, but incur minimal tax liability, ef-fectively increasing the limitation on the foreign tax credit. Segregation of this low-taxed, nonbusiness income from other foreign income limits U.S. cor-porations from arranging foreign investments at the expense of U.S. tax revenue.2
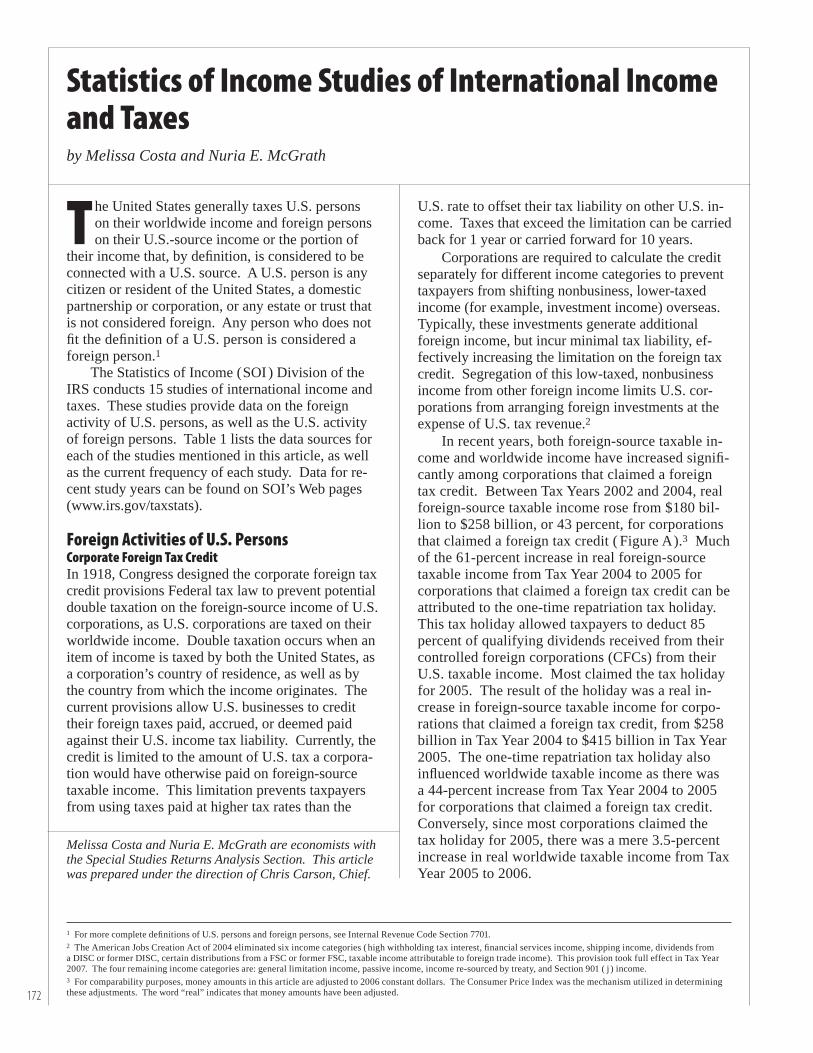
In recent years, both foreign-source taxable in-come and worldwide income have increased signifi -cantly among corporations that claimed a foreign tax credit. Between Tax Years 2002 and 2004, real foreign-source taxable income rose from $180 bil-lion to $258 billion, or 43 percent, for corporations that claimed a foreign tax credit ( Figure A ).3 Much of the 61-percent increase in real foreign-source taxable income from Tax Year 2004 to 2005 for corporations that claimed a foreign tax credit can be attributed to the one-time repatriation tax holiday. This tax holiday allowed taxpayers to deduct 85 percent of qualifying dividends received from their controlled foreign corporations (CFCs) from their U.S. taxable income. Most claimed the tax holiday for 2005. The result of the holiday was a real in-crease in foreign-source taxable income for corpo-rations that claimed a foreign tax credit, from $258 billion in Tax Year 2004 to $415 billion in Tax Year 2005. The one-time repatriation tax holiday also infl uenced worldwide taxable income as there was a 44-percent increase from Tax Year 2004 to 2005 for corporations that claimed a foreign tax credit. Conversely, since most corporations claimed the tax holiday for 2005, there was a mere 3.5-percent increase in real worldwide taxable income from Tax Year 2005 to 2006.
1 For more complete defi nitions of U.S. persons and foreign persons, see Internal Revenue Code Section 7701.2 The American Jobs Creation Act of 2004 eliminated six income categories ( high withholding tax interest, fi nancial services income, shipping income, dividends from a DISC or former DISC, certain distributions from a FSC or former FSC, taxable income attributable to foreign trade income ). This provision took full effect in Tax Year 2007. The four remaining income categories are: general limitation income, passive income, income re-sourced by treaty, and Section 901 ( j ) income.3 For comparability purposes, money amounts in this article are adjusted to 2006 constant dollars. The Consumer Price Index was the mechanism utilized in determining these adjustments. The word “real” indicates that money amounts have been adjusted.
International Tax OverviewStatistics of Income Bulletin | Summer 2010
173
Figure A
0.0
0.2
0.4
0.6
0.8
1.0
1.2
1.4
1986 1988 1992 1994 1996 1998 2001 2002 2003 2004 2005 2006
Worldwide taxable income Foreign-source taxable income
Tax year
Foreign-Source Taxable Income of Corporations with a Foreign Tax Credit, Compared to Worldwide Taxable Income for All Corporations, for Selected Tax Years, 1986–2006
Trillions of dollars
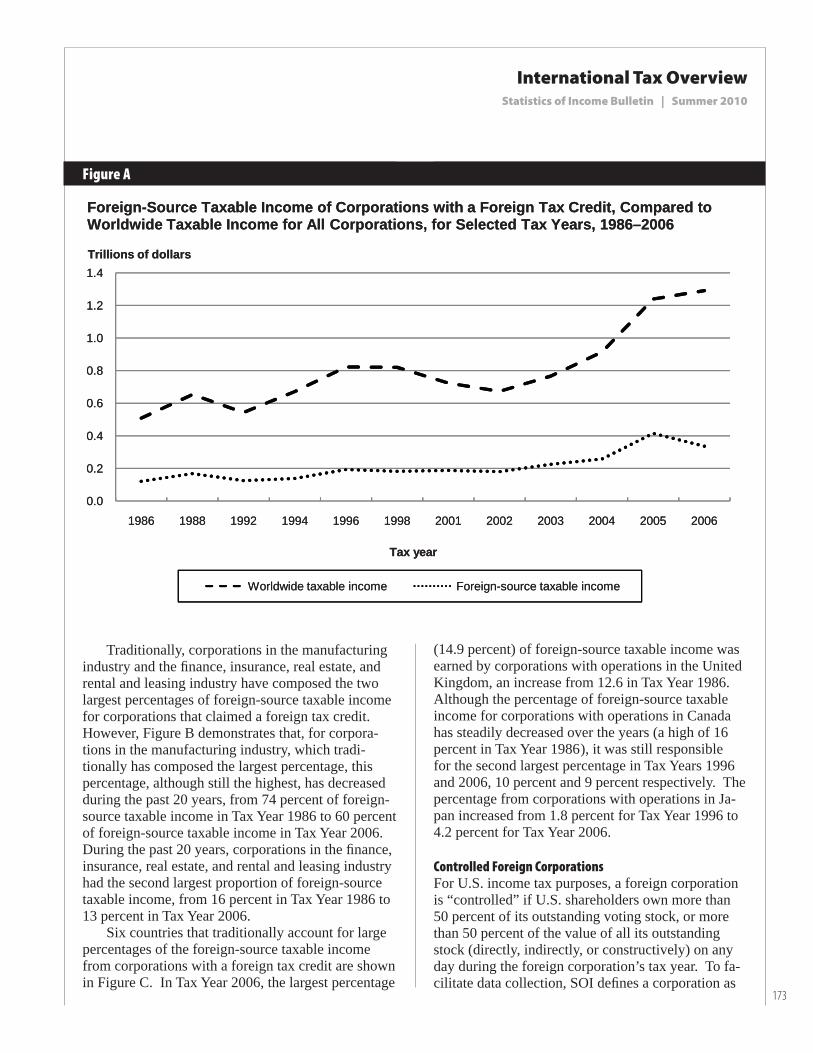
Traditionally, corporations in the manufacturing industry and the fi nance, insurance, real estate, and rental and leasing industry have composed the two largest percentages of foreign-source taxable income for corporations that claimed a foreign tax credit. However, Figure B demonstrates that, for corpora-tions in the manufacturing industry, which tradi-tionally has composed the largest percentage, this percentage, although still the highest, has decreased during the past 20 years, from 74 percent of foreign-source taxable income in Tax Year 1986 to 60 percent of foreign-source taxable income in Tax Year 2006. During the past 20 years, corporations in the fi nance, insurance, real estate, and rental and leasing industry had the second largest proportion of foreign-source taxable income, from 16 percent in Tax Year 1986 to 13 percent in Tax Year 2006.
Six countries that traditionally account for large percentages of the foreign-source taxable income from corporations with a foreign tax credit are shown in Figure C. In Tax Year 2006, the largest percentage
(14.9 percent) of foreign-source taxable income was earned by corporations with operations in the United Kingdom, an increase from 12.6 in Tax Year 1986. Although the percentage of foreign-source taxable income for corporations with operations in Canada has steadily decreased over the years (a high of 16 percent in Tax Year 1986 ), it was still responsible for the second largest percentage in Tax Years 1996 and 2006, 10 percent and 9 percent respectively. The percentage from corporations with operations in Ja-pan increased from 1.8 percent for Tax Year 1996 to 4.2 percent for Tax Year 2006.
Controlled Foreign Corporations
For U.S. income tax purposes, a foreign corporation is “controlled” if U.S. shareholders own more than 50 percent of its outstanding voting stock, or more than 50 percent of the value of all its outstanding stock (directly, indirectly, or constructively) on any day during the foreign corporation’s tax year. To fa-cilitate data collection, SOI defi nes a corporation as
International Tax OverviewStatistics of Income Bulletin | Summer 2010
174
336350
400
Foreign-Source Taxable Income of Manufacturing and Finance Industry Corporations Comparedto Total Foreign-Source Taxable Income, Selected Tax Years, 1986–2006
Billions of dollars
121
194
336
90
128
202
45100
150
200
250
300
350
400
Foreign-Source Taxable Income of Manufacturing and Finance Industry Corporations Comparedto Total Foreign-Source Taxable Income, Selected Tax Years, 1986–2006
Billions of dollars
121
194
336
90
128
202
2039 45
0
50
100
150
200
250
300
350
400
1986 1996 2006
Total foreign-source taxable income Manufacturing Finance, insurance, real estate, and rental and leasing
NOTE: For comparability, amounts have been adjusted for inflation to 2006 constant dollars.
Foreign-Source Taxable Income of Manufacturing and Finance Industry Corporations Comparedto Total Foreign-Source Taxable Income, Selected Tax Years, 1986–2006
Billions of dollars
Figure B
Figure C
16.0%
13.2%14.9%
14 0%
16.0%
18.0%
Percent of Foreign-Source Taxable Income, by Selected Country, for Selected Tax Years, 1986–2006
12.6%
8.6%8.2%
4.0%
10.0%
6.9%
3.7%
9.0%
4.2%6.0%
8.0%
10.0%
12.0%
14.0%
2.4%1.8% 2.2%
3.7%2.6% 2.2%
1.7%
0.0%
2.0%
4.0%
United Kingdom Canada Japan Switzerland Germany France
1986 1996 2006
International Tax OverviewStatistics of Income Bulletin | Summer 2010
175
controlled only if one U.S. corporation satisfi es either of the above 50-percent ownership requirements for a minimum of 30 consecutive days during the foreign corporation’s tax year.
In general, U.S. shareholders of a foreign corpo-ration are not taxed on its foreign-source income un-til such income is repatriated. In 1962, Congress cre-ated the Subpart F provisions of the Internal Revenue Code that deny this deferral of current U.S. taxation on certain types of income earned by CFCs, includ-ing types of passive income that are highly mobile and can be easily transferred to low-tax jurisdictions, and payments between related parties, which can be used to shift income for tax advantage. CFC income subject to Subpart F rules is treated as if it were a dividend repatriated to U.S. shareholders and, thus, becomes subject to current U.S. tax.4
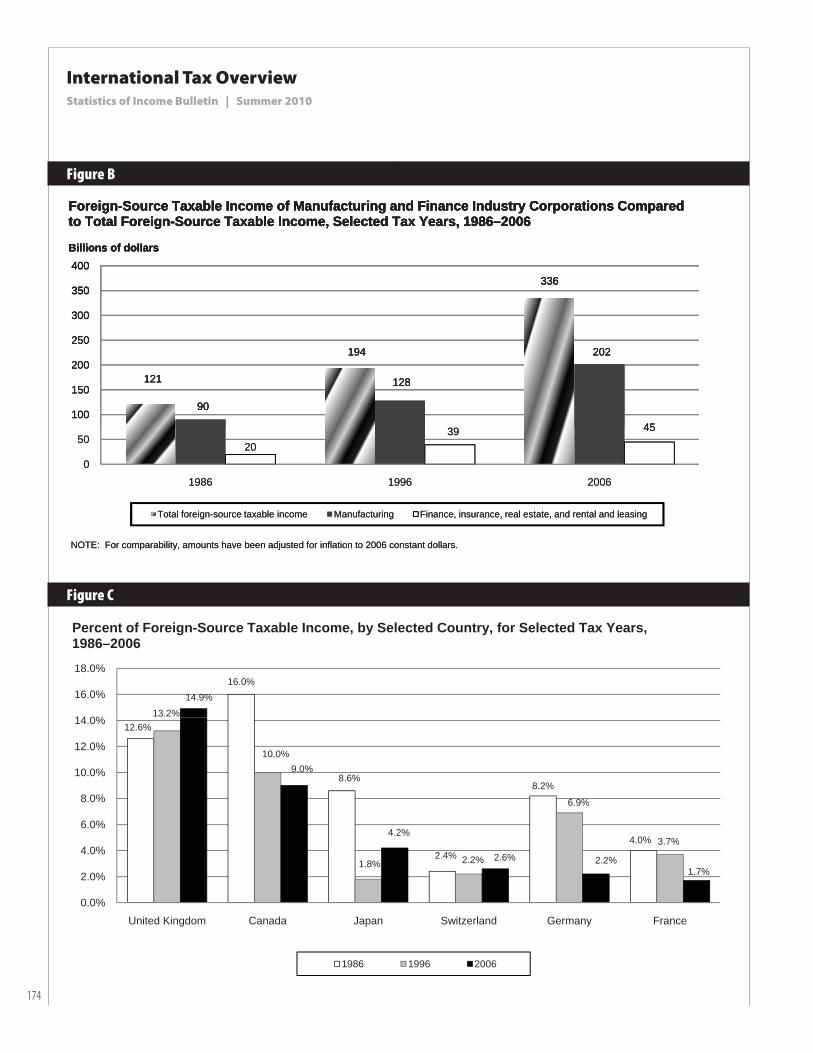
Figure D depicts selected items from the major industrial sectors reported by all controlled foreign corporations for Tax Years 2004 and 2006. In par-ticular, real total receipts of all CFCs increased 19 percent from $4.05 trillion in 2004 to $4.82 trillion in 2006. This is consistent with an 11.5-percent in-crease in real total receipts of all active corporations
from Tax Year 2004 to 2006.5 Controlled foreign corporations engaged in goods production, which includes manufacturing and construction, accounted for the largest percentage of total receipts (43 per-cent) for 2004. However, the percentage decreased to 39 percent for Tax Year 2006. Corporations in this industry accounted for 25.4 percent of total Subpart F income in 2004 and 16.0 percent in 2006. Although corporations engaged in the fi nance, in-surance, real estate, and rental and leasing industry accounted for a relatively small amount of total receipts (9.4 percent in 2004 and 10.7 percent in 2006), they accounted for the largest percentage of Subpart F income, having 28 percent of the total for Tax Year 2004 and 33 percent for Tax Year 2006. This outcome can be attributed to the fact that a large amount of this industry’s total receipts is made up of interest and dividend income.
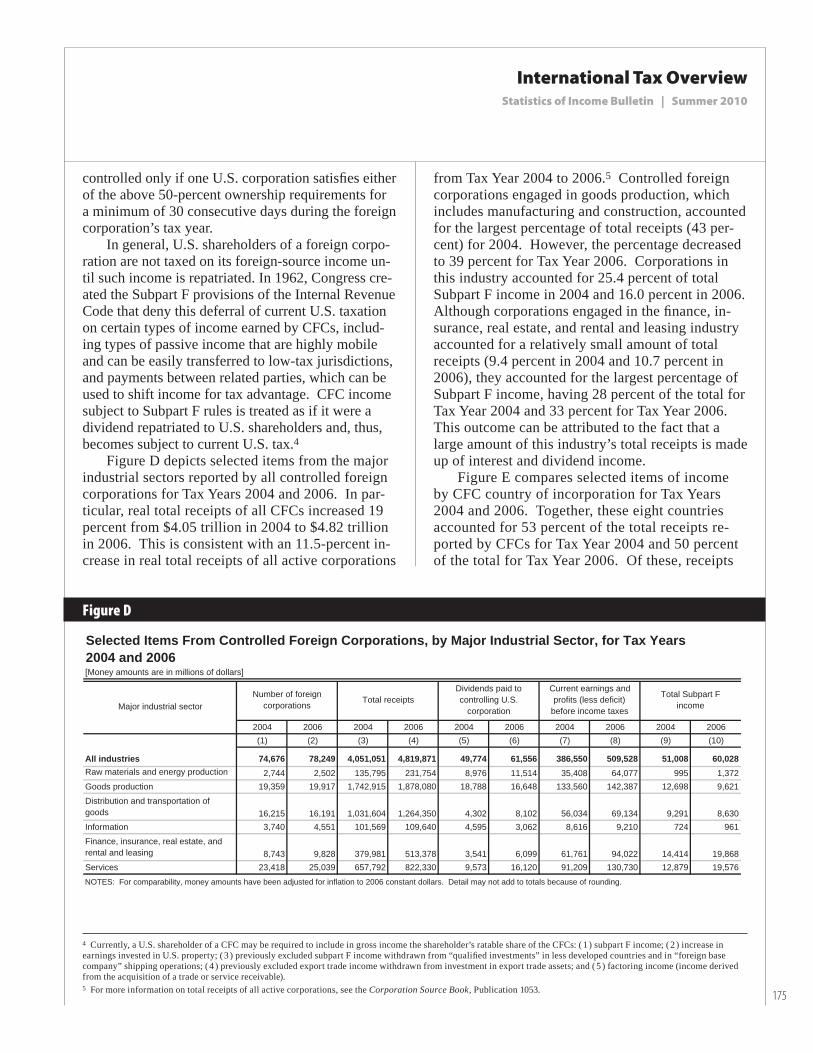
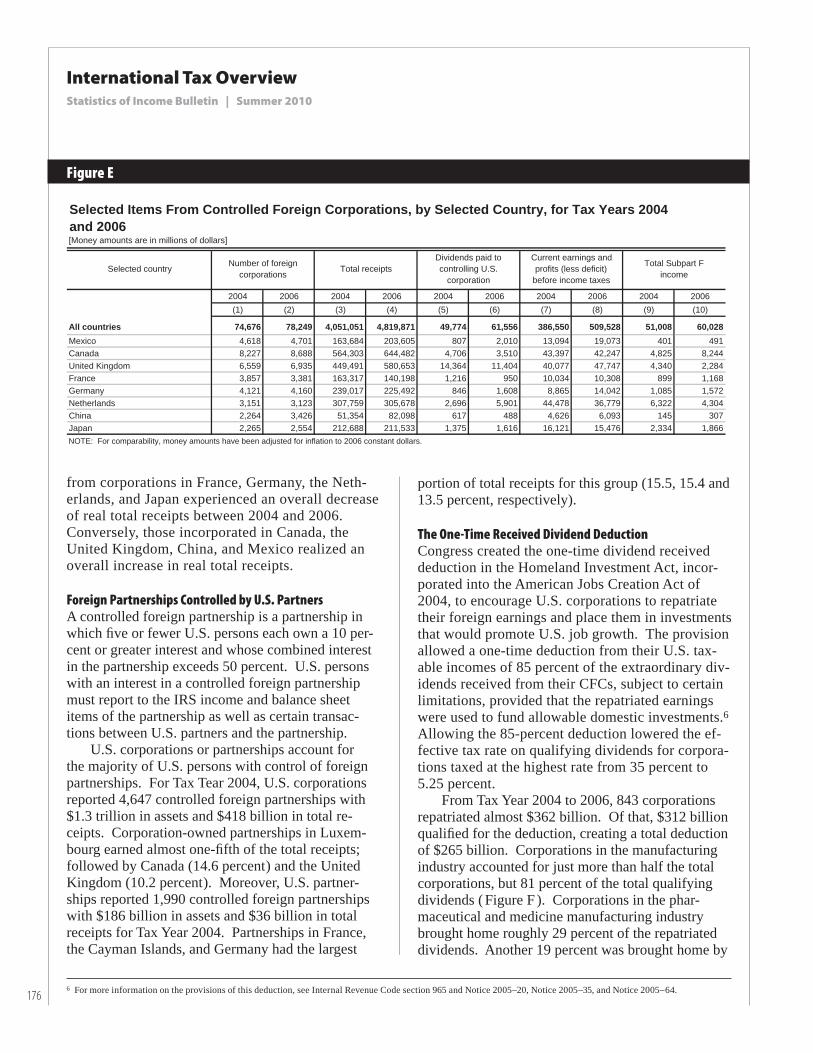
Figure E compares selected items of income by CFC country of incorporation for Tax Years 2004 and 2006. Together, these eight countries accounted for 53 percent of the total receipts re-ported by CFCs for Tax Year 2004 and 50 percent of the total for Tax Year 2006. Of these, receipts
Figure D
2004 2006 2004 2006 2004 2006 2004 2006 2004 2006(1) (2) (3) (4) (5) (6) (7) (8) (9) (10)
All industries 74,676 78,249 4,051,051 4,819,871 49,774 61,556 386,550 509,528 51,008 60,028Raw materials and energy production 2,744 2,502 135,795 231,754 8,976 11,514 35,408 64,077 995 1,372Goods production 19,359 19,917 1,742,915 1,878,080 18,788 16,648 133,560 142,387 12,698 9,621
Distribution and transportation of goods 16,215 16,191 1,031,604 1,264,350 4,302 8,102 56,034 69,134 9,291 8,630Information 3,740 4,551 101,569 109,640 4,595 3,062 8,616 9,210 724 961
Finance, insurance, real estate, and rental and leasing 8,743 9,828 379,981 513,378 3,541 6,099 61,761 94,022 14,414 19,868Services 23,418 25,039 657,792 822,330 9,573 16,120 91,209 130,730 12,879 19,576
[Money amounts are in millions of dollars]
NOTES: For comparability, money amounts have been adjusted for inflation to 2006 constant dollars. Detail may not add to totals because of rounding.
Selected Items From Controlled Foreign Corporations, by Major Industrial Sector, for Tax Years 2004 and 2006
Number of foreigncorporations
Total receiptsDividends paid to controlling U.S.
corporation
Current earnings andprofits (less deficit)
before income taxes
Total Subpart FincomeMajor industrial sector
4 Currently, a U.S. shareholder of a CFC may be required to include in gross income the shareholder’s ratable share of the CFCs: ( 1 ) subpart F income; ( 2 ) increase in earnings invested in U.S. property; ( 3 ) previously excluded subpart F income withdrawn from “qualifi ed investments” in less developed countries and in “foreign base company” shipping operations; ( 4 ) previously excluded export trade income withdrawn from investment in export trade assets; and ( 5 ) factoring income (income derived from the acquisition of a trade or service receivable).5 For more information on total receipts of all active corporations, see the Corporation Source Book, Publication 1053.
International Tax OverviewStatistics of Income Bulletin | Summer 2010
176
from corporations in France, Germany, the Neth-erlands, and Japan experienced an overall decrease of real total receipts between 2004 and 2006. Conversely, those incorporated in Canada, the United Kingdom, China, and Mexico realized an overall increase in real total receipts.
Foreign Partnerships Controlled by U.S. Partners
A controlled foreign partnership is a partnership in which fi ve or fewer U.S. persons each own a 10 per-cent or greater interest and whose combined interest in the partnership exceeds 50 percent. U.S. persons with an interest in a controlled foreign partnership must report to the IRS income and balance sheet items of the partnership as well as certain transac-tions between U.S. partners and the partnership.
U.S. corporations or partnerships account for the majority of U.S. persons with control of foreign partnerships. For Tax Tear 2004, U.S. corporations reported 4,647 controlled foreign partnerships with $1.3 trillion in assets and $418 billion in total re-ceipts. Corporation-owned partnerships in Luxem-bourg earned almost one-fi fth of the total receipts; followed by Canada (14.6 percent ) and the United Kingdom (10.2 percent ). Moreover, U.S. partner-ships reported 1,990 controlled foreign partnerships with $186 billion in assets and $36 billion in total receipts for Tax Year 2004. Partnerships in France, the Cayman Islands, and Germany had the largest
portion of total receipts for this group (15.5, 15.4 and 13.5 percent, respectively).
The One-Time Received Dividend Deduction
Congress created the one-time dividend received deduction in the Homeland Investment Act, incor-porated into the American Jobs Creation Act of 2004, to encourage U.S. corporations to repatriate their foreign earnings and place them in investments that would promote U.S. job growth. The provision allowed a one-time deduction from their U.S. tax-able incomes of 85 percent of the extraordinary div-idends received from their CFCs, subject to certain limitations, provided that the repatriated earnings were used to fund allowable domestic investments.6 Allowing the 85-percent deduction lowered the ef-fective tax rate on qualifying dividends for corpora-tions taxed at the highest rate from 35 percent to 5.25 percent.
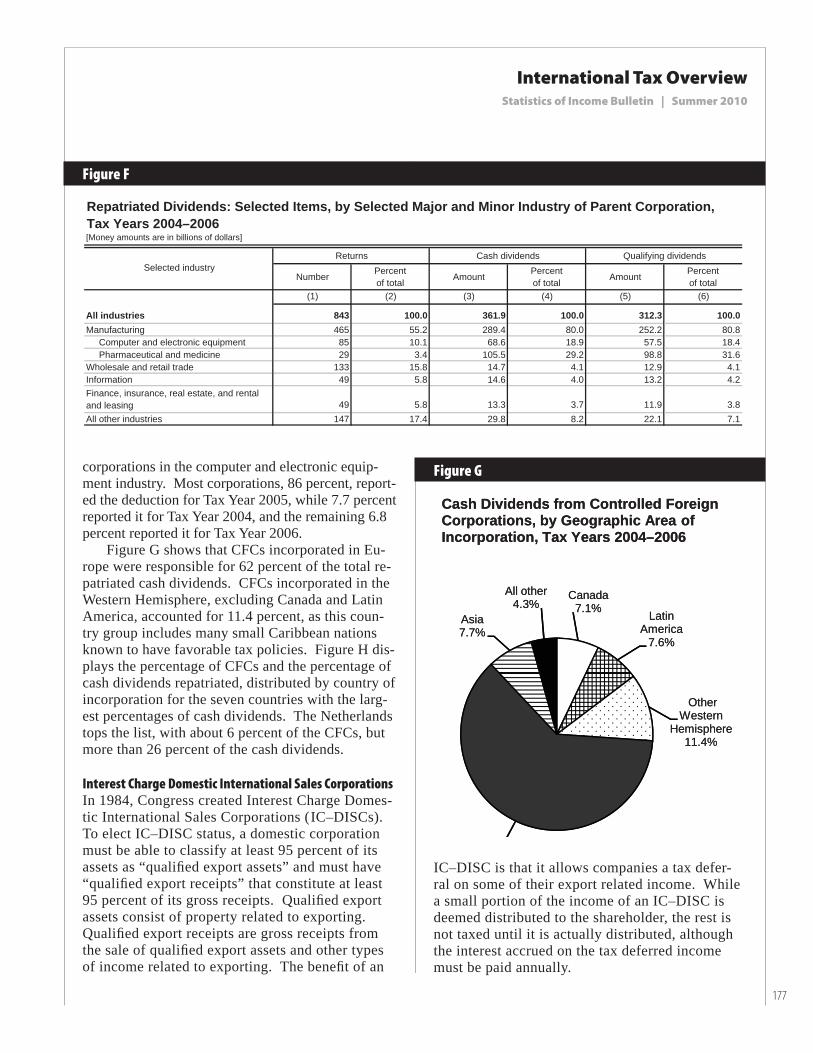
From Tax Year 2004 to 2006, 843 corporations repatriated almost $362 billion. Of that, $312 billion qualifi ed for the deduction, creating a total deduction of $265 billion. Corporations in the manufacturing industry accounted for just more than half the total corporations, but 81 percent of the total qualifying dividends ( Figure F ). Corporations in the phar-maceutical and medicine manufacturing industry brought home roughly 29 percent of the repatriated dividends. Another 19 percent was brought home by
Figure E
2004 2006 2004 2006 2004 2006 2004 2006 2004 2006(1) (2) (3) (4) (5) (6) (7) (8) (9) (10)
All countries 74,676 78,249 4,051,051 4,819,871 49,774 61,556 386,550 509,528 51,008 60,028Mexico 4,618 4,701 163,684 203,605 807 2,010 13,094 19,073 401 491Canada 8,227 8,688 564,303 644,482 4,706 3,510 43,397 42,247 4,825 8,244United Kingdom 6,559 6,935 449,491 580,653 14,364 11,404 40,077 47,747 4,340 2,284France 3,857 3,381 163,317 140,198 1,216 950 10,034 10,308 899 1,168Germany 4,121 4,160 239,017 225,492 846 1,608 8,865 14,042 1,085 1,572Netherlands 3,151 3,123 307,759 305,678 2,696 5,901 44,478 36,779 6,322 4,304China 2,264 3,426 51,354 82,098 617 488 4,626 6,093 145 307Japan 2,265 2,554 212,688 211,533 1,375 1,616 16,121 15,476 2,334 1,866
Selected country
NOTE: For comparability, money amounts have been adjusted for inflation to 2006 constant dollars.
Selected Items From Controlled Foreign Corporations, by Selected Country, for Tax Years 2004and 2006 [Money amounts are in millions of dollars]
Number of foreigncorporations
Total receiptsDividends paid to controlling U.S.
corporation
Current earnings andprofits (less deficit)
before income taxes
Total Subpart Fincome
6 For more information on the provisions of this deduction, see Internal Revenue Code section 965 and Notice 2005–20, Notice 2005–35, and Notice 2005–64.
International Tax OverviewStatistics of Income Bulletin | Summer 2010
177
corporations in the computer and electronic equip-ment industry. Most corporations, 86 percent, report-ed the deduction for Tax Year 2005, while 7.7 percent reported it for Tax Year 2004, and the remaining 6.8 percent reported it for Tax Year 2006.
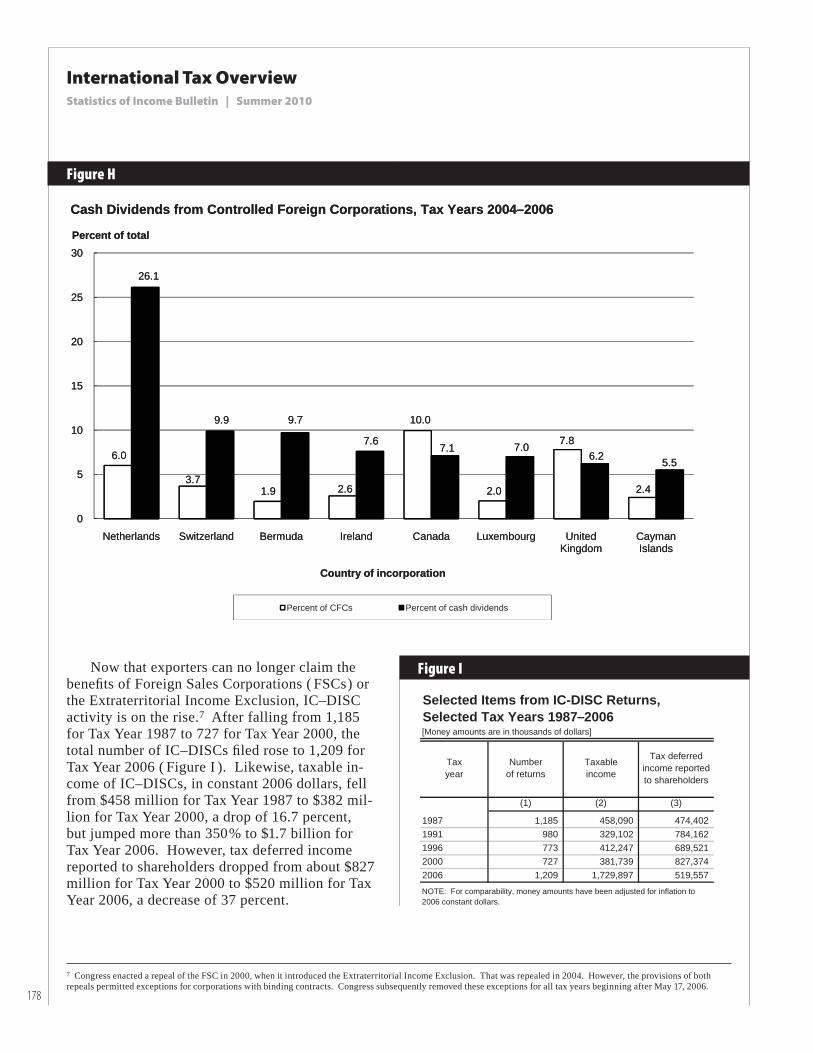
Figure G shows that CFCs incorporated in Eu-rope were responsible for 62 percent of the total re-patriated cash dividends. CFCs incorporated in the Western Hemisphere, excluding Canada and Latin America, accounted for 11.4 percent, as this coun-try group includes many small Caribbean nations known to have favorable tax policies. Figure H dis-plays the percentage of CFCs and the percentage of cash dividends repatriated, distributed by country of incorporation for the seven countries with the larg-est percentages of cash dividends. The Netherlands tops the list, with about 6 percent of the CFCs, but more than 26 percent of the cash dividends.
Interest Charge Domestic International Sales Corporations
In 1984, Congress created Interest Charge Domes-tic International Sales Corporations ( IC–DISCs). To elect IC–DISC status, a domestic corporation must be able to classify at least 95 percent of its assets as “qualifi ed export assets” and must have “qualifi ed export receipts” that constitute at least 95 percent of its gross receipts. Qualifi ed export assets consist of property related to exporting. Qualifi ed export receipts are gross receipts from the sale of qualifi ed export assets and other types of income related to exporting. The benefi t of an
Figure F
Number Percentof total Amount Percent
of total Amount Percentof total
(1) (2) (3) (4) (5) (6)
All industries 843 100.0 361.9 100.0 312.3 100.0Manufacturing 465 55.2 289.4 80.0 252.2 80.8 Computer and electronic equipment 85 10.1 68.6 18.9 57.5 18.4 Pharmaceutical and medicine 29 3.4 105.5 29.2 98.8 31.6Wholesale and retail trade 133 15.8 14.7 4.1 12.9 4.1Information 49 5.8 14.6 4.0 13.2 4.2Finance, insurance, real estate, and rentaland leasing 49 5.8 13.3 3.7 11.9 3.8All other industries 147 17.4 29.8 8.2 22.1 7.1
Repatriated Dividends: Selected Items, by Selected Major and Minor Industry of Parent Corporation, Tax Years 2004–2006
Returns Cash dividends Qualifying dividends
[Money amounts are in billions of dollars]
Selected industry
Figure G
IC–DISC is that it allows companies a tax defer-ral on some of their export related income. While a small portion of the income of an IC–DISC is deemed distributed to the shareholder, the rest is not taxed until it is actually distributed, although the interest accrued on the tax deferred income must be paid annually.
Canada7.1% Latin
America7.6%
Other Western
Hemisphere11.4%
E
Asia7.7%
All other4.3%
Cash Dividends from Controlled Foreign Corporations, by Geographic Area of Incorporation, Tax Years 2004–2006
Canada7.1% Latin
America7.6%
Other Western
Hemisphere11.4%
E
Asia7.7%
All other4.3%
Cash Dividends from Controlled Foreign Corporations, by Geographic Area of Incorporation, Tax Years 2004–2006
International Tax OverviewStatistics of Income Bulletin | Summer 2010
178
6.0
3.71.9 2.6
10.0
2.0
7.8
2.4
26.1
9.9 9.7
7.67.1 7.0
6.2 5.5
0
5
10
15
20
25
30
Netherlands Switzerland Bermuda Ireland Canada Luxembourg United Kingdom
Cayman Islands
Percent of total
Country of incorporation
Percent of CFCs Percent of cash dividends
Cash Dividends from Controlled Foreign Corporations, Tax Years 2004–2006
Figure H
Now that exporters can no longer claim the benefi ts of Foreign Sales Corporations ( FSCs ) or the Extraterritorial Income Exclusion, IC–DISC activity is on the rise.7 After falling from 1,185 for Tax Year 1987 to 727 for Tax Year 2000, the total number of IC–DISCs fi led rose to 1,209 for Tax Year 2006 ( Figure I ). Likewise, taxable in-come of IC–DISCs, in constant 2006 dollars, fell from $458 million for Tax Year 1987 to $382 mil-lion for Tax Year 2000, a drop of 16.7 percent, but jumped more than 350 % to $1.7 billion for Tax Year 2006. However, tax deferred income reported to shareholders dropped from about $827 million for Tax Year 2000 to $520 million for Tax Year 2006, a decrease of 37 percent.
Figure I
[Money amounts are in thousands of dollars]
(1) (2) (3)
1987 1,185 458,090 474,402 1991 980 329,102 784,162 1996 773 412,247 689,521 2000 727 381,739 827,374 2006 1,209 1,729,897 519,557
Tax deferred income reported to shareholders
Taxableincome
Numberof returns
Taxyear
NOTE: For comparability, money amounts have been adjusted for inflation to 2006 constant dollars.
Selected Items from IC-DISC Returns, Selected Tax Years 1987–2006
7 Congress enacted a repeal of the FSC in 2000, when it introduced the Extraterritorial Income Exclusion. That was repealed in 2004. However, the provisions of both repeals permitted exceptions for corporations with binding contracts. Congress subsequently removed these exceptions for all tax years beginning after May 17, 2006.
International Tax OverviewStatistics of Income Bulletin | Summer 2010
179
6
7
Billions of dollars
Foreign Earned Income, by Selected Countries, 2001 and 2006
3
4
5
0
1
2
United Kingdom Canada Japan Hong Kong Iraq [1]
Country
2001 2006
[1] No data was reported for Iraq in 2001.
NOTE: For comparability, money amounts adjusted for inflation to 2006 constant dollars.
Individual Foreign Tax Credit and Foreign Earned Income
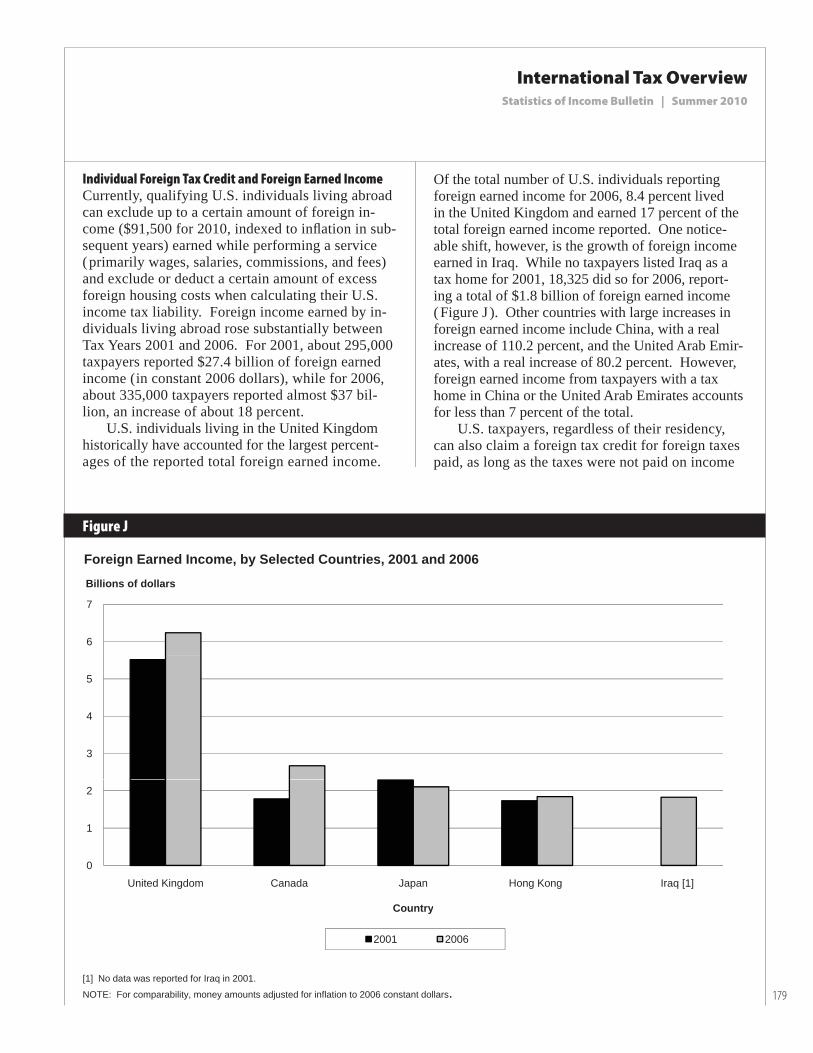
Currently, qualifying U.S. individuals living abroad can exclude up to a certain amount of foreign in-come ($91,500 for 2010, indexed to infl ation in sub-sequent years) earned while performing a service ( primarily wages, salaries, commissions, and fees) and exclude or deduct a certain amount of excess foreign housing costs when calculating their U.S. income tax liability. Foreign income earned by in-dividuals living abroad rose substantially between Tax Years 2001 and 2006. For 2001, about 295,000 taxpayers reported $27.4 billion of foreign earned income ( in constant 2006 dollars), while for 2006, about 335,000 taxpayers reported almost $37 bil-lion, an increase of about 18 percent.
U.S. individuals living in the United Kingdom historically have accounted for the largest percent-ages of the reported total foreign earned income.
Figure J
Of the total number of U.S. individuals reporting foreign earned income for 2006, 8.4 percent lived in the United Kingdom and earned 17 percent of the total foreign earned income reported. One notice-able shift, however, is the growth of foreign income earned in Iraq. While no taxpayers listed Iraq as a tax home for 2001, 18,325 did so for 2006, report-ing a total of $1.8 billion of foreign earned income ( Figure J ). Other countries with large increases in foreign earned income include China, with a real increase of 110.2 percent, and the United Arab Emir-ates, with a real increase of 80.2 percent. However, foreign earned income from taxpayers with a tax home in China or the United Arab Emirates accounts for less than 7 percent of the total.
U.S. taxpayers, regardless of their residency, can also claim a foreign tax credit for foreign taxes paid, as long as the taxes were not paid on income
International Tax OverviewStatistics of Income Bulletin | Summer 2010
180
excluded under the foreign earned income provi-sions described above. Also, like the corporate foreign tax credit, this credit is subject to a limita-tion computed separately for different categories of income.
In recent years, foreign-source income for in-dividuals has outpaced the growth of worldwide income. Infl ation-adjusted foreign-source gross income reported by all U.S. individuals on Form 1116, used to compute the foreign tax credit, rose from $64 billion for 2001 to $120 billion for 2006 (an 86.6 percent increase), while real worldwide income grew just 14.3 percent during the same period. As expected, the United Kingdom and Canada together accounted for the largest percent-age of foreign-source gross income for 2006, 10 percent and 8 percent, respectively. The amount of real foreign tax credit claimed by individuals, not surprisingly, also grew substantially. For 2006, U.S individual taxpayers paid $13.9 billion in foreign taxes and were able to credit nearly $11.0 billion of that amount against their U.S. tax liability, a real in-crease of 53.9 percent from the amount claimed for Tax Year 2001. Nevertheless, this credit remained a small fraction, just 1 percent, of the total U.S. in-come tax before credits for 2006.
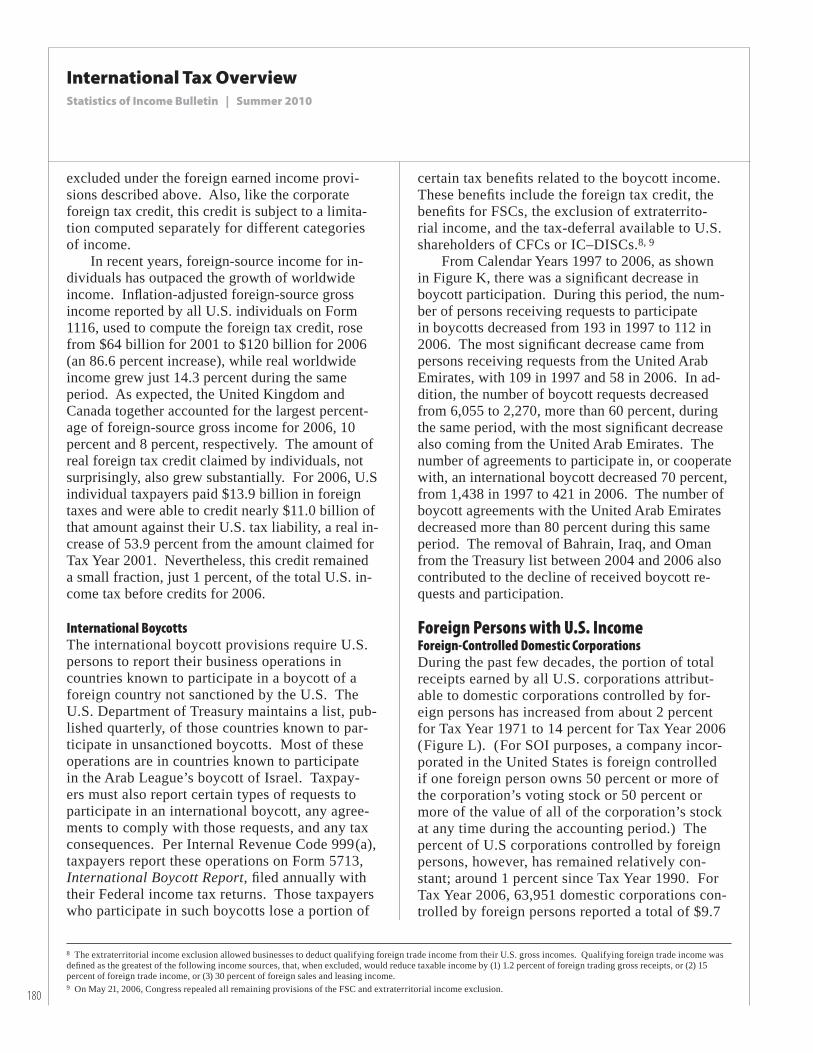
International Boycotts
The international boycott provisions require U.S. persons to report their business operations in countries known to participate in a boycott of a foreign country not sanctioned by the U.S. The U.S. Department of Treasury maintains a list, pub-lished quarterly, of those countries known to par-ticipate in unsanctioned boycotts. Most of these operations are in countries known to participate in the Arab League’s boycott of Israel. Taxpay-ers must also report certain types of requests to participate in an international boycott, any agree-ments to comply with those requests, and any tax consequences. Per Internal Revenue Code 999 (a), taxpayers report these operations on Form 5713, International Boycott Report, fi led annually with their Federal income tax returns. Those taxpayers who participate in such boycotts lose a portion of
certain tax benefi ts related to the boycott income. These benefi ts include the foreign tax credit, the benefi ts for FSCs, the exclusion of extraterrito-rial income, and the tax-deferral available to U.S. shareholders of CFCs or IC–DISCs.8, 9
From Calendar Years 1997 to 2006, as shown in Figure K, there was a signifi cant decrease in boycott participation. During this period, the num-ber of persons receiving requests to participate in boycotts decreased from 193 in 1997 to 112 in 2006. The most signifi cant decrease came from persons receiving requests from the United Arab Emirates, with 109 in 1997 and 58 in 2006. In ad-dition, the number of boycott requests decreased from 6,055 to 2,270, more than 60 percent, during the same period, with the most signifi cant decrease also coming from the United Arab Emirates. The number of agreements to participate in, or cooperate with, an international boycott decreased 70 percent, from 1,438 in 1997 to 421 in 2006. The number of boycott agreements with the United Arab Emirates decreased more than 80 percent during this same period. The removal of Bahrain, Iraq, and Oman from the Treasury list between 2004 and 2006 also contributed to the decline of received boycott re-quests and participation.
Foreign Persons with U.S. IncomeForeign-Controlled Domestic Corporations
During the past few decades, the portion of total receipts earned by all U.S. corporations attribut-able to domestic corporations controlled by for-eign persons has increased from about 2 percent for Tax Year 1971 to 14 percent for Tax Year 2006 ( Figure L). ( For SOI purposes, a company incor-porated in the United States is foreign controlled if one foreign person owns 50 percent or more of the corporation’s voting stock or 50 percent or more of the value of all of the corporation’s stock at any time during the accounting period.) The percent of U.S corporations controlled by foreign persons, however, has remained relatively con-stant; around 1 percent since Tax Year 1990. For Tax Year 2006, 63,951 domestic corporations con-trolled by foreign persons reported a total of $9.7
8 The extraterritorial income exclusion allowed businesses to deduct qualifying foreign trade income from their U.S. gross incomes. Qualifying foreign trade income was defi ned as the greatest of the following income sources, that, when excluded, would reduce taxable income by (1) 1.2 percent of foreign trading gross receipts, or (2) 15 percent of foreign trade income, or (3) 30 percent of foreign sales and leasing income.9 On May 21, 2006, Congress repealed all remaining provisions of the FSC and extraterritorial income exclusion.
International Tax OverviewStatistics of Income Bulletin | Summer 2010
181
35
Trillions of dollars
Total Receipts of Domestic Corporations Controlled by Foreign Persons and Total Receipts of All Corporations for Selected Tax Years, 1971–2006
15
20
25
30
0
5
10
1971 1990 1997 2000 2003 2006
Tax year
All corporations Domestic corporations controlled by foreign persons
NOTE: For comparability, money amounts have been adjusted for inflation to 2006 constant dollars.
Figure L
Figure K
1997 2002 2006 1997 2002 2006 1997 2002 2006(1) (2) (3) (4) (5) (6) (7) (8) (9)
All countries 193 116 112 6,055 3,421 2,270 1,438 489 421 Treasury-listed countries 180 107 90 5,435 2,894 1,866 1,396 480 381 Bahrain 44 26 N/A 536 101 N/A 37 3 N/A Iraq N/A 10 N/A N/A 15 N/A N/A 3 N/A Kuwait 68 39 31 457 242 226 162 77 48 Lebanon 47 30 29 237 140 98 109 49 31 Libya 27 16 30 289 102 210 141 19 25 Oman 47 26 N/A 795 138 N/A 118 9 N/A Qatar 44 25 22 505 528 213 71 43 4 Saudi Arabia 56 38 23 876 295 193 290 72 107 Syria 57 32 19 386 566 201 23 25 65 United Arab Emirates 109 65 58 1,145 628 464 408 154 81 Yemen, Republic of 20 16 14 183 139 261 37 26 20 Non-listed countries 60 24 54 620 527 404 42 9 40
[1] Data in these columns do not add to totals because persons could have received requests from, or made agreements with, more than one country.
Country
Number of Persons Receiving International Boycott Requests and Agreeing to Participate for Selected Calendar Years, 1997–2006
Number of personsreceiving requests [1]
Number of boycottrequests received [1]
Number of boycott agreements [1]
International Tax OverviewStatistics of Income Bulletin | Summer 2010
182
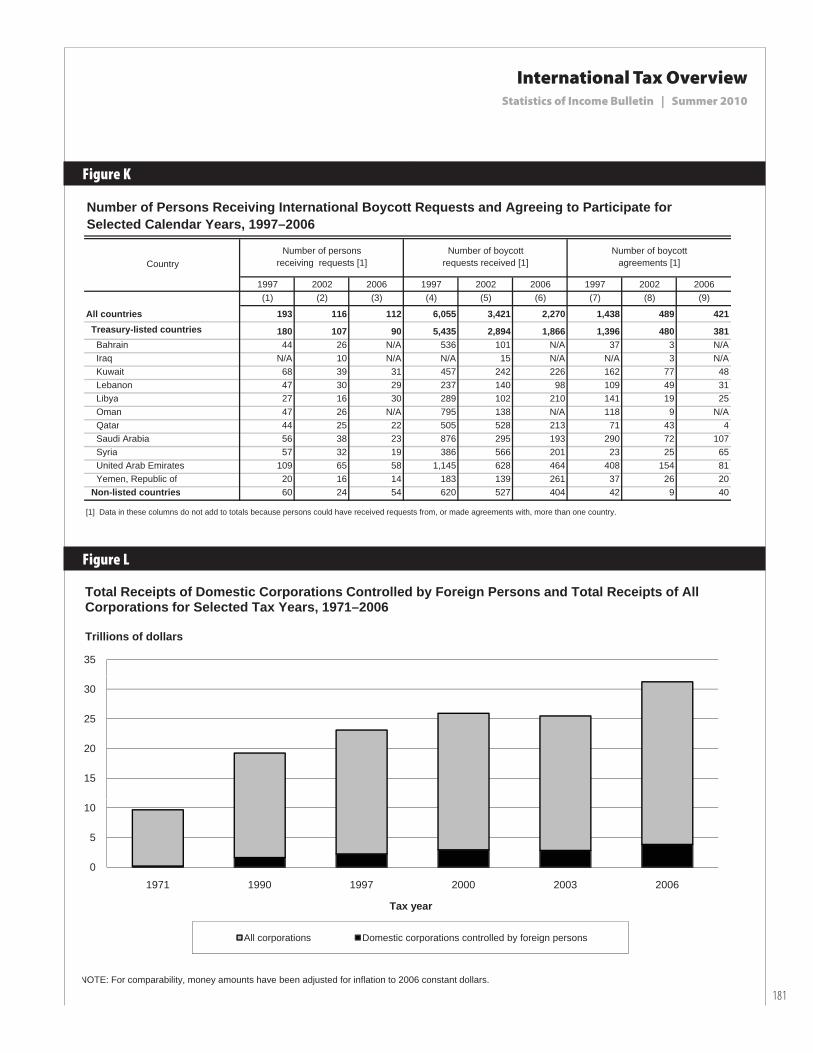
trillion in total assets, $3.8 trillion in receipts, and $172.6 billion in net income ( less defi cit ). Cor-porations engaged in manufacturing generated 46 percent of the total receipts of these companies, compared to 28 percent of the receipts from all domestic corporations.
Most of the receipts earned by foreign-con-trolled corporations were generated by corpora-tions controlled by foreign persons from Japan, the United Kingdom, Germany, the Netherlands, Canada, and France ( Figure M ). In recent years, the percentage of total receipts from corporations controlled by persons from the United Kingdom has risen, climbing from 14 percent for Tax Year 2000 to more than 23 percent for Tax Year 2006.
Foreign Corporations with U.S. Business Operations
The United States taxes certain income earned by U.S. branches of foreign corporations. A branch is an affi liate operating in the U.S. that is legally part of the foreign fi rm and, thus, not a separate U.S. en-tity. Income earned by these U.S. branches that is “effectively connected” with a U.S trade or business, such as rents for the use of intangible property for which income is attributable to a fi xed place of busi-ness within the United States, is taxed at regular U.S. corporate tax rates.10 Certain gains, profi ts, and other income that are not effectively connected are taxed at a fl at 30-percent rate, although this rate may be reduced or eliminated pursuant to a bilateral income tax treaty.11
30
Percent of total receipts
Share of Total Receipts of Domestic Corporations Controlled by Foreign Persons, by Country, Tax Years 2000 and 2006
15
20
25
0
5
10
Japan United Kingdom Germany Netherlands Canada France Otherp g y
Country
Tax Year 2000 Tax Year 2006
Figure M
10 For a description of effectively connected income, see Internal Revenue Code sections 864 and 897, as well as the related Internal Revenue Regulations.11 Tax treaties generally aim to reduce double taxation and improve trade effi ciency.
International Tax OverviewStatistics of Income Bulletin | Summer 2010
183
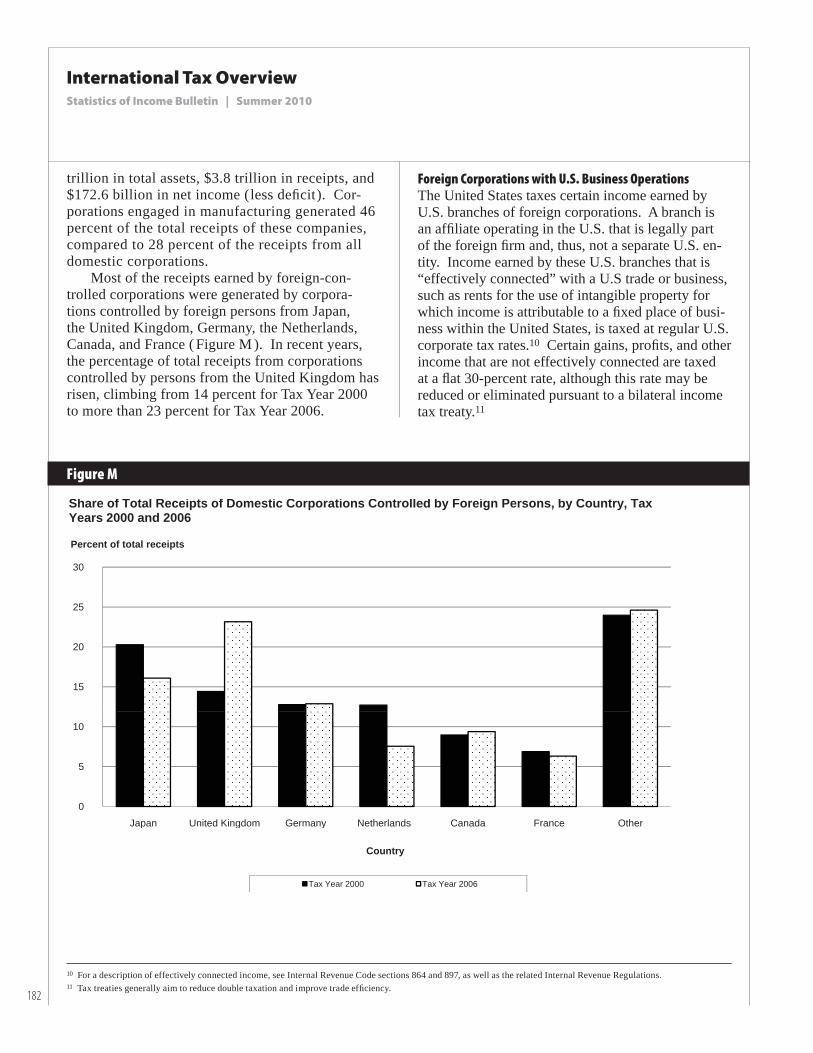
The number of returns and the amount of total receipts from foreign corporations with effectively connected U.S. income has grown substantially in real terms during the last decade, although the total receipts from these corporations remains less than 1 percent of the total from all corporations ( Figure N ). For Tax Year 2006, there were 14,897 foreign cor-porations with effectively connected U.S. income, about 0.3 percent of all active corporations that fi led a U.S. tax return. These fi rms reported approximate-ly $248.8 billion in total receipts and $11.9 billion in income subject to U.S. tax. They paid a total of $3.3 billion in U.S. tax after credits.
Transactions Between Large Foreign-Owned Domestic
Corporations and Related Foreign Persons
The Tax Equity and Fiscal Responsibility Act of 1982 ( TEFRA) required domestic corporations in which 25 percent or more is owned by a foreign person, as well as foreign corporations engaged in a U.S. trade or business, to report transactions with related foreign persons on IRS Form 5472, which is fi led as an attachment to the corporation’s U.S. income tax return, Form 1120. For SOI purposes, a domestic corporation is foreign-owned if at least 25 percent of the total voting power of all classes of stock permitted to vote, or 25 percent of the total value of all classes of stock of the corporation, was owned, directly or indirectly, at any time in the tax year by a single foreign shareholder. SOI collects data on these transactions for foreign-controlled
domestic corporations with total receipts of $500 million or more. Forms 1120, however, with at least one Form 5472 attached that had been selected for previous SOI studies were also included in these statistics, even if the corporation fell below the $500-million receipts threshold in the current study year. Therefore, to diminish the effect of these cases on longitudinal trends, data presented in this section are averaged across reporting 1120 parent corporations.12
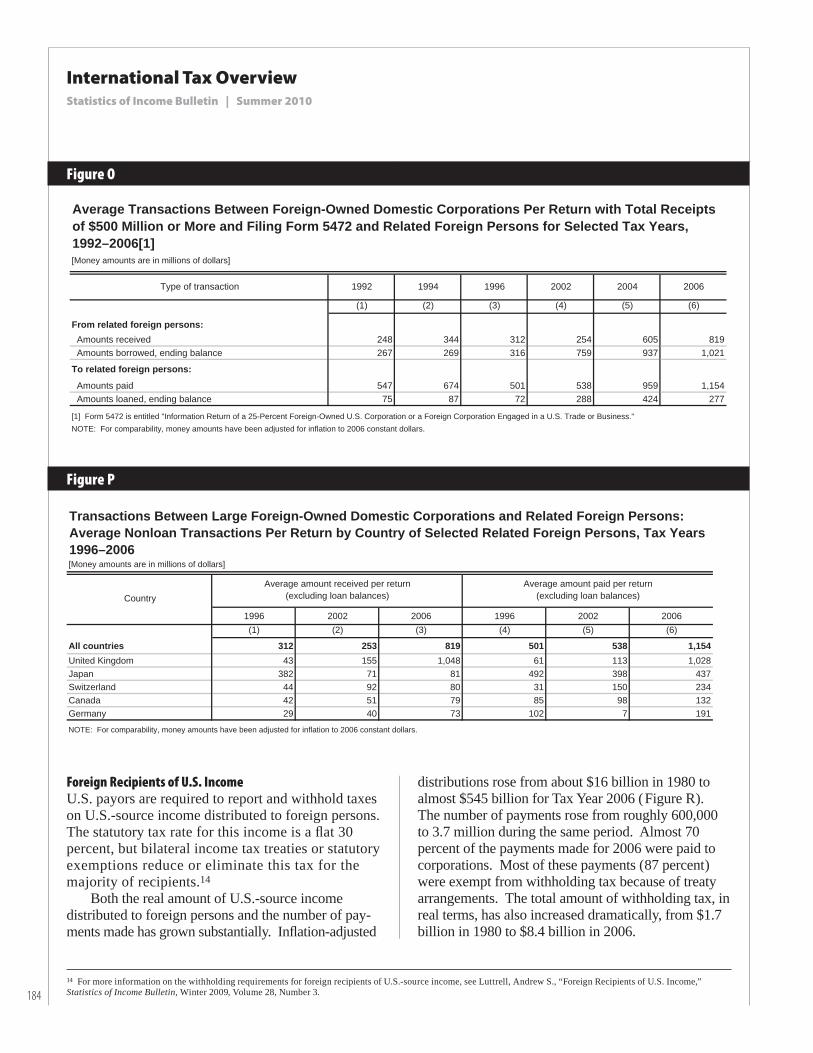
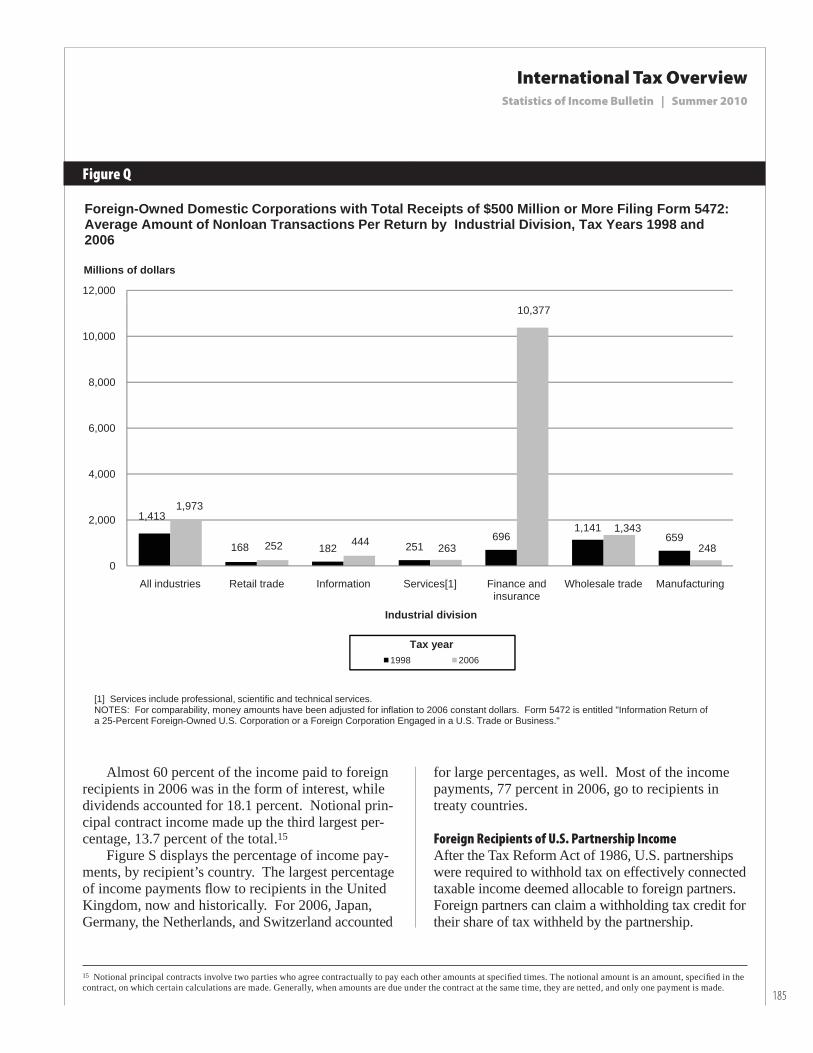
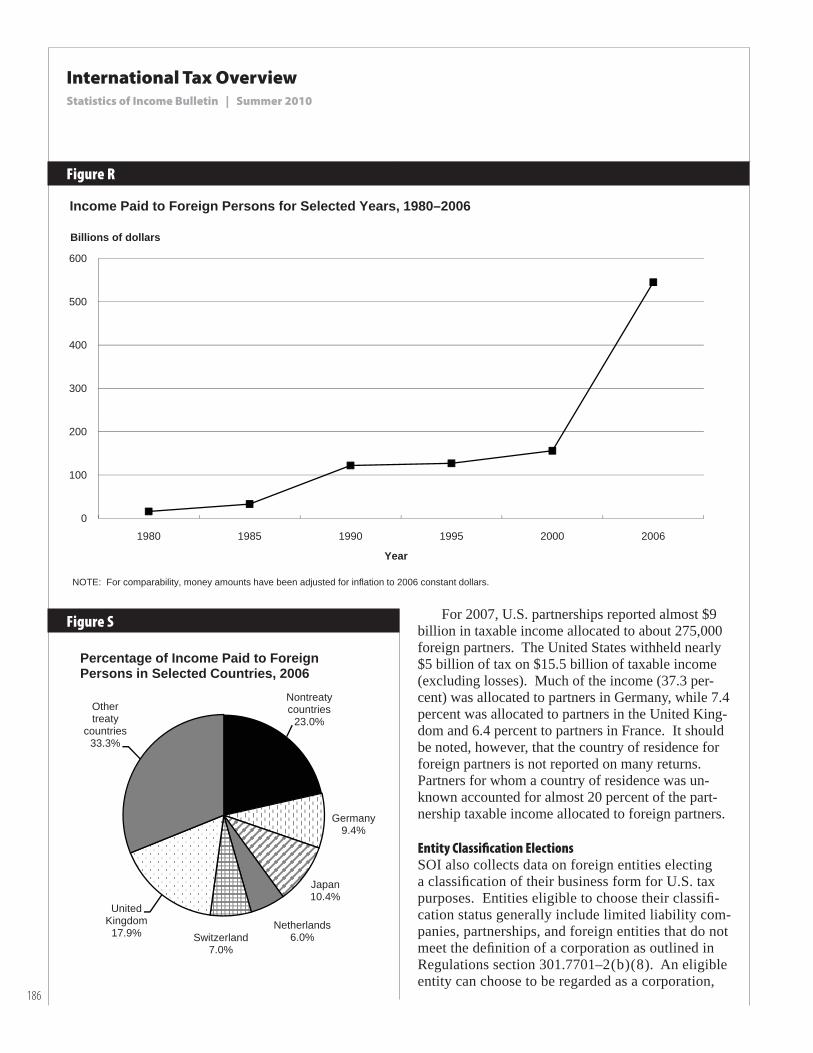
These large foreign-owned domestic corporations reported average nonloan transactions of $819 million per return for receipts from related foreign persons and average payments to related foreign persons of $1,154 million for Tax Year 2006 ( Figure O). In real terms, these amounts have risen by 163 percent and 87 percent per return, respectively, from Tax Year 1996 to 2006. More specifi cally, average nonloan transac-tions by both country and industry saw signifi cant increases, as well. Figure P demonstrates the variabil-ity in the makeup of the average amounts of nonloan transactions from related persons in selected countries from Tax Year 1996 to 2006. Domestic Corporations reporting nonloan transactions with related persons in the United Kingdom experienced an increase in the average amounts they received from Tax Year 1996 to 2006 ( from $43 million to $1,048 million ); the aver-age in 2006 was also signifi cantly larger than that for all other countries. For Tax Years 1996 and 2002, Jap-anese parties were paid the highest average amount of nonloan transactions from U.S. corporations transact-ing with them, $492 million and $398 million, respec-tively. However, related persons in the United King-dom were paid the highest average amount for 2006, an average of $1,028 million per return. As shown in Figure Q, domestic corporations in the fi nance and in-surance industry group were responsible for the largest share of nonloan transactions in Tax Year 2006, with an average of $10,377 million per return. The whole-sale trade industry claimed the second largest share, an average of $1,343 million per return for Tax Year 2006. While there was an overall increase in average nonloan transactions for most industries from Tax Year 1998 to 2006, Figure Q illustrates that the average value of nonloan transactions for the manufacturing industry decreased from $659 million to $248 million during that same period.13
Tax year1986 1996 2006(1) (2) (3)
Total returns 11,342 9,933 14,897Total receipts 80,246 121,314 248,839Percentage of total receipts from all corporations 0.5 0.5 0.9Income subject to tax 3,344 3,222 11,877Income tax after credits 1,048 1,173 3,294
Selected items
NOTE: For comparability, money amounts have been adjusted for inflation to 2006 constant dollars.
Foreign Corporations with U.S. Business Operations, Selected Tax Years, 1987–2006[All figures are estimates based on samples—money amounts in millions of dollars]
Figure N
12 For more information on sample selection, see Lowe, Mark R., “Transactions Between Large Foreign-Owned Domestic Corporations and Related Foreign Persons,” Statistics of Income Bulletin, Fall 2009, Volume 29, Number 2.13 Industry data for all major industrial sectors was not available for Tax Year 1996.
International Tax OverviewStatistics of Income Bulletin | Summer 2010
184
[Money amounts are in millions of dollars]
1996 2002 2006 1996 2002 2006(1) (2) (3) (4) (5) (6)
All countries 312 253 819 501 538 1,154United Kingdom 43 155 1,048 61 113 1,028Japan 382 71 81 492 398 437Switzerland 44 92 80 31 150 234Canada 42 51 79 85 98 132Germany 29 40 73 102 7 191
NOTE: For comparability, money amounts have been adjusted for inflation to 2006 constant dollars.
Average amount paid per return (excluding loan balances)
Average amount received per return (excluding loan balances)
Transactions Between Large Foreign-Owned Domestic Corporations and Related Foreign Persons:Average Nonloan Transactions Per Return by Country of Selected Related Foreign Persons, Tax Years 1996–2006
Country
[Money amounts are in millions of dollars]
Type of transaction 1992 1994 1996 2002 2004 2006
(1) (2) (3) (4) (5) (6)
From related foreign persons: Amounts received 248 344 312 254 605 819 Amounts borrowed, ending balance 267 269 316 759 937 1,021
To related foreign persons:
Amounts paid 547 674 501 538 959 1,154 Amounts loaned, ending balance 75 87 72 288 424 277
[1] Form 5472 is entitled "Information Return of a 25-Percent Foreign-Owned U.S. Corporation or a Foreign Corporation Engaged in a U.S. Trade or Business."NOTE: For comparability, money amounts have been adjusted for inflation to 2006 constant dollars.
Average Transactions Between Foreign-Owned Domestic Corporations Per Return with Total Receipts of $500 Million or More and Filing Form 5472 and Related Foreign Persons for Selected Tax Years, 1992–2006[1]
Figure P
Figure O
Foreign Recipients of U.S. Income
U.S. payors are required to report and withhold taxes on U.S.-source income distributed to foreign persons. The statutory tax rate for this income is a fl at 30 percent, but bilateral income tax treaties or statutory exemptions reduce or eliminate this tax for the majority of recipients.14
Both the real amount of U.S.-source income distributed to foreign persons and the number of pay-ments made has grown substantially. Infl ation-adjusted
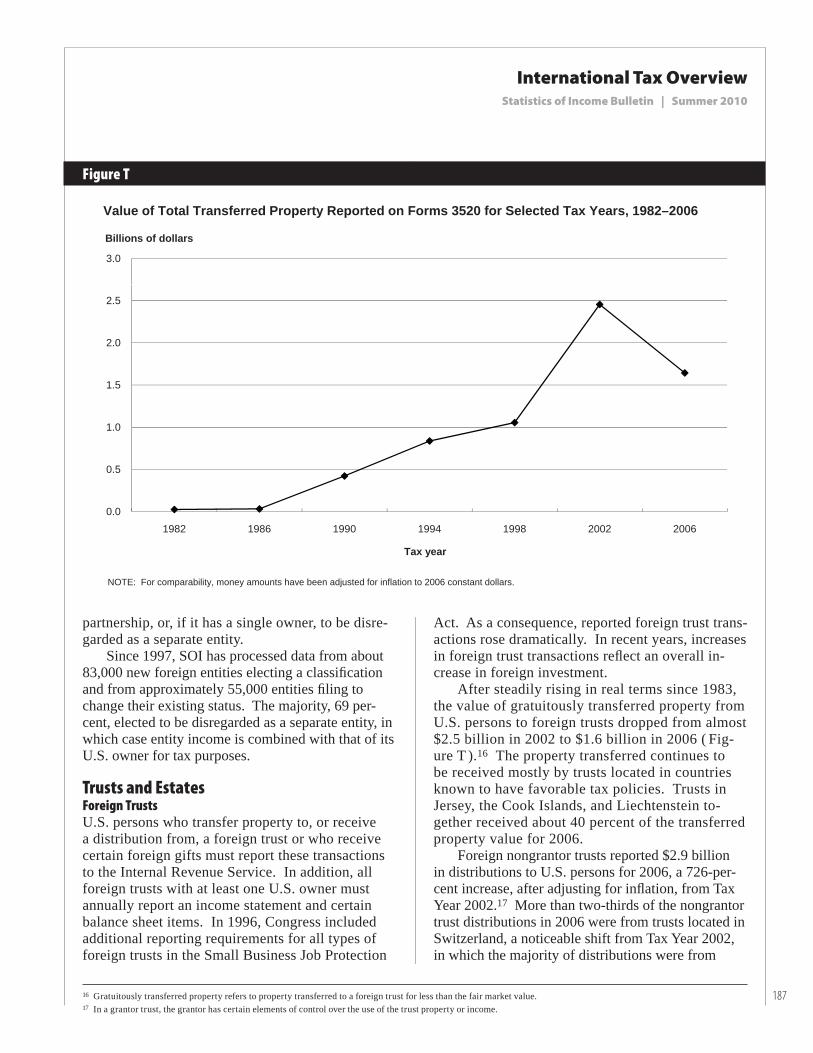
distributions rose from about $16 billion in 1980 to almost $545 billion for Tax Year 2006 ( Figure R ). The number of payments rose from roughly 600,000 to 3.7 million during the same period. Almost 70 percent of the payments made for 2006 were paid to corporations. Most of these payments ( 87 percent ) were exempt from withholding tax because of treaty arrangements. The total amount of withholding tax, in real terms, has also increased dramatically, from $1.7 billion in 1980 to $8.4 billion in 2006.
14 For more information on the withholding requirements for foreign recipients of U.S.-source income, see Luttrell, Andrew S., “Foreign Recipients of U.S. Income,” Statistics of Income Bulletin, Winter 2009, Volume 28, Number 3.
International Tax OverviewStatistics of Income Bulletin | Summer 2010
185
12,000
Foreign-Owned Domestic Corporations with Total Receipts of $500 Million or More Filing Form 5472: Average Amount of Nonloan Transactions Per Return by Industrial Division, Tax Years 1998 and 2006
Millions of dollars
10,377
6 000
8,000
10,000
1,413
168 182 251696
1,141659
1,973
252 444 263
1,343
248
2,000
4,000
6,000
0All industries Retail trade Information Services[1] Finance and
insuranceWholesale trade Manufacturing
1998 2006
Tax year
Industrial division
[1] Services include professional, scientific and technical services.NOTES: For comparability, money amounts have been adjusted for inflation to 2006 constant dollars. Form 5472 is entitled "Information Return of a 25-Percent Foreign-Owned U.S. Corporation or a Foreign Corporation Engaged in a U.S. Trade or Business."
Figure Q
Almost 60 percent of the income paid to foreign recipients in 2006 was in the form of interest, while dividends accounted for 18.1 percent. Notional prin-cipal contract income made up the third largest per-centage, 13.7 percent of the total.15
Figure S displays the percentage of income pay-ments, by recipient’s country. The largest percentage of income payments fl ow to recipients in the United Kingdom, now and historically. For 2006, Japan, Germany, the Netherlands, and Switzerland accounted
for large percentages, as well. Most of the income payments, 77 percent in 2006, go to recipients in treaty countries.
Foreign Recipients of U.S. Partnership Income
After the Tax Reform Act of 1986, U.S. partnerships were required to withhold tax on effectively connected taxable income deemed allocable to foreign partners. Foreign partners can claim a withholding tax credit for their share of tax withheld by the partnership.
15 Notional principal contracts involve two parties who agree contractually to pay each other amounts at specifi ed times. The notional amount is an amount, specifi ed in the contract, on which certain calculations are made. Generally, when amounts are due under the contract at the same time, they are netted, and only one payment is made.
International Tax OverviewStatistics of Income Bulletin | Summer 2010
186
Nontreaty countries
23.0%Othertreaty
countries33.3%
Percentage of Income Paid to Foreign Persons in Selected Countries, 2006
Germany 9.4%
JJapan10.4%
Switzerland7.0%
UnitedKingdom
17.9%Netherlands
6.0%
500
600
Billions of dollars
Income Paid to Foreign Persons for Selected Years, 1980–2006
300
400
500
0
100
200
1980 1985 1990 1995 2000 2006
Year
NOTE: For comparability, money amounts have been adjusted for inflation to 2006 constant dollars.
Figure R
Figure SFor 2007, U.S. partnerships reported almost $9
billion in taxable income allocated to about 275,000 foreign partners. The United States withheld nearly $5 billion of tax on $15.5 billion of taxable income (excluding losses). Much of the income (37.3 per-cent) was allocated to partners in Germany, while 7.4 percent was allocated to partners in the United King-dom and 6.4 percent to partners in France. It should be noted, however, that the country of residence for foreign partners is not reported on many returns. Partners for whom a country of residence was un-known accounted for almost 20 percent of the part-nership taxable income allocated to foreign partners.
Entity Classifi cation Elections
SOI also collects data on foreign entities electing a classifi cation of their business form for U.S. tax purposes. Entities eligible to choose their classifi -cation status generally include limited liability com-panies, partnerships, and foreign entities that do not meet the defi nition of a corporation as outlined in Regulations section 301.7701–2 ( b ) ( 8 ). An eligible entity can choose to be regarded as a corporation,
International Tax OverviewStatistics of Income Bulletin | Summer 2010
187
partnership, or, if it has a single owner, to be disre-garded as a separate entity.
Since 1997, SOI has processed data from about 83,000 new foreign entities electing a classifi cation and from approximately 55,000 entities fi ling to change their existing status. The majority, 69 per-cent, elected to be disregarded as a separate entity, in which case entity income is combined with that of its U.S. owner for tax purposes.
Trusts and EstatesForeign Trusts
U.S. persons who transfer property to, or receive a distribution from, a foreign trust or who receive certain foreign gifts must report these transactions to the Internal Revenue Service. In addition, all foreign trusts with at least one U.S. owner must annually report an income statement and certain balance sheet items. In 1996, Congress included additional reporting requirements for all types of foreign trusts in the Small Business Job Protection
Act. As a consequence, reported foreign trust trans-actions rose dramatically. In recent years, increases in foreign trust transactions refl ect an overall in-crease in foreign investment.
After steadily rising in real terms since 1983, the value of gratuitously transferred property from U.S. persons to foreign trusts dropped from almost $2.5 billion in 2002 to $1.6 billion in 2006 ( Fig-ure T ).16 The property transferred continues to be received mostly by trusts located in countries known to have favorable tax policies. Trusts in Jersey, the Cook Islands, and Liechtenstein to-gether received about 40 percent of the transferred property value for 2006.
Foreign nongrantor trusts reported $2.9 billion in distributions to U.S. persons for 2006, a 726-per-cent increase, after adjusting for infl ation, from Tax Year 2002.17 More than two-thirds of the nongrantor trust distributions in 2006 were from trusts located in Switzerland, a noticeable shift from Tax Year 2002, in which the majority of distributions were from
Figure T
3.0
Billions of dollars
Value of Total Transferred Property Reported on Forms 3520 for Selected Tax Years, 1982–2006
1.5
2.0
2.5
0.0
0.5
1.0
1982 1986 1990 1994 1998 2002 20061982 1986 1990 1994 1998 2002 2006
Tax year
NOTE: For comparability, money amounts have been adjusted for inflation to 2006 constant dollars.
16 Gratuitously transferred property refers to property transferred to a foreign trust for less than the fair market value.17 In a grantor trust, the grantor has certain elements of control over the use of the trust property or income.
International Tax OverviewStatistics of Income Bulletin | Summer 2010
188
trusts in the Cayman Islands ( 22 percent ), Jersey (17 percent), and the Bahamas (17 percent ).
The number of foreign trusts with at least one U.S. owner has risen steadily, from 291 for 1990 to 2,550 for 2002 and 3,819 for 2006. Assets for those trusts almost doubled in real terms from 2002 to 2006, to almost $32 billion, while real net income jumped from $401 million to $1.9 billion, an aston-ishing 383 percent, during the same period. Trusts in the Cayman Islands accounted for one-third of the net income for 2006.
Nonresident Alien Estates
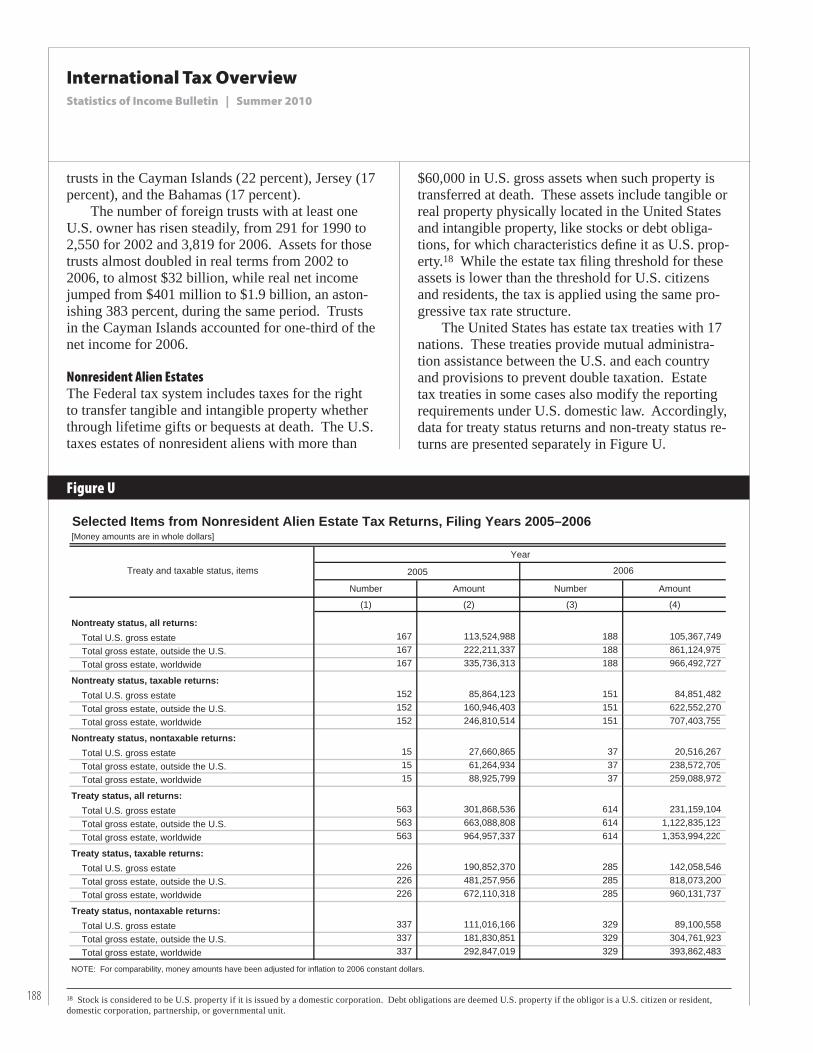
The Federal tax system includes taxes for the right to transfer tangible and intangible property whether through lifetime gifts or bequests at death. The U.S. taxes estates of nonresident aliens with more than
$60,000 in U.S. gross assets when such property is transferred at death. These assets include tangible or real property physically located in the United States and intangible property, like stocks or debt obliga-tions, for which characteristics defi ne it as U.S. prop-erty.18 While the estate tax fi ling threshold for these assets is lower than the threshold for U.S. citizens and residents, the tax is applied using the same pro-gressive tax rate structure.
The United States has estate tax treaties with 17 nations. These treaties provide mutual administra-tion assistance between the U.S. and each country and provisions to prevent double taxation. Estate tax treaties in some cases also modify the reporting requirements under U.S. domestic law. Accordingly, data for treaty status returns and non-treaty status re-turns are presented separately in Figure U.
18 Stock is considered to be U.S. property if it is issued by a domestic corporation. Debt obligations are deemed U.S. property if the obligor is a U.S. citizen or resident, domestic corporation, partnership, or governmental unit.
[Money amounts are in whole dollars]
2005
Number Amount Number Amount
(1) (2) (3) (4)
Nontreaty status, all returns: Total U.S. gross estate 167 113,524,988 188 105,367,749 Total gross estate, outside the U.S. 167 222,211,337 188 861,124,975 Total gross estate, worldwide 167 335,736,313 188 966,492,727
Nontreaty status, taxable returns: Total U.S. gross estate 152 85,864,123 151 84,851,482 Total gross estate, outside the U.S. 152 160,946,403 151 622,552,270 Total gross estate, worldwide 152 246,810,514 151 707,403,755
Nontreaty status, nontaxable returns: Total U.S. gross estate 15 27,660,865 37 20,516,267 Total gross estate, outside the U.S. 15 61,264,934 37 238,572,705 Total gross estate, worldwide 15 88,925,799 37 259,088,972
Treaty status, all returns: Total U.S. gross estate 563 301,868,536 614 231,159,104 Total gross estate, outside the U.S. 563 663,088,808 614 1,122,835,123 Total gross estate, worldwide 563 964,957,337 614 1,353,994,220
Treaty status, taxable returns: Total U.S. gross estate 226 190,852,370 285 142,058,546 Total gross estate, outside the U.S. 226 481,257,956 285 818,073,200 Total gross estate, worldwide 226 672,110,318 285 960,131,737
Treaty status, nontaxable returns: Total U.S. gross estate 337 111,016,166 329 89,100,558 Total gross estate, outside the U.S. 337 181,830,851 329 304,761,923 Total gross estate, worldwide 337 292,847,019 329 393,862,483
NOTE: For comparability, money amounts have been adjusted for inflation to 2006 constant dollars.
Selected Items from Nonresident Alien Estate Tax Returns, Filing Years 2005–2006
2006
Year
Treaty and taxable status, items
Figure U
189
[Money amounts are in whole dollars]
Country
(1) (2) (3) (4) (5) (6) (7) (8)
All countries 563 301,868,536 663,088,808 964,957,337 614 231,159,104 1,122,835,123 1,353,994,220Canada 224 171,309,565 304,341,649 475,651,205 223 76,191,995 496,730,869 572,922,868Germany 144 43,789,975 137,953,389 181,743,365 166 61,014,375 212,630,955 273,645,330United Kingdom 80 28,169,629 52,978,170 81,147,799 96 19,914,002 109,901,329 129,815,329Japan 27 17,341,952 100,039,172 117,381,123 44 24,671,459 210,241,900 234,913,349Switzerland 14 13,046,186 19,283,515 32,329,701 16 11,872,677 52,387,403 64,260,080France 21 11,697,170 6,460,315 18,157,484 16 14,804,451 3,770,315 18,574,766Italy 12 3,881,386 5,373,492 9,254,879 7 3,113,988 34,477 3,148,465Australia 8 2,339,221 4,996,249 7,335,469 6 9,944,147 17,555,675 27,499,822Other countries [1] 33 10,293,452 31,662,858 41,956,311 40 9,632,010 19,582,200 29,214,211[1] For 2005 and 2006, other countries includes Austria, Denmark, Greece, Ireland, Netherlands, Norway, South Africa and Sweden.NOTE: For comparability, money amounts have been adjusted for inflation to 2006 constant dollars.
Selected Items from Nonresident Alient Estate Tax Returns with Treaty Status by Country, Filing Years 2005–2006
2005
TotalU.S. gross
estate
Totalgross estate, outside the
U.S.
Totalgross estate,
worldwideNumber Number
2006
TotalU.S. gross
estate
Totalgross estate, outside the
U.S.
Totalgross estate,
worldwide
For 2006, some 188 nonresident alien non-treaty estate tax returns reported a total gross estate in the United States of $105.4 million. Taxable returns accounted for 151 of these fi lings and $84.9 million of total U.S. gross estate for 2006, while there were 37 non-taxable returns that accounted for $20.5 million of total U.S. gross estate. For 2005, 167 non-treaty returns reported a total U.S. gross estate of $113.5 million. Taxable returns accounted for 152 of these 2005 fi lings and $85.9 million of total U.S. gross estate, while there were just 15 non-taxable returns that reported $27.7 million of total U.S. gross estate.
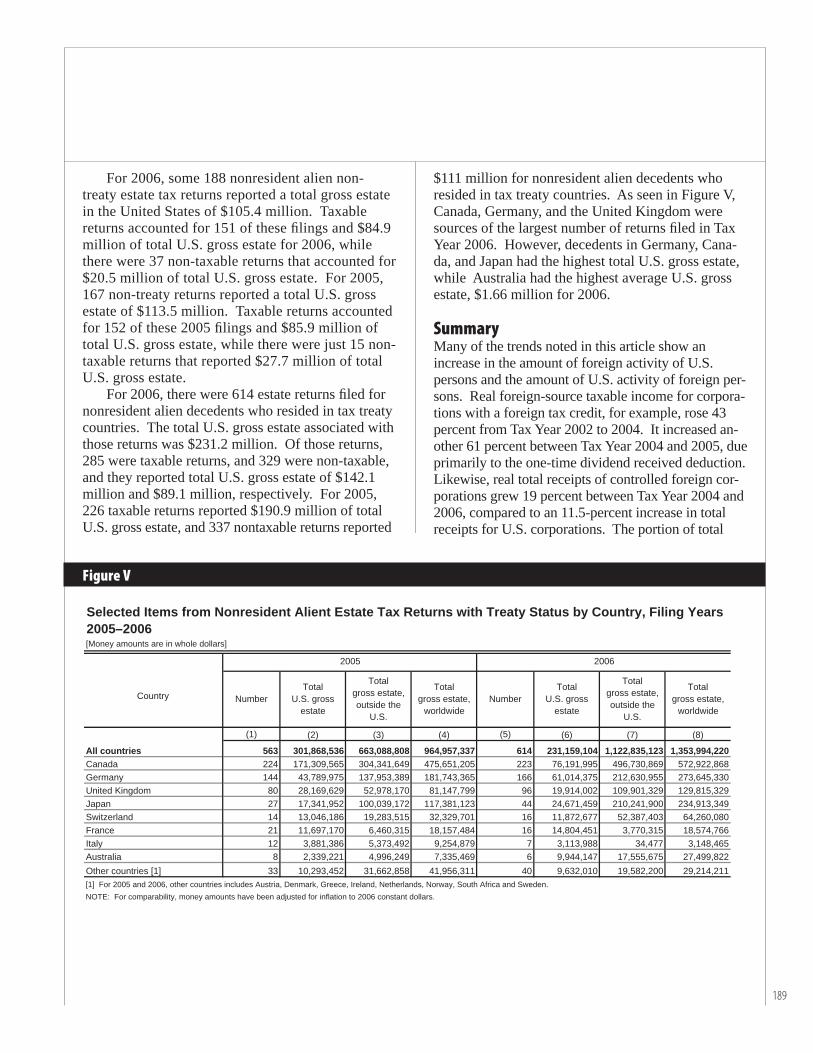
For 2006, there were 614 estate returns fi led for nonresident alien decedents who resided in tax treaty countries. The total U.S. gross estate associated with those returns was $231.2 million. Of those returns, 285 were taxable returns, and 329 were non-taxable, and they reported total U.S. gross estate of $142.1 million and $89.1 million, respectively. For 2005, 226 taxable returns reported $190.9 million of total U.S. gross estate, and 337 nontaxable returns reported
$111 million for nonresident alien decedents who resided in tax treaty countries. As seen in Figure V, Canada, Germany, and the United Kingdom were sources of the largest number of returns fi led in Tax Year 2006. However, decedents in Germany, Cana-da, and Japan had the highest total U.S. gross estate, while Australia had the highest average U.S. gross estate, $1.66 million for 2006.
SummaryMany of the trends noted in this article show an increase in the amount of foreign activity of U.S. persons and the amount of U.S. activity of foreign per-sons. Real foreign-source taxable income for corpora-tions with a foreign tax credit, for example, rose 43 percent from Tax Year 2002 to 2004. It increased an-other 61 percent between Tax Year 2004 and 2005, due primarily to the one-time dividend received deduction. Likewise, real total receipts of controlled foreign cor-porations grew 19 percent between Tax Year 2004 and 2006, compared to an 11.5-percent increase in total receipts for U.S. corporations. The portion of total
Figure V
International Tax OverviewStatistics of Income Bulletin | Summer 2010
190
receipts from all U.S. corporations earned by those controlled by foreign persons grew from 2 percent for Tax Year 1971 to nearly 14 percent for Tax Year 2006. The real amount of average receipts earned by for-eign persons related to large domestic foreign-owned corporations jumped 69 percent between Tax Years 2002 and 2006. Individual foreign-source income and foreign earned income have also risen faster than in-dividual worldwide income in recent years, while the real amount of payments distributed to foreign persons continues its historical climb. However, the real value
of gratuitously transferred property for U.S. persons to foreign trusts dropped from $2.5 billion for 2002 to $1.6 billion for 2006.
Data LimitationsThese statistics do not include adjustments made during audit or on amended returns. Many of the studies are based on samples and, thus, are subject to sampling error. A description of data limitations for each study can be found in the SOI Bulletin, available at http://www.irs.gov/taxstats/index.html.
International Tax OverviewStatistics of Income Bulletin | Summer 2010
191
Table 1. Summary of Current Sources of Data and Available Data for International Studies
Footnotes at end of table.
Not Applicable
Not Applicable
Spring 2009, Vol. 28, No. 4
Spring 2009, Vol. 28, No. 4
Summer 2009, Vol. 29, No. 1
Fall 2009, Vol. 29, No. 2
Spring 2008, Vol. 27, No. 4
Winter 2010, Vol. 29, No. 3
Latest SOI Bulletin Issue with Article
Summer 2009,Vol. 29, No. 1
Summer 2008,Vol. 28, No. 1
Form 5472—Information Return of a 25% Foreign-owned U.S. Corporation or a Foreign Corporation Engaged in
a U.S. Trade or Business
Industry
Entity Classification Continuous Form 8832—Entity Classification Election
Data available upon request only
Interest Charge Domestic International Sales Corporation Every fourth year
Controlled Foreign Corporations
Study
Transactions Between Large Foreign-Owned Domestic Corporations and Related Foreign Persons
Biannually
Biannually
Foreign Partnerships Controlled by U.S. Partners Every fourth year
Frequency [1]
Once
Forms 1120—Corporate Income Tax Return
Industry, country of residence of foreign
owner, age of corporation
Classified bySources of Data
Form 1118—Foreign Tax Credit Corporations
Industry, country towhich tax was paid, size
of total assets
Form 8895—One-Time Dividends Received Deduction for Certain Cash
Dividends from Controlled Foreign Corporations
Industry, countryof incorporation
Form 1120—IC-DISC–InterestCharge Domestic International Sales-
Corporation ReturnProduct or service
Annually
Domestic Corporations Controlled by Foreign Persons Annually
Foreign Tax Credit-Corporations
Form 5471—Information Return of U.S. Persons with Respect to Certain
Foreign Corporations and Form 8858—Information Return of U.S. Persons with Respect to Foreign
Disregarded Entities
Industry, country, sizeof total assets
One-Time Dividend Received Deduction
International Boycotts Annually Form 5713—International Boycott Report
Country making theboycott request, type
of request
Form 8865—Return of U.S. Persons with Respect to Certain Foreign
Partnerships
Data available upon request only
Individual Foreign Tax Credit and Foreign Earned Income Every fifth year
Form 1040—U.S. Individual Income Tax Return , Form 1116—Foreign Tax
Credit , and Form 2555—ForeignEarned Income
Country, size of adjusted gross income
International Tax OverviewStatistics of Income Bulletin | Summer 2010
192
Table 1. Summary of Current Sources of Data and Available Data for International Studies—Continued
[1] Frequency refers to current frequency of study and may not reflect the frequency in prior years.
Foreign Trusts Every fourth year
Study Frequency [1] Sources of Data Classified by
Foreign Recipients of U.S. Income AnnuallyForm 1042S—Foreign Person's U.S.
Source Income Subject to Withholding
Country of residence, principal type of income,
and recipient type
Form 8805—Foreign Partner's Information Statement of Section
1446 Withholding Tax
Country of foreignrecipient
Foreign Recipients of U.S. PartnershipIncome and Form 8288 U.S. Withholding Tax Return for Dispositions by Foreign Persons of U.S. Real Property Interests
Annually
Foreign Investment and Real Property TaxStudy Planned
Form 8288—U.S. Withholding Tax Return for Dispositions by Foreign
Persons of U.S. Real Property Interests
Form 1120—F U.S. Income Tax Return of a Foreign Corporation
Industry, country of residence of foreign owner AnnuallyForeign Corporations with U.S Business
Operations
Not Applicable
Winter 2009, Vol. 28, No. 3
Not Applicable
Latest SOI Bulletin Issue with Article
Nonresident Alien Estates
Data not yet available Not applicable
Summer 2006, Vol. 26, No. 1
Fall 2009, Vol. 29, No. 2
Form 3520—Annual Return to Report Transactions with Foreign Trusts and Receipt of Certain Foreign Gifts and
Form 3520-A–Annual Information Return of a Foreign Trust with a U.S.
Owner
Country of foreign trust, size of net income or deficit
Biannually
Form 706NA—United States Estate (and Generation-skipping Transfer) Tax Return: Estate of Nonresident Not a Citizen of the United States
Tax status, size of U.S. gross estate