Embed Size (px)
Citation preview

Statistics on Same‐Sex Couple Households from 2010 Census
Access the Audio: Toll free number: 1‐800‐369‐2179
Participant passcode: Census Bureau
Webinar presented on September 27, 2011
SpeakersSpeakers
• Stan Rolark, chief, Public Information Office
• Martin O’Connell, chief, Fertility and Family Statistics Branch

TopicsTopics
• Overview of principal 2010 Census resultsp p• Comparisons with recent ACS data• Problems with estimating numbers of same‐sex couple
h h ldhouseholds • Provide two sets of numbers for same‐sex couples:
– First show Summary File 1 counts as in current detailed tables inFirst show Summary File 1 counts as in current detailed tables in the American Factfinder from SF1
– Then we will develop set of “Preferred estimates” accounting for data capture problems uncovered in the 2010 Censusfor data capture problems uncovered in the 2010 Census
• Comparing 2000 and 2010 Census data• Today’s data releases for 2010 Census and ACS data

Same‐Sex Couple Households: C 2000 d 2010Census 2000 and 2010
Number Percent of all households
Household type 2010 2000 2010 2000
Total households 116,716,292 105,480,101 100.0 100.0Total households 116,716,292 105,480,101 100.0 100.0
Total same‐sex couple households
901,997 594,391 0.773 0.564
Unmarried partners 552,620 341,014 0.473 0.323
Spouses 349 377 253 377 0 299 0 240Spouses 349,377 253,377 0.299 0.240
Percent of all same‐sexcouple households
38.7 42.6 (X) (X)p
(X): Not applicable.

Summary of Findings from the 2010 Census
• First examine Census data as derived from Summary File 1 tabulations
• Basic counts of same sex couple households from• Basic counts of same‐sex couple households from the 2010 Census reveal the following:– Same‐sex couple households represent less than 1 percent p p pof all households in the United States.
– Same‐sex couple households increased from 594,000 to 902 000 between 2000 and 2010 censuses902,000 between 2000 and 2010 censuses.
– Unmarried partners increased from 341,000 to 553,000.– Same‐sex spouses increased from 253,000 to 349,000.

Matrix‐Based Format: Pre‐2008 ACS Mail and 2010 C NRFU FCensus NRFU Form

Vertical Person‐Based Format: ACS 2008+ and 2010 CensusMail FormsMail Forms

Comparisons of 2010 Census Data with p2010 American Community Survey Data
• ACS has been widely accepted as providing the best estimate due to improvements in the ACS mailestimate due to improvements in the ACS mail questionnaire beginning in 2008.
• Switch from a matrix‐based format to a vertical/sequential person based form.
– Easier to record information, less confusion in format
– Evidence shows that matrix format of pre‐2008 ACS mail questionnaire resulted in data capture errors for gender that inflated estimates of same sex couplesgender that inflated estimates of same‐sex couples.

Figure 1. Same‐Sex Couple Households: 2000 and 2010 C d ACS E ti t d N b 2005 2010Census and ACS Estimated Numbers, 2005‐2010
900
1,000ACS form changed
349700
800
900
househ
olds
nds)
2007‐2008
253
392 386 341
150 152 152
400
500
600
same‐sex h
(in th
ousan
341 385 394 413 415 429 441553
100
200
300
umbe
rs of s
02000C 2005A 2006A 2007A 2008A 2009A 2010A 2010C
Unmarried partners Spouses
Nu
p p
C‐Census A‐American Community Survey

Comparisons of 2010 Census Data with p2010 American Community Survey data
• Overall 2010 Census counts higher than 2010 ACS estimates—902 000 v 593 000estimates 902,000 v. 593,000.
• Largest discrepancy among same‐sex spouses: 349,000 from the Census compared with 152,000349,000 from the Census compared with 152,000 from the ACS.
• Same‐sex unmarried also show a difference between Sa e se u a ed a so s o a d e e ce be eeCensus and ACS counts: 553,000 for 2010 Census and 441,000 for 2010 ACS.

Figure 2. Percent of Households Reporting as Same‐Sex Couple Households by Form Type: 2010 Census
and 2010 ACS Estimatesolds 0.9341.0
sex hou
seho
0.7730.724
0.6670.7
0.8
0.9
ting Sam
e‐s
0.518
0.3220.4
0.5
0.6
rcent repo
r 0 3
0.1
0.2
0.3
Pe 0.0All forms Mail Non‐mail*
Census 2010 ACS 2010
•NRFU forms for Census 2010 and CATI/CAPI forms for ACS 2010.
Differences in Reporting Same‐Sex Households b F T 2010 C d 2010 ACSby Form Type: 2010 Census and 2010 ACS
• About one‐quarter of all Census same‐sex couple households q pcame from non‐response follow‐up forms (NRFU)– Same matrix format used in the 2010 Census non‐response follow‐up
(NRFU) questionnaire produced overestimates of same‐sex couple(NRFU) questionnaire produced overestimates of same sex couple households.
• The percent of households that are same‐sex couple h h ld f th 2010 C d th 2010 ACS hhouseholds from the 2010 Census and the 2010 ACS show comparable estimates from mail forms.
• Large differences occur when comparing 2010 Census results g p gwith 2010 ACS results for non‐mail forms.– National level data show 2010 Census data returning 3x as many
same‐sex couple households in non‐mail (NRFU) forms as in the 2010same‐sex couple households in non‐mail (NRFU) forms as in the 2010 ACS non‐mail returns

Figure 3. Percent of Mail Return Households Reporting As Same‐Sex Couple Households by State: p g p y
2010 Census and 2010 ACS EstimatesPercent
2.4
1.8
2.0
2.2
1.0
1.2
1.4
1.6
0.4
0.6
0.8
1.0
0.0
0.2
DC
VT
MA
CA OR DE
ME
NM
WA HI RI NV NY AZ FL NH
CO
GA CT MD TX NJ
NC AK
MN IL
VA UT LA PA IN TN KY
MO
OK SC OH
WI
WV
MI
AL AR KS ID IA NE
MS
MT
WY
SD ND
Census 2010 ACS 2010
Note: States ordered from highest to lowest based on 2010 Census percents.
Census 2010 ACS 2010

Figure 4. Percent of Non‐Mail Return Households Reporting As Same‐Sex Couple Households by State: p g p y
2010 Census and 2010 ACS EstimatesPercent
1.4
1.0
1.2
0 6
0.8
1.0
0.4
0.6
0.0
0.2
VT
DC
NV
NH
NM HI
MA
ME
DE
WV
OR FL NY
GA CA AZ NJ
NC
OK RI
MD
WA
CO
AR
MT TX KY LA IN SC
MO
CT PA TN AL ID MS
OH IL
IA VA AK
UT
WI
WY
NE KS MI
MN SD ND
Note: States ordered from highest to lowest based on Census 2010 percents.
Census 2010 ACS 2010
Differences in Reporting Same‐Sex Couple Households: State Level Patterns, 2010 Census and ,
2010 ACS
• 2010 Census and 2010 ACS comparisons among p gstates for mail forms very consistent.– Since data are displayed in descending order according to 2010 Census results Census data produce a smooth line2010 Census results, Census data produce a smooth line.
– ACS data reveal sampling variations in the data.
• Comparisons among non‐mail returns very different:Comparisons among non mail returns very different:– Much higher returns of same‐sex households for Census NRFU using the matrix designed forms than for the ACS CATI/CAPI follow‐up conducted using computer assisted forms (48 states were higher in the 2010 Census)higher in the 2010 Census).

Questionnaire Format Issues Affecting Estimates of gSame‐Sex Couple Households in the 2010 Census
• Problem with matrix format not evident until late 2009 during processing of the 2008 ACS.
• Too late to alter Census NRFU form.
• ACS laptop instrument better designed and has verification screen to reduce errorsscreen to reduce errors.
• Data capture errors in gender item by opposite‐sex couples created inflated count of same‐sex couples.
• Can we measure the extent of errors and correct the data?

How to Test Quality of Reporting Sex?How to Test Quality of Reporting Sex?
• Compare reported sex with likelihood of person’s name being the same sex.
• Names Index=Number of times per 1,000 that name reported was male.– Higher the index, more likely that person is male– Names like John or Thomas have high index– Names like Elizabeth or Virginia have a low index– Names like Leslie or Pat may have an uncertain or mid range index
• Names data base built during processing for that state.• Names with no index value are those with:Names with no index value are those with:
– Less than 10 occurrences– First name is left blank or has only one character– No one with that name reported their sex– No one with that name reported their sex

Illustrative Example: First Name Indices for Male‐Male Households in Texas 2010 CensusMale Households in Texas, 2010 Census
(Numbers of reported partner households)
Partner’s Name Index
Householder’sname Index
Highly likely female
Sexuncertain
Highly likely male
Total
Highly likely female 35 289 1,869 2,193
Sex uncertain 893 2,736 1,896 5,525
Highly likely male 6,265 3,341 14,439 24,045
Total 7,193 6,366 18,204 31,763

How the Names Index Works: Texas ExampleHow the Names Index Works: Texas Example
• Persons with index value 0‐50 were likely to be female.y
• Persons with index values of 950‐1000 were likely to be male.
• In the Texas example, of the 31,763 male‐male households:– 14,439 (45%) had both partners with high male index values
– 2,193 “male” householders and 7,193 “male” partners had low index values indicating they were likely to be female (29%)index values indicating they were likely to be female (29%)
– 7,973 had names that were uncertain as to their sex (25%)
• Couples who had either partner with a female name were then considered to have incorrectly marked the sex item on the question.

Inconsistent Reporting between Names and SexInconsistent Reporting between Names and Sex
• Potential errors in the sex item come from two different populations:– Unmarried same‐sex partners from “unmarried” opposite‐sex partners
Unmarried same sex spouses from “married” opposite sex spouses– Unmarried same‐sex spouses from married opposite‐sex spouses
• Errors can come from mismarks by respondents, enumerators or problems in optical scanning of questionnaires
• What is the incidence of inconsistency for the two living arrangement types (partners and spouses) by form type?
A i i l i• Are inconsistent names‐sex responses more prevalent in states where a higher proportion of same‐sex households came from NRFU forms?

Figure 5. Percent of Same‐Sex Couples with Inconsistent N S R ti b F T 2010 CName‐Sex Reporting, by Form Type: 2010 Census
essistent n
ame
with
incon
Percent

Data Capture Errors in Gender ItemData Capture Errors in Gender Item
• Inconsistencies more prevalent among same‐sex households derived from NRFU forms (50%) than mail forms (20%).
• Name‐sex inconsistencies total 28% of all same‐sex couples:
7% of unmarried partners– 7% of unmarried partners
– 62% of same‐sex spouses

Map 4. Percent of Same-sex Couples with Inconsistent Name-Sex Reporting: Census 2010
Map 4 Percent of Same‐Sex Couples with Inconsistent Name‐Sex Reporting: 2010 Census
MT ND
WAME
p g
AK
CA
MT
ID
NV
OR
WYIA
SD
NE
MN
UT IL
ND
WI
IN
PA
NYMI
OHMD
NH
NJ
VT
MA CT
RI
CA
AZ NM
KSCO
OK
GAAR
MO
AL
NC
MS
TN
VAKY
SC
WV DE
DC
TX
FLLA
Percent of Same-sex Couples with Inconsistent Name-Sex Reporting
6.3% - 25.8%
25 9% 28 2%
HI
25.9% - 28.2%
28.3% - 38.1%
38.2% - 49.9%
US Average: 28.3%

Figure 6. Percent of Same‐Sex Couple Households Using NRFU Forms vs. Percent with Inconsistent Name‐Sex Reporting by State: 2010 CensusPercent with Inconsistent Name‐Sex Reporting, by State: 2010 Census
50
60sten
cy
R= 0.837ND
SD
40
50
ame‐sex inconsis
WVMS
WYMTAL
SD
30
seho
lds with na
10
20
of sam
e‐sex ho
u
0
10
0 10 20 30 40 50
Percen
t o
DC
Percent of same‐sex households using NRFU forms

Data Capture Errors in Gender ItemData Capture Errors in Gender Item
• Name‐sex inconsistency more common in states running from y gthe South and Upper Midwest and Mountain areas.
– This means that reports of same‐sex households were i fl t d i th b f d t t iinflated in these areas because of data capture errors in the gender item.
• Distinct pattern of higher rates of inconsistency among states deriving same‐sex couple households using NRFU forms.– States more likely to receive NRFU forms were the states more likely to
produce inflated numbers of same‐sex couples.

Comparison of Census 2010 Summary File C d P f d E i i h h ACSCounts and Preferred Estimates with the ACS
• How would the 2010 Census compare with the 2010 ACS pestimates after removing couples with inconsistent name‐sex reports?
• Two sets of 2010 Census data are shown:– Original numbers of same‐sex couple households based on SummaryOriginal numbers of same sex couple households based on Summary
File Counts.
– Numbers of same‐sex couple households developed by removing name‐sex inconsistencies from original Summary File Counts. These a e se co s ste c es o o g a Su a y e Cou ts. eseare the “Preferred Estimates” as they improve the counts of same‐sex couple households.

2010 Census Summary File Counts and Preferred Estimates of S S C l H h ld d 2010 ACS E ti tSame‐Sex Couple Households and 2010 ACS Estimates
2010 C 2010 C ACS 2010Household type
2010 Censussummary file
counts
2010 Census preferredestimates
ACS 2010 estimates*
Total same‐sex couple households 901,997 646,464 593,324
Unmarried partners 552,620 514,735 440,989
Spouses 349,377 131,729 152,335
*Weighted estimate.

Comparison of 2010 Census Summary File C d P f d E i i h h ACSCounts and Preferred Estimates with the ACS
• Preferred 2010 Census estimates of same‐sex couple households closer to 2010 ACS estimates.– Number in 2010 Census declines from 902,000 to 646,000.
• Declines occur for both same‐sex unmarried partner andDeclines occur for both same sex unmarried partner and spousal households.– For unmarried partners 2010 preferred estimates still about 75,000
higher than the 2010 ACS. Possible Census campaign to encourage g p g gsame‐sex household reporting accounts for some differnces.
• Spousal households most improved.– Census 2010 preferred estimate of 132 000 compared with 152 000Census 2010 preferred estimate of 132,000 compared with 152,000
from the 2010 ACS.– Very few actual spousal households in US (<50,000) so names
adjustment effect is greater.

Figure 7. Percent of Households Reporting as Same‐Sex Couple Households by State: 2010 Census and p y
2010 ACS EstimatesPercent
1.0
0.773
0.7
0.8
0.9
0.473
0.554
0.441
0.518
0.3850.4
0.5
0.6
0.299
0.113 0.133
0.1
0.2
0.3
0.0Total Unmarried partners Reported spouses
Census summary file estimate Census preferred estimate ACS 2010
Comparison of 2010 Census Summary File C d P f d E i i h h ACSCounts and Preferred Estimates with the ACS
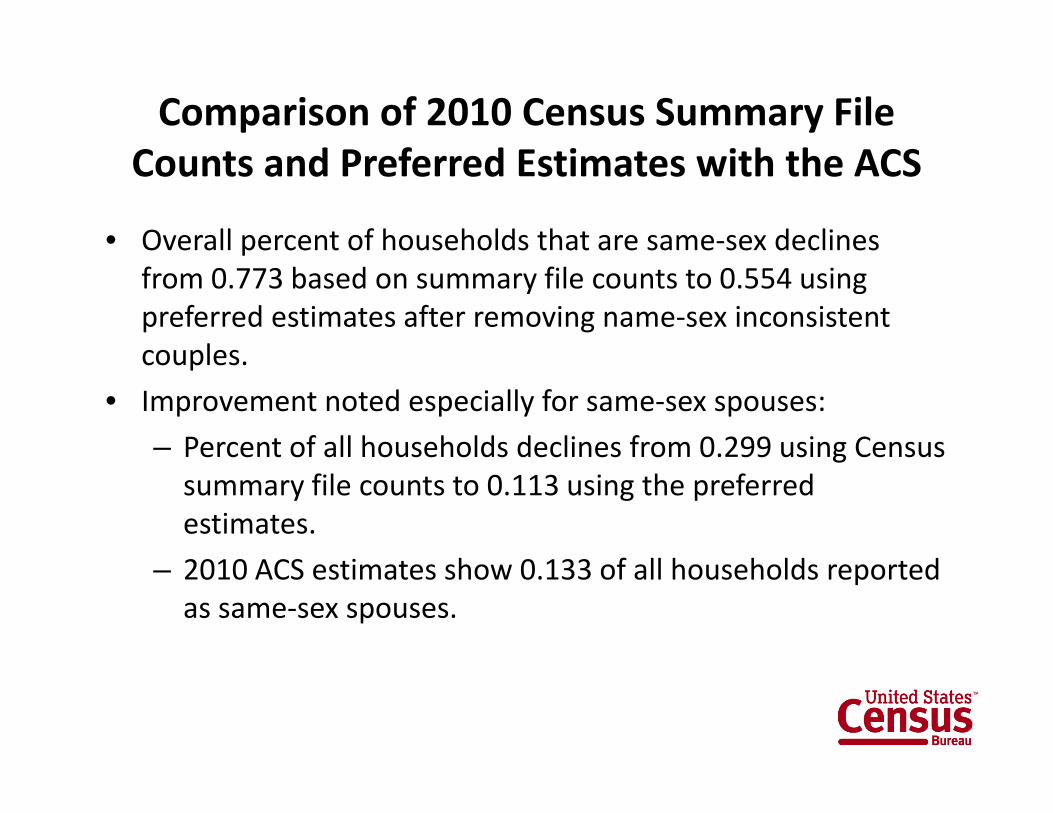
• Overall percent of households that are same‐sex declines pfrom 0.773 based on summary file counts to 0.554 using preferred estimates after removing name‐sex inconsistent couplescouples.
• Improvement noted especially for same‐sex spouses:
– Percent of all households declines from 0.299 using Census gsummary file counts to 0.113 using the preferred estimates.
2010 ACS i h 0 133 f ll h h ld d– 2010 ACS estimates show 0.133 of all households reported as same‐sex spouses.

Figure 8. Percent of Households Reporting as Same‐Sex Couple Households by State: 2010 Census and p y
2010 ACS EstimatesPercent
2.0
1 4
1.6
1.8
2.0
1.0
1.2
1.4
0.4
0.6
0.8
0.0
0.2
DC
VT
MA
CA OR
NM DE
ME HI
WA
NV
NH NY RI FL AZ
GA
CO
MD CT TX NJ
NC AK LA WV KY VA IL
OK
PA UT
MN IN TN
MO
SC OH AR
WI
AL
MS
MI
MT ID KS IA NE
WY
SD ND
Census summary file counts Census preferred estimates ACS 2010
Note: States ordered from highest to lowest based on 2010 Census summary file percents.
Census summary file counts Census preferred estimates ACS 2010

Comparison of 2010 Census Summary File C d P f d E i i h h ACSCounts and Preferred Estimates with the ACS
• Improvements occur for all states.p
• Caution– 2010 ACS estimates probably have similar misreporting problems but to a lesser degree because of improved mail form and use of laptop instruments.

Same‐Sex Couple Households, Summary File Counts and Preferred Estimates:
Census 2000 and 2010 Census
Summary file counts1Percent
Preferred estimates2Percent
Summary file counts1change
Preferred estimates2change
Household type Census 2010 Census 2000 2000‐2010 Census 2010 Census 2000 2000‐2010yp
Total 901,997 594,391 51.8 646,464 358,390 80.4
Unmarried partners 552,620 341,014 62.1 514,735 314,052 63.9
Spouses 349,377 253,377 37.9 131,729 44,338 197.1
1 Tabulated from internal 2000 and 2010 Census Summary Files.2 Preferred estimates indirectly derived from 2010 Census inconsistency ratios and summary file counts from Census 2000 .

Comparing 2000 and 2010 Census Dataf S S C l H h ldfor Same‐Sex Couple Households
• Without re‐tabulating Census 2000, a similar technique was g , qused to develop a preferred estimate removing incorrectly assigned couples for Census 2000.
C i th t f d ti t b t 2000 2010• Comparing the two preferred estimates between 2000‐2010:
– Total same‐sex households increased 80%.
– Growth for unmarried partners increased 64 percentGrowth for unmarried partners increased 64 percent.
– Increase higher for spouses‐197%
– More than 80% of 2000 estimates of same‐sex spouses pwere probably opposite‐sex couples compared with 62% in 2010.

SummarySummary
• Errors in the marking of the sex item on 2010 Census forms created significant numbers of falsely reported same‐sex couples.
• The level of generating false same‐sex unmarried partners is greater in NRFU forms than in mail forms.
• Inflated estimates greater for same‐sex spouse than unmarried partners.
• Use “Preferred estimates” instead of uncorrected “Summary file counts” for analyzing either 2010 numbers or examining decadal changes.y g g g
• Detailed analytical report will provide users with preferred estimates for each state for both same‐sex unmarried partners and spouses.
• Additional data will be presented for same‐sex households with ownAdditional data will be presented for same sex households with own children present for three data series: 2010 summary file counts, 2010 preferred estimates, and new 2010 ACS numbers for comparison.

Online Press KitOnline Press Kit