Embed Size (px)
Citation preview
Statistics
Review of Statistics
Levels of Measurement
Descriptive and Inferential Statistics
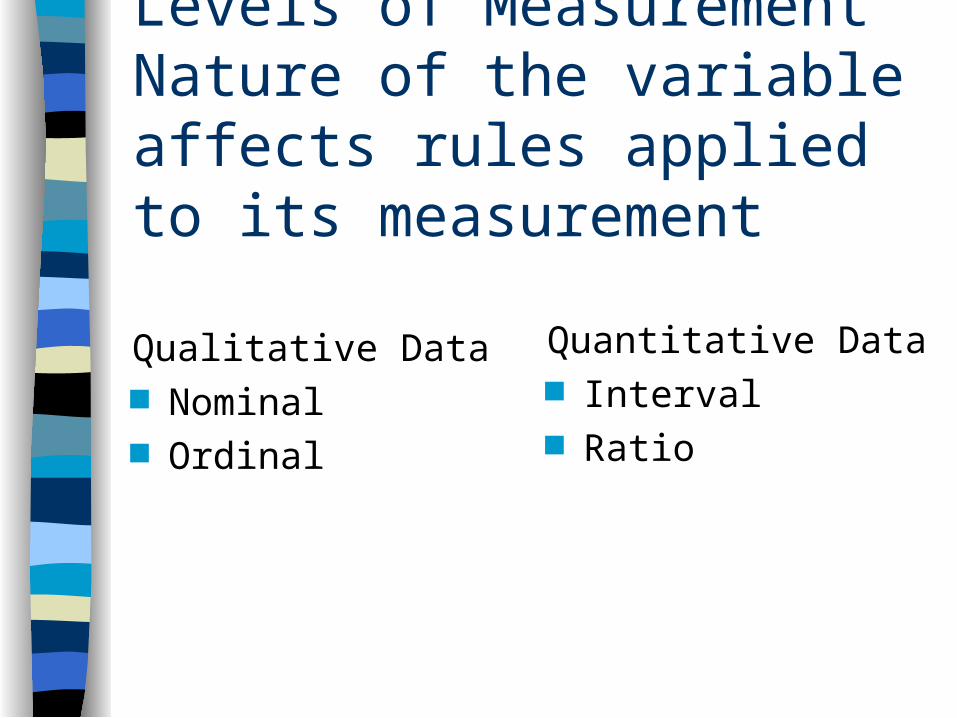
Levels of MeasurementNature of the variable affects rules applied to its measurement
Qualitative Data Nominal Ordinal
Quantitative Data Interval Ratio
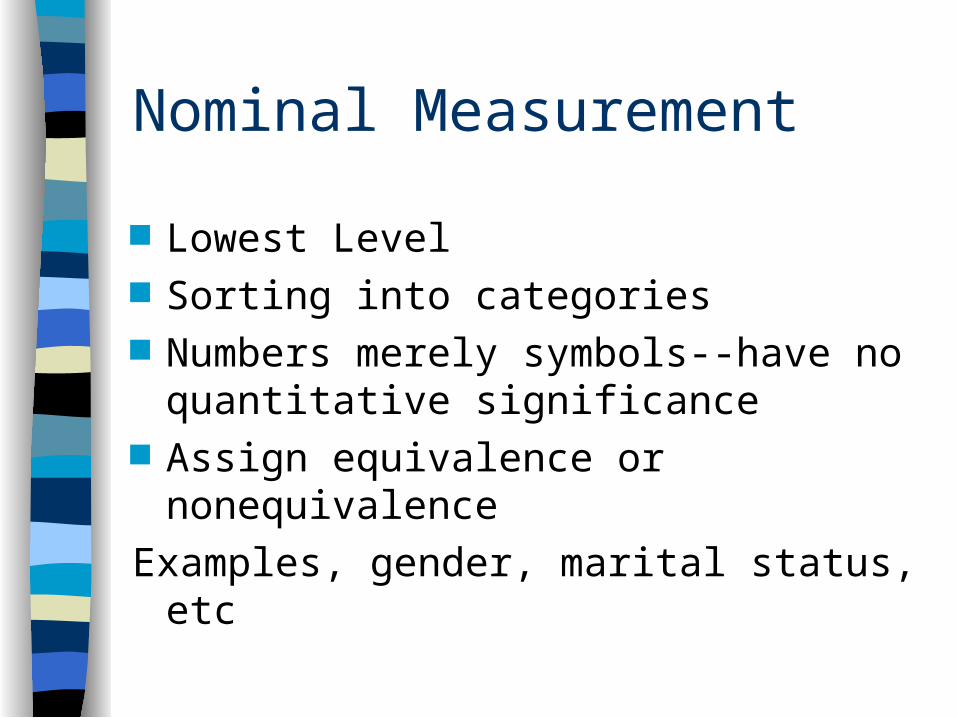
Nominal Measurement
Lowest Level Sorting into categories Numbers merely symbols--have no
quantitative significance Assign equivalence or nonequivalence
Examples, gender, marital status, etc
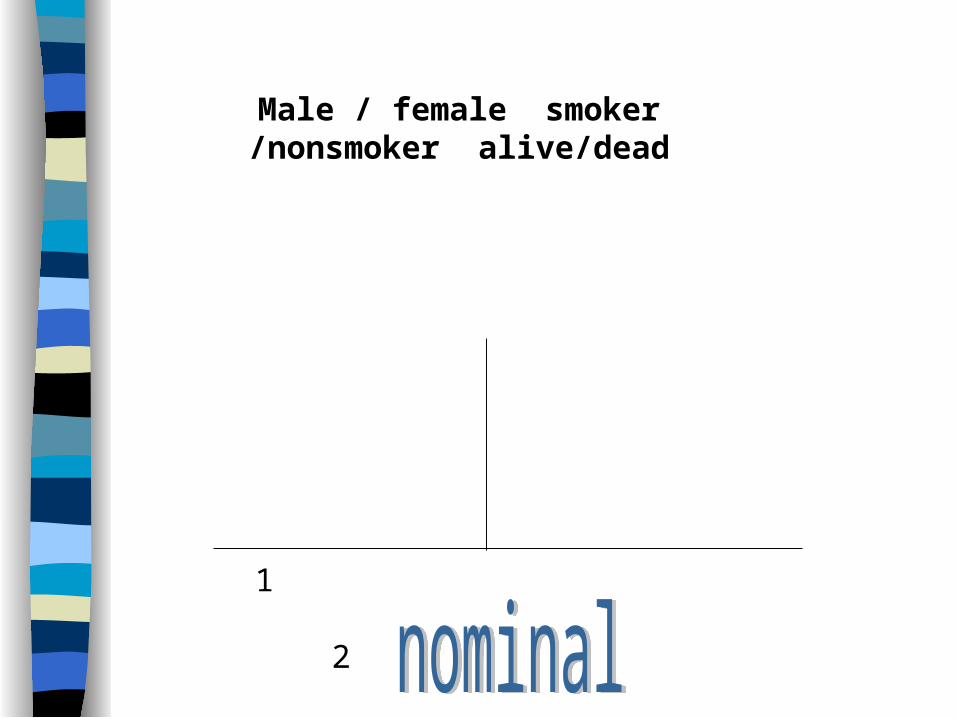
Male / female smoker /nonsmoker alive/dead
1 2
Rules of Nominal system
All of members of one category are assigned same numbers
No two categories are assigned the same number (mutual exclusivity)
Cannot treat the numbers mathematically
Mode is the only measure of central tendency
The Ordinal Scale
Sorting variations on the basis of their relative standing to each other
Attributes ordered according to some criterion (e.g. best to worst)
Intervals are not necessarily equal
Should not treat mathematically, frequencies and modes ok
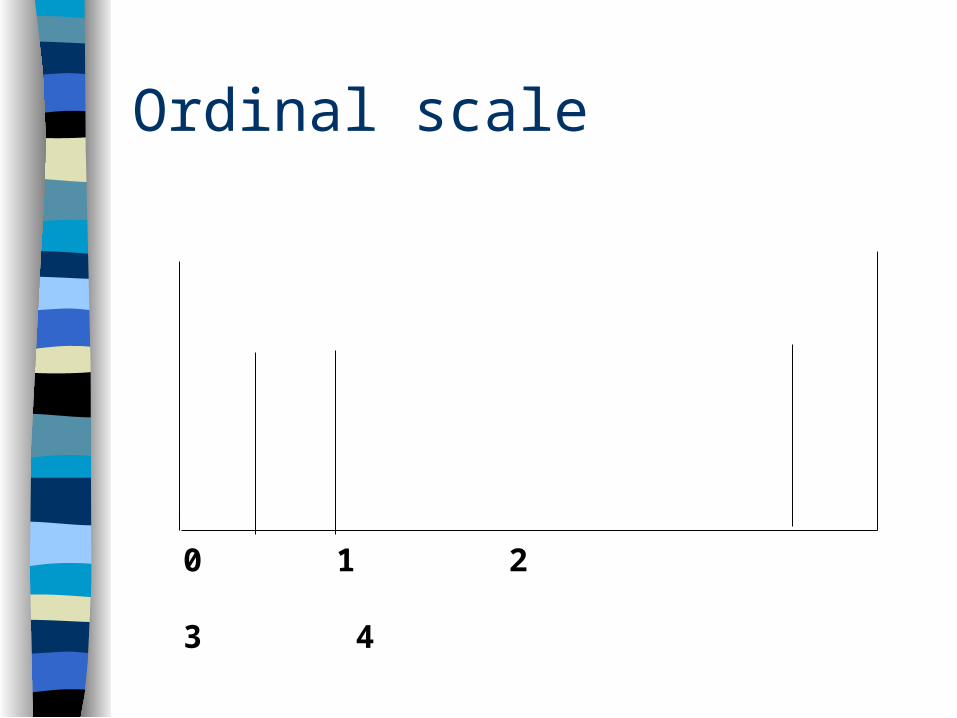
Ordinal scale
0 1 2 3 4
Interval Scale
Researcher can specify rank ordering of variables and distance between
Intervals are equal but no rational zero point (example IQ scale, Fahrenheit scale)
Data can be treated mathematically, most statistical tests are possible
Ratio Scale
Highest level of measurement Rational meaningful zero point Absolute magnitude of variable (e.g.,
mgm/ml of glucose in urine) Ideal for all statistical tests
Descriptive Statistics
Used to describe data Frequency distributions, histograms,
polygons Measures of Central Tendency Dispersion Position within a sample
Frequency Distributions
Imposing some order on a mass of numerical data by a systematic arrangement of numerical values from lowest to highest with a count of the number of times each value was obtained--Most frequently represented as a frequency polygon
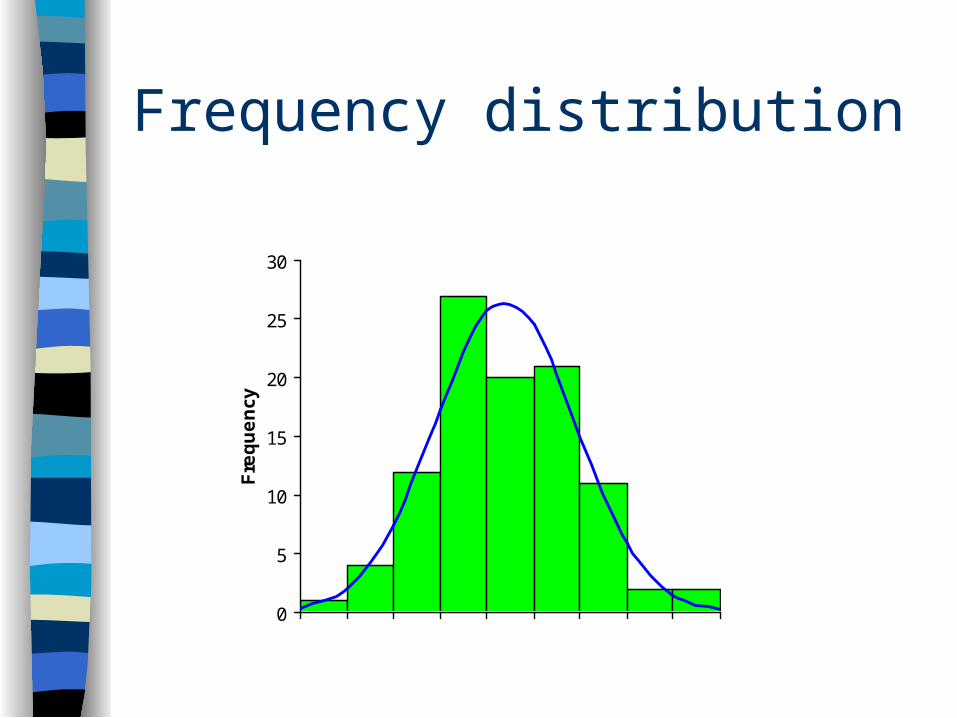
Frequency distribution
0
5
10
15
20
25
30F
req
ue
ncy
Shapes of distributions
Symmetry Modality Kurtosis
Symmetry
Normal curve symmetrical If non symmetrical skewed (peak is off
center)– positively skewed– negatively skewed
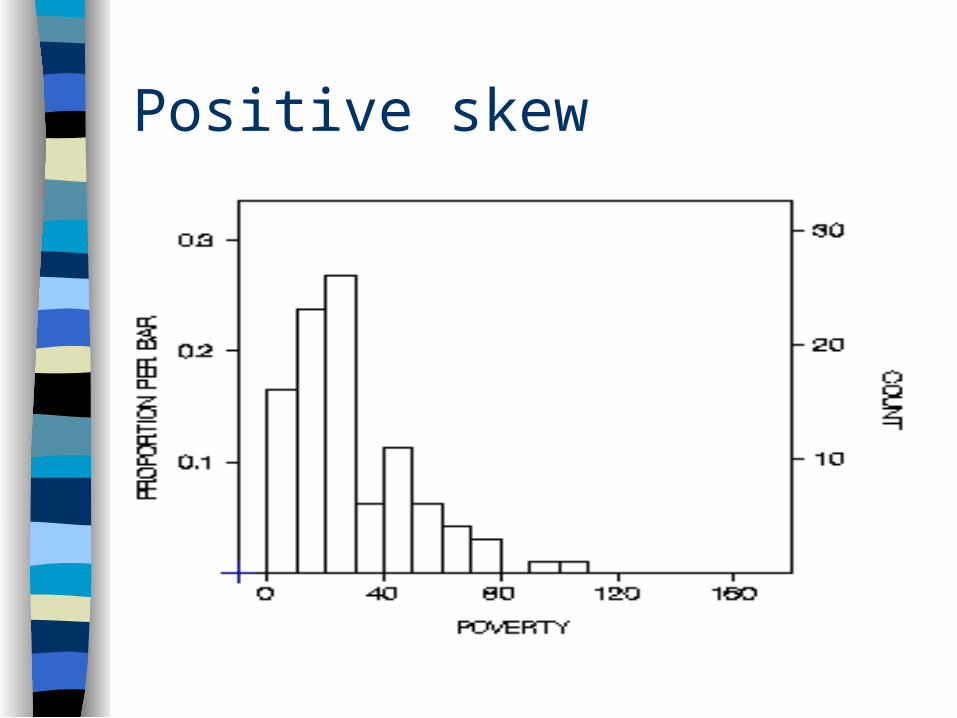
Positive skew
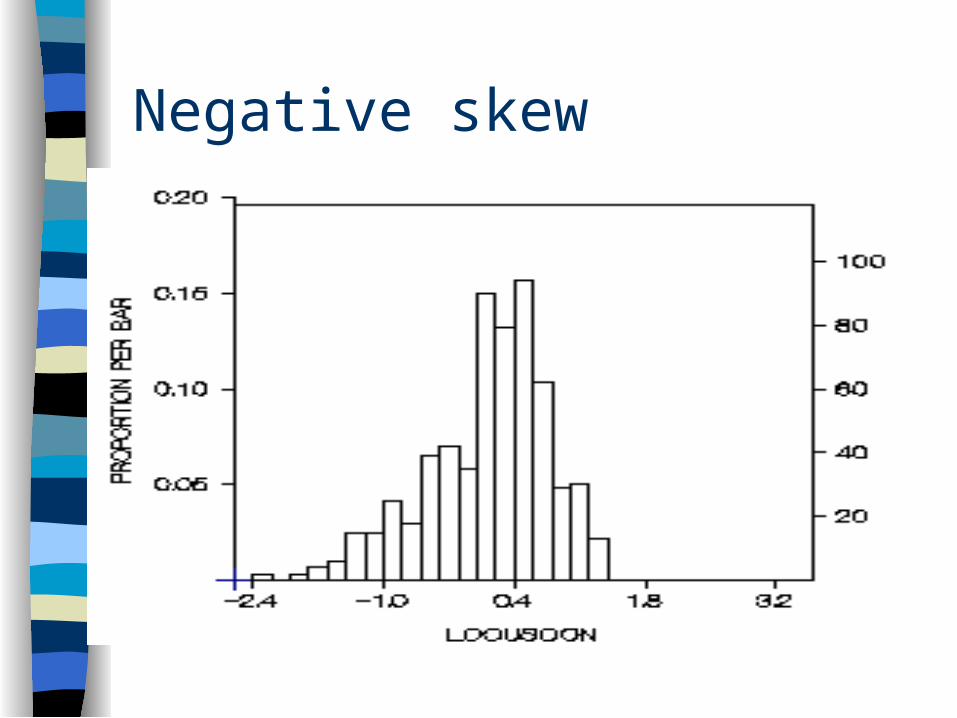
Negative skew
Modality
Describes how many peaks are in the distribution– unimodal– bimodal– multimodal
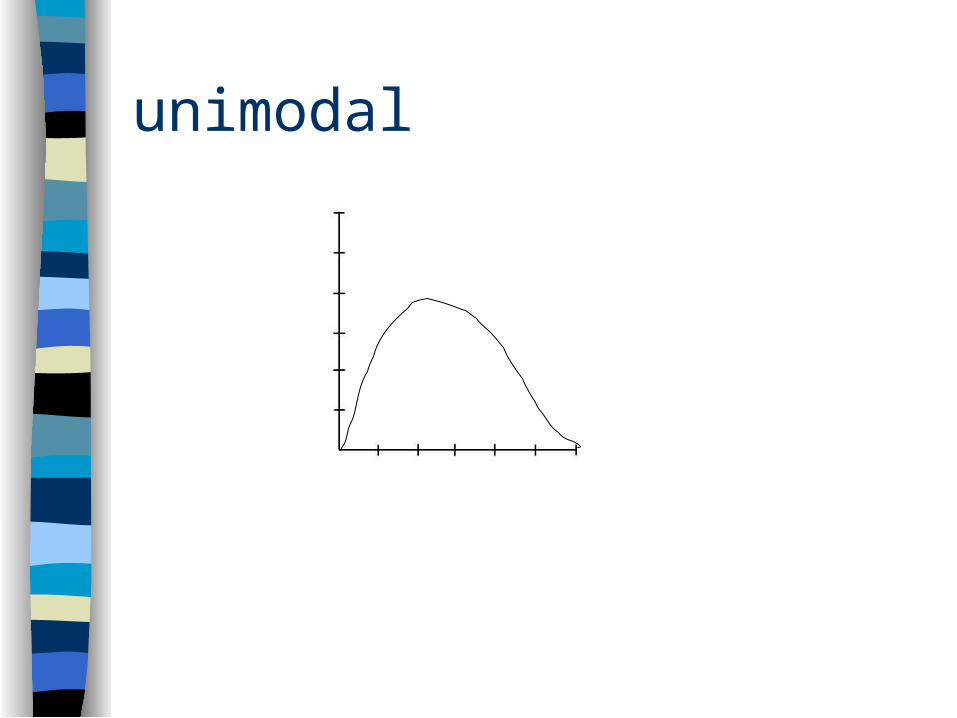
unimodal
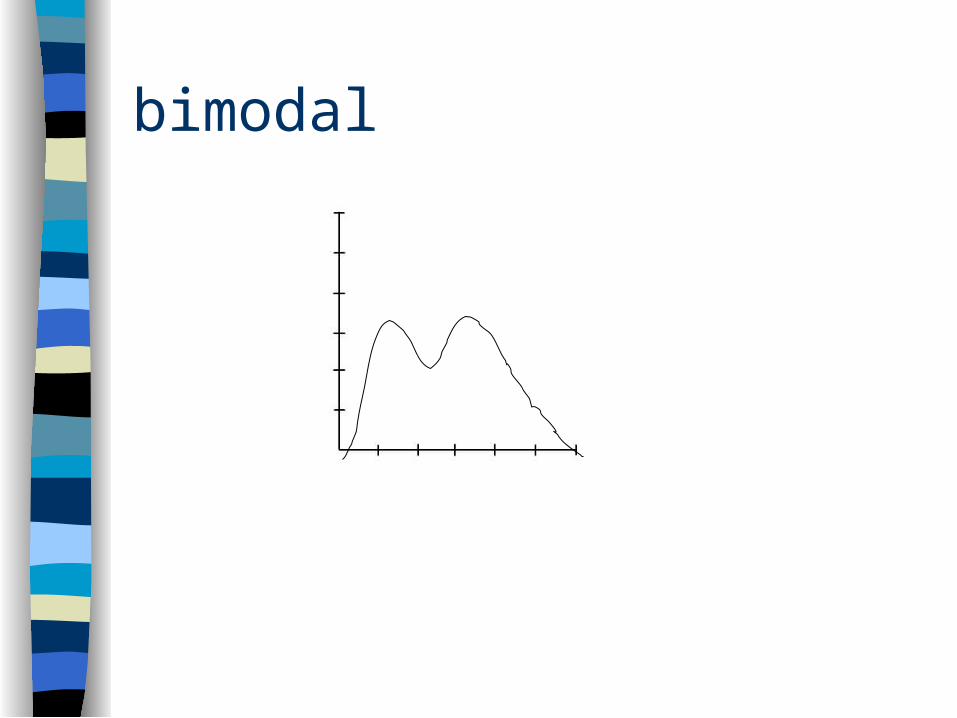
bimodal
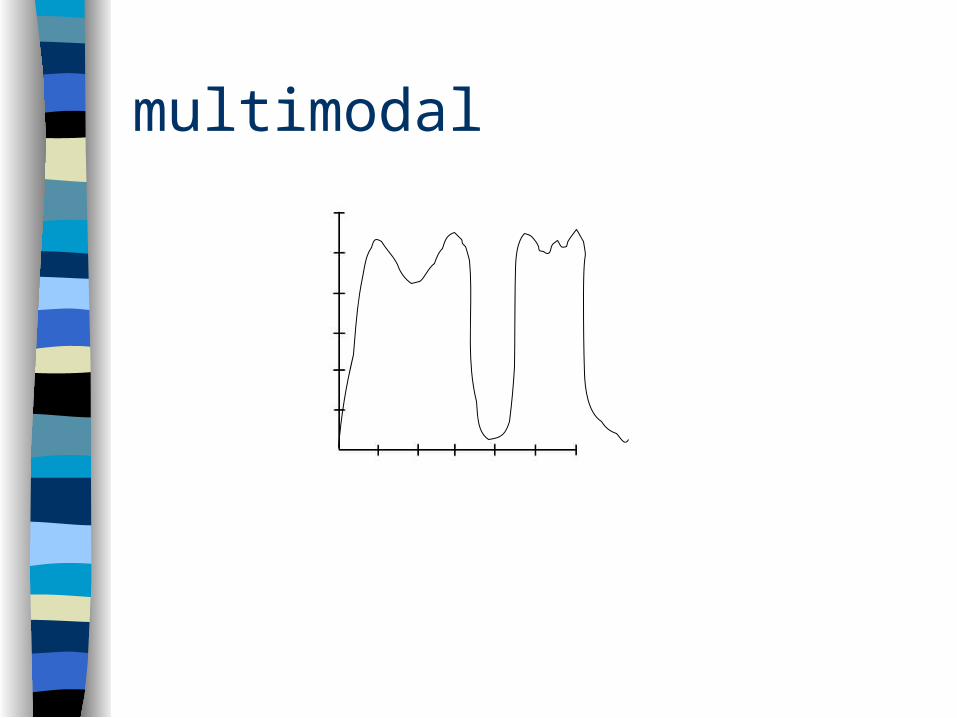
multimodal
Kurtosis
Peakedness of distribution– platykurtic – mesokurtic– leptokurtic
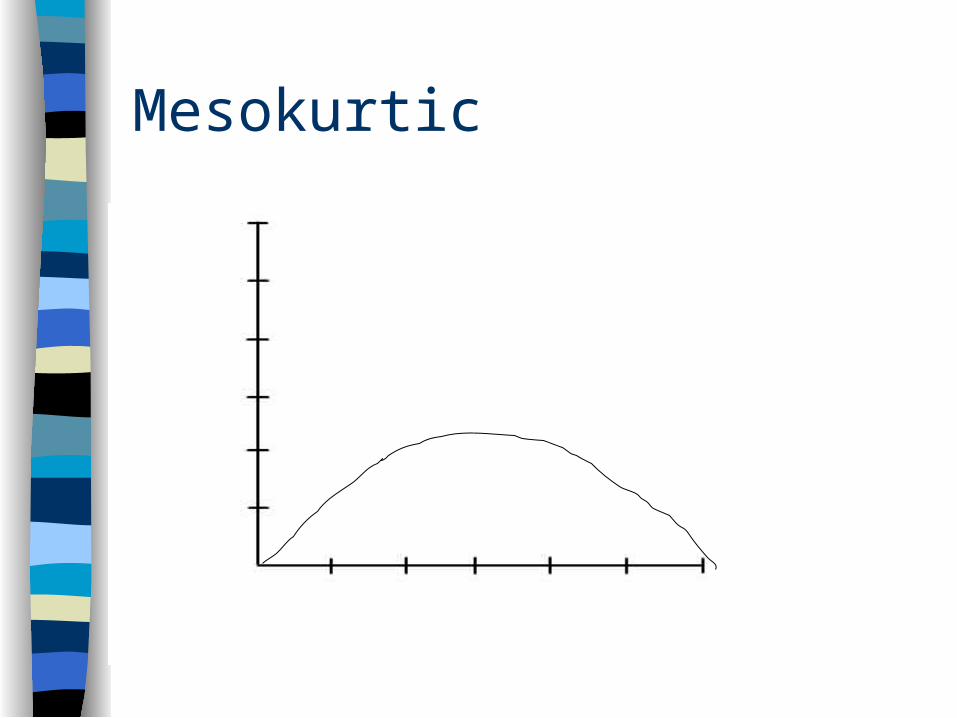
Mesokurtic
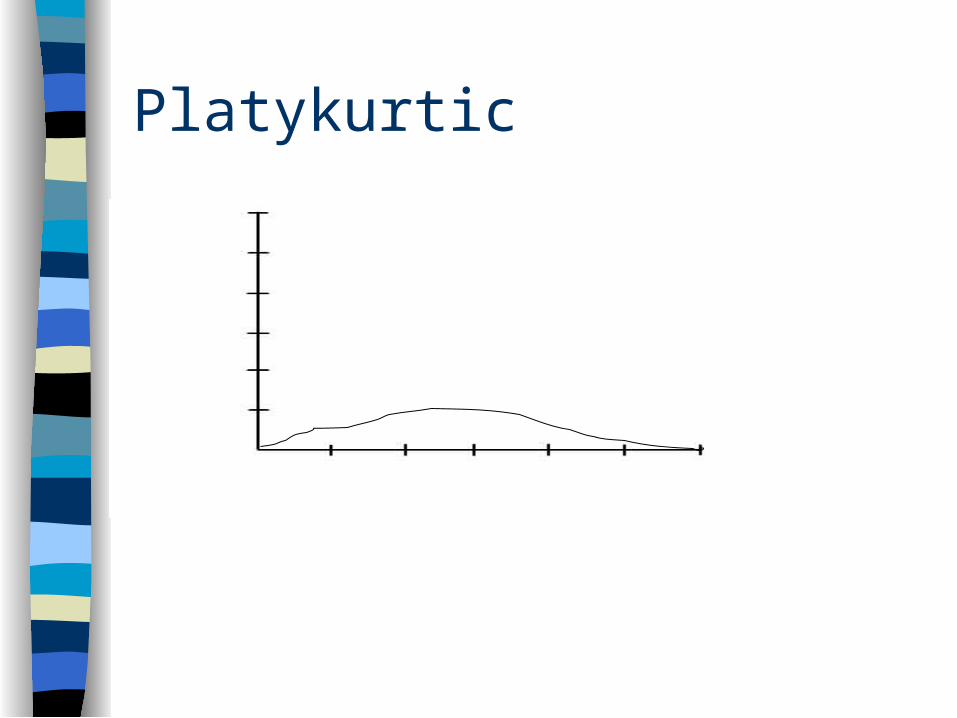
Platykurtic
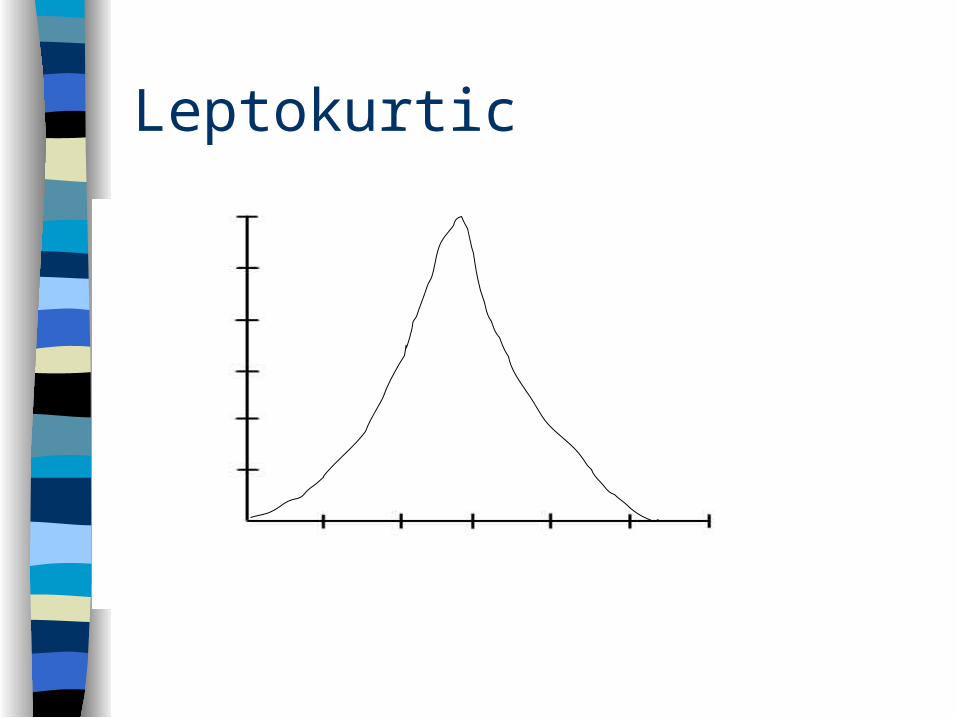
Leptokurtic
Measures of Central Tendency
Overall summary of a group’s characteristics
“What is the average level of pain described by post hysterectomy pts.?”
“How much information does the typical teen have about STDs?”
Mean
Arithmetic average Most widely reported meas. of CT Not trustworthy on skewed distributions
Median
The point on a distribution above which 50% of observations fall
Shows how central the mean really is since the median is the number which divides the sample in half
Does not take into account the quantitative values of individual scores
Preferred in a skewed distribution
Mode The most frequently occuring score or
number value within a distribution Not affected by extreme values Shows where scores cluster There may be more than one mode in a
distribution Arrived at through inspection limited usefulness in computations
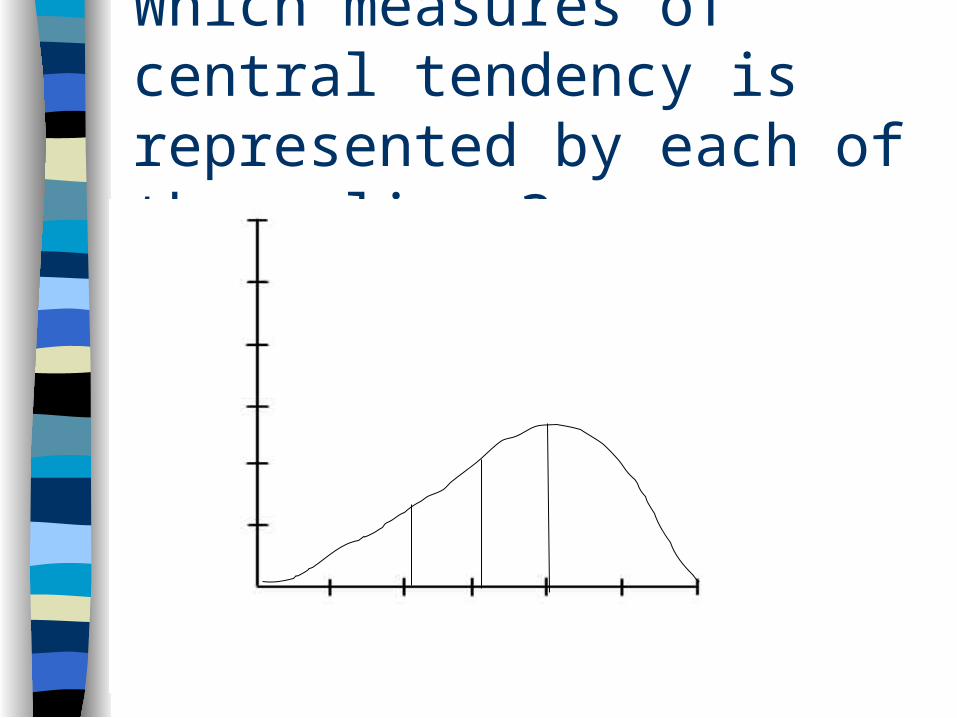
Which measures of central tendency is represented by each of these lines?
Variability or Dispersion Measures
Percentile rank-the point below which a % of scores occur
Range --highest-lowest score Standard deviation--master measure of
variability--average difference of scores from the mean--allows one to interpret a score as it relates to others in the distribution
Normal (Gaussian) Distribution
Mathematical ideal– 68.3% of scores within +/- 1sd– 95.4% of scores within +/- 2sd– 99.7% of scores within +/- 3sd
unimodal
mesokurtic
symmetrical
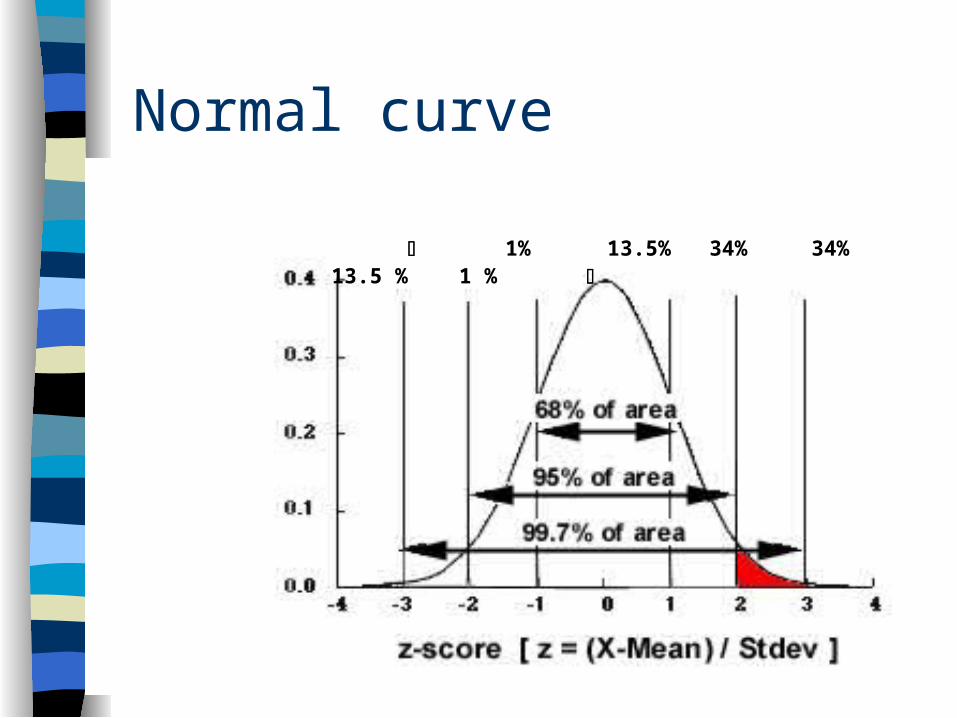
Normal curve
1% 13.5% 34% 34% 13.5 % 1 %
Inferential Statistics
Used to make inferences about entire population from data collected from a sample
Two classifications based on their underlying assumptions
Parametric Nonparametric
Parametric Based on population parameters Have numbers of assumptions
(requirements) Level of measurement must be interval
or ratio– t-test– Pearson product moment correlation ®– ANOVA– Multiple regression analysis
Parametric
Preferable because they are more powerful--better able to detect a significant result if one exists.
Nonparametric
Not as powerful Have fewer assumptions Level of measurement is nominal or
ordinal– Chi squared
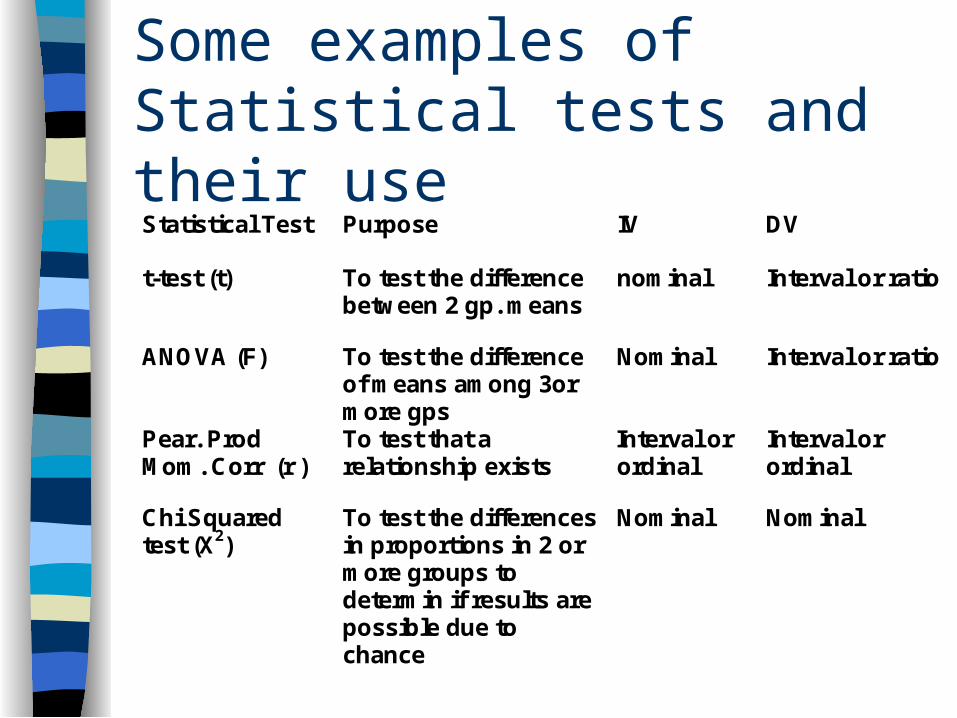
Some examples of Statistical tests and their useStatistical Test Purpose IV DV
t-test (t) To test the differencebetween 2 gp. means
nominal Interval or ratio
ANOVA (F) To test the differenceof means among 3ormore gps
Nominal Interval or ratio
Pear. ProdMom. Corr (r )
To test that arelationship exists
Interval orordinal
Interval orordinal
Chi Squaredtest (X2)
To test the differencesin proportions in 2 ormore groups todetermin if results arepossible due tochance
Nominal Nominal
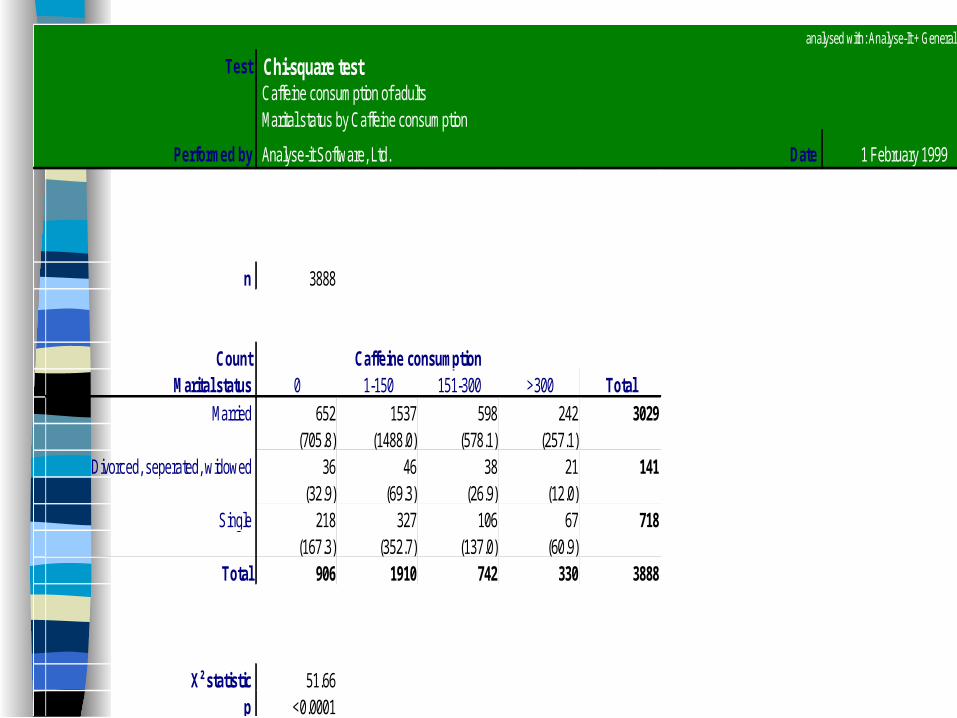
analysed with: Analyse-It + General v1.40
Test Chi-square test Caffeine consumption of adults Marital status by Caffeine consumption
Performed by Analyse-it Software, Ltd. Date 1 February 1999
n 3888
Count Caffeine consumptionMarital status 0 1-150 151-300 >300 Total
Married 652 1537 598 242 3029 (705.8) (1488.0) (578.1) (257.1)
Divorced, seperated, widowed 36 46 38 21 141 (32.9) (69.3) (26.9) (12.0)
Single 218 327 106 67 718 (167.3) (352.7) (137.0) (60.9)
Total 906 1910 742 330 3888
X² statistic 51.66p <0.0001
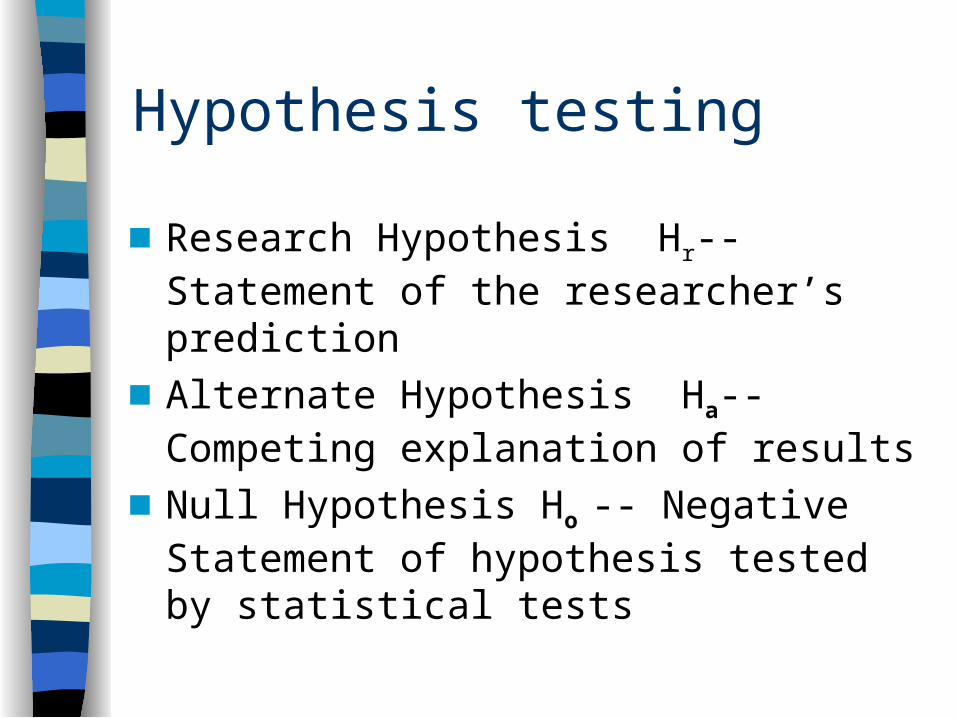
Hypothesis testing
Research Hypothesis Hr--Statement of the researcher’s prediction
Alternate Hypothesis Ha--Competing explanation of results
Null Hypothesis Ho -- Negative Statement of hypothesis tested by statistical tests
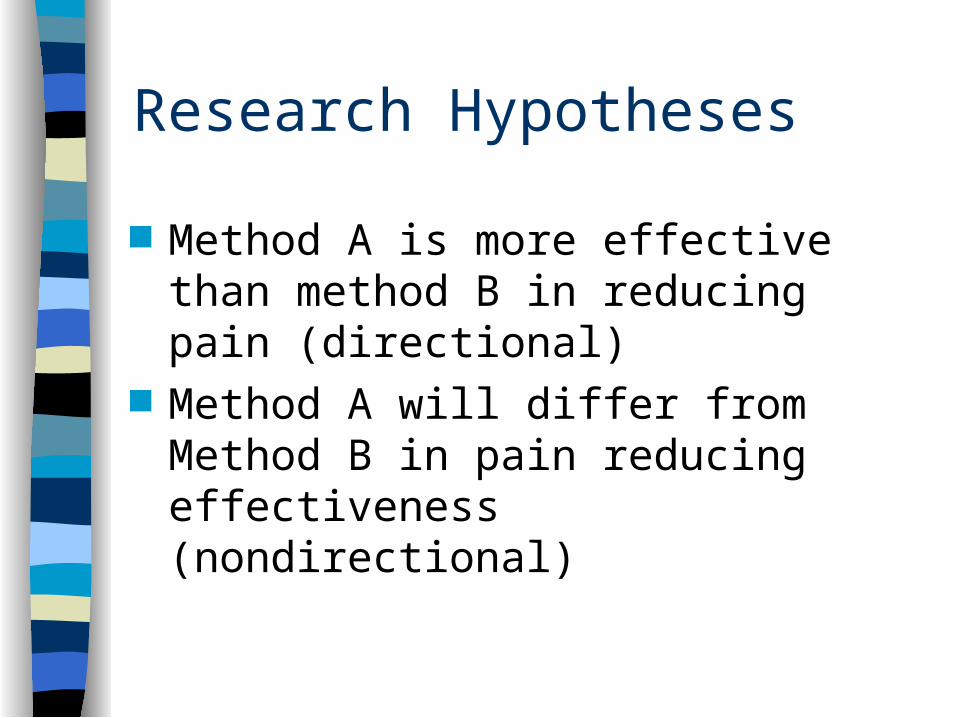
Research Hypotheses
Method A is more effective than method B in reducing pain (directional)
Method A will differ from Method B in pain reducing effectiveness (nondirectional)
Null Hypothesis
Method A equals Method B in pain reduction effectiveness.(any difference is due to chance alone
This must be statistically tested to say that something else beside chance is creating any difference in results
Type I and Type II errors
Type I--a decision to reject the null hypothesis when it is true. A researcher conludes that a relationship exists when it does not.
Type II--a decisioon to accept the null hypothesis when it is false. The researcher concludes no relationship exists when it does.
Level of Significance
Degree of risk of making a Type one error. (saying a treatment works when it doesn’t or that a relationship exists when there is none)
Signifies the probability that the results are due to chance alone.
p=.05 means that the probability of the results being due to chance are 5%