Embed Size (px)
Citation preview
Statistics & Their Use
OBJECTIVES Understand the reason for and use of
statistics Review descriptive statistics
Measures of central tendency Measures of variability Measures of relationship
Inferential Statistics Parametric Non-parametric
What are statistics for?Painting a mathematical picture….or
simplifying large sets of data Identifying if relationships existEstablishing the probability of a cause
and effect relationshipETC…..
How many tests are there?There are well over 100 statistical
calculations and tests
However, many are rarely if ever used
Therefore, we will focus on those that are used most often…
Which tests should you know?
The New England Journal of Medicine from Vol 298 through 301 – (760 articles) were reviewed to determine what statistical tests are most important to learn to understand the scientific literature.
FINDINGS “A reader who is conversant with some
simple descriptive statistics (percentages, means, and standard deviations) has full statistical access to
58% of the articles.
Findings “Understanding t-test increases this
access to 67 percent. “Familiarity with each additional test
gradually increases the percentage of accessible articles.”
Descriptive StatisticsPurpose --- To simply describe things
the way they areNOT to establish a possible cause &
effect relationship
Inferential StatisticsPurpose --- In experimental research
uses a sample of the population – inferential statistics permits the researcher to generalize from the sample data to the entire population.
Aids the researcher in determining if cause and effect relationships exist.

Descriptive Statistics
Measures of Central Tendency
Mode --- most frequently occurring score
Median (Mdn) --- score physically in the middle of all scores
Mean (M or X) --- arithmetic mean--- i.e. sum of scores divided by the number of scores
Mean Is generally the preferred measure of
central tendency Is used frequently for other calculations
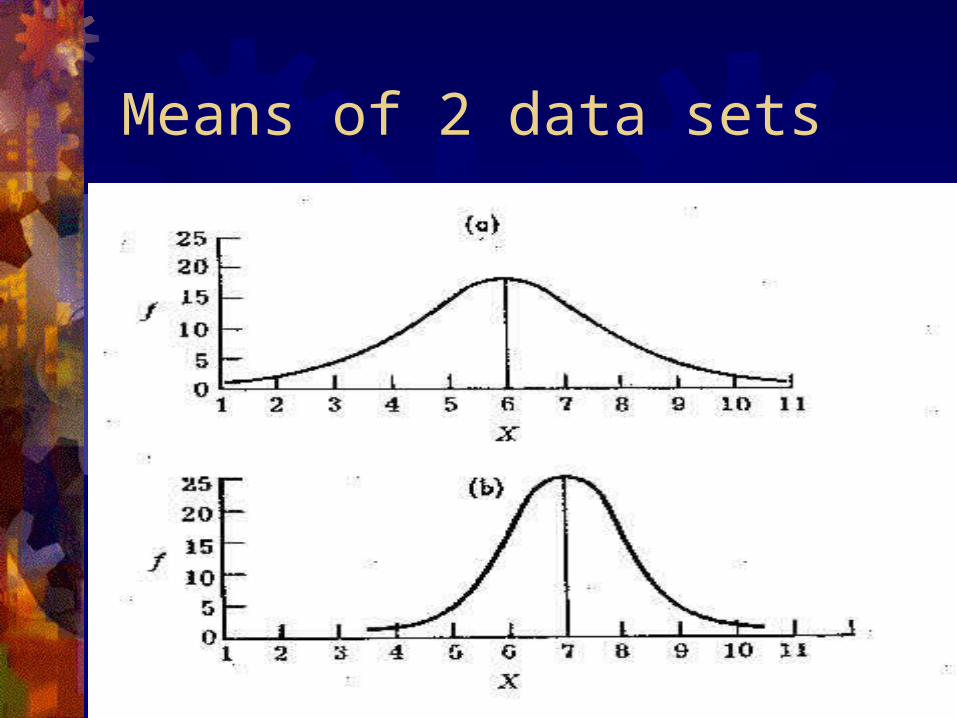
Means of 2 data sets
Measures of Variability (dispersion)
Measures of Variability If scores are similar….ergo they have low
variability (homogeneous) If scores are dissimilar…ergo they have high
variability (heterogeneous) Two sets of scores may have the exact same
mean but one set may have low variability and the other very high….therefore… measures of variability help DESCRIBE these differences
RangeSimplest measure of variabilityThe difference between the lowest and
highest scoreUsually reported in the literature as
“range” but on occasion as “R”The range is an unstable calculation
because it is only based upon 2 scores
Standard Deviation & VarianceThese measures are calculated based
upon ALL data scores and are therefore better represent the data set
They are used with other statistical calculations
Variance Related to the amount that an individual
score VARIES from the mean.

Standard Deviation Is the square root of the variance

Standard Deviation (aka S.D.)
CorrelationsMeasures of central tendency and
variability describe only ONE variableCORRELATIONS describe the
relationship between TWO variablesCorrelations can be positive, negative or
zeroCorrelations range from +1 through -1
Correlations+.95, +.87, High positive correlations+.19, +.22, Low positive correlations+.03, -.02, No relationship -.23, -.19, Low negative correlations -.94, -.88, High negative correlations
Spearman’s Rho & PearsonPearson’s product-moment correlation
is a parametric test (for continuous data….blood pressure, weight, etc.)
Spearman’s Rho is non-parametric ( for rank data…male/female, etc.)
Kappa value ---used often for determining degree of inter and intra-examiner agreement
Kappa Commonly used in chiropractic & medical literature
to convey the degree of interexaminer and/or intraexaminer reliability
Interexaminer– two or more examiners checking/evaluating or testing for the same finding
Intraexaminer– one examiner checking/evaluating or testing for the same finding on two different occasions
Kappa calculates the degree of agreement between the first and second check/evaluation or test
Summary Descriptive statistics do just that They describe the distribution of data toward
the center (mean, median, mode) and they describe the variability away from the center (range, variance, standard deviation)
They also determine if there is a relationship between 2 (or more) variables
Summary Of the 100+ statistical tests only a few are
frequently used You can intelligently read and understand
nearly 70% of the biomedical literature with an understanding of descriptive statistics and the t-test
Correlations are an important and often used type of descriptive statistics
Descriptive Statistics must be well understood in order to understand inferential statistics

Making Too Much from Research (even if it is well controlled research)

Inferential Statistics
Parametric versus Nonparametric
Assumptions---Parametric Parametric Inferential Statistics --- assumes
that the sample comes from a population that is NORMALLY DISTRUBUTED & that the variance is similar (homogeneous) between sample and population (or 2 populations)
The tests are very POWERFUL ---I.e. can recognize if there is a significant change based upon the experimental manipulation
Nonparametric Inferential Statistics --- no AssumptionsMakes no assumptions about the
distribution of the data (distribution free)So it does not assume that there is a
normal distribution of the data…..etc. Is less powerful…meaning that a
greater difference (or change) needs to be present in the data before a significant difference can be detected

Usage “Generally, it is agreed that unless there
is sufficient evidence to suggest that the population is extremely non-normal and that the variances are heterogeneous, parametric tests should be used because of their additional power”
Parametric Statistics
3 most commonly used tests
& some related concepts commonly expressed in the literature
Statistical & Medical Significance It is important to keep in mind that
statisticians use the word “significance” to represent the results of testing a hypothesis
In everyday language and in the clinical setting, a “significant” finding or treatment relates to how “important” it is from a clinical and not a mathematical perspective
4 Possibilities Medically & statistically significant Medically but not statistically significant Statistically but not medically significant Neither statistically or medically significant
Very large groups of subjects can reflect statistically significant differences between two groups …but they may not be medically significant from the perspective of cost, risks, policies etc.
Parametric Statistical Tests
t-Test aka Student t-Test
ANOVA
Analysis of covariance
t- Test Developed by Gosset under the pseudonym
Student 3 different versions of the t-tests that apply to
3 different research designs All three forms of the t-Test are based upon
the MEANS of two groups The larger the difference in the calculated t
scores, the greater the chance that the null hypothesis can be rejected
t-Test3 different general ways to use the
student t-test2 variations of each…dependent upon
the type of hypothesis the researcher uses
The hypothesis can either be directional or non-directional
Directional / Non-directional Hypothesis “Directional” means that the researcher
anticipates or expects a specific positive or negative impact from the treatment (or other independent variable)
“Non-directional” means that the researcher does not know what to expect. Perhaps the treatment will make the patient better or worse

Critical Value The researcher must establish the value at
which they will consider the results “significant”…this is referred to as the CRITICAL VALUE
There is some subjective and somewhat arbritrary decision to be made in this regard by the researcher
The customary critical values are either P<.05 or P<.01 but on occasion you will see P<.10

Directional Hypothesis/Non… & Critical ValueThese two decisions need to be made
before the study is started and will determine to some degree if your results will be significant
…
t-Test #1 Single Sample Compares the sample to the mean value of
the population Is not used often because the mean for the
population if usually not known E.g. Stanford Binet I.Q. test….has a mean of
100 and 1 S.D. of 16 (although not everyone in the U.S. has had the test, enough have been tested to accept the data as representative
t-Test #2 Correlated Groups Used when subjects serve as their own controls
(or when they are matched to very similar subjects)
For each subject we could have a pre and a post treatment score (e.g. pain, blood pressure, algometer, cholesterol levels, range of motion…)
The null hypothesis would be that the difference between pre and post scores would be 0 (treatment is not effective)
If the difference is sufficient, the null hypothesis can be rejected
T-Test #3 Independent t-TestAka independent groups t-TestMost commonly usedUsed when you have 2 groups
(2samples) out of an entire populationHo = X control = X treatment
Analysis of Variance (ANOVA)The t-Test only allows us to compare 2
groupsWhat if we have a study comparing 2 or
more types of treatment with a controls of both no treatment and placebo?
ANOVA is designed to handle multiple groups similar to what the t-Test does with 2 groups

Analysis of Covariance (ANCOVA)Sometimes studies nuisance variables
impact the dependent variable (outcome measures) but not the dependent variable (e.g. treatment).
These unwanted variables can interfere with our analysis of the data
Example…
Example We want to see if one of two treatment protocols will
have a positive effect upon patients with low back pain The patients are randomly assigned to the treatment
and control groups We realize from the histories that there are factors that
impact recovery from low back pain that we have not accounted for (e.g. obesity, smoking, occupation, age etc. etc.) These factors could impact rate of recovery (dependent variables)
The Analysis of Covariance pulls those possible confounding… nuisance factors out

Nonparametric TestsWilcoxon Signed Rank Test—Wilcoxon Ranked Sum Test—
equivalent to the Student t-testKruskal-Wallis Test– equivalent to the
one-way analysis of variance
Summary “Significance” is used in different ways…
statistical & medical The most commonly used inferential statistical
test is the Student t-Test (which has 3 versions depending what you are comparing) it only compares 2 group(s)/sample
Hypothesis can be directional or non-directional…
Critical value is established by the researcher BEFORE the study is started (.01, .05, .10)
Summary….contd.Parametric tests assume several things
related to a relatively normal distribution of data
Analysis of variance is used for comparing more than two variables
Analysis of Covariance is used to account for and remove the effects of nuisance variables

Next WEEKS Class