Embed Size (px)
Citation preview

Statistics Tools for Risk
Statistics...
A set of mathematical procedures for describing, synthesizing, analyzing, and interpreting quantitative data
…the selection of an appropriate statistical technique is determined by the research design, hypothesis, and the data collected
Uses of Statistics
Statistics is one of the tools used to make decisions in business
We apply statistical concepts in our lives As a student of business or economics,
basic knowledge and skills to organize, analyze, and transform data and to present the information.
1-3
Why Study Statistics?
1. Numerical information is everywhere 2. Statistical techniques are used to make decisions that
affect our daily lives 3. The knowledge of statistical methods will help you
understand how decisions are made and give you a better understanding of how they affect you.
No matter what line of work you select, you will find
yourself faced with decisions where an understanding of data analysis is helpful.
1-4
Who Uses Statistics?
Statistical techniques are used extensively by marketing, accounting, quality control, consumers, professional sports people, hospital administrators, educators, politicians, physicians, etc...
1-5
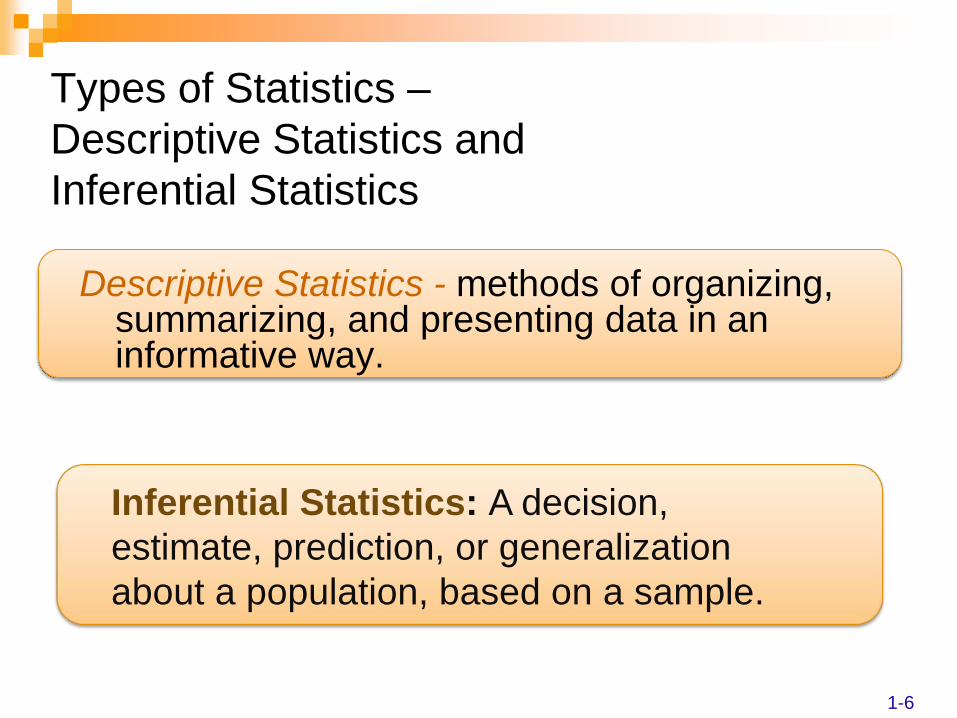
Types of Statistics – Descriptive Statistics and Inferential Statistics
Descriptive Statistics - methods of organizing, summarizing, and presenting data in an informative way.
1-6
Inferential Statistics: A decision, estimate, prediction, or generalization about a population, based on a sample.
Why take a sample instead of studying every member of the population?
1. Prohibitive cost of census 2. Destruction of item being studied may
be required 3. Not possible to test or inspect all
members of a population being studied
1-7
Central Tendency - Measures of Location The purpose of a measure of location is to
pinpoint the center of a distribution of data. There are many measures of location. We
will consider five: 1. The arithmetic mean, 2. The weighted mean, 3. The median, 4. The mode, and 5. The geometric mean
3-8
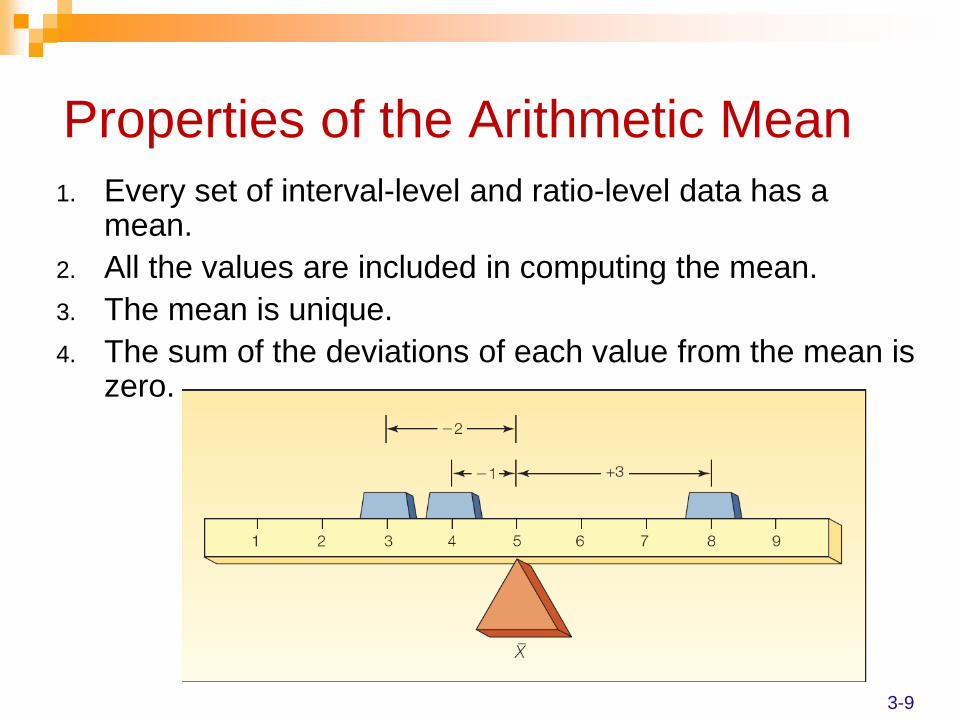
Properties of the Arithmetic Mean 1. Every set of interval-level and ratio-level data has a
mean. 2. All the values are included in computing the mean. 3. The mean is unique. 4. The sum of the deviations of each value from the mean is
zero.
3-9
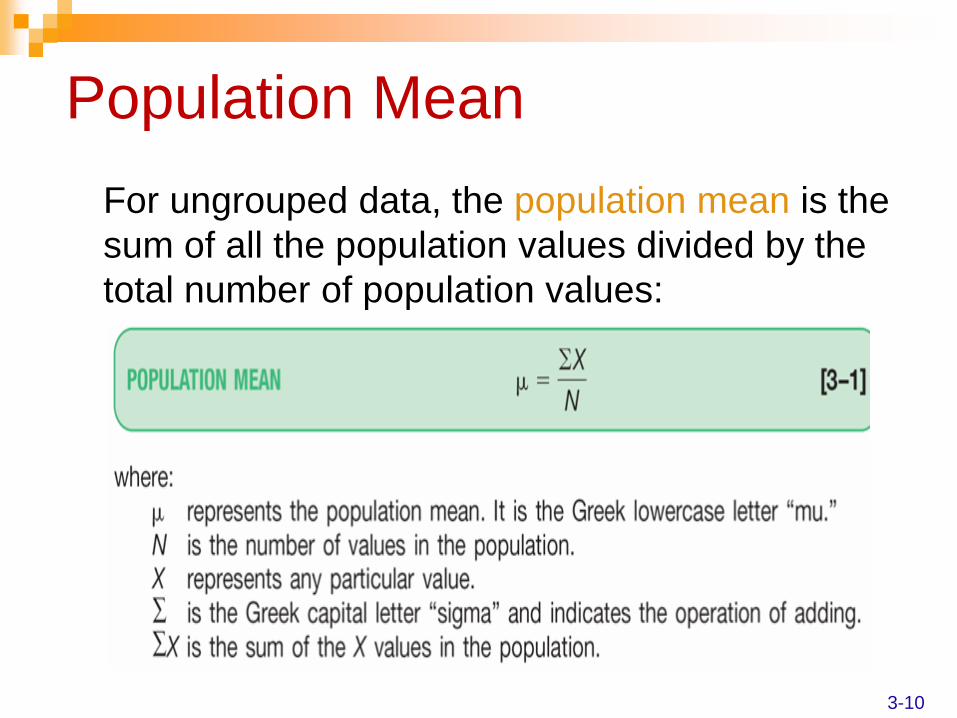
Population Mean For ungrouped data, the population mean is the
sum of all the population values divided by the total number of population values:
3-10
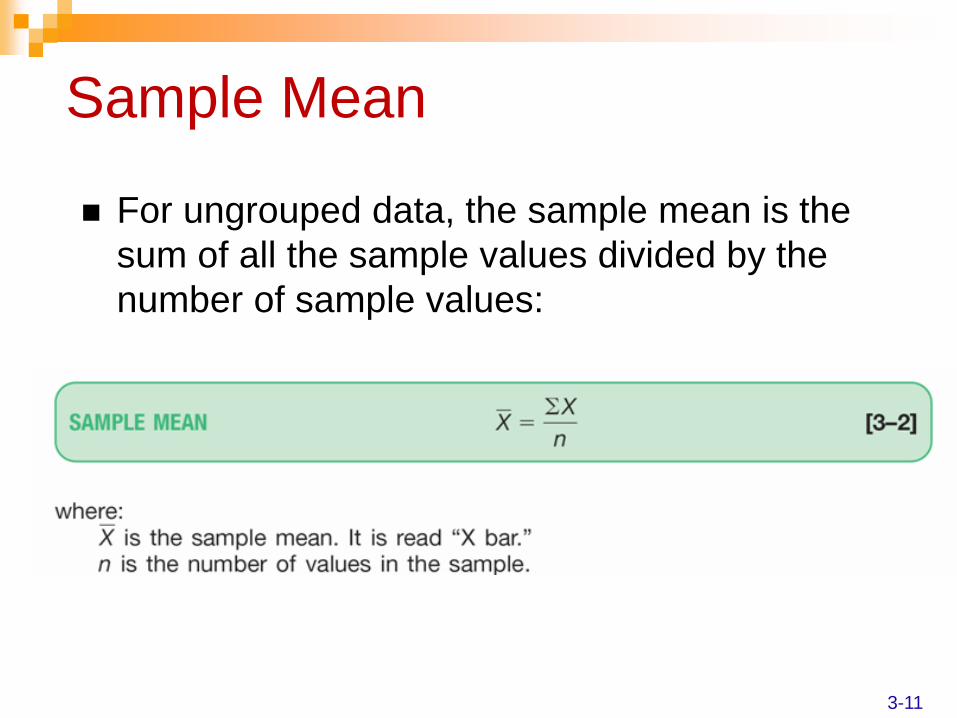
Sample Mean
For ungrouped data, the sample mean is the sum of all the sample values divided by the number of sample values:
3-11
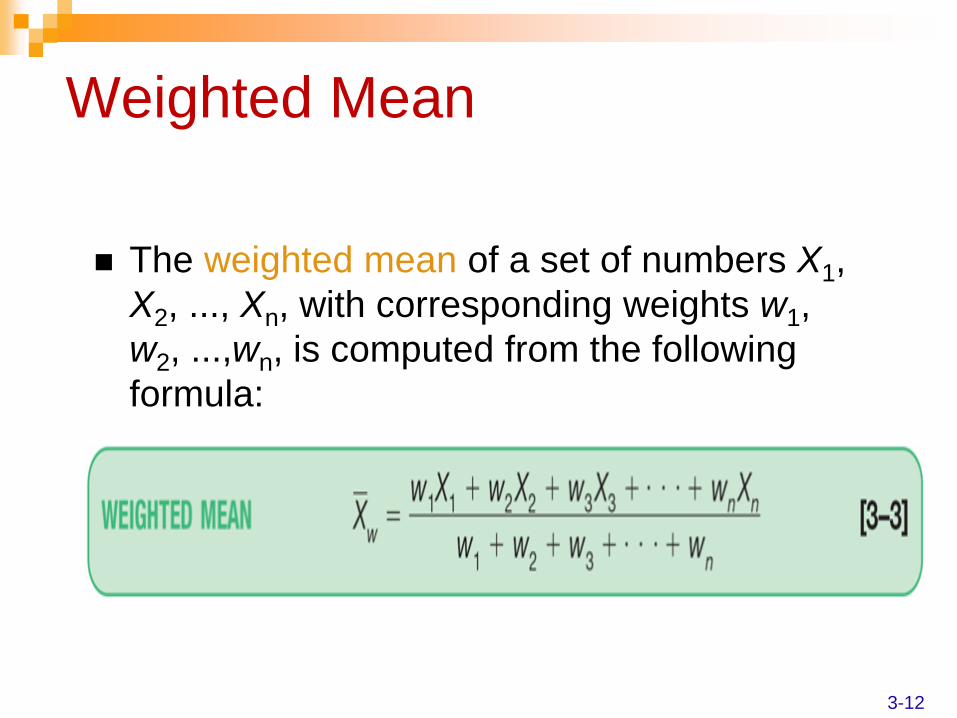
Weighted Mean
The weighted mean of a set of numbers X1, X2, ..., Xn, with corresponding weights w1, w2, ...,wn, is computed from the following formula:
3-12
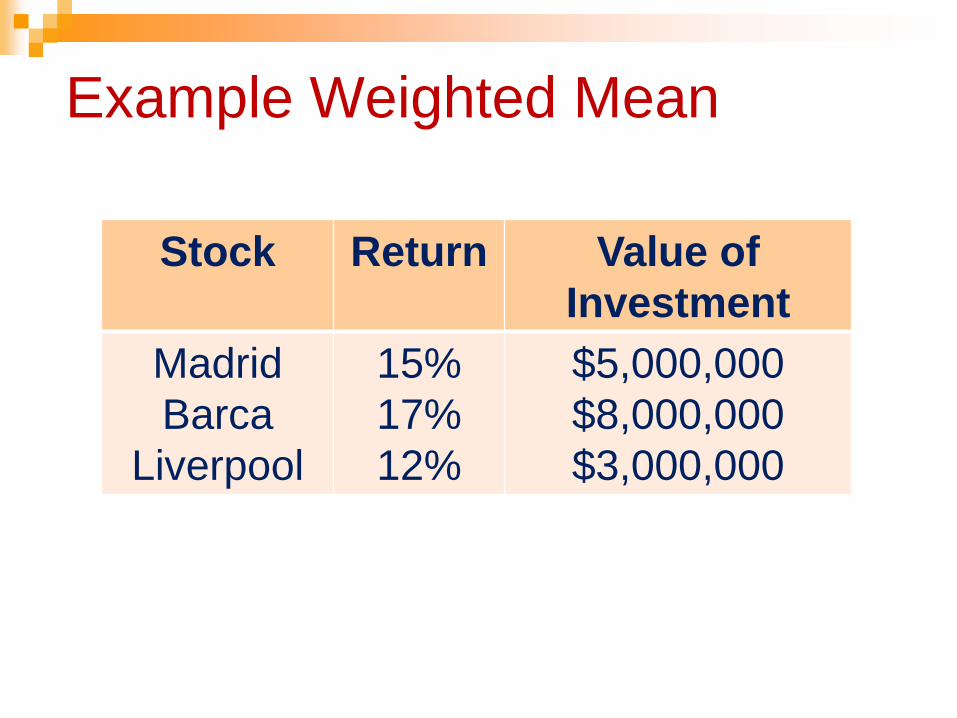
Example Weighted Mean
Stock Return Value of Investment
Madrid Barca
Liverpool
15% 17% 12%
$5,000,000 $8,000,000 $3,000,000
The Median
PROPERTIES OF THE MEDIAN 1. There is a unique median for each data set. 2. It is not affected by extremely large or small values and is
therefore a valuable measure of central tendency when such values occur.
3. It can be computed for ratio-level, interval-level, and ordinal-level data.
4. It can be computed for an open-ended frequency distribution if the median does not lie in an open-ended class.
MEDIAN The midpoint of the values after they have been ordered from the smallest to the largest, or the largest to the smallest.
3-14
The Mode
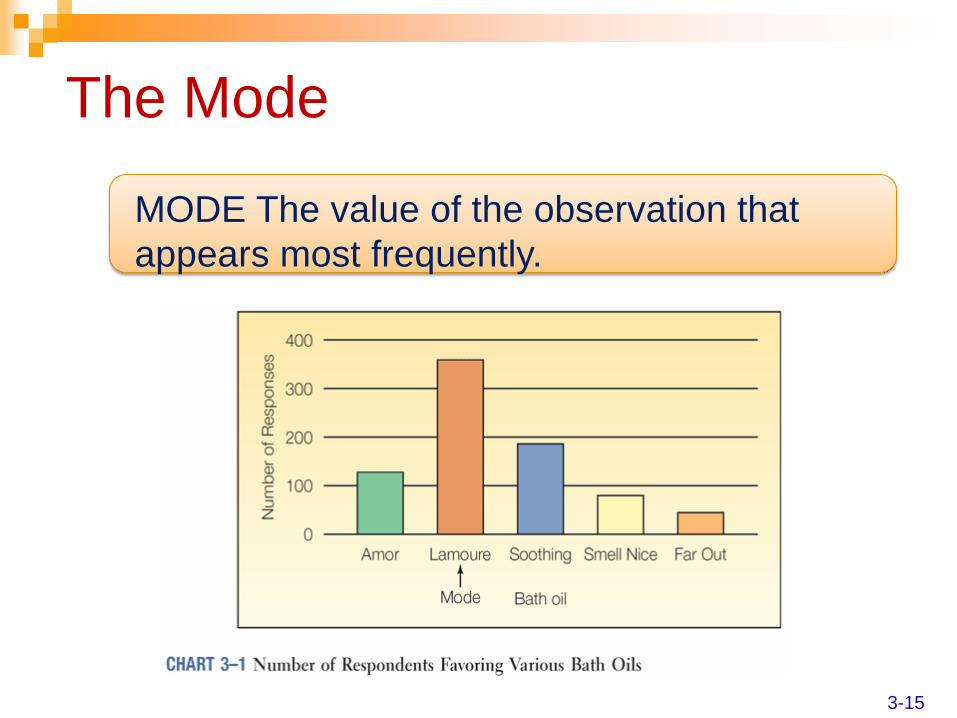
MODE The value of the observation that appears most frequently.
3-15
The Geometric Mean
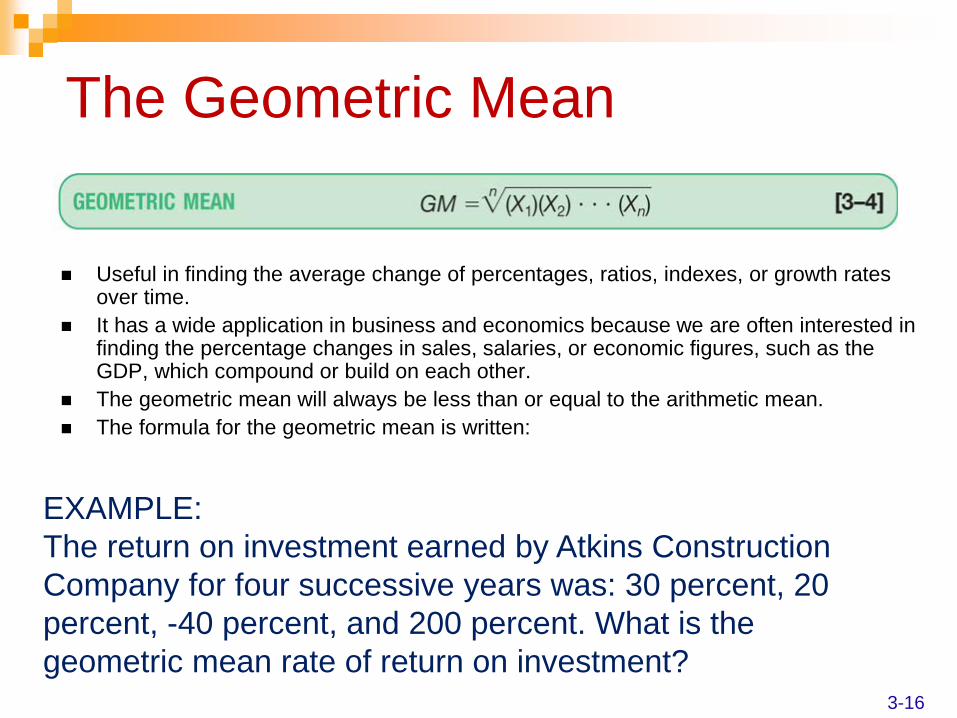
Useful in finding the average change of percentages, ratios, indexes, or growth rates over time.
It has a wide application in business and economics because we are often interested in finding the percentage changes in sales, salaries, or economic figures, such as the GDP, which compound or build on each other.
The geometric mean will always be less than or equal to the arithmetic mean. The formula for the geometric mean is written:
EXAMPLE: The return on investment earned by Atkins Construction Company for four successive years was: 30 percent, 20 percent, -40 percent, and 200 percent. What is the geometric mean rate of return on investment?
3-16
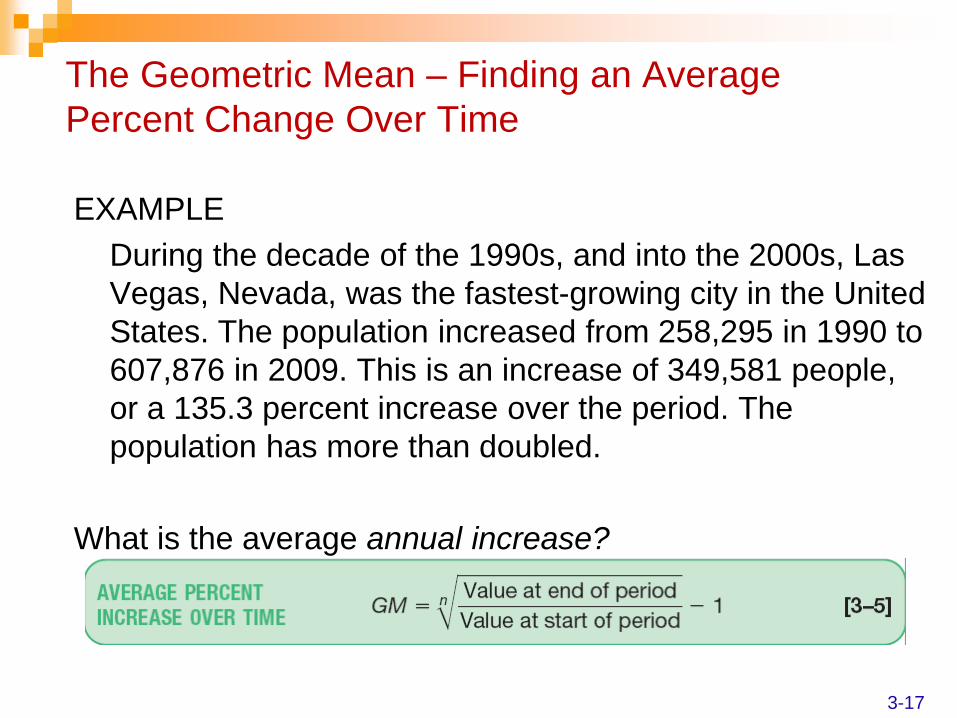
The Geometric Mean – Finding an Average Percent Change Over Time
EXAMPLE During the decade of the 1990s, and into the 2000s, Las
Vegas, Nevada, was the fastest-growing city in the United States. The population increased from 258,295 in 1990 to 607,876 in 2009. This is an increase of 349,581 people, or a 135.3 percent increase over the period. The population has more than doubled.
What is the average annual increase?
3-17
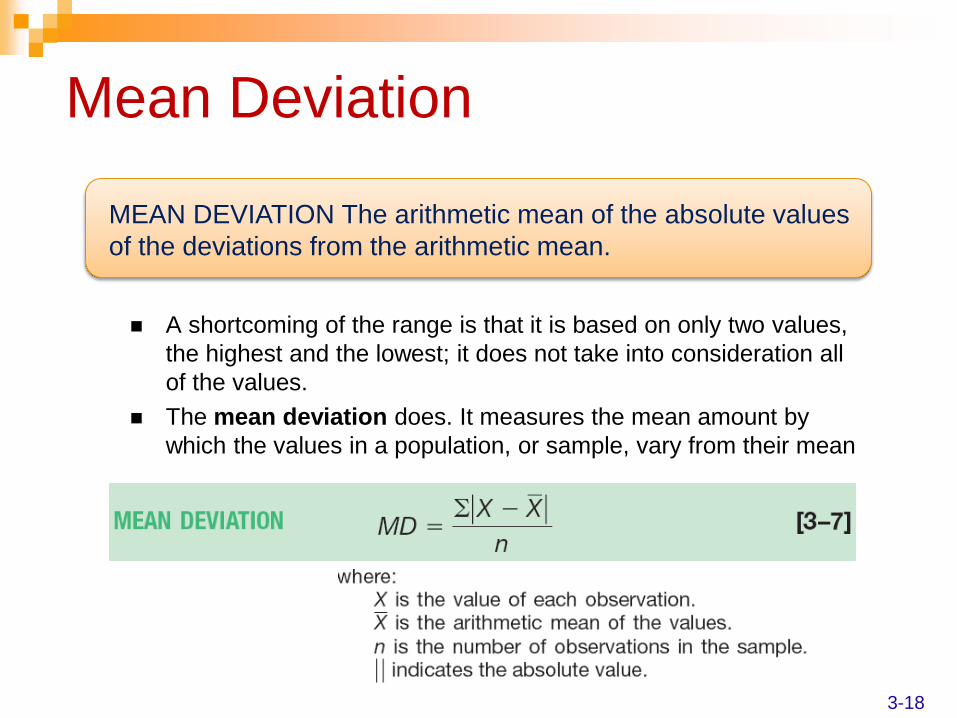
Mean Deviation
A shortcoming of the range is that it is based on only two values, the highest and the lowest; it does not take into consideration all of the values.
The mean deviation does. It measures the mean amount by which the values in a population, or sample, vary from their mean
MEAN DEVIATION The arithmetic mean of the absolute values of the deviations from the arithmetic mean.
3-18
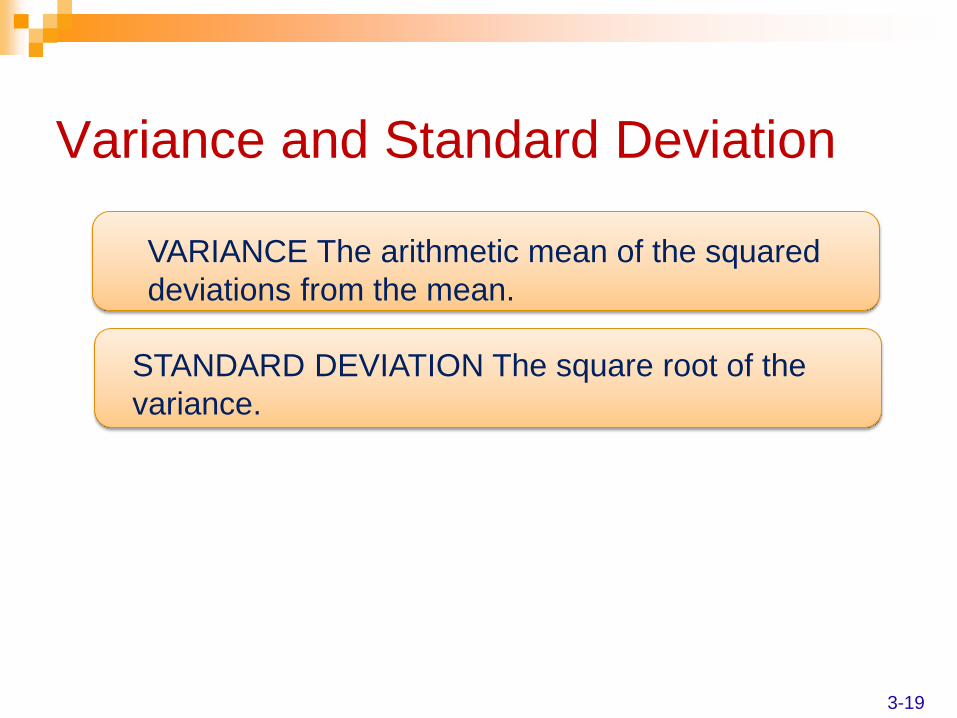
Variance and Standard Deviation
VARIANCE The arithmetic mean of the squared deviations from the mean.
STANDARD DEVIATION The square root of the variance.
3-19
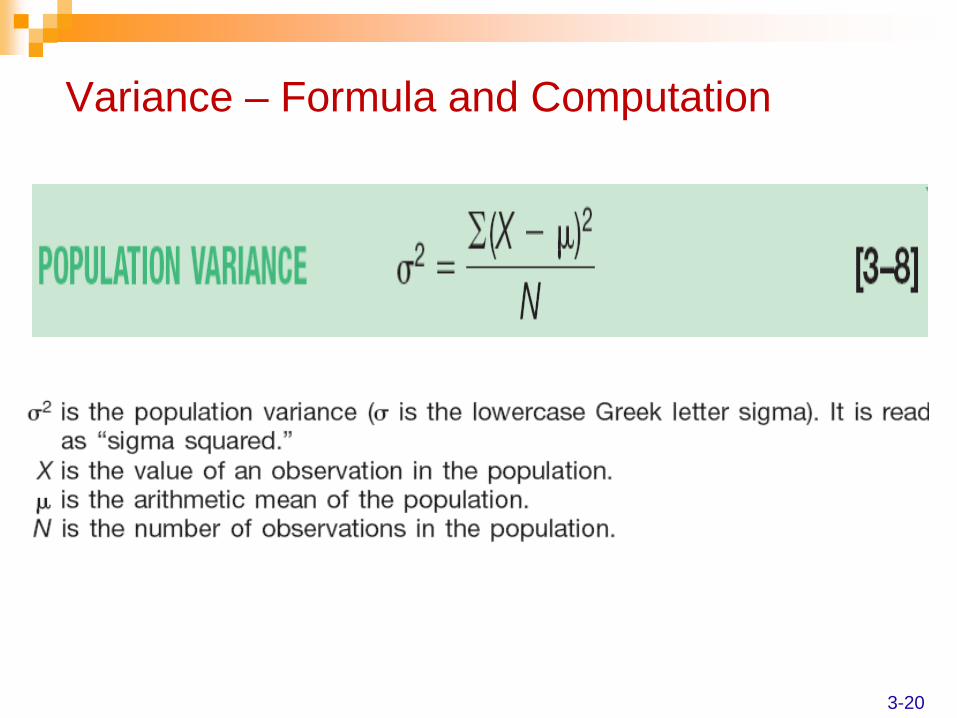
Variance – Formula and Computation
3-20
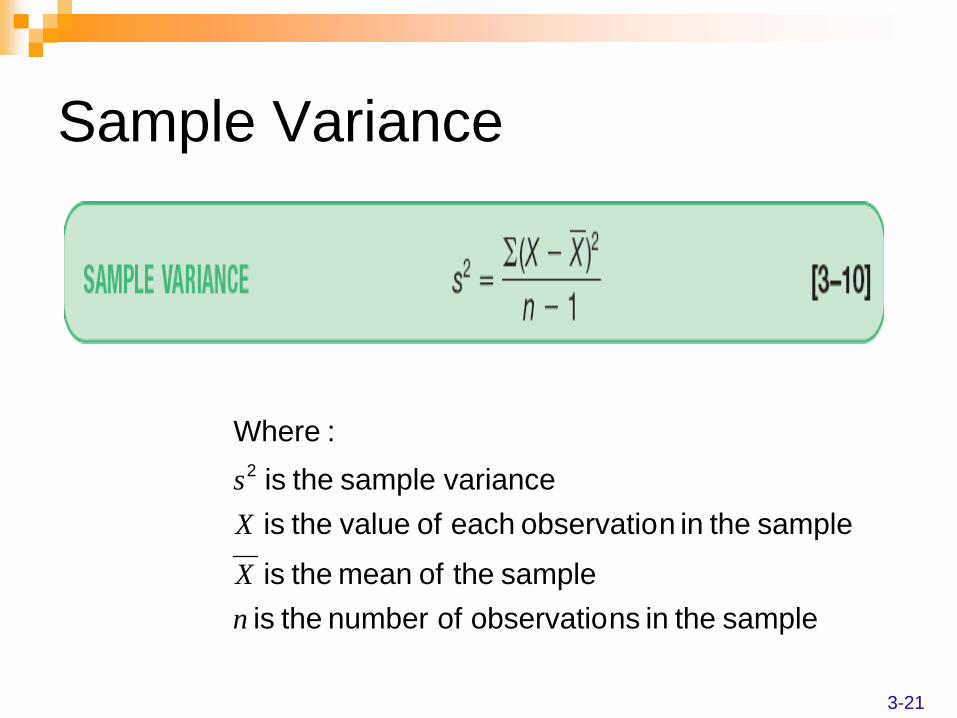
Sample Variance
sample the in nsobservatio of number the is sample the of mean the is
sample the in nobservatio each of value the is variance sample the is
:Where2
nX
Xs
3-21
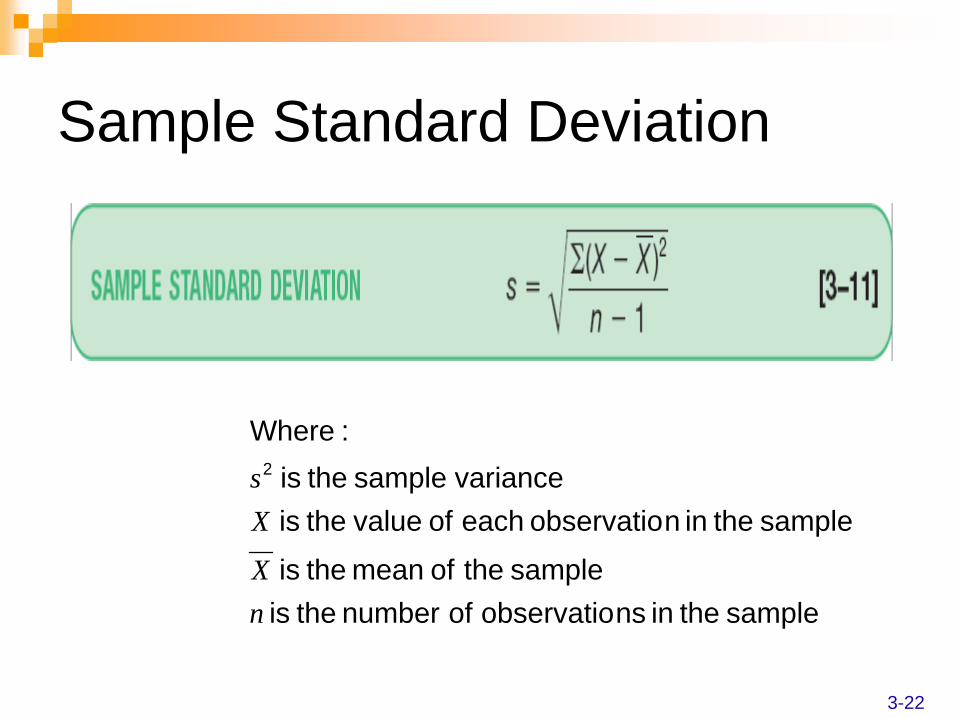
Sample Standard Deviation
sample the in nsobservatio of number the is sample the of mean the is
sample the in nobservatio each of value the is variance sample the is
:Where2
nX
Xs
3-22
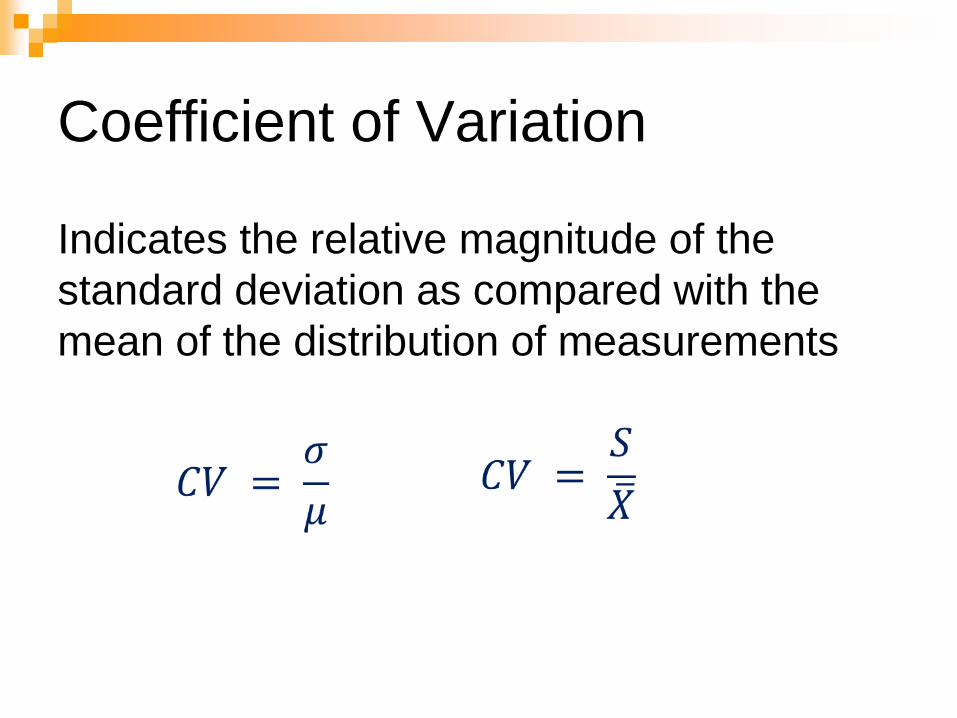
Coefficient of Variation
Indicates the relative magnitude of the standard deviation as compared with the mean of the distribution of measurements
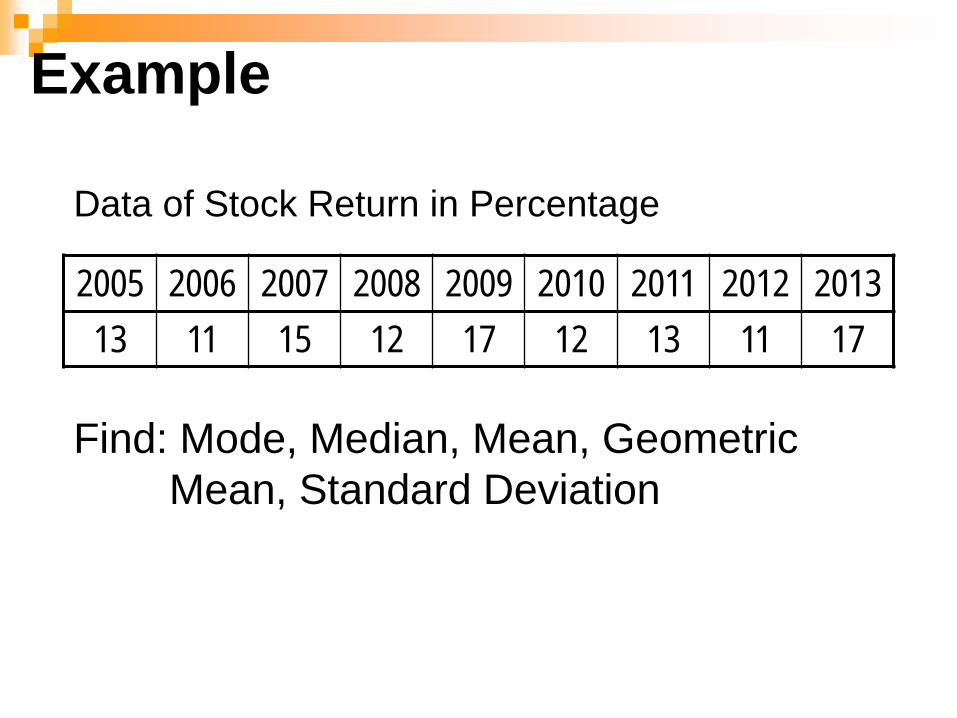
Example
2005 2006 2007 2008 2009 2010 2011 2012 2013 13 11 15 12 17 12 13 11 17
Data of Stock Return in Percentage
Find: Mode, Median, Mean, Geometric Mean, Standard Deviation
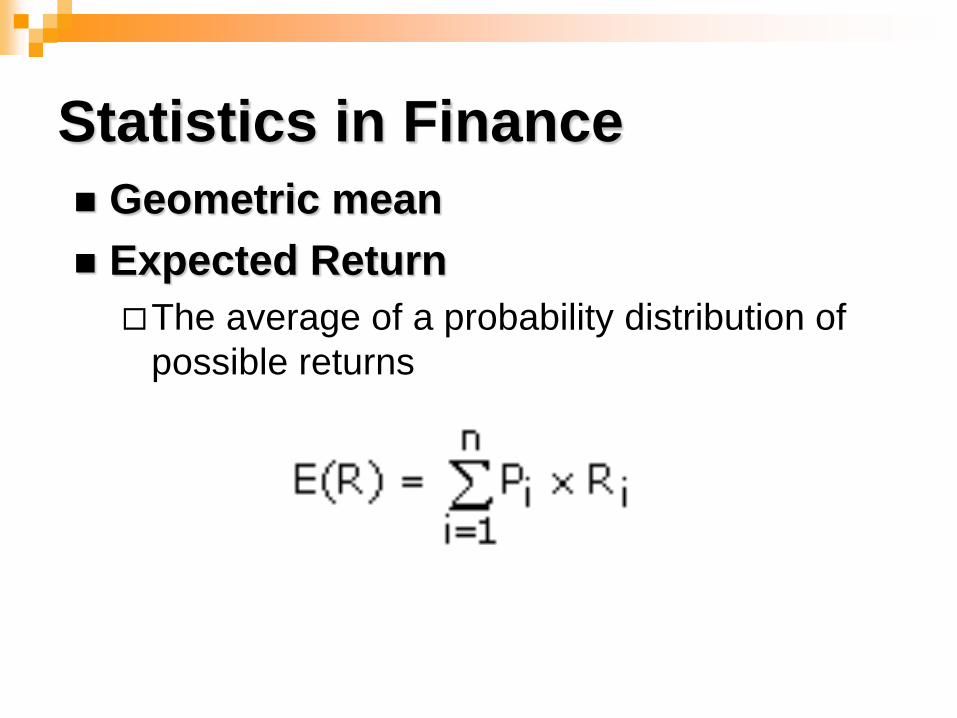
Statistics in Finance Geometric mean Expected Return The average of a probability distribution of
possible returns
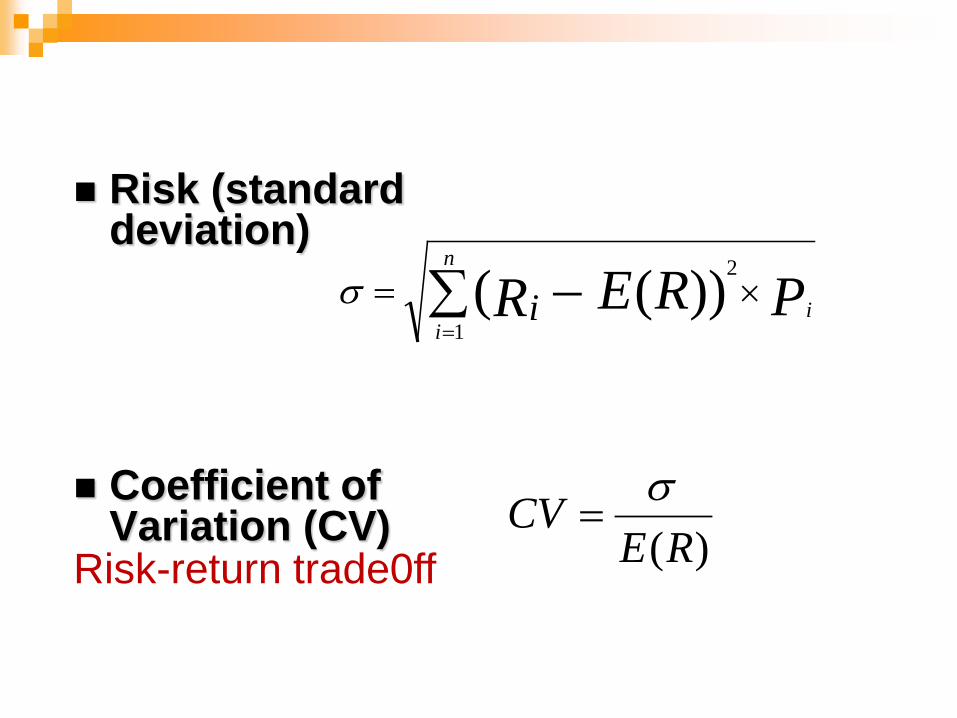
Risk (standard deviation)
Coefficient of Variation (CV)
∑ −=
×=n
iiPRERi
1
2))((σ
)(RECV σ
=Risk-return trade0ff
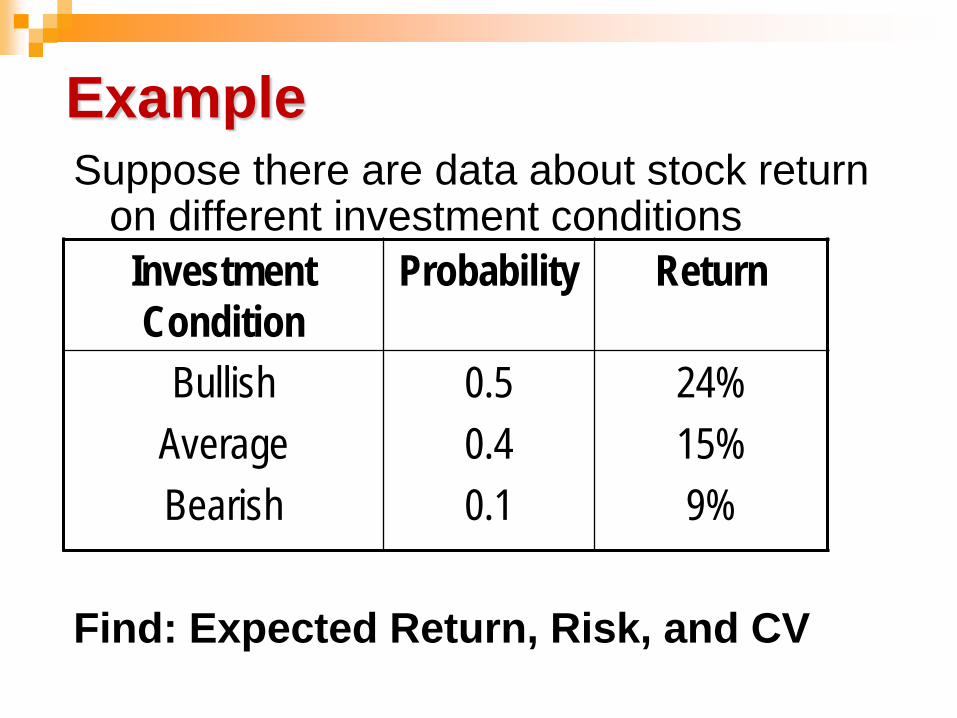
Example Suppose there are data about stock return
on different investment conditions Investment Condition
Probability Return
Bullish Average Bearish
0.5 0.4 0.1
24% 15% 9%
Find: Expected Return, Risk, and CV