Embed Size (px)
Citation preview
Statistiquesdes transportsen Amérique du Nord
North AmericanTransportationin Figures
El Transportede América del Norteen Cifras
English edition

iNorth American Transportation in Figures
�North
AmericanTransportation
in FiguresBTS00-05
North American Transportation in Figures ii �
Instituto Mexicano del TransporteCarretera Querétaro-Galindo Km.1276700 Sanfandila, Pedro Escobedo,Querétaro, Qro.
Telephone: (4) 216-9777(from within Mexico)
(4) 216-9646(from within Mexico)
(4) 216-9597(from within Mexico)
Fax: (4) 216-9671(from within Mexico)
E-mail (product orders):[email protected]@imt.mx
Web site: www.imt.mx
All material contained in this report is inthe public domain and may be used andreprinted without special permission;citation as to source is required.
Recommended Citation
U.S. Department of Transportation,Bureau of Transportation Statistics,U.S. Department of Commerce, Census Bu-reau; Statistics Canada; Transport Canada;Instituto Mexicano del Transporte;Instituto Nacional de Estadística, Geografíae Informática; and Secretaría deComunicaciones y Transportes, NorthAmerican Transportation in Figures, BTS00-05, Washington, DC: 2000
To obtain copies of this report, usersmay contact any of the agencies listedbelow:
Canada
Statistics CanadaDissemination Division120 Parkdale AvenueOttawa, OntarioK1A 0T6
Telephone: (1-800) 700-1033(from within Canadaor the United States)
(613) 951-7277(from within Canadaor the United States)
Fax: (1-800) 889-9734(from within Canadaor the United States)
(613) 951-1584(from within Canadaor the United States)
E-mail (product orders):[email protected]
Web site: www.statcan.ca
MexicoSecretaría de Comunicaciones y TransportesDirección General de PlaneaciónDirección de Información ProgramáticaAv. Insurgentes Sur y Nebraska No. 825, 1er pisoCol. NápolesDel. Benito JuárezMéxico, D.F.CP 03810
Telephone: (5) 536-9189(from within Mexico)
(5) 543-9831(from within Mexico)
Fax: (5) 543-7283(from within Mexico)
Web site: www.sct.gob.mx
iiiNorth American Transportation in Figures
�
Instituto Nacional de Estadística, Geografía e InformáticaDirección General de DifusiónDirección de Atención a Usuarios y ComercializaciónEdificio SedeAv. Héroe de Nacozari Sur No. 2301Fracc. Jardines del Parque20270, Aguascalientes, Ags.
Telephone: (4) 918-2998(from within Mexico)
E-mail (product orders):[email protected]
Web site: www.inegi.gob.mx
United States
Customer ServiceBureau of Transportation StatisticsU.S. Department of Transportation400 Seventh Street SWWashington, DC 20590
Telephone: (202) 366-3282(from within the UnitedStates or Canada)
Fax: (202) 366-3640(from within the UnitedStates or Canada)
E-mail (product orders):[email protected]
Web site: www.bts.gov
U.S. Census Bureau1201 E. 10th StreetBuilding 71 PublicationsJeffersonville, IN 47132
Telephone: (812) 218-3690

North Amer ican Transpor ta t ion in F iguresiv
vNorth American Transportation in Figures
�
Canada
Transport Canada
David M. Collenette,Minister
Margaret Bloodworth,Deputy Minister
Policy Group
Louis Ranger,Assistant Deputy Minister
Roger Roy,Director General,Economic Analysis Directorate
United States
U.S. Department ofTransportation
Rodney E. Slater,Secretary
Mortimer L. Downey,Deputy Secretary
Bureau of TransportationStatisticsAshish K. Sen,Director
Richard R. Kowalewski,Deputy Director
Susan J. Lapham,Associate Director for StatisticalPrograms & Services
Mexico
Secretaría de Comunicacionesy Transportes
Carlos Ruiz Sacristán,Secretary
Aarón Dychter Poltolarek,Sub-Secretary of Transportation
Manuel Rodríguez Morales,Sub-Secretary for Infrastructure
General Coordination ofPlanning and SCT Centers
Juan Rodríguez Castañeda,Coordinator General of Planningand Centers
Abraham Zamora Torres,Director General of Planning
Adolfo Zagal Olivares,Director of Program Information
Instituto Mexicano delTransporte
Alfonso Rico Rodríguez,Director General
Roberto Aguerrebere Salido,Coordinator of TransportIntegration
i d e n t i f i c a t i o na g e n c y
Statistics Canada
Ivan P. Fellegi,Chief Statistician
Ray Ryan,Assistant Chief Statistician,Business and Trade Statistics
George Andrusiak,Director General,Industry Statistics
Tricia Trépanier,Director,Transportation Division
Instituto Nacional deEstadística, Geografíae Informática
Antonio Puig Escudero,President
Miguel Cervera Flores,Director General of Statistics
Francisco Guillén,Director General of NationalAccounts,Socioeconomic Studies and Prices
Gabriel Maldonado Lee,Director of Sector,State and Regional Statistics
U.S. Department of CommerceNorman Y. Mineta,Secretary
Robert L. Mallett,Deputy Secretary
U.S. Census Bureau
Kenneth Prewitt,Director
William G. Barron,Deputy Director
Paula J. Schneider,Principal Associate Director forPrograms
Frederick T. Knickerbocker, AssociateDirector for Economic Programs
Thomas L. Mesenbourg,Assistant Director for EconomicPrograms
North American Transportation in Figures vi �
iv
North American TransportationStatistics Project
A tricountry working group was responsible for
this project. Agencies represented included Sta-
tistics Canada and Transport Canada from
Canada; the Secretaría de Comunicaciones y
Transportes, the Instituto Mexicano del
Transporte and the Instituto Nacional de
Estadística, Geografía e Informática (INEGI) from
Mexico; and the Bureau of Transportation Sta-
tistics and the Census Bureau from the United
States. The final product, however, would not
have been possible without the many substan-
tial contributions from people in each country
who were not members of the working group,
and who are represented by the supporting agen-
cies and organizations listed below.
Coordination
Lisa Randall, Bureau of TransportationStatistics, U.S. Department ofTransportation
North American TransportationStatistics Project Working GroupMembers
Roberto Aguerrebere Salido, InstitutoMexicano del Transporte
Jeff Allen, Statistics Canada
Miguel Angel Backhoff, Instituto Mexicanodel Transporte
Irwin Bess, Statistics Canada
Ruth Bramblett, Census Bureau, U.S.Department of Commerce
Carol Brandt, Bureau of TransportationStatistics, U.S. Department ofTransportation
Josefina Flores, Secretaría deComunicaciones y Transportes
Alicia Guerrero, Instituto Nacional deEstadística, Geografía e Informática
Enrique Juárez, Secretaría deComunicaciones y Transportes
Peter Kennedy, Transport Canada
John Lawson, Transport Canada
Felipe Leyva, Instituto Nacional de Estadística,Geografía e Informática
José Luis Bermúdez, Instituto Mexicano delTransporte
Victor Palacios Aguilar, Secretaría deComunicaciones y Transportes
Gilles Paré, Statistics Canada
Brigitte Parent, Transport Canada
Lisa Randall, Bureau of TransportationStatistics, U.S. Department of Transportation
Oscar Rico, Instituto Mexicano delTransporte
Norman Tague, Maritime Administration,U.S. Department of Transportation
Rolf Schmitt, Bureau of TransportationStatistics, U.S. Department ofTransportation
Garry Tulipan, Transport Canada
Thomas Zabelsky, Census Bureau, U.S.Department of Commerce
The contributions of the following people tothis project are also gratefully acknowledged:Felix Ammah-Tagoe, Audrey Buyrn, BingsongFang, Roberto Flores, Xiaoli Han, William Mallett,Erika McDonald and Tonia Rifaey.
c k o w l e d g m e n t sa n
viiNorth American Transportation in Figures
�
Supporting Agencies andOrganizations
Canada
Canadian National Railways
Canadian Pacific Railway Company
Natural Resources Canada
NAV CANADA
Saint Lawrence Seaway ManagementCorporation
Transportation Association of Canada
Transportation Safety Board of Canada
Mexico
Banco de México, Dirección General deInvestigación Económica
Secretaría de Comunicaciones yTransportes, Coordinación General dePuertos y Marina Mercante
Secretaría de Comunicaciones yTransportes, Ferrocarriles Nacionales deMéxico
Secretaría de Turismo, Dirección Generalde Política Turística
United States
American Public Transit Association
Association of American Railroads
Department of Commerce, Bureau ofEconomic Analysis
Department of Defense, U.S. Army Corps ofEngineers
Department of Energy, Energy InformationAdministration
Department of Energy, Oak Ridge NationalLaboratory
Department of Labor, Bureau of LaborStatistics
Department of Transportation, FederalAviation Administration
Department of Transportation, FederalHighway Administration
Department of Transportation, FederalRailroad Administration
Department of Transportation, FederalTransit Administration
Department of Transportation, MaritimeAdministration
Department of Transportation, NationalHighway Traffic Safety Administration
Department of Transportation, Researchand Special Projects Administration
Department of Transportation, U.S. CoastGuard
Environmental Protection Agency
National Railroad Passenger Corporation(Amtrak)
National Transportation Safety Board
Publication Support: Walter C. Odom,Michael G. Garland, Gary Lauffer, BenjaminCromer, Barbara Abbott, Gloria Davis, KevinProctor, and Laurene Qualls, U.S. CensusBureau, U.S. Department of Commerce
Marsha Fenn and Chip Moore, Bureauof Transportation Statistics,U.S. Department of Transportation
Martha Courtney, MacroSys
Cover design: Vincent Hughes, Visualization

North Amer ican Transpor ta t ion in F iguresv i i i
ixNorth American Transportation in Figures
�
North American Transportation in Figuresexamines transportation and transporta-tion-related passenger, freight, economic,safety, energy, environmental and demo-graphic statistics relating to Canada,Mexico and the United States. This publi-cation serves to increase awareness oftransportation-related statistics currentlyavailable in each of the three countries,helps to assess comparability of the data,determines where information gaps existand reveals which additional data areneeded for a more complete picture of trans-portation in North America.
This project is a direct result of the NorthAmerican Transportation Statistics Inter-change, a tripartite initiative representingthe transportation and statistical agenciesof Canada, Mexico and the United States.Updates to this publication will continueon a periodic basis.
p r e f a c e

North Amer ican Transpor ta t ion in F iguresx
xiNorth American Transportation in Figures
�
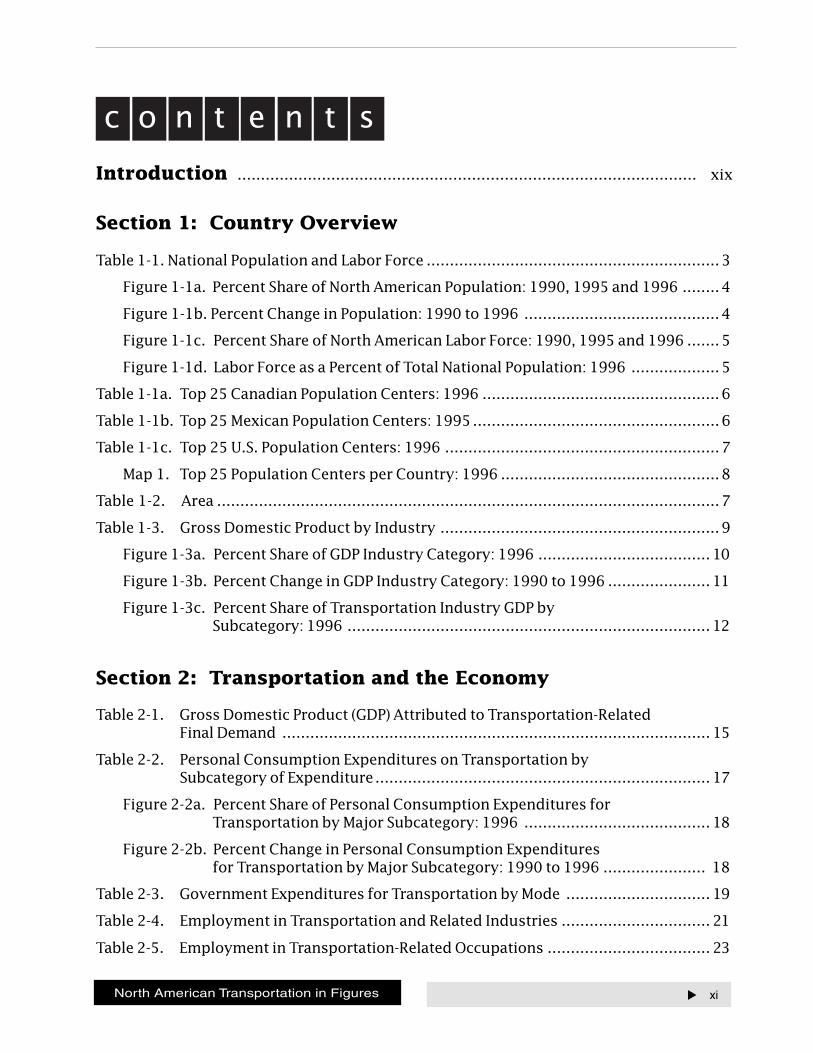
Introduction .................................................................................................. xix
Section 1: Country Overview
Table 1-1. National Population and Labor Force ...............................................................3
Figure 1-1a. Percent Share of North American Population: 1990, 1995 and 1996 ........4
Figure 1-1b. Percent Change in Population: 1990 to 1996 ..........................................4
Figure 1-1c. Percent Share of North American Labor Force: 1990, 1995 and 1996 .......5
Figure 1-1d. Labor Force as a Percent of Total National Population: 1996 ...................5
Table 1-1a. Top 25 Canadian Population Centers: 1996 ...................................................6
Table 1-1b. Top 25 Mexican Population Centers: 1995.....................................................6
Table 1-1c. Top 25 U.S. Population Centers: 1996 ...........................................................7
Map 1. Top 25 Population Centers per Country: 1996 ...............................................8
Table 1-2. Area ............................................................................................................7
Table 1-3. Gross Domestic Product by Industry ............................................................9
Figure 1-3a. Percent Share of GDP Industry Category: 1996 ..................................... 10
Figure 1-3b. Percent Change in GDP Industry Category: 1990 to 1996 ...................... 11
Figure 1-3c. Percent Share of Transportation Industry GDP bySubcategory: 1996 .............................................................................. 12
Section 2: Transportation and the Economy
Table 2-1. Gross Domestic Product (GDP) Attributed to Transportation-RelatedFinal Demand ............................................................................................ 15
Table 2-2. Personal Consumption Expenditures on Transportation bySubcategory of Expenditure........................................................................ 17
Figure 2-2a. Percent Share of Personal Consumption Expenditures forTransportation by Major Subcategory: 1996 ........................................ 18
Figure 2-2b. Percent Change in Personal Consumption Expendituresfor Transportation by Major Subcategory: 1990 to 1996 ...................... 18
Table 2-3. Government Expenditures for Transportation by Mode ............................... 19
Table 2-4. Employment in Transportation and Related Industries ................................ 21
Table 2-5. Employment in Transportation-Related Occupations ................................... 23
c o n t e n t s
North American Transportation in Figures xii �
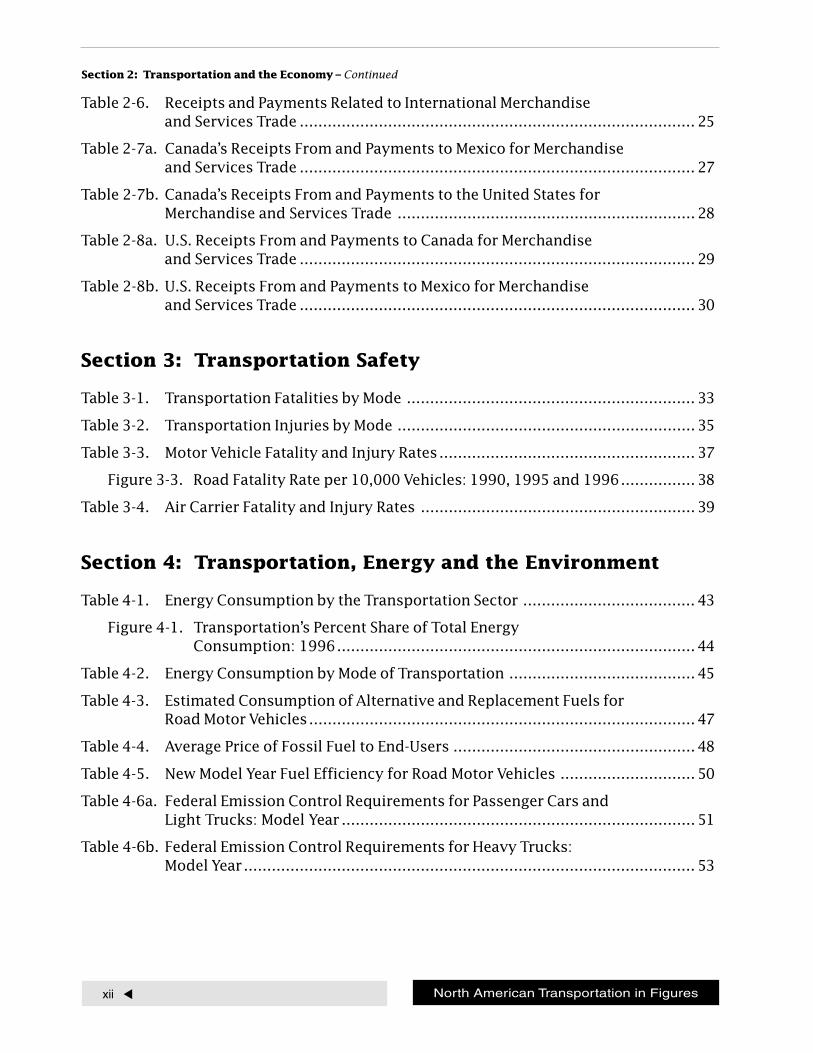
Table 2-6. Receipts and Payments Related to International Merchandiseand Services Trade ..................................................................................... 25
Table 2-7a. Canada’s Receipts From and Payments to Mexico for Merchandiseand Services Trade ..................................................................................... 27
Table 2-7b. Canada’s Receipts From and Payments to the United States forMerchandise and Services Trade ................................................................ 28
Table 2-8a. U.S. Receipts From and Payments to Canada for Merchandiseand Services Trade ..................................................................................... 29
Table 2-8b. U.S. Receipts From and Payments to Mexico for Merchandiseand Services Trade ..................................................................................... 30
Section 3: Transportation Safety
Table 3-1. Transportation Fatalities by Mode .............................................................. 33
Table 3-2. Transportation Injuries by Mode ................................................................ 35
Table 3-3. Motor Vehicle Fatality and Injury Rates....................................................... 37
Figure 3-3. Road Fatality Rate per 10,000 Vehicles: 1990, 1995 and 1996................ 38
Table 3-4. Air Carrier Fatality and Injury Rates ........................................................... 39
Section 4: Transportation, Energy and the Environment
Table 4-1. Energy Consumption by the Transportation Sector ..................................... 43
Figure 4-1. Transportation’s Percent Share of Total Energy Consumption: 1996............................................................................. 44
Table 4-2. Energy Consumption by Mode of Transportation ........................................ 45
Table 4-3. Estimated Consumption of Alternative and Replacement Fuels forRoad Motor Vehicles................................................................................... 47
Table 4-4. Average Price of Fossil Fuel to End-Users .................................................... 48
Table 4-5. New Model Year Fuel Efficiency for Road Motor Vehicles ............................. 50
Table 4-6a. Federal Emission Control Requirements for Passenger Cars andLight Trucks: Model Year ............................................................................ 51
Table 4-6b. Federal Emission Control Requirements for Heavy Trucks:Model Year................................................................................................. 53
Section 2: Transportation and the Economy – Continued
xiiiNorth American Transportation in Figures
�
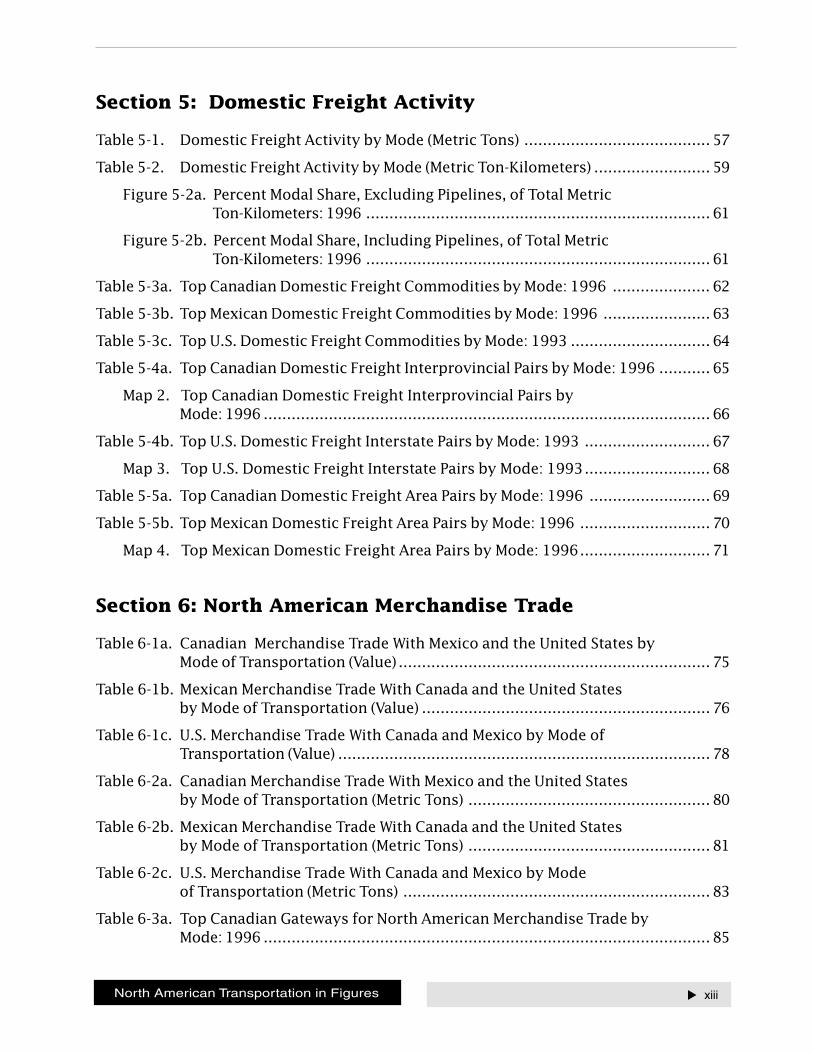
Section 5: Domestic Freight Activity
Table 5-1. Domestic Freight Activity by Mode (Metric Tons) ........................................ 57
Table 5-2. Domestic Freight Activity by Mode (Metric Ton-Kilometers) ......................... 59
Figure 5-2a. Percent Modal Share, Excluding Pipelines, of Total MetricTon-Kilometers: 1996 .......................................................................... 61
Figure 5-2b. Percent Modal Share, Including Pipelines, of Total MetricTon-Kilometers: 1996 .......................................................................... 61
Table 5-3a. Top Canadian Domestic Freight Commodities by Mode: 1996 ..................... 62
Table 5-3b. Top Mexican Domestic Freight Commodities by Mode: 1996 ....................... 63
Table 5-3c. Top U.S. Domestic Freight Commodities by Mode: 1993 .............................. 64
Table 5-4a. Top Canadian Domestic Freight Interprovincial Pairs by Mode: 1996 ........... 65
Map 2. Top Canadian Domestic Freight Interprovincial Pairs byMode: 1996 ................................................................................................ 66
Table 5-4b. Top U.S. Domestic Freight Interstate Pairs by Mode: 1993 ........................... 67
Map 3. Top U.S. Domestic Freight Interstate Pairs by Mode: 1993........................... 68
Table 5-5a. Top Canadian Domestic Freight Area Pairs by Mode: 1996 .......................... 69
Table 5-5b. Top Mexican Domestic Freight Area Pairs by Mode: 1996 ............................ 70
Map 4. Top Mexican Domestic Freight Area Pairs by Mode: 1996............................ 71
Section 6: North American Merchandise Trade
Table 6-1a. Canadian Merchandise Trade With Mexico and the United States byMode of Transportation (Value) ................................................................... 75
Table 6-1b. Mexican Merchandise Trade With Canada and the United Statesby Mode of Transportation (Value) .............................................................. 76
Table 6-1c. U.S. Merchandise Trade With Canada and Mexico by Mode ofTransportation (Value) ................................................................................ 78
Table 6-2a. Canadian Merchandise Trade With Mexico and the United Statesby Mode of Transportation (Metric Tons) .................................................... 80
Table 6-2b. Mexican Merchandise Trade With Canada and the United Statesby Mode of Transportation (Metric Tons) .................................................... 81
Table 6-2c. U.S. Merchandise Trade With Canada and Mexico by Modeof Transportation (Metric Tons) .................................................................. 83
Table 6-3a. Top Canadian Gateways for North American Merchandise Trade byMode: 1996 ................................................................................................ 85
North American Transportation in Figures xiv �
Table 6-3b. Top Mexican Gateways for North American Merchandise Trade byMode: 1996 ................................................................................................ 87
Table 6-3c. Top U.S. Gateways for North American Merchandise Trade byMode: 1996 ................................................................................................ 88
Table 6-4a. Top Mexican Maritime Intransit Shipment Ports: January-June 1997 ............ 90
Table 6-4b. Top U.S. Maritime Intransit Shipment Ports: 1996 ....................................... 91
Table 6-5a. Top Land Freight Crossing Ports, Canadian-U.S. Border: 1996...................... 92
Table 6-5b. Top Land Freight Crossing Ports, Mexican-U.S. Border: 1996 ....................... 93
Map 5. Series of Maps Showing Border Crossing Facilities ..................................... 94
Table 6-6a. Top Canadian Merchandise Trade Commodities by Mode WithMexico: 1996 ............................................................................................. 99
Table 6-6b. Top Canadian Merchandise Trade Commodities by Mode With theUnited States: 1996 .................................................................................. 100
Table 6-7a. Top Mexican Merchandise Trade Commodities by Mode WithCanada: 1996 ........................................................................................... 101
Table 6-7b. Top Mexican Merchandise Trade Commodities by Mode With theUnited States: 1996 .................................................................................. 102
Table 6-8a. Top U.S. Merchandise Trade Commodities by Mode With Canada:1996 ........................................................................................................ 103
Table 6-8b. Top U.S. Merchandise Trade Commodities by Mode With Mexico:1996 ........................................................................................................ 104
Section 7: International Merchandise Trade Between North America and the Rest of the World
Table 7-1. International Merchandise Trade Between North America and theRest of the World by Value ....................................................................... 107
Table 7-2. International Merchandise Trade Between North America and theRest of the World by Weight ..................................................................... 109
Table 7-3a. Top Canadian International Merchandise Trade Gatewaysby Mode: 1996 ......................................................................................... 111
Table 7-3b. Top U.S. International Merchandise Trade Gateways by Mode: 1996 .......... 113
Table 7-4a. Top Canadian International Trade Commodities by Value: 1996................. 114
Table 7-4b. Top Mexican International Trade Commodities by Value: 1996 .................. 115
Table 7-4c. Top U.S. International Trade Commodities by Value: 1996 ......................... 116
Table 7-5a. Top Canadian International Trade Commodities by Weight: 1996 .............. 117
Table 7-5b. Top U.S. International Trade Commodities by Weight: 1996 ....................... 118
Section 6: North American Merchandise Trade – Continued
xvNorth American Transportation in Figures
�
Section 8: Domestic Passenger Travel
Table 8-1. Domestic Passenger Travel by Mode ......................................................... 121
Table 8-2a. Top Canadian Domestic Passenger Metropolitan Area Pairs byMode: 1996 .............................................................................................. 123
Map 6. Top Canadian Domestic Passenger Metropolitian Area Pairs byMode: 1996 .............................................................................................. 124
Table 8-2b. Top Mexican Domestic Passenger Metropolitan Area Pairs byMode: 1996 .............................................................................................. 123
Map 7. Top Mexican Domestic Passenger Metropolitan Area Pairs byMode: 1996 .............................................................................................. 125
Table 8-2c. Top U.S. Domestic Passenger Metropolitan Area Pairs by Mode: 1995 ........ 126
Map 8. Top U.S. Domestic Passenger Metropolitan Area Pairs byMode: 1995 .............................................................................................. 127
Section 9: North American Passenger Travel
Table 9-1a. Canada-Mexico/Mexico-Canada Travel by Mode of Transportation ............. 131
Table 9-1b. Canada-United States/United States-Canada Travel by Modeof Transportation ..................................................................................... 132
Table 9-1c. Mexico-United States/United States-Mexico Travel by Modeof Transportation ..................................................................................... 134
Figure 9-1a. Percent Share of Total Travel Between Canada and Mexico: 1996 ........ 136
Figure 9-1b. Percent Share of Total Travel Between Canada and theUnited States: 1996 ........................................................................... 136
Figure 9-1c. Percent Share of Total Travel Between Mexico and theUnited States: 1996 ........................................................................... 136
Figure 9-1d. Same Day vs. Overnight Travel, Percent Share of Total TravelBetween Canada and the United States: 1996 ..................................... 136
Figure 9-1e. Same Day vs. Overnight Travel, Percent Share of Total TravelBetween Mexico and the United States: 1996...................................... 137
Figure 9-1f. Percent Modal Share of Canadian-U.S. Same DayPassenger Travel: 1996...................................................................... 137
Figure 9-1g. Percent Modal Share of Canadian-U.S. OvernightPassenger Travel: 1996...................................................................... 137
Figure 9-1h. Percent Modal Share of Mexican-U.S. OvernightPassenger Travel: 1996...................................................................... 137
Table 9-2a. Top Land Passenger Ports, Canadian-U.S. Border: 1996.............................. 138
North American Transportation in Figures xvi �
Table 9-2b. Top Land Passenger Ports, Mexican-U.S. Border: 1996 ............................... 140
Table 9-3. Top North American Air Passenger City Pairs: 1996................................... 141
Map 9. Top North American Air Passenger City Pairs: 1996 ................................... 142
Table 9-4a. Canada-Mexico/Mexico-Canada Travel by Trip Purpose ............................. 143
Table 9-4b. Canada-United States/United States-Canada Travel by Trip Purpose .......... 144
Table 9-5a. Canada-Mexico/Mexico-Canada Travel Characteristics: 1996 ..................... 145
Table 9-5b. Canada-United States/United States-Canada Travel Characteristics: 1996 .. 147
Section 10: International Passenger Travel Between North America and the Rest of the World
Table 10-1. Passenger Travel Between North America and the Rest of theWorld by Mode of Transportation ............................................................. 151
Table 10-2. Top International Origins and Destinations Outside of NorthAmerica: 1996.......................................................................................... 153
Table 10-3. Top International Air Gateways, Excluding North AmericanTravel: 1996 ............................................................................................. 154
Section 11: Transportation Infrastructure
Table 11-1. Domestic Physical System Extent .............................................................. 157
Figure 11-1a. Extent of Road Network (4 or More Lanes): 1990 and 1995 ............... 159
Figure 11-1b. Growth in Kilometers of Road (4 or More Lanes): 1990 to 1995 ........ 159
Table 11-2. Number of Airports ................................................................................ 160
Table 11-2a. Top 20 Canadian Airports by Flight Operations: 1996 .............................. 161
Table 11-2b. Top 20 Mexican Airports by Flight Operations: 1996 ............................... 162
Table 11-2c. Top 20 U.S. Airports by Flight Operations: 1996 ...................................... 163
Table 11-3. Number of Water Ports and Facilities....................................................... 165
Table 11-4a. Top 20 Canadian Water Ports by Tonnage (Domestic andInternational): 1996 ................................................................................ 166
Table 11-4b. Top 20 Mexican Water Ports by Tonnage (Domestic andInternational): 1996 ................................................................................ 167
Table 11-4c. Top 20 U.S. Water Ports by Tonnage (Domestic and International):1996 ...................................................................................................... 168
Map 10. North American Water Ports, Top 20 by Tonnage for EachCountry: 1996 ........................................................................................ 164
Table 11-5. Toll Roads, Bridges and Tunnels ............................................................. 169
Section 9: North American Passenger Travel – Continued
xviiNorth American Transportation in Figures
�
Section 12: Transportation Vehicles
Table 12-1. Number of Transportation Vehicles/Equipment ........................................ 173
Figure 12-1a. Growth in Number of Total Road Vehicles: 1990 to 1996 ................. 177
Figure 12-1b. Total Road Vehicles per 1,000 Residents: 1996 ................................ 177
Table 12-2. Vehicle-Kilometers by Mode ..................................................................... 178
Appendix A: Overview of Transportation Statistics in Canada, Mexico and the United States ................. 183
Appendix B: Additional Sources and Technical Notes ............ 217
Appendix C: Reference Resources ..................................................... 331
Source Acronyms ....................................................................................................... 331
International Currency Exchange Rates ....................................................................... 333
State and Provincial Abbreviations ............................................................................. 334
Conversion Ratios for Metric-U.S. Measures ............................................................... 335
Land Port Names, Canadian-U.S. Border ..................................................................... 336
Land Port Names, Mexican-U.S. Border ....................................................................... 341
Harmonized Tariff Schedule for International Merchandise Trade ............................... 345
Appendix D: Tables in U.S. Measures ............................................... 349

North Amer ican Transpor ta t ion in F iguresxv i i i
Introduction xixNorth American Transportation in Figures
�
The rate of global economic growth and theintegration of trade, finance and manufacturinghave increased greatly over the last twodecades. Transportation plays a vital role inthe changing global economy, linking peopleand places, facilitating trade and tourism andencouraging economic competition andspecialization. The North American1
experience mirrors these worldwide trends.Reduced trade barriers and increasinglymobile populations have created aheightened need for information ontransportation infrastructure and serviceswithin and across Canada, Mexico and theUnited States. Two major initiatives, theCanada-U.S. Free Trade Agreement (FTA)2and the subsequent North American FreeTrade Agreement (NAFTA),3 were significantmilestones in the liberalization of trade ingoods and services between the threecountries of this continent.
An effective, efficient and safe transportationsystem is critical to any nation’s economicgrowth, the mobility of its citizens and itsnational security. Each day, governments,businesses and consumers make countlessdecisions about where to locate facilities andmake investments, what to ship, whichtransportation mode to use and how andwhere to travel on business or for pleasure.Transportation provides the links betweenbusinesses, industries and consumers, andthe merits of transportation go beyond thenational borders of any one country. Whilethe positive contributions of transportationto the national economies and to the dailylife of people everywhere are quite important,
transportation also has some adverseimpacts. Transportation uses significantamounts of energy, mostly derived frompetroleum, and is also a major cause of deathand injury every year. This report strives topresent a balanced picture of the benefitstransportation confers as well as the impactsit has.
The effectiveness and efficiency of nationaland North American transportation reliesheavily on sound information. Withinand across countries, comprehensivetransportation information makesknowledgeable decisions possible, onpersonal, corporate and national policylevels. Accurate data, comparable acrossmodes and countries, is important in orderto make effective investments with scarceresources; to understand changes indynamic transportation markets; toevaluate transportation benefits andimpacts; and to support critical decision-making in the public and private sectors.In short, accurate, comprehensive and timelytransportation-related information is a keycomponent in business, government andpersonal decisionmaking.
A trilateral initiative, the North AmericanTransportation Statistics Interchange(Interchange), first identified a need for acompendium of transportation andtransportation-related data for Canada,Mexico and the United States. TheInterchange is an initiative between thetransportation and statistical agencies ofCanada, Mexico and the United States, andprovides a forum for the exchange ofinformation and for the discussion of topicsand issues related to transportationstatistics in and among the participatingcountries. The first Interchange meeting
I n t r o d u c t i o n
1 For the purposes of this report, North America will referto the countries of Canada, Mexico and the United States.
2 The FTA entered into force on January 1, 1989.3 NAFTA entered into force on January 1, 1994.
xx Introduction North American Transportation in Figures�
4 In December 1999, a brief summary report, North AmericanTransportation Highlights, was published based on the workand data included in this report, North American Transportationin Figures.
5 Conversion ratios to U.S. measures are included in Appendix C.Appendix D reports data in U.S. measures for specific tables.
was held in November 1991, and regularmeetings have been held since then.
In addition to promoting closer workingties between the transportation and statis-tical agencies of the three countries, theInterchange has led to a number of keyprojects, including: the joint Canadian andU.S. development of the Standard Classifi-cation of Transported Goods (SCTG), theresolution of data inconsistencies intransborder merchandise trade data andthe exchange of ideas on the developmentof national reports. Trilateral cooperationbetween the three countries also led to thedevelopment of the North American Indus-trial Classification System (NAICS), pro-vided for an exchange of ideas on how toimprove and standardize the handling oftransportation data in national economicaccounts, and resulted in an agreement tojointly develop a project on North Ameri-can transportation statistics. Since 1997,a tricountry working group has been coor-dinating the work of this later project. Par-ticipating agencies include StatisticsCanada and Transport Canada from Canada;the Secretaría de Communicaciones yTransportes (Ministry of Communicationsand Transportation), the Instituto Mexicanodel Transporte (Mexican Institute of Trans-portation) and the Instituto Nacional deEstadística, Geografía e Informática (INEGI)(National Institute of Statistics, Geographyand Informatics) from Mexico; and the Bu-reau of Transportation Statistics and theU.S. Census Bureau from the United States.
The North American TransportationStatistics project has had a number of keyobjectives. These are: (a) to identify keyinformation that will help provide acomprehensive view of transportation inNorth America, (b) to characterizetransportation activity and impactsacross and between Canada, Mexico and
the United States, (c) to reveal specificdata comparability differences within andacross countries, (d) to identify data andinformation gaps and (e) to begindiscussions for reducing comparabilitydifferences and data gaps throughcooperative activities. This report, NorthAmerican Transportation in Figures, is oneof the outcomes of this project, andrepresents the second joint effort by thethree countries to develop a statisticalreport related to transportation.4 It isexpected that the information will beupdated on a periodic basis, giving usersa recognized source for transportation andother related data in a North Americancontext.
North American Transportation in Figuresprovides a comprehensive overview oftransportation statistics in North America.English, French and Spanish editions of thereport are available. The report includesdata for 1990, 1995 and 1996, the latestyears for which comparable data are readilyavailable. All of the value data are reportedin current U.S. dollars. All measurementunits are in metric.5 Users should notethat, for the sake of greater comparabilityacross the three countries, data categoriesand definitions were extensively reviewedand modified when necessary. Therefore,some of the data categories and definitionsused in this report may not alwayscorrespond to those used in the specificnational publications of Canada, Mexicoand the United States. Users, who requiredata in original categories, currencies ormeasures, a complete time series or other
Introduction xxiNorth American Transportation in Figures
�
additional information, may contact theappropriate source agency in each country.
Each language edition of the reportcontains over 90 data tables, supported bygraphs, figures, maps and a number ofappendixes. Appendix A includes anoverview of the transportation statisticalsystem in each of the three countries,including information on specific agenciesand their roles and responsibilities fortransportation data. In most cases,Appendix A also provides web siteaddresses where additional detailedinformation is available for specific datasets and series. Appendix B providesadditional technical notes for each of thedata tables, and explains the differencesin data sources, survey methodologies,collection approaches and definitionsamong the three countries. Informationprovided here supplements footnotesincluded on individual tables. Appendix Ccontains additional reference charts,including: the International Monetary Fund(IMF) exchange rates used, state andprovincial abbreviations, U.S.-metricconversion ratios, land border crossingports and the Harmonized Schedule forinternational merchandise trade at the two-digit level. Appendix D provides selectedtables in U.S. measures.
North American Transportation in Figurescontains twelve thematic sections. Section1, Country Overview, sets the context ofthe report with an overview of eachcountry: population, labor force, physicalarea and Gross Domestic Product (GDP).Section 2, Transportation and the Economy,draws a comprehensive picture of theimpact that transportation has on theeconomic indicators of each country(including GDP), government expendituresfor transportation, and transportation
employment. Section 3, TransportationSafety, provides critical information onfatalities and injuries by mode. Fatalityand injury rates for road and air also areincluded. Section 4, Transportation,Energy and the Environment, responds tocurrent energy and environmentalconcerns, and includes tables on energyconsumption, fuel costs and emissioncontrol requirements. Section 5, DomesticFreight Activity, summarizes freightactivity by mode, by major commodity andby major origin/destination pair. Sections6 and 7 provide data on North Americanmerchandise trade and internationalmerchandise trade between North Americaand the rest of the world. For Section 6,each country decided to use its ownmerchandise trade data. Thus, there willbe statistical differences when comparing,for example, Canada’s data for trade withthe United States and the United State’sdata for trade with Canada. Section 7represents international merchandisetrade for each country, excluding tradewith the other North American countries.Sections 8, 9 and 10 provide data ondomestic, North American and internationalpassenger travel. Section 9 presents apicture of North American travel withinformation about the type of travel(overnight versus same-day), mode oftransportation used and trip purpose.Section 10 provides data on internationalpassenger travel between North Americaand the rest of the world. Section 11,concentrates on transportation infrastructureand its use in each country. Section 12,Transportation Vehicles, provides a detailedinventory of transportation vehicles andequipment and summarizes domesticmovements, in terms of vehicle-kilometers,by mode.
xxii Introduction North American Transportation in Figures�
A number of standard symbols wereadopted for use on the statistical tables.These are as follows:
C = Data are confidentialN = Data are nonexistentNA = Not applicableNS = Not significantU = Data are unavailablee = Data are estimatedp = Data are preliminaryr = Data are revised
In addition, the unit “billions” in this editionequates to “thousand millions” in theSpanish edition, and one millard in theFrench edition.
An electronic version of North AmericanTransportation in Figures, includingdownloadable spreadsheet files, also willbe available on the web sites of theagencies involved in the North AmericanTransportation Statistics project. Thespecific agency addresses are as follows:
Canada
Statistics Canadawww.statcan.ca
Transport Canadawww.tc.gc.ca
Mexico
Instituto Mexicano del Transporte (MexicanInstitute of Transportation)www.imt.mx
Instituto Nacional de Estadística, Geografíae Informática (INEGI, National Institute ofStatistics, Geography and Informatics)www.inegi.gob.mx
Secretaría de Comunicaciones y Transportes(Ministry of Communications and Transport)www.sct.gob.mx
United States
Bureau of Transportation Statistics,U.S. Department of Transportationwww.bts.gov
U.S. Census Bureau,U.S. Department of Commercewww.census.gov


![The David and Barbara Pryor Center for Arkansas Oral and ...pryorcenter.uark.edu/projects/Arkansas Memories/SLATER-Rodney... · 15/03/2006 · Superman [TV series, 1952– 1958],](https://img.pdfslide.net/doc/110x75/5fa985d13582b928674b319e/the-david-and-barbara-pryor-center-for-arkansas-oral-and-memoriesslater-rodney.jpg)