Embed Size (px)
Citation preview

ww
w.
as
ub
.a
xSTATISTISK Å
RSBOK FÖ
R ÅLA
ND 2012
ww
w.
as
ub
.a
xTfn +358 (0)18 25490Fax +358 (0)18 19495
Ålandsvägen 26PB 1187
AX - 22 111 MARIEHAMNÅland
ÅLANDS STATISTIK- OCH UTREDNINGSBYRÅ
STATISTICS ÅLAND
Ålänningar och turister, män och kvinnor, födda och döda, bilar och kor, jobb och löner, böcker och älgjakt. Det och mycket mera finns det uppgifter om i Statistisk årsbok. Där hittar du det mesta om Åland - och lite om Norden och övriga världen. Läs den och se om du blir överras-kad eller om du får bekräftelse på det du redan visste!
Besök också ÅSUBs hemsida! Där finns det ännu mera intressant in-formation.
ÅLAND ISSN 0358-8629
FOTO Visitaland.com │ 1, Annica Jansson │ 2, Peter Karlsson3, Daniel Eriksson │ 4, Jacob Saurén
Statistical Yearbook
Statistisk årsbok
2012

Statistisk årsbok för Åland 2012
Statistical Yearbook of Åland 2012


Förord Statistisk årsbok för Åland är ett statistiskt uppslagsverk med ambitionen att på ett lättillgängligt och överskådligt sätt redovisa viktiga basuppgifter om det åländska samhället. Det är utgivarens förhoppning att årsboken kommer till användning, såväl inom politik och förvaltning som inom skolor och massmedia samt bland den breda allmänheten. Årsboken ges ut av Ålands statistik- och utredningsbyrå (ÅSUB), en fristående institution vars huvuduppgifter är att verka som Ålands officiella statistikmyndighet samt bedriva forsknings- och utredningsverksamhet. ÅSUB producerar statistik inom olika specialområden såsom miljö, befolkning, turism, löner, nationalräkenskaper, konsumentprisindex, offentlig ekonomi, utbildning, val m.m. All statistik och alla utredningar som ÅSUB publicerar finns tillgängliga på ÅSUBs webbplats, www.asub.ax. Statistisk årsbok för Åland innehåller en sammanställning av de viktigaste statistikuppgifterna från olika områden i det åländska samhället. I årets upplaga har några handelstabeller flyttat från kapitel 10 till kapitel 5. Diagrammen har numrerats vilket innebär att även de har en förteckning. Redaktör för Statistisk årsbok är Iris Åkerberg. I arbetet med årsboken har också Kenth Häggblom och Gerd Lindqvist deltagit. Pärmbilden är gjord av reklambyrå Respons. ÅSUB vill rikta ett särskilt tack till alla som har bidragit med material till årsboken. ÅSUB ger vid behov ytterligare förklaringar till tabellernas innehåll och kan inom många områden också stå till tjänst med mera detaljerad information än den som finns publicerad i årsboken. ÅSUB tar gärna emot synpunkter på årsbokens innehåll och upplägg. Kommentarer och förfrågningar kan riktas till Iris Åkerberg, tel. 25 496, e-post [email protected]. Mariehamn i november 2012 Bjarne Lindström Kenth Häggblom Direktör Statistikchef

Preface The Statistical Yearbook of Åland is a work of reference, the purpose of which is to provide comprehensive information about the social and economic conditions in Åland. It has been published since 1979 and is bilingual (Swedish and English) since 1998. The yearbook is compiled and published by Statistics and Research Åland (ÅSUB), which is an independent public organization. Its main task is to function as the official statistics authority of the Åland Islands and to conduct qualified research. ÅSUB produces statistics in several fields: population, housing, construction, consumer price index, wages and salaries, national accounts, tourism, education etc. More statistics produced by ÅSUB can be found at the website www.asub.ax. In this year’s edition, the tables on international trade have been moved from chapter 10 to chapter 5. The figures have been numbered and, consequently, a list of figures has been inserted. Iris Åkerberg is the editor of the yearbook, Kenth Häggblom and Gerd Lindqvist have assisted with the tables. We wish to thank all those who have supplied information. We also welcome comments and proposals for improvement. Mariehamn, November 2012 Bjarne Lindström Kenth Häggblom Director Chief Statistician

Statistisk årsbok för Åland – Statistical Yearbook of Åland 2012 5
Innehållsförteckning
Förord ...................................................................................................................................................................... 3 Innehållsförteckning ................................................................................................................................................. 5 Förkortningar, symboler och beteckningar............................................................................................................... 5 Förteckning över tabeller ......................................................................................................................................... 7 1. Miljö och energi ............................................................................................................................................ 21 2. Befolkning .................................................................................................................................................... 33 3. Boende och byggande ................................................................................................................................. 71 4. Jord- och skogsbruk, fiske ........................................................................................................................... 83 5. Tillverkningsindustri, handel, finans och försäkring ...................................................................................... 97 6. Sjöfart och turism ....................................................................................................................................... 109 7. Transport och kommunikationer ................................................................................................................. 119 8. Arbetsmarknad ........................................................................................................................................... 131 9. Löner, inkomster och skatter ...................................................................................................................... 145 10. Nationalräkenskapsdata, företag och konsumentprisindex ........................................................................ 155 11. Offentlig ekonomi ....................................................................................................................................... 167 12. Socialväsende, hälso- och sjukvård ........................................................................................................... 181 13. Utbildning, kultur och rättsväsende ............................................................................................................ 197 14. Val .............................................................................................................................................................. 215 15. Nordisk och internationell jämförande statistik ........................................................................................... 229 Sakregister .......................................................................................................................................................... 248
Förkortningar, symboler och beteckningar
I tabeller med avrundade tal kan små avvikelser förekomma mellan summan av de avrundade talen och den redovisade slutsumman - Exakt 0 enheter (st) 0 Mellan 0 och 0,5 enheter . Uppgift ologisk, kan ej förekomma .. Uppgifter saknas, är för få till antalet eller alltför osäkra för att anges M Män K Kvinnor MEUR Miljoner euro Landskommuner = Alla kommuner utom Mariehamn Landsbygden = Alla kommuner på fasta Åland utom Mariehamn Skärgården = Brändö, Föglö, Kumlinge, Kökar, Sottunga och Vårdö ÅSUB Ålands statistik- och utredningsbyrå/Statistics Åland FR Statistikcentralens Folkräkning/Population Census BRC Befolkningsregistercentralen/Central Population Register SÅF Statistisk årsbok för Finland/Statistical Yearbook of Finland JSM Jord- och skogsbruksministeriet/Ministry of Agriculture and Forestry LR Ålands landskapsregering/The Government of Åland SC Statistikcentralen i Finland/Statistics Finland FPA Folkpensionsanstalten/Social Insurance Institution ÅHS Ålands hälso- och sjukvård/The Åland health and medical care organisation STAKES Forsknings- och utvecklingscentralen för social- och hälsovård/National Research and Development Centre for Welfare and Health

6 Statistisk årsbok för Åland – Statistical Yearbook of Åland 2012
Contents Preface .................................................................................................................................................................... 4 Contents .................................................................................................................................................................. 6 Explanation of abbreviations, symbols and definitions ............................................................................................ 6 List of tables .......................................................................................................................................................... 12 1. Environment and energy .............................................................................................................................. 21 2. Population .................................................................................................................................................... 33 3. Housing and construction ............................................................................................................................. 71 4. Agriculture and fishing .................................................................................................................................. 83 5. Manufacturing, trade, finance and insurance ............................................................................................... 97 6. Shipping and tourism ................................................................................................................................. 109 7. Transport and communications .................................................................................................................. 119 8. Labour market ............................................................................................................................................ 131 9. Wages and salaries, income and taxes ...................................................................................................... 145 10. National accounts, enterprises and Consumer Price Index ........................................................................ 155 11. Public finance ............................................................................................................................................. 167 12. Social welfare, health and medical care ..................................................................................................... 181 13. Education and justice ................................................................................................................................. 197 14. Elections .................................................................................................................................................... 215 15. Nordic and international comparative statistics .......................................................................................... 229 Subject index ....................................................................................................................................................... 243
Explanation of abbreviations, symbols and definitions
In tables where figures have been rounded to the nearest final digit, there may be a slight discrepancy between the sum of the constituent items and the totals shown - Magnitude nil 0 Magnitude less than half of unit employed . Data not applicable .. Data not available, too few data units available or data too uncertain for presentation , Decimal separator M, Män Males K, Kvinnor Females EUR Euro MEUR Million euro Antal Number Totalt, Summa Total Procent Per cent Kommun Municipality Landskommuner = All municipalities apart from Mariehamn Landsbygden = All municipalities on Mainland Åland apart from Mariehamn Skärgården = The archipelago district, i.a. Brändö, Föglö, Kumlinge, Kökar, Sottunga, Vårdö ÅSUB Ålands statistik- och utredningsbyrå/Statistics Åland FR Statistikcentralens Folkräkning/Population Census BRC Befolkningsregistercentralen/Central Population Register SÅF Statistisk årsbok för Finland/Statistical Yearbook of Finland JSM Jord- och skogsbruksministeriet/Ministry of Agriculture and Forestry LR Ålands landskapsregering/The Government of Åland SC Statistikcentralen i Finland/Statistics Finland FPA Folkpensionsanstalten/Social Insurance Institution ÅHS Ålands hälso- och sjukvård/The Åland health and medical care organisation STAKES Forsknings- och utvecklingscentralen för social- och hälsovård/National Research and Development Centre for Welfare and Health

Tabellförteckning
Statistisk årsbok för Åland – Statistical Yearbook of Åland 2012 7
Förteckning över tabeller
1. Miljö och energi 1.1. Geografiska uppgifter ..................................................................................................................................... 23 1.2. Land- och vattenareal efter kommun 1.1.2012, km² ....................................................................................... 23 1.3. Markanvändning efter region 2001, procent ................................................................................................... 24 1.4. Väderleksförhållanden 1931-2011 .................................................................................................................. 25 1.5. Graddagar 2000-2011 .................................................................................................................................... 26 1.6. Slemmerns islossning 1958-2012 ................................................................................................................... 27 1.7. I lag skyddade naturskyddsområden 1980-2011, hektar ................................................................................ 27 1.8. Vattenförsörjningen 2005-2011, 1 000 m3 ...................................................................................................... 28 1.9. Ålands Vatten Ab:s vattenförsörjning 2000-2011 ............................................................................................ 28 1.10. Avloppsvattenreningen i Mariehamn 2000-2011 .......................................................................................... 28 1.11. Vattendragsbelastningen på Åland 1996-2011 ............................................................................................. 29 1.12. Uppkommet avfall efter avfallsslag 2010, ton ............................................................................................... 30 1.13. Uppkommet avfall efter bransch 2004-2010, ton .......................................................................................... 31 1.14. Avfall efter destination 2004-2010, ton ......................................................................................................... 31 1.15. Växtnäring som sålts till jordbrukslägenheterna 2004-2011 ......................................................................... 31 1.16. Oljebolagens försäljning av några vanliga oljeprodukter på Åland 1985-2011 ............................................. 32 1.17. Elförsörjningen 1995-2011, Gigawattimmar (GWh) ...................................................................................... 32 2. Befolkning 2.1. Befolkning efter region, födelseort, språk och kön 31.12.2011 ....................................................................... 35 2.2. Befolkning efter kön, födelseort och språk 1920-2011 .................................................................................... 36 2.3. Befolkning efter kommun 31.12.1910-2011 .................................................................................................... 37 2.4. Befolkning efter kommun och kön 31.12.2000 och 2011 ................................................................................ 38 2.5. Antal kvinnor i åldern 15-44 år per 100 män i samma ålder 31.12.1980-2011 ............................................... 38 2.6. Folktäthet efter kommun 31.12.1950-2011, invånare per km2 land ................................................................ 39 2.7. Befolkning i och utanför tätorter 1970-2011 .................................................................................................... 39 2.8. Byarnas och stadsdelarnas befolkning 31.12.2010-2011 ............................................................................... 40 2.9. Befolkning efter ålder och kön 31.12.2011 ..................................................................................................... 42 2.10. Befolkning efter ålder och kommun 31.12.2011 ........................................................................................... 44 2.11. Befolkning efter födelseort 31.12.1990-2011 ................................................................................................ 47 2.12. Befolkning efter födelseort och kommun 31.12.2011 .................................................................................... 48 2.13. Befolkning efter språk 31.12.1990-2011 ....................................................................................................... 49 2.14. Befolkning efter medborgarskap 31.12.2011 ................................................................................................ 50 2.15. Åländsk hembygdsrätt 2005-2011 ................................................................................................................ 50 2.16. Befolkning efter religionssamfund och ålder 31.12.2011 .............................................................................. 51 2.17. Folkmängd efter civilstånd, kön och ålder 31.12.2011 .................................................................................. 51 2.18. Bostadshushåll efter personantal 31.12.1970-2011 ..................................................................................... 52 2.19. Bostadshushållens antal och storlek efter kommun 1995-2011 .................................................................... 53 2.20. Antal familjer efter familjetyp 31.12.2011 ...................................................................................................... 53 2.21. Antal barnfamiljer efter familjetyp och kommun 31.12.2011. Familjer med barn under 18 år ....................... 54 2.22. Antal barnfamiljer efter familjetyp 31.12.1990-2011. Familjer med barn under 18 år ................................... 55 2.23. Befolkning efter huvudsaklig verksamhet och kommun 31.12.2010 ............................................................. 55 2.24. Befolkning efter huvudsaklig verksamhet och ålder 31.12.2010 ................................................................... 56 2.25. Befolkningsrörelsen efter kön och region 2011 ............................................................................................. 58 2.26. Befolkningsrörelsen efter kommun 2011 ...................................................................................................... 59 2.27. Befolkningsrörelsen i kommunerna under en tioårsperiod 2002-2011 .......................................................... 59 2.28. Befolkningsrörelsen efter region 2002-2011 per 1 000 personer av medelfolkmängden .............................. 60 2.29. Befolkningsrörelsen 2002-2011 .................................................................................................................... 61 2.30. Födslar 1992-2010 ....................................................................................................................................... 62 2.31. Levande födda barn efter moderns ålder 2003-2011, fruktsamhet ............................................................... 63 2.32. Döda efter ålder och kön 2009-2011 ............................................................................................................ 64 2.33. Döda efter dödsorsak 2010 .......................................................................................................................... 65 2.34. Förväntad medellivslängd efter kön 1966-2010 ............................................................................................ 66 2.35. In- och utvandring efter land 1987-2011 ....................................................................................................... 66 2.36. Flyttningsrörelsen i kommunerna 2011 ......................................................................................................... 67 2.37. Befolkningsprognos efter ålder 2012-2040 ................................................................................................... 68 2.38. Befolkningsprognos efter kommun 2012-2040 ............................................................................................. 68
Tabellförteckning
8 Statistisk årsbok för Åland – Statistical Yearbook of Åland 2012
2.39. De 20 vanligaste efternamnen 31.12.2002 och 31.12.2011 ......................................................................... 69 3. Boende och byggande 3.1. Bostadshushåll efter bostadens upplåtelseform och kommun 2010 ............................................................... 73 3.2. Bostadshushåll, boendeyta och trångboddhet efter kommun 2000 och 2010 ................................................ 73 3.3. Antal bostäder efter lägenhets- och hustyp 31.12.2010 ................................................................................. 74 3.4. Antal bostäder efter hustyp och kommun 31.12.2010 .................................................................................... 74 3.5. Färdigställda bostäder efter kommun 1975-2011 ........................................................................................... 75 3.6. Färdigställda bostäder efter hustyp, antal och yta 1975-2011 ........................................................................ 76 3.7. Färdigställda bostäder efter lägenhetstyp, antal och genomsnittlig yta 1980-2011 ........................................ 77 3.8. Färdigställda bostäder efter ägare 1980-2010 ................................................................................................ 77 3.9. Antal byggnader efter hustyp, användning och byggnadsår 31.12.2011 ........................................................ 77 3.10. Antal byggnader efter bränsle och yta 31.12.2011 ....................................................................................... 78 3.11. Färdigställda ny- och tillbyggnader efter kommun 1980-2010 ...................................................................... 79 3.12. Färdigställda ny- och tillbyggnader efter användningsområde 1980-2010, yta 1 000 m2.............................. 79 3.13. Fritidshusbeståndet efter kommun 1985-1997 ............................................................................................. 80 3.14. Fritidshustätheten efter kommun 1985-1997 ................................................................................................ 80 3.15. Ansökningar om jordförvärv på Åland 2005-2011 ......................................................................................... 81 3.16. Verksamheten vid Ålands lantmäteribyrå 1995-2011 ................................................................................... 81 3.17. Medelmånadshyra EUR per m² efter antal rum i bostaden 1995-2010 ......................................................... 82 3.18. Medelmånadshyra EUR per m² efter bostadens byggnadsår 1995-2010 ..................................................... 82 3.19. Försäljning av aktielägenheter 2001-2007 .................................................................................................... 82 4. Jord- och skogsbruk, fiske 4.1. Lantbrukslägenheternas jorddisponering 2011, hektar ................................................................................... 85 4.2. Aktiva jordbrukslägenheter efter storleksklass 1980-2011 ............................................................................. 86 4.3. Jordbrukslägenheter efter huvudproduktionsinriktning 1990-2011 ................................................................. 86 4.4. Husdjurshållningen 1995-2011, antal lägenheter och antal djur ..................................................................... 87 4.5. Användning av åkerarealen 1995-2011 .......................................................................................................... 88 4.6. Ekologisk odling 1995-2011, hektar åkermark ................................................................................................ 88 4.7. Lantbruksprodukter, såld mängd och bruttointäkter 2009-2011 ...................................................................... 89 4.8. Skogsbruket. Markklasser 1963-2007 ............................................................................................................ 90 4.9. Det totala virkesförrådet efter trädslag 1978-2007 .......................................................................................... 90 4.10. Skogsmarkens fördelning på ägarkategorier 2007, procent ......................................................................... 90 4.11. Skogsvårdsarbeten i privatägda skogar 1990-2011, hektar.......................................................................... 91 4.12. Skogsbruket 2000-2011. Sålt virke efter mängd och leveransvärde ............................................................. 91 4.13. Fiskets avkastning 2009-2011 ...................................................................................................................... 92 4.14. Fiskodlingen 2007-2011 ............................................................................................................................... 92 4.15. Jakt på hjortdjur 2000-2011 .......................................................................................................................... 93 4.16. Utgivna jaktkort 1998-2011 ........................................................................................................................... 94 4.17. Utbetalade hjortdjursskadebidrag 2000-2011, EUR ..................................................................................... 95 5. Tillverkningsindustri, handel, finans och försäkring 5.1. Arbetsställen inom tillverkningsindustrin efter region, personalens storlek och näringsgren 2003-2011 ........ 99 5.2. Tillverkningsindustrins bruttoproduktionsvärde efter bransch 2006-2010, MEUR .........................................100 5.3. Tillverkningsindustrins förädlingsvärde efter bransch 2000-2010, MEUR .....................................................100 5.4. Arbetade timmar inom tillverkningsindustrin efter anställningsförhållande och bransch 2006-2010, 1 000 timmar ..................................................................................................................................................................101 5.5. Investeringar inom tillverkningsindustrin efter investeringsslag och bransch 2006-2010, 1 000 EUR ...........102 5.6. Handelns arbetsställen efter region, personalens storlek och näringsgren 2003-2011 .................................103 5.7. Handelns omsättning efter bransch 2000-2011, MEUR ................................................................................103 5.8. Handelns förädlingsvärde efter bransch 2000-2010, MEUR .........................................................................103 5.9. Utrikeshandel efter varuslag 2010-2011, 1 000 EUR ....................................................................................104 5.10. Utrikeshandel efter näringsgren 2010-2011, 1 000 EUR .............................................................................104 5.11. Total import och export av varor 2010-2011, 1 000 EUR ............................................................................105 5.12. Bankväsendet 2005-2011, ekonomiska uppgifter, kontor och personal ......................................................106 5.13. Kreditgivning efter kredittagar- och kreditgivarsektor 2000-2008. Kreditbestånd vid årets slut, MEUR .......106 5.14. Kreditgivning till företagsverksamhet efter näringsgren 2000-2008. Kreditbestånd vid årets slut, MEUR ...107 6. Sjöfart och turism 6.1. Den åländska handelsflottan 1975-2011 .......................................................................................................111 6.2. Den åländska handelsflottan, passagerarfartyg 1975-2011 ..........................................................................112

Tabellförteckning
Statistisk årsbok för Åland – Statistical Yearbook of Åland 2012 9
6.3. Den åländska handelsflottan 1986-2011. Tonnage under åländsk och finländsk flagg samt tonnage under annan flagg (inkl. charter) .....................................................................................................................................113 6.4. Åldersfördelning av det åländska tonnaget 2011 ...........................................................................................113 6.5. Ombordanställda på fartyg efter kön 1980-2007 ...........................................................................................114 6.6. Ombordanställda efter befattning 1990-2007 ................................................................................................114 6.7. Ankommande fartyg efter hamn, antal och nettodräktighet 2008-2011 .........................................................115 6.8. Farleder 31.12.2005 och 2011, km ................................................................................................................115 6.9. Till Åland anlända resenärer efter transportmedel och land 2009-2011 .......................................................116 6.10. Till Åland anlända fordon efter fordonstyp och land 2005-2011 ...................................................................116 6.11. Anlända gäster och övernattningar i inkvarteringsanläggningar efter hemland 2011 ..................................117 6.12. Anlända gäster och övernattningar efter land och typ av inkvarteringsanläggning 2011 .............................118 6.13. Båtplatser och båtnätter i de åländska gästhamnarna efter region 1995-2011............................................118 6.14. Antal företag i turistbranschen 2003-2011 ...................................................................................................118 7. Transport och kommunikationer 7.1. Antal registrerade fordon efter innehavarens hemkommun 31.12.2011 ........................................................121 7.2. Registrerade nya fordon 1995-2011 ..............................................................................................................122 7.3. Fördelning av bilar och traktorer efter första bruksår 2011 ............................................................................122 7.4. Fordonsbeståndets utveckling 1962-2011 .....................................................................................................123 7.5. Antal registrerade körkort efter innehavarens ålder och kön 31.12.2005 och 2011 .......................................124 7.6. Utfärdade körkort efter fordonsklass och kön 2011 .......................................................................................124 7.7. Vägtrafikolyckor 2000-2011 ...........................................................................................................................125 7.8. Dödade eller skadade personer i vägtrafikolyckor samt offrets trafikantgrupp 2000-2011 ............................125 7.9. Viltolyckor 1975-2011 ....................................................................................................................................126 7.10. Väghållningen, allmänna vägar och cykelleder 1985-2008, km ...................................................................126 7.11. Trafiken på skärgårdsfärjorna. Antal passagerare och fordon 2000-2011 ...................................................127 7.12. Trafiken på skärgårdsfärjorna. Transporterade fordon efter fordonsslag 2011 ............................................127 7.13. Trafiken på Mariehamns flygplats 1985-2011 ..............................................................................................128 7.14. Busslinjetrafiken på Åland, antal passagerare 2004-2011 ...........................................................................129 7.15. Postförsändelser 2004-2011, 1 000 st .........................................................................................................129 8. Arbetsmarknad 8.1. Arbetskraft och befolkning utanför arbetskraften efter ålder och kön 2010 ....................................................133 8.2. Sysselsatta efter näringsgren och kön 31.12.2009 ........................................................................................134 8.3. Sysselsatta efter näringsgren och kön 1960-2009 .........................................................................................135 8.4. Sysselsatta efter näringsgren och kommun 31.12.2009 ................................................................................136 8.5. Arbetsplatser efter näringsgren och kommun 31.12.2009 .............................................................................137 8.6. Sysselsatt arbetskraft och arbetande i kommunen 31.12.2009, pendling ......................................................138 8.7. Inom området arbetande efter kön, yrkesställning, arbetsgivarsektor och kommun 31.12.2009 ...................139 8.8. Inom området arbetande efter kön, yrkesställning, arbetsgivarsektor och näringsgren 31.12.2009 ..............140 8.9. Inom området arbetande efter kön, yrkesställning och arbetsgivarsektor 1995-2009 ....................................140 8.10. De vanligaste yrkesgrupperna efter kön 2009 .............................................................................................142 8.11. Arbetslösa och relativa arbetslöshetstal efter kön, årsmedeltal 1988-2011 .................................................143 8.12. Arbetslöshet för särskilda kategorier av arbetskraften 2000-2011, procent öppet arbetslösa......................143 8.13. Lediga platser och arbetslösa efter yrke i medeltal 2007-2011 ....................................................................144 8.14. Arbetslöshetsersättningar efter kön 1990-2011 ...........................................................................................144 9. Löner, inkomster och skatter 9.1. Fysiska personers skattepliktiga inkomster och skatter efter kommun 2008-2010 ........................................147 9.2. Fysiska personers inkomster och beskattning efter inkomstklass 2010 ........................................................148 9.3. Fysiska personers inkomster och beskattning 1995-2010 .............................................................................149 9.4. Fysiska personers inkomster och beskattning efter kön 2009-2010 ..............................................................150 9.5. Fysiska personers inkomster och beskattning efter ålder 2010, 1 000 EUR .................................................151 9.6. Antal anställda och medelmånadslön för heltidsanställda i den privata sektorn efter bransch och kön 2010 152 9.7. Genomsnittlig timlön inom den privata sektorn efter bransch och kön 2010, samtliga anställda ...................153 9.8. Medelmånadslöner för heltidsanställda vid Ålands landskapsregering efter yrkesgrupp och kön 2010, EUR .............................................................................................................................................................................154 10. Nationalräkenskapsdata, företag och konsumentprisindex 10.1. Bruttonationalprodukten 1975-2010, MEUR ................................................................................................157 10.2. Bruttonationalprodukten efter näringsgren 2010 ..........................................................................................158 10.3. Bruttonationalprodukten i löpande priser 2000-2010, MEUR .......................................................................159 10.4. Resultat- och balansräkning för företag inom näringslivet efter näringsgren 2010 ......................................160

Tabellförteckning
10 Statistisk årsbok för Åland – Statistical Yearbook of Åland 2012
10.5. Ekonomiska nyckeltal efter näringsgren 2010 .............................................................................................161 10.6. Konsumentprisindex för Åland efter varugrupp 2010-2012 (2010=100) ......................................................162 10.7. Konsumentprisindex för Åland 1985-2012 (1985=100) ...............................................................................163 10.8. Antal företag efter bransch och kommun 2011 ............................................................................................164 10.9. Antal företag efter bransch och personalens storleksklass 2011 .................................................................164 10.10. Arbetsställen efter storleksklass och kommun 2011 ..................................................................................165 10.11. Antal nya och nedlagda företag efter näringsgren 2005-2011 ...................................................................165 11. Offentlig ekonomi 11.1. Landskapet Ålands inkomster och utgifter 2010-2011 .................................................................................169 11.2. Landskapet Ålands utgifter 1980-2011, 1 000 EUR .....................................................................................170 11.3. Sammandrag av landskapet Ålands resultaträkning 2008-2011, 1 000 EUR ..............................................171 11.4. Landskapet Ålands balansräkning 31.12.2008-2011, 1 000 EUR ...............................................................172 11.5. Kommunernas resultaträkningar 2008-2011, 1 000 EUR ............................................................................173 11.6. Kommunernas finansieringskalkyler 2008-2011, 1 000 EUR .......................................................................174 11.7. Kommunernas balanser 2008-2011, 1 000 EUR .........................................................................................175 11.8. Kommunernas driftsintäkter och -kostnader efter sektor 2010, 1 000 EUR .................................................176 11.9. Nettodriftskostnader per person efter sektor och kommun 2010, EUR ........................................................176 11.10. Kommunernas och kommunalförbundens driftshushållning, kostnads- och intäktsslag 2009-2010 ..........177 11.11. Kommunernas ekonomiska nyckeltal 2011 ...............................................................................................178 11.12. Nyckeltal för den kommunala beskattningen 2010-2012 ...........................................................................179 12. Socialväsende, hälso- och sjukvård 12.1. Barnomsorgen efter kommun 2011 .............................................................................................................183 12.2. Äldreomsorgen efter kommun och kön 2011 ...............................................................................................184 12.3. Antal klienter inom äldreomsorgen efter ålder och region 2005 och 2011 ...................................................184 12.4. Kommunernas driftskostnader för socialväsendet 2010, 1 000 EUR ...........................................................185 12.5. Kommunernas nettodriftskostnader för socialväsendet 2007-2010 .............................................................186 12.6. Ålands hälso- och sjukvård, besök och insatser på polikliniker och mottagningar 2011 ..............................187 12.7. Ålands hälso- och sjukvård, mottagningsbesök efter kön och ålder 2011 ...................................................187 12.8. Ålands hälso- och sjukvård, tandvård 2008-2011 ........................................................................................188 12.9. Ålands hälso- och sjukvård, vårdavdelningsverksamhet efter basenhet 2011 .............................................188 12.10. Ålands hälso- och sjukvård, vårdavdelningsverksamhet efter basenhet och kön 2011 .............................189 12.11. Vård utom Åland 2007-2011 ......................................................................................................................189 12.12. Ålands hälso- och sjukvård, geriatriska kliniken 2006-2011 ......................................................................189 12.13. Ålands hälso- och sjukvård, bokslutsuppgifter 2005-2011, 1 000 EUR .....................................................190 12.14. Veterinärvård 2006-2011 ...........................................................................................................................190 12.15. Aborter efter kvinnans ålder 2005-2011 .....................................................................................................190 12.16. Barnbidrag efter kommun december 2011 ................................................................................................191 12.17. Pensionstagare efter ålder och region 31.12.2010 ....................................................................................192 12.18. Pensionstagare efter pensionsslag och kommun 31.12.2010 ...................................................................192 12.19. Pensionsutgifter efter pensionsslag och region 2010, MEUR ....................................................................193 12.20. Pensionsutgifter efter region och pensionssystem 2000-2010, MEUR ......................................................193 12.21. Folkpensionsutgifter efter region 2005-2011, 1 000 EUR ..........................................................................194 12.22. Sjukförsäkringsersättningar efter kommun 2008-2009, 1 000 EUR ...........................................................195 12.23. Ersättningar för läkemedel, läkartjänster, undersökning och behandling samt resekostnader 2000-2009 195 13. Utbildning, kultur och rättsväsende 13.1. Grundskolorna höstterminerna 1990-2011 ..................................................................................................199 13.2. Elevantalet i grundskolornas högstadium, höstterminerna 1990-2011 ........................................................199 13.3. Elever efter kommun i grundskolan höstterminerna 1990-2011 ..................................................................200 13.4. Antal grundskolor och elever fördelade efter skolornas elevantal hösten 2011 ...........................................200 13.5. Studerande på gymnasienivå och i övrig utbildning efter kön och hemort hösten 2011 ..............................201 13.6. Studerande vid Högskolan på Åland efter kön hösten 2011 ........................................................................201 13.7. Studerande efter grundskolan samt vid Högskolan på Åland efter skola höstterminerna 1985-2011 ..........202 13.8. Antal utexaminerade från gymnasienivån efter läroinrättning och kön 2010-2011 ......................................202 13.9. Antal utexaminerade från Högskolan på Åland efter kön 2010-2011 ...........................................................203 13.10. Antal utexaminerade från åländska skolor 2000-2011 ...............................................................................203 13.11. Högskolan på Åland, öppna högskolan 1990-2011 ...................................................................................204 13.12. Högskolan på Åland, deltagare i akademiska kurser i öppna högskolan efter utbildningsområde och kön 2010-2011 ............................................................................................................................................................204 13.13. Studerande vid Ålands musikinstitut efter kön 1995-2011 .........................................................................205

Tabellförteckning
Statistisk årsbok för Åland – Statistical Yearbook of Åland 2012 11
13.14. Medborgarinstitutet 1990-2011 ..................................................................................................................205 13.15. Studerande i läroavtalsutbildning efter kön och utbildningsområde 2011 ..................................................205 13.16. Åländska studerande utanför Åland efter studieland och utbildningsnivå 2011 .........................................206 13.17. Studiestöd 2007-2011 ...............................................................................................................................206 13.18. Antal lärare efter skolnivå, uppgift, kön och medelålder vårterminen 2011................................................207 13.19. Andel av befolkningen som avlagt examen utöver grundnivå efter åldersgrupp och kön 2007-2010, procent .............................................................................................................................................................................208 13.20. Befolkningens utbildningsstruktur 2008-2010 ............................................................................................208 13.21. Biblioteksverksamheten 1985-2011 ...........................................................................................................209 13.22. Biblioteksverksamheten efter kommun 2011 .............................................................................................209 13.23. Bokproduktion på Åland efter ämne 2006-2011 ........................................................................................210 13.24. Kommunernas driftskostnader för undervisning och kultur 2010, 1 000 EUR ............................................211 13.25. Landskapsandelar för grundskolutgifter 2007-2011, 1 000 EUR ...............................................................211 13.26. Dagstidningarnas upplagor 1999-2011 ......................................................................................................212 13.27. Museibesök 2000-2011 .............................................................................................................................212 13.28. Ålands landskapsarkiv 1978-2011 .............................................................................................................212 13.29. Församlingarnas folkmängd och verksamhet 2000-2010 ..........................................................................213 13.30. Församlingarnas folkmängd och ekonomi 2010 ........................................................................................213 13.31. Brott som kommit till polisens kännedom efter kön och ålder 2011 ...........................................................214 13.32. Ålands tingsrätt 2000-2011 ........................................................................................................................214 14. Val 14.1. Lagtingsvalen 1979-2011. Röster, kandidater och invalda efter politisk gruppering ....................................217 14.2. Lagtingsvalet 2011. Röster, kandidater och invalda efter kön och politisk gruppering .................................218 14.3. Lagtingsvalet 2011. Röstberättigade och röstande efter kommun och kön .................................................219 14.4. Ogiltiga röster efter orsak vid lagtings- och kommunalvalet 2011 ................................................................219 14.5. Valdeltagande i lagtings- och kommunalvalen efter ålder och kön 1999-2011, procent ..............................220 14.6. Kommunalvalen 1995-2011. Röster, kandidater och invalda efter politisk gruppering ................................221 14.7. Kommunalvalet 2011. Röstberättigade och röstande efter kommun och kön ..............................................222 14.8. Kommunalvalet 2011. Godkända röster efter politisk gruppering, kön och kommun ...................................223 14.9. Kommunalvalet 2011. Kandidater efter politisk gruppering, kön och kommun ............................................224 14.10. Kommunalvalet 2011. Mandatfördelningen i kommunernas fullmäktige efter politisk gruppering och kön 224 14.11. Presidentvalet 2012. Godkända röster samt valdeltagande efter kön .......................................................225 14.12. Riksdagsvalet 2011. Godkända röster, kandidater och valdeltagande efter kön .......................................226 14.13. Valet till EU-parlamentet 2009. Godkända röster samt valdeltagande efter kön .......................................227 14.14. EU-folkomröstningarna 1994 efter region och kön ....................................................................................227 14.15. Valdeltagandet vid allmänna val 1991-2012, procent ................................................................................228 14.16. Andel av rösterna som avgivits före valdagen vid allmänna val 1991-2011, procent .................................228 15. Nordisk och internationell jämförande statistik 15.1. Markanvändning 2010, 1 000 ha .................................................................................................................231 15.2. Befolkning efter kön 1.1.1990-2012, 1 000 personer ...................................................................................231 15.3. Förväntad medellivslängd vid födseln efter kön 2000-2011 .........................................................................232 15.4. Folktäthet efter km2 landareal 1.1.1990-2011 ..............................................................................................232 15.5. Befolkningsrörelsen 2010-2011 per 1 000 personer av medelfolkmängden ................................................232 15.6. Användning av åkermarken 2010, 1 000 ha ................................................................................................233 15.7. Fiske, årlig fångst 2010, ton .........................................................................................................................234 15.8. Bostäder efter lägenhets- och hustyp 2010, 1 000 st ..................................................................................234 15.9. Nybyggda lägenheter 1990-2010 ................................................................................................................234 15.10. Gästnätter på hotell efter gästernas hemland 2010, 1 000 st ....................................................................235 15.11. Personbilar 1.1.1990-2011 ........................................................................................................................235 15.12. Arbetslöshet efter kön 1.1.2007-2009, procent ..........................................................................................235 15.13. Sysselsatta efter näringsgren 1.1.2010, könsfördelning i procent .............................................................236 15.14. Konsumentprisindex 2000-2010, 2005=100 ..............................................................................................238 15.15. Folkbiblioteksverksamhet 2000-2010 ........................................................................................................238 15.16. Valdeltagande vid parlamentsvalen 1990-2011, procent ...........................................................................239 15.17. Världens länder. Areal, medelfolkmängd och folktäthet 2010 ....................................................................240

List of tables
12 Statistisk årsbok för Åland – Statistical Yearbook of Åland 2012
List of tables 1. Environment and energy 1.1. Geographical data .......................................................................................................................................... 23 1.2. Land and water areas by municipality 1.1.2012, km² ...................................................................................... 23 1.3. Land use by region 2001, per cent ................................................................................................................. 24 1.4. Weather conditions 1931-2011 ....................................................................................................................... 25 1.5. Degree days 2000-2011 ................................................................................................................................. 26 1.6. Break-up of the ice of Slemmern 1958-2012 .................................................................................................. 27 1.7. Protected areas 1980-2011, hectares ............................................................................................................ 27 1.8. Water supply 2005-2011, 1 000 m3 ................................................................................................................ 28 1.9. Water supply by Ålands Vatten Ab 2000-2011 ............................................................................................... 28 1.10. The treatment of waste water, Mariehamn waste water treatment plant 2000-2011 .................................... 28 1.11. Strain on watercourse in Åland 1996-2011 ................................................................................................... 29 1.12. Generated waste by waste type 2010, tonnes .............................................................................................. 30 1.13. Generated waste by industry 2004-2010, tonnes ......................................................................................... 31 1.14. Waste by destination 2004-2010, tonnes ...................................................................................................... 31 1.15. Sales of fertilizers to farms 2004-2011 ......................................................................................................... 31 1.16. Supply of some of the common oil products by the oil companies in Åland 1985-2011 ............................... 32 1.17. Supply of electricity 1995-2011, GWh .......................................................................................................... 32 2. Population 2.1. Population by region, place of birth, language and sex 31.12.2011 ............................................................... 35 2.2. Population by sex, country of birth and language 1920-2011 ......................................................................... 36 2.3. Population by municipality 31.12.1910-2011 .................................................................................................. 37 2.4. Population by municipality and sex 31.12.2000 and 2011 .............................................................................. 38 2.5. Women aged 15-44 per 100 men aged 15-44 31.12.1980-2011 .................................................................... 38 2.6. Population density by municipality 31.12.1950-2011, inhabitants per km2 of land area.................................. 39 2.7. Population in and outside urban areas 1970-2011 ......................................................................................... 39 2.8. Population of the villages and of the districts in Mariehamn 31.12.2010-2011 ............................................... 40 2.9. Population by age and sex 31.12.2011 .......................................................................................................... 42 2.10. Population by age and municipality 31.12.2011 ........................................................................................... 44 2.11. Population by country of birth 31.12.1990-2011 ........................................................................................... 47 2.12. Population by place of birth and municipality 31.12.2011 ............................................................................. 48 2.13. Population by mother tongue 31.12.1990-2011 ............................................................................................ 49 2.14. Population by citizenship 31.12.2011 ........................................................................................................... 50 2.15. Regional citizenship for Ålanders 2005-2011 ............................................................................................... 50 2.16. Population by religion and age 31.12.2011 ................................................................................................... 51 2.17. Population by marital status, sex and age 31.12.2011 ................................................................................. 51 2.18. Household dwelling units by number of persons 31.12.1970-2011 .............................................................. 52 2.19. Number and size of household dwelling units by municipality 1995-2011 .................................................... 53 2.20. Number of families by family type 31.12.2011 .............................................................................................. 53 2.21. Families with children under 18 years by family type and municipality 31.12.2011 ...................................... 54 2.22. Families with children under 18 years by family type 31.12.1990-2011 ........................................................ 55 2.23. Population by main activity and municipality 31.12.2010 .............................................................................. 55 2.24. Population by main activity and age 31.12.2010 .......................................................................................... 56 2.25. Population changes by sex and region 2011 ................................................................................................ 58 2.26. Population changes by municipality 2011 ..................................................................................................... 59 2.27. Population changes in municipalities 2002-2011 .......................................................................................... 59 2.28. Population changes by region 2002-2011 per 1 000 of the mean population ............................................... 60 2.29. Population changes 2002-2011 .................................................................................................................... 61 2.30. Confinements 1992-2010 ............................................................................................................................. 62 2.31. Live-births by age of mother 2003-2011, fertility rates .................................................................................. 63 2.32. Deaths by age and sex 2009-2011 ............................................................................................................... 64 2.33. Deaths by causes of death 2010 .................................................................................................................. 65 2.34. Average life expectancy by sex 1966-2010 .................................................................................................. 66 2.35. Immigration and emigration by country 1987-2011 ....................................................................................... 66 2.36. Migration by municipality 2011 ..................................................................................................................... 67 2.37. Population projection by age 2012-2040 ...................................................................................................... 68

List of tables
Statistisk årsbok för Åland – Statistical Yearbook of Åland 2012 13
2.38. Population projection by municipality 2012-2040 .......................................................................................... 68 2.39. The 20 most common surnames 31.12.2002 and 31.12.2011 ...................................................................... 69 3. Housing and construction 3.1. Household dwelling units by tenure status and municipality 2010 .................................................................. 73 3.2. Household dwelling units, living area and occupancy rate by municipality 2000 and 2010 ............................ 73 3.3. Number of dwellings by type of building 31.12.2010 ...................................................................................... 74 3.4. Number of dwellings by type of building and municipality 31.12.2010 ............................................................ 74 3.5. Dwellings completed by municipality 1975-2011 ............................................................................................ 75 3.6. Dwellings completed by type of building, number and floor area 1975-2011 .................................................. 76 3.7. Dwellings completed by type, number and average floor area 1980-2011 ..................................................... 77 3.8. Dwellings completed by type of ownership 1980-2010 ................................................................................... 77 3.9. Buildings by type of building, intended use and year of completion 31.12.2011 ............................................. 77 3.10. Buildings by heating fuel and floor area 31.12.2011 ..................................................................................... 78 3.11. Building completions and extensions by municipality 1980-2010 ................................................................. 79 3.12. Building completions and extensions by use of building 1980-2010, floor area 1 000 m2............................. 79 3.13. Cottages by municipality 1985-1997 ............................................................................................................. 80 3.14. Density of cottages by municipality 1985-1997 ............................................................................................. 80 3.15. Applications for owning and holding real estate in Åland 2005-2011 ............................................................ 81 3.16. Activities of the Åland Office of Land Survey 1995-2011 .............................................................................. 81 3.17. Average monthly rents, euro per square metre, by number of rooms in dwelling 1995-2010 ....................... 82 3.18. Average monthly rents, euro per square metre, by year of completion of dwelling 1995-2010..................... 82 3.19. Housing share transactions 2001-2007 ........................................................................................................ 82 4. Agriculture and fishing 4.1. Land use on farms 2011, hectares ................................................................................................................. 85 4.2. Active farms by size category 1980-2011 ....................................................................................................... 86 4.3. Farms by main type of production 1990-2011 ................................................................................................ 86 4.4. Livestock 1995-2011, number of farms and number of animals ..................................................................... 87 4.5. Use of arable land 1995-2011 ........................................................................................................................ 88 4.6. Ecological production 1995-2011, hectares arable land ................................................................................. 88 4.7. Agricultural production and gross income 2009-2011 ..................................................................................... 89 4.8. Forestry, land classes 1963-2007 ................................................................................................................... 90 4.9. Volume of the growing stock by species 1978-2007 ....................................................................................... 90 4.10. Ownership of forest land and forestry land 2007, per cent ........................................................................... 90 4.11. Forest improvement work on private forest land 1990-2011, hectares ......................................................... 91 4.12. Forestry 2000-2011. Production by volume and delivery value .................................................................... 91 4.13. The yield of fishing 2009-2011 ...................................................................................................................... 92 4.14. Fish culture 2007-2011 ................................................................................................................................. 92 4.15. Hunt on deers 2000-2011 ............................................................................................................................. 93 4.16. Issued hunting licences 1998-2011 .............................................................................................................. 94 4.17. Compensation for damages caused by roe deer and elk 2000-2011, EUR .................................................. 95 5. Manufacturing, trade, finance and insurance 5.1. Work places in the manufacturing industry by region, size of workforce and industry 2003-2011 .................. 99 5.2. Value of gross output of the manufacturing industry by industry 2006-2010, MEUR .................................... 100 5.3. Value added of the manufacturing industry by industry 2000-2010, MEUR.................................................. 100 5.4. Hours worked in the manufacturing industry by employment position and industry 2006-2010, 1 000 hours 101 5.5. Investments in the manufacturing industry by type of investment and industry 2006-2010, 1 000 EUR ....... 102 5.6. Work places in trade and services by region, workforce size and industry 2003-2011 ................................. 103 5.7. Turnover in trade and services by industry 2000-2011, MEUR .................................................................... 103 5.8. Value added in trade and services by industry 2000-2010, MEUR ............................................................... 103 5.11. Total imports and exports of goods 2010-2011, 1 000 EUR ....................................................................... 105 5.12. Financial system 2005-2011, economic information, offices and employees ............................................. 106 5.13. Loans by sector of borrower and lender 2000-2008. Credit stock at year-end, MEUR ............................... 106 5.14. Loans to enterprises by industry 2000-2008. Outstanding credits at year-end, MEUR .............................. 107 6. Shipping and tourism 6.1. The merchant fleet of Åland 1975-2011 ....................................................................................................... 111 6.2. The merchant fleet of Åland, passenger vessels 1975-2011 ........................................................................ 112 6.3. The merchant fleet of Åland 1986-2011. Fleet under the flags of Åland and Finland and fleet under other flags (time-charter incl.) ................................................................................................................................................ 113

List of tables
14 Statistisk årsbok för Åland – Statistical Yearbook of Åland 2012
6.4. The fleet of Åland by age 2011 ..................................................................................................................... 113 6.5. Employees on ships by sex 1980-2007 ........................................................................................................ 114 6.6. Employees on ships by rank 1990-2007 ....................................................................................................... 114 6.7. Vessels arriving by destination, number and net tonnage 2008-2011 .......................................................... 115 6.8. Waterways 31.12.2005 and 2011, km .......................................................................................................... 115 6.9. Travellers arrived by type of transport and country 2009-2011 ..................................................................... 116 6.10. Arrived vehicles by type of vehicle and country 2005-2011 ........................................................................ 116 6.11. Guests arrived and nights spent in accommodation by home country 2011 ............................................... 117 6.12. Guests arrived and nights spent in accommodation by country and type of accommodation 2011 ............ 118 6.13. Capacity of and nights spent in marinas of Åland by region 1995-2011 ..................................................... 118 6.14. Number of accommodation establishments 2003-2011 .............................................................................. 118 7. Transport and communications 7.1. Number of registered vehicles by residence of the owner 31.12.2011 ......................................................... 121 7.2. Registered new vehicles 1995-2011 ............................................................................................................. 122 7.3. Distribution of cars and tractors by first year of use 2011 ............................................................................. 122 7.4. Development of vehicle stock 1962-2011 ..................................................................................................... 123 7.5. Number of registered driving licences by age and sex of licence holder 31.12.2005 and 2011.................... 124 7.6. Driving licences issued by type and sex 2011 .............................................................................................. 124 7.7. Road traffic accidents 2000-2011 ................................................................................................................. 125 7.8. Persons killed or injured in road traffic accidents by group of road-users 2000-2011 ................................... 125 7.9. Accidents caused by wild animals 1975-2011 .............................................................................................. 126 7.10. Public roads and bicycle roads 1985-2008, km .......................................................................................... 126 7.11. Archipelago ferry service. Number of passengers and vehicles 2000-2011 ............................................... 127 7.12. Archipelago ferry service. Transported vehicles by type of vehicle 2011 ................................................... 127 7.13. Traffic at Mariehamn airport 1985-2011 ...................................................................................................... 128 7.14. Bus transports, number of passengers 2004-2011 ..................................................................................... 129 7.15. Postal consignments 2004-2011, 1 000 pcs ............................................................................................... 129 8. Labour market 8.1. Labour force and persons not in labour force by age and sex 2010 ............................................................. 133 8.2. Employed persons by industry and sex 31.12.2009 ..................................................................................... 134 8.3. Employed persons by industry and sex 1960-2009 ...................................................................................... 135 8.4. Employed persons by industry and municipality 31.12.2009 ........................................................................ 136 8.5. Jobs by industry and municipality 31.12.2009 .............................................................................................. 137 8.6. Employed and at work in municipality 31.12.2009, commuting .................................................................... 138 8.7. Within the area employed by sex, employment status, employer sector and municipality 31.12.2009 ......... 139 8.8. Within the area employed by sex, employment status, employer sector and industry 31.12.2009 ............... 140 8.9. Within the area employed by sex, employment status and employer sector 1995-2009 .............................. 140 8.10. The most common occupations by sex 2009 .............................................................................................. 142 8.11. Unemployed and unemployment rate by sex, annual mean 1988-2011 ..................................................... 143 8.12. Unemployed in certain categories of the labour force 2000-2011, per cent openly unemployed ................ 143 8.13. Job vacancies and unemployed by occupation 2007-2011 ........................................................................ 144 8.14. Unemployment benefits by sex 1990-2011 ................................................................................................. 144 9. Wages and salaries, income and taxes 9.1. Income subject to taxation and taxes of private individuals by municipality 2008-2010 ................................ 147 9.2. Income and taxation of private individuals by size of income 2010 .............................................................. 148 9.3. Income and taxes of private individuals 1995-2010 ...................................................................................... 149 9.4. Income and taxes of private individuals by sex 2009-2010 ........................................................................... 150 9.5. Income and taxes of private individuals by age 2010, 1 000 EUR ................................................................ 151 9.6. Employees and average monthly earnings of full-time employees in the private sector by industry and sex 2010 .................................................................................................................................................................... 152 9.7. Average earnings per hour in the private sector by industry and sex 2010, all employees .......................... 153 9.8. Average monthly earnings of full-time employees of the Government of Åland by category of occupation and sex 2010, EUR .................................................................................................................................................... 154 10. National accounts, enterprises and Consumer Price Index 10.1. Gross domestic product 1975-2010, MEUR ............................................................................................... 157 10.2. Gross domestic product by industry 2010 ................................................................................................... 158 10.3. Gross domestic product in current prices 2000-2010, MEUR ..................................................................... 159 10.4. Profit and loss account and balance sheet of business enterprises by industry 2010 ................................ 160

List of tables
Statistisk årsbok för Åland – Statistical Yearbook of Åland 2012 15
10.5. Business ratios by industry 2010 ................................................................................................................ 161 10.6. Consumer price index by commodity group 2010-2012 (2010=100) .......................................................... 162 10.7. Consumer price index 1985-2012 (1985=100) ........................................................................................... 163 10.8. Enterprises by industry and municipality 2011 ............................................................................................ 164 10.9. Enterprises by industry and number of employees 2011 ............................................................................ 164 10.10. Work places by size group and municipality 2011 .................................................................................... 165 10.11. Enterprises opening and closing by industry 2005-2011 .......................................................................... 165 11. Public finance 11.1. Revenue and expenditure of the Government of Åland 2010-2011 ............................................................ 169 11.2. Expenditure of the Government of Åland 1980-2011, 1 000 EUR .............................................................. 170 11.3. Profit and loss account of the Government of Åland 2008-2011, 1 000 EUR ............................................. 171 11.4. Balance sheet of the Government of Åland 31.12.2008-2011, 1 000 EUR ................................................. 172 11.5. Profit and loss account of municipalities 2008-2011, 1 000 EUR ............................................................... 173 11.6. Funds statement of municipalities 2008-2011, 1 000 EUR ......................................................................... 174 11.7. Balance sheet of municipalities 2008-2011, 1 000 EUR ............................................................................. 175 11.8. Current finances of municipalities by task group 2010, 1 000 EUR ............................................................ 176 11.9. Net operating costs per person by task group and municipality 2010, EUR ............................................... 176 11.10. Current finances of municipalities and municipality alliances 2009-2010. Costs and revenues by group of costs and revenues ............................................................................................................................................. 177 11.11. Financial key ratios of municipalities 2011 ................................................................................................ 178 11.12. Key ratios of municipal taxation 2010-2012 .............................................................................................. 179 12. Social welfare, health and medical care 12.1. Child care by municipality 2011 .................................................................................................................. 183 12.2. Elderly care by municipality and sex 2011 .................................................................................................. 184 12.3. Clients in elderly care by age and region 2005 and 2011 ........................................................................... 184 12.4. Current expenditure on social welfare of municipalities 2010, 1 000 EUR ................................................. 185 12.5. Current net expenditure on social welfare of municipalities 2007-2010 ...................................................... 186 12.6. The Åland health and medical care organisation, consultations and treatment at polyclinics and medical centres 2011 ........................................................................................................................................................ 187 12.7. The Åland health and medical care organization, outpatient’s consultations by sex and age 2011 ............ 187 12.8. The Åland health and medical care organisation, dental care 2008-2011 .................................................. 188 12.9. The Åland health and medical care organisation, activities of inpatient departments by unit 2011 ............ 188 12.10. The Åland health and medical care organisation, activities of inpatient departments by unit and sex 2011 ............................................................................................................................................................................ 189 12.11. Health care out of Åland 2007-2011 ......................................................................................................... 189 12.12. The Åland health and medical care organisation, somatic long-term care 2006-2011 ............................. 189 12.13. The Åland health and medical care organisation, accounts 2005-2011, 1 000 EUR ................................ 190 12.14. Veterinary care 2006-2011 ....................................................................................................................... 190 12.15. Abortions by age of woman 2005-2011 .................................................................................................... 190 12.16. Family allowances by municipality December 2011 ................................................................................. 191 12.17. Pension beneficiaries by age and region 31.12.2010 ............................................................................... 192 12.18. Pension beneficiaries by type of pension and municipality 31.12.2010 .................................................... 192 12.19. Expenditure on pension benefits by type of pension and region 2010, MEUR ......................................... 193 12.20. Expenditure on pension benefits by region and pension system 2000-2010, MEUR ............................... 193 12.21. Expenditure on social security pensions by region 2005-2011, 1 000 EUR .............................................. 194 12.22. Allowances under national health insurance 2008-2009, 1 000 EUR ....................................................... 195 12.23. Refunds on medical expenses and sickness allowances 2000-2009 ....................................................... 195 13. Education and justice 13.1. Comprehensive schools autumn term 1990-2011 ...................................................................................... 199 13.2. Comprehensive schools, upper level schools and pupils autumn term 1990-2011 .................................... 199 13.3. Number of pupils in comprehensive schools autumn term 1990-2011 ....................................................... 200 13.4. Number of comprehensive schools and pupils autumn 2011 ..................................................................... 200 13.6. Students at the Åland University of Applied Sciences by sex autumn 2011 ............................................... 201 13.7. Students after comprehensive school and at the Åland University of Applied Sciences by school autumn term 1985-2011 ................................................................................................................................................... 202 13.8. Graduated students at the upper second level by school and sex 2010-2011 ............................................ 202 13.10. Graduated students from schools in Åland 2000-2011 ............................................................................. 203 13.11. The Åland University of Applied Sciences, the open university 1990-2011 .............................................. 204

List of tables
16 Statistisk årsbok för Åland – Statistical Yearbook of Åland 2012
13.12. The Åland University of Applied Sciences, participants in academic courses of the open university by field of education and sex 2010-2011 ......................................................................................................................... 204 13.13. Students at Music school by sex 1995-2011 ............................................................................................ 205 13.14. Adult Education Center 1990-2011 ........................................................................................................... 205 13.15. Students at apprenticeship training by sex and field of education 2011 ................................................... 205 13.16. Students from Åland in schools outside Åland by country of school and level of education 2011 ............ 206 13.17. Financial support to students 2007-2011 .................................................................................................. 206 13.18. Number of teachers by level of school, position, sex and average age spring term 2011 ........................ 207 13.19. Population with secondary and tertiary educational qualification by age and sex 2007-2010, per cent .... 208 13.20. Population by field of education 2008-2010 .............................................................................................. 208 13.21. Public libraries 1985-2011 ........................................................................................................................ 209 13.22. Public libraries by municipality 2011 ......................................................................................................... 209 13.23. Book production in Åland by subject area 2006-2011 .............................................................................. 210 13.24. Current expenditure on education and culture of municipalities 2010, 1 000 EUR ................................... 211 13.25. Government of Åland subsidies for comprehensive school expenditure 2007-2011, 1 000 EUR ............. 211 13.26. Daily newspapers, circulation 1999-2011 ................................................................................................. 212 13.27. Museums, visits 2000-2011 ...................................................................................................................... 212 13.28. Åland Provincial Archives 1978-2011 ....................................................................................................... 212 13.29. Members and activities of parishes 2000-2010 ........................................................................................ 213 13.30. Members and economy of parishes 2010 ................................................................................................. 213 13.31. Offences known to the police by sex and age 2011 ................................................................................. 214 13.32. Åland General Court of first instance 2000-2011 ...................................................................................... 214 14. Elections 14.1. Legislative Assembly elections 1979-2011. Distribution of votes, candidates and seats by political group 217 14.2. Legislative Assembly election 2011. Votes, candidates and seats by sex and political group .................... 218 14.3. Legislative Assembly election 2011. Entitled to vote and number of voters by municipality and sex .......... 219 14.4. Rejected votes by cause, Legislative Assembly election and the municipal elections 2011 ....................... 219 14.5. Participation in Legislative Assembly and municipal elections by age and sex 1999-2011, per cent ......... 220 14.6. Municipal elections 1995-2011. Distribution of votes, candidates and seats by political group .................. 221 14.7. Municipal elections 2011. Entitled to vote and number of voters by municipality and sex .......................... 222 14.8. Municipal elections 2011. Valid votes by political group, sex and municipality ........................................... 223 14.9. Municipal elections 2011. Candidates by political group, sex and municipality .......................................... 224 14.10. Municipal elections 2011. Distribution of seats in the municipality councils by political group and sex .... 224 14.11. Finnish Presidential election 2012. Valid votes and participation by sex .................................................. 225 14.12. Election for the Parliament of Finland 2011. Valid votes, candidates and participation by sex ................. 226 14.13. European Parliament election 2009. Valid votes and participation by sex ................................................ 227 14.14. EU referendums 1994 by region and sex of voters ................................................................................... 227 14.15. Participation rate in public elections 1991-2012, per cent......................................................................... 228 14.16. Share of votes cast in advance at public elections 1991-2011, per cent .................................................. 228 15. Nordic and international comparative statistics 15.1. Land use 2010, 1 000 ha ............................................................................................................................ 231 15.2. Population by sex and age 1.1.1990-2012, 1 000 inhabitants .................................................................... 231 15.3. Life expectancy at birth by sex 2000-2011 ................................................................................................. 232 15.4. Population density 1.1.1990-2011 .............................................................................................................. 232 15.5. Population changes 2010-2011 per 1 000 of the mean population ............................................................. 232 15.6. Use of arable land 2010, 1 000 hectares .................................................................................................... 233 15.7. Fishing, annual catches 2010, tonnes ........................................................................................................ 234 15.8. Number of dwellings by type of building 2010, 1 000 pcs ........................................................................... 234 15.9. Dwellings completed 1990-2010 ................................................................................................................. 234 15.10. Number of nights spent at hotels by home country of the guests 2010, 1 000 pcs ................................... 235 15.11. Private cars 1.1.1990-2011 ....................................................................................................................... 235 15.12. Unemployed by sex 1.1.2007-2009, per cent ........................................................................................... 235 15.13. Employed persons by industry 1.1.2010, distribution by sex per cent ...................................................... 236 15.14. Consumer price index 2000-2010, 2005=100 ........................................................................................... 238 15.15. Public libraries 2000-2010 ........................................................................................................................ 238 15.16. Voting percentage in parliamentary elections 1990-2011, per cent .......................................................... 239 15.17. Countries of the world. Area, mean population and population density 2010 ........................................... 240

Figurförteckning
Statistisk årsbok för Åland – Statistical Yearbook of Åland 2012 17
Förteckning över figurer
Figur 1.1. Land- och vattenareal efter kommun 1.1.2012, km2 ............................................................................. 24 Figur 1.2. Sommarvädret 1996-2011 .................................................................................................................... 26 Figur 2.1. Befolkning efter födelseort och språk 31.12.2011 ................................................................................ 35 Figur 2.2. Befolkningsutvecklingen i regionerna 1910-2011 ................................................................................. 37 Figur 2.3. Befolkning efter kön och ålder 31.12.2011, % ...................................................................................... 43 Figur 2.4. Befolkningens åldersstruktur efter region 1970-2011 ........................................................................... 45 Figur 2.5. Försörjningskvoten 1980-2011 ............................................................................................................. 45 Figur 2.6. Andel barn (0-17 år) kommunvis 31.12.2011, procent .......................................................................... 46 Figur 2.7. Andel pensionärer kommunvis 31.12.2011, procent............................................................................. 46 Figur 2.8. Befolkning efter födelseort 1940-2011 .................................................................................................. 47 Figur 2.9. Mariehamns befolkning efter födelseort 1950-2011.............................................................................. 48 Figur 2.10. Befolkning med andra språk än svenska som modersmål efter region 31.12.2000 och 2011 ............ 49 Figur 2.11. Utländska medborgare efter medborgarskap 1990-2011 ................................................................... 50 Figur 2.12. Antal hushåll och personer i hushållen 1970-2011 ............................................................................. 52 Figur 2.13. Familjer efter typ 1990-2011 ............................................................................................................... 54 Figur 2.14. Befolkning efter huvudsaklig verksamhet 1990-2010 ......................................................................... 56 Figur 2.15. Kvinnor i och utanför arbetskraften efter ålder 31.12.2010 ................................................................. 57 Figur 2.16. Män i och utanför arbetskraften efter ålder 31.12.2010 ...................................................................... 57 Figur 2.17. Befolkningsrörelsen 1971-2011 .......................................................................................................... 58 Figur 2.18. Nativitetsnetto per 1 000 personer av befolkningen efter region 1992-2011 ...................................... 60 Figur 2.19. Befolkningsrörelsen 1971-2011, årsmedeltal ..................................................................................... 61 Figur 2.20. Födda, döda och födelsenetto 1951-2011 .......................................................................................... 62 Figur 2.21. Födda efter moderns ålder 1991-2011 ............................................................................................... 63 Figur 2.22. Döda per 1 000 personer efter ålder 1996-2011 ................................................................................ 65 Figur 2.23. Bruttoinflyttning efter utflyttningsland 1971-2011 ................................................................................ 67 Figur 3.1. Färdigställda bostäder per 1 000 invånare efter region 1975-2011 ...................................................... 75 Figur 3.2. Färdigställda bostäder efter hustyp 1975-2011 .................................................................................... 76 Figur 3.3. Antal bostadsbyggnader efter bränsle 2000-2011 ................................................................................ 78 Figur 4.1. Jordbrukslägenheternas medelåkerareal 2000-2011, hektar ............................................................... 85 Figur 4.2. Husdjurshållning 2000-2011, antal djur ................................................................................................ 87 Figur 4.3. Bruttointäkter för lantbruksprodukter 1995-2011 .................................................................................. 89 Figur 4.4. Stöd till jordbruket 2000-2011, MEUR .................................................................................................. 89 Figur 4.5. Sålt virke 1980-2011 ............................................................................................................................. 91 Figur 4.6. Fisket och fiskodlingen 2000-2011, volym och värde ........................................................................... 93 Figur 4.7. Fällda rådjur 1973-2011 ....................................................................................................................... 93 Figur 4.8. Fällda sälar 2000-2011 ......................................................................................................................... 94 Figur 5.1. Arbetstagare, tjänstemän och företagare inom industrin 1995-2008 .................................................... 99 Figur 5.2. Arbetade timmar inom tillverkningsindustrin 1995-2010 ..................................................................... 101 Figur 5.3. Utrikesvaruhandel efter näringsgren 2011, 1 000 EUR ...................................................................... 105 Figur 5.4. Företagsverksamhetens kreditbestånd efter näringsgren 2000-2008 ................................................. 107 Figur 6.1. Fartyg efter bruttodräktighet 2000-2011 ............................................................................................. 111 Figur 6.2. Passagerar- och lastfartyg efter bruttoregisterton 2000-2011 ............................................................ 112 Figur 6.3. Till Åland anlända resenärer 1958-2011 ............................................................................................. 115 Figur 6.4. Antal övernattningar på hotell efter gästernas hemland 1995-2011 ................................................... 117 Figur 7.1. Personbilar per 1 000 invånare efter kommun 31.12.2011 ................................................................. 121 Figur 7.2. Utfärdade körkort efter kön 1990-2010 ............................................................................................... 124 Figur 7.3. Antal passagerare och fordon på skärgårdsfärjorna 1975-2011 ......................................................... 128 Figur 8.1. Sysselsättningsgrad 1999-2010 ......................................................................................................... 133 Figur 8.2. Sysselsatta efter näringsgren och kön 31.12.2009, procent ............................................................... 138 Figur 8.3. Egna företagare per 1 000 personer efter kommun 31.12.2010 ......................................................... 139 Figur 8.4. Sysselsatta efter region 1880-2009 .................................................................................................... 141 Figur 8.5. Arbetande efter sektor och kön 2009 .................................................................................................. 141 Figur 9.1. Beskattningsbar inkomst och skatt efter person 2005-2010 ............................................................... 147 Figur 9.2. Beskattning efter inkomstklass 2010, procent av skatterna ................................................................ 148 Figur 10.1. BNP per capita 1975-2010, fasta priser ............................................................................................ 157 Figur 10.2. BNP efter näringsgren 2010 ............................................................................................................. 159

Figurförteckning
18 Statistisk årsbok för Åland – Statistical Yearbook of Åland 2012
Figur 10.3. Inflationen månadsvis på Åland 1986-2012 ...................................................................................... 163 Figur 11.1. Landskapet Ålands utgifter 1980-2011, procentuell fördelning efter huvudtitel ................................ 170 Figur 11.2. Kommunernas ekonomiska nyckeltal 2009-2011, EUR/inv. ............................................................. 178 Figur 11.3. Vissa nyckeltal för alla kommuner sammanlagt 2000-2011 .............................................................. 179 Figur 12.1. Barn i barnomsorgen efter ålder 2011 .............................................................................................. 183 Figur 12.2. Kommunernas kostnader för socialväsendet 2010, procent ............................................................. 186 Figur 12.3. Vårddagar inom Ålands hälso- och sjukvård 2000-2011 .................................................................. 188 Figur 12.4. Familjer som fått barnbidrag efter antal barn och region 2011 ......................................................... 191 Figur 12.5. Arbetspensioner för privata och offentliga sektorn 2000-2010, MEUR ............................................. 193 Figur 12.6. Pensionstagare 1975-2010 .............................................................................................................. 194 Figur 13.1. Antal grundskolelever efter stadium 1975-2011 ............................................................................... 199 Figur 13.2. Studerande på Åland med hemort utanför Åland 2003-2011 ........................................................... 201 Figur 13.3. Antal utexaminerade från Åland efter nivå 2003-2011 ...................................................................... 204 Figur 13.4. Studiepenning efter studieland 1985-2011 ....................................................................................... 206 Figur 13.5. Lärare efter skolnivå och kön 2011 ................................................................................................... 207 Figur 13.6. Biblioteksverksamheten 1975-2011 .................................................................................................. 209 Figur 13.7. Bokproduktion på Åland efter område 2000-2011 ............................................................................ 210 Figur 14.1. Könsfördelningen i lagtinget 1922-2011 ........................................................................................... 217 Figur 14.2. Kvinnornas och männens andel i lagtingsvalen 1995-2011 .............................................................. 218 Figur 14.3. Valdeltagandet i lagtingsvalet efter ålder och kön 2011 ................................................................... 220 Figur 14.4. Könsfördelningen i kommunernas fullmäktige efter region 1999-2011 ............................................. 221 Figur 14.5. Valdeltagande i kommunalvalen efter innehav av hembygdsrätt 1999-2011 .................................... 222 Figur 14.6. Presidentvalen 1994-2012. Rösternas fördelning i andra omgången ............................................... 225 Figur 14.7. Riksdagsvalen 1995-2011. Antal röster efter lista ............................................................................ 226 Figur 15.1. Befolkning efter ålder 1.1.2011 ......................................................................................................... 231 Figur 15.2. Befolkningsprognos 2010-2050, Index 2010 = 100 .......................................................................... 233 Figur 15.3. Ekologisk odling 2009, andel av åkermarken, % .............................................................................. 233 Figur 15.4. Sysselsättningsgrad efter kön 1.1.2010 ............................................................................................ 237 Figur 15.5. Bruttonationalprodukten per capita 2000 och 2010, EUR PPP ....................................................... 237 Figur 15.6. Barn i dagvård 2005 och 2010, procent av 0-6 åringar ..................................................................... 237 Figur 15.7. Dagstidningar, genomsnittlig nettoupplaga per 100 personer 2009-2010 ........................................ 238

List of figures
Statistisk årsbok för Åland – Statistical Yearbook of Åland 2012 19
List of figures Figure 1.1. Land and water areas by municipality 1.1.2012, km2 .......................................................................... 24 Figure 1.2. Summer weather 1996-2011 ............................................................................................................... 26 Figure 2.1. Population by place of birth and language 31.12.2011 ........................................................................ 35 Figure 2.2. Population development in the regions 1910-2011 ............................................................................. 37 Figure 2.3. Population by sex and age 31.12.2011, % .......................................................................................... 43 Figure 2.4. Age structure of the population by region 1970-2011 .......................................................................... 45 Figure 2.5. Dependency ratio 1980-2011 .............................................................................................................. 45 Figure 2.6. Children (0-17 years old) by municipality 31.12.2011, per cent ........................................................... 46 Figure 2.7. Share of pensioners by municipality 31.12.2011, per cent .................................................................. 46 Figure 2.8. Population by country of birth 1940-2011 ............................................................................................ 47 Figure 2.9. Population of Mariehamn by place of birth 1950-2011 ........................................................................ 48 Figure 2.10. Population with other native languages than Swedish by region 31.12.2000 and 2011 .................... 49 Figure 2.11. Foreign citizens by citizenship 1990-2011 ......................................................................................... 50 Figure 2.12. Number of households and persons per household 1970-2011 ........................................................ 52 Figure 2.14. Population by main activity 1990-2010 .............................................................................................. 56 Figure 2.15. Females in labour force and not in labour force by age 31.12.2010 .................................................. 57 Figure 2.16. Males in labour force and not in labour force by age 31.12.2010 ...................................................... 57 Figure 2.17. Vital statistics 1971-2011 ................................................................................................................... 58 Figure 2.18. Excess of births per 1 000 of mean population by region 1992-2011 ................................................ 60 Figure 2.19. Population changes 1971-2011, average .......................................................................................... 61 Figure 2.20. Births, deaths and excess of births 1951-2011 .................................................................................. 62 Figure 2.21. Births by age of mother 1991-2011 ................................................................................................... 63 Figure 2.22. Deaths per 1 000 persons by age 1996-2011 ................................................................................... 65 Figure 2.23. Immigration by country of emigration 1971-2011............................................................................... 67 Figure 3.1. Dwellings completed per 1 000 of population by region 1975-2011 .................................................... 75 Figure 3.2. Dwellings completed by type of building 1975-2011 ............................................................................ 76 Figure 3.3. Residential buildings by heating fuel 2000-2011 ................................................................................. 78 Figure 4.1. Average land area of farms 2000-2011, hectares................................................................................ 85 Figure 4.2. Livestock 2000-2011, number of animals ............................................................................................ 87 Figure 4.3. Gross income of agricultural production 1995-2011 ............................................................................ 89 Figure 4.4. Agricultural subsidies 2000-2010, MEUR ............................................................................................ 89 Figure 4.5. Delivery of pulp and logs 1980-2011 ................................................................................................... 91 Figure 4.6. Fishing and fish culture 2000-2011, tonnes and value ........................................................................ 93 Figure 4.7. Roe deers shot 1973-2011 .................................................................................................................. 93 Figure 4.8. Seals shot 2000-2011 .......................................................................................................................... 94 Figure 5.1. Employees, white-collar workers and entrepreneurs in industry 1995-2008 ........................................ 99 Figur 5.2. Hours worked in the manufacturing industry 1995-2010 .................................................................... 101 Figure 5.4. Credit stock of enterprises by industry 2000-2008 ............................................................................. 107 Figure 6.1. Vessels by gross ton 2000-2011 ....................................................................................................... 111 Figure 6.2. Passenger and cargo ships by gross ton 2000-2011 ......................................................................... 112 Figure 6.3. Travellers arrived 1958-2011 ............................................................................................................. 115 Figure 6.4. Nights spent at hotels by home country of guests 1995-2011 ........................................................... 117 Figure 7.1. Cars per 1 000 inhabitants by municipality 31.12.2011 ..................................................................... 121 Figure 7.2. Driving licences issued by sex 1990-2010 ......................................................................................... 124 Figure 7.3. Number of passengers and vehicles in the archipelago ferry service 1975-2011 .............................. 128 Figure 8.1. Employment rate 1999-2010 ............................................................................................................. 133 Figure 8.2. Employed persons by industry and sex 31.12.2009, per cent ........................................................... 138 Figure 8.3. Self-employed per 1 000 persons by municipality 31.12.2010 .......................................................... 139 Figure 8.4. Employed persons by region 1880-2009 ........................................................................................... 141 Figure 8.5. Employed by sector and sex 2009 ..................................................................................................... 141 Figure 9.1. Income subject to taxation and taxes per person 2005-2010 ............................................................ 147 Figure 9.2. Taxation by size of income 2010, per cent of taxes ........................................................................... 148 Figure 10.1. GDP per capita 1975-2010, fixed prices ......................................................................................... 157 Figure 10.2. GDP by industry 2010 ..................................................................................................................... 159 Figure 10.3. Monthly inflation in Åland 1986-2012 ............................................................................................... 163 Figure 11.1. Expenditure of the Government of Åland by department 1980-2011, per cent ................................ 170

List of figures
20 Statistisk årsbok för Åland – Statistical Yearbook of Åland 2012
Figure 11.2. Financial key ratios of municipalities 2009-2011, EUR/inh. ............................................................. 178 Figure 11.3. Financial key ratios of municipalities 2000-2011 ............................................................................. 179 Figure 12.1. Children in child care by age 2011 .................................................................................................. 183 Figure 12.2. Expenditure on social welfare of municipalities 2010, per cent ....................................................... 186 Figure 12.3. Care-days in the Åland health and medical care organisation 2000-2011 ....................................... 188 Figure 12.4. Families receiving family allowance by number of children and region 2011 .................................. 191 Figure 12.5. Employment pensions for private and public sector 2000-2010, MEUR .......................................... 193 Figure 12.6. Pension beneficiaries 1975-2010 .................................................................................................... 194 Figure 13.1. Number of pupils in comprehensive school by level 1975-2011 ...................................................... 199 Figure 13.2. Students in Åland resident out of Åland 2003-2011 ........................................................................ 201 Figure 13.3. Graduated in Åland by level 2003-2011 .......................................................................................... 204 Figure 13.4. Financial support to students by country of school 1985-2011 ........................................................ 206 Figure 13.5. Teachers by level of school and sex 2011 ....................................................................................... 207 Figure 13.6. Public libraries 1975-2011 ............................................................................................................... 209 Figure 13.7. Book production in Åland 2000-2011 ............................................................................................... 210 Figure 14.1. Members of the Legislative Assembly by sex 1922-2007 ................................................................ 217 Figure 14.2. Share of men and women in Legislative Assembly elections 1995-2011 ........................................ 218 Figure 14.3. Participation in Legislative Assembly election by age and sex 2011 ............................................... 220 Figure 14.4. Sex distribution in municipal assemblies by region 1999-2011 ....................................................... 221 Figure 14.5. Participation in municipal elections 1999-2011. Holders and non-holders of regional citizenship ... 222 Figure 14.6. Presidential elections 1994-2012. Distribution of votes in the 2nd round ........................................ 225 Figure 14.7. Parliamentary elections 1995-2011. Number of votes by political party/group ................................ 226 Figure 15.1. Inhabitants by age 1.1.2011 ............................................................................................................ 231 Figure 15.2. Population projections 2010-2050, Index 2010 = 100 ..................................................................... 233 Figure 15.3. Use of arable land, organic farming 2009, per cent ......................................................................... 233 Figure 15.4. Employment rate by sex 1.1.2010 ................................................................................................... 237 Figure 15.5. Gross domestic product per capita 2000 and 2010 EUR PPP ....................................................... 237 Figure 15.6. Children in day-care 2005 and 2010, per cent of 0-6 years ............................................................. 237 Figure 15.7. Newspapers, average daily net circulation per 100 persons 2009-2010 ......................................... 238

1
1. Miljö och energi 1. Environment and energy
Åland Kommunindelningen 1.1.2012
Municipalities 1.1.2012

Miljö och energi Statistiken över miljö och energi omfattar geografiska uppgifter, väderstatistik, naturskydd, avfallsstatistik, uppgifter om avlopp och andra belastande utsläpp samt vatten- och energiförsörjning. Objekten för statistiken är bl.a. arealer, mängden förbrukade, uppkomna och utsläppta ämnen samt energimängden. Statistiken i detta kapitel redovisas i första hand för hela Åland, men beträffande arealuppgifterna finns också kommunvisa uppgifter. En utförligare beskrivning av miljö- och energistatistiken inklusive definitioner av variabler finns på ÅSUBs webbplats www.asub.ax under Statistik efter ämne/Miljö och energi. Källorna anges under varje tabell. Tillförlitligheten är hög för areal- och väderuppgifter liksom för vatten- och energiförsörjning. För belastningen av utsläppta ämnen finns en större osäkerhet i den mån uppgifterna baseras på beräkningar i stället för mätningar. Jämförbarheten över tiden är i allmänhet god. Avfallsstatistik publiceras också vartannat år i en statistikrapport som kan beställas från ÅSUB och som även finns tillgänglig på ÅSUBs webbplats. Där finns det också miljö- och energistatistik i form av Excel- och PC-Axis-tabeller. Temaområdet ”Hållbar utveckling” innehåller statistik som belyser såväl ekologisk som social och ekonomisk hållbarhet. Ansvarig för miljö- och energistatistiken på ÅSUB är Jonas Karlsson, [email protected]
Environment and energy Statistics on environment and energy include data on geography, weather, environmental protection, waste, water- and energy supply as well as information about waste water and discharge affecting the environment. More statistics on environment and energy are available at the website of Statistics Åland www.asub.ax, in Excel-tables and PC-Axis-databases in English. Contact person is Jonas Karlsson, [email protected]

Miljö och energi
Statistisk årsbok för Åland – Statistical Yearbook of Åland 2012 23
1.1. Geografiska uppgifter 1.1. Geographical data
1.2. Land- och vattenareal efter kommun 1.1.2012, km² 1.2. Land and water areas by municipality 1.1.2012, km²
Öar/Islands Sjöar/Lakes
Totalt 6 757 379
0,25 - 1,0 3 248 2011 - 5 2 282 995 - 10 505 26
10 - 50 548 4450 - 100 72 6
100 - 500 77 2500 - 1 000 12 1
1 000 - 5 000 10 -5 000 - 10 000 2 -
10 000 - 50 000 - -50 000 - 1 -
Högsta punkt/Highest point: Orrdalsklint 129,1 m över havet/above sea level
Nordligaste landpunkt/Landpoint furthest north Storklyndan, Brändö 60o 39,3' Nordlig bredd/Lat N
Sydligaste landpunkt/Landpoint furthest south Bogskär, Kökar 59o 30,2' Nordlig bredd/Lat N
Östligaste landpunkt/Landpoint furthest east Skataskär, Kökar 21o 19,6' Östlig längd/Long E
Västligaste landpunkt/Landpoint furthest west Märket, Hammarland 19o 8,2' Östlig längd/Long E
Not/Note : Dessutom finns ca 20 000 öar och skär och ca 1 500 sjöar som är mindre än 0,25 hektar. Omkring 60 öar ärbebodda/Additionaly there are approx. 20 000 islands and islets and approx. 1 500 lakes smaller than 0,25 hectares.About 60 islands are inhabited.
Källa/Source : Lantmäteriverket/National Land Survey of Finland
Hektar/Hectares
Number of islands and lakes by size groupAntal öar och sjöar enligt storleksklass/
Landareal Andel vatten Kommun Land/ Insjöar/ Land + in- Hav/ Totalt i % av Åland/ i kommunen/
Land Lakes sjöar/Land Sea Land area in % Water area in %+ lakes of Åland of municipality
Brändö 108,0 0,4 108,4 1 540,1 1 648,5 7,0 93,4Eckerö 107,7 1,5 109,2 643,5 752,6 6,9 85,7Finström 123,3 6,9 130,2 42,3 172,5 7,9 28,5Föglö 134,8 0,3 135,1 1 733,9 1 869,0 8,7 92,8Geta 84,3 2,9 87,2 519,3 606,5 5,4 86,1Hammarland 138,2 2,0 140,1 1 082,9 1 223,0 8,9 88,7Jomala 142,5 0,8 143,4 543,6 687,0 9,2 79,3Kumlinge 99,3 0,5 99,8 760,6 860,4 6,4 88,5Kökar 63,6 0,4 63,9 2 101,1 2 165,0 4,1 97,1Lemland 113,1 0,6 113,7 851,7 965,3 7,3 88,3Lumparland 36,3 0,0 36,3 50,8 87,1 2,3 58,4Saltvik 151,9 7,0 158,9 1 007,6 1 166,5 9,8 87,0Sottunga 28,0 0,0 28,1 314,4 342,4 1,8 91,8Sund 108,1 3,8 111,9 72,4 184,3 7,0 41,3Vårdö 101,6 0,4 102,0 470,6 572,6 6,5 82,3
Mariehamn 11,8 0,0 11,8 9,0 20,8 0,8 43,1
Landskomm. 1 540,6 27,4 1 568,0 11 734,7 13 302,7 99,2 88,4-Landsbygden 1 005,4 25,4 1 030,8 4 814,1 5 844,8 64,8 82,8-Skärgården 535,2 2,0 537,2 6 920,7 7 457,9 34,5 92,8
Åland 1 552,4 27,4 1 579,8 11 743,7 13 323,5 100,0 88,3
Källa/Source : Lantmäteriverket/National Land Survey of Finland

Miljö och energi
24 Statistisk årsbok för Åland – Statistical Yearbook of Åland 2012
Figur 1.1. Land- och vattenareal efter kommun 1.1.2012, km2 Figure 1.1. Land and water areas by municipality 1.1.2012, km2
1.3. Markanvändning efter region 2001, procent 1.3. Land use by region 2001, per cent
0 500 1 000 1 500 2 000 2 500
MariehamnVårdöSund
SottungaSaltvik
LumparlandLemland
KökarKumlinge
JomalaHammarland
GetaFöglö
FinströmEckeröBrändö
Km2
Land/Land
Vatten/Water
Region Totalt Bostads- Affärsverks., Trafik, Jordbruks- Skogs- Övrigt/och fritids- förvaltn., samhälls- mark/ bruks- Other
bebygg./ industri/ teknik/ Farms mark/Residential, Business, Traffic, Forestrecreational administr., public
settlement industry utilities
Mariehamn 100,0 26,7 6,4 12,5 6,4 38,0 10,0
Landsbygden 100,0 2,6 0,1 2,8 18,2 60,2 16,0
Skärgården 100,0 1,8 0,0 1,3 14,2 56,3 26,4
Åland 100,0 2,5 0,1 2,3 16,7 58,7 19,6
Källa/Source : Lantmäteriverket/National Land Survey of Finland

Miljö och energi
Statistisk årsbok för Åland – Statistical Yearbook of Åland 2012 25
1.4. Väderleksförhållanden 1931-2011 1.4. Weather conditions 1931-2011
Månad/ Medeltemperatur oC/Month Mean temperature
1931- 1961- 1931- 1931-1960 1990 2009 2010 2011 1960 2009 2010 2011 1960 2009 2010 2011
Jan-dec 5,5 5,2 6,3 4,8 7,0 31,3 27,2 30,0 28,0 -32,4 -16,4 -24,1 29,0
Jan -3,1 -3,5 -1,5 -6,8 -2,4 8,4 5,8 -0,2 3,6 -32,4 -16,4 -20,9 -16,3Feb -4,2 -4,5 -2,7 -7,0 -8,0 11,2 3,1 1,0 3,2 -32,0 -13,4 -24,1 -29,0Mar -2,3 -2,0 -0,3 -1,9 -0,6 12,8 10,1 8,8 11,3 -25,9 -13,8 -17,6 -15,1Apr 2,6 2,5 4,9 3,3 5,3 18,7 17,4 14,3 18,8 -16,6 -6,3 -4,3 -2,3Maj 7,9 8,2 9,8 9,6 9,5 24,9 23,9 24,1 21,5 -6,9 -2,3 -2,3 -1,9Jun 12,6 13,3 12,4 13,0 15,4 28,6 27,2 22,8 27,5 -3,2 -1,0 3,8 6,0Jul 16,4 15,6 16,6 19,9 19,1 31,3 27,1 30,0 28,0 0,1 3,7 10,4 5,8Aug 15,7 14,8 16,0 16,6 16,6 31,0 24,7 26,1 24,2 -0,5 4,5 3,6 5,6Sep 11,4 10,7 12,8 11,4 13,1 25,0 19,4 18,1 20,9 -5,4 3,6 -1,3 2,6Okt 6,5 6,7 4,9 6,4 7,9 17,4 13,1 14,0 17,1 -11,9 -6,1 -4,4 -1,2Nov 2,8 2,3 4,6 -0,2 5,6 10,5 10,1 9,1 10,6 -18,1 -1,8 -18,9 -2,9Dec 0,0 -1,3 -1,5 -6,5 2,6 10,3 6,8 1,4 9,9 -21,9 -12,0 -19,9 -4,1
Högst uppmätta maximitemperatur: 31,3 i juli 1941/Highest max. temperature: 31,3 in July 1941.Lägst uppmätta minimitemperatur: -32,9 i februari 1979/Lowest min.temperature: -32,9 in February 1979.
Månad/ Sol- Vind/WindMonth Nederbörd, mm/ timmar/
Precipitation, mm Hours Medel-
of sun- hastigh./ Medelhastig-1931-1961- shine Average het/Average1960 1990 2010 2011 2011 windspeed windspeed
% m/s % m/s
Jan-dec 558 529 594 644 2 047 S 16 7,3 SW 27 7,9
Jan 48 37 23 53 43 SE 23 7,4 SW 19 8,5Feb 31 25 26 48 113 E 22 7,2 SW 17 8,2Mar 26 26 48 17 206 NW 15 7,3 SW 32 8,6Apr 33 28 34 29 241 SW 27 6,1 SW 27 6,5Maj 32 27 43 69 298 NW 21 5,6 SW 31 7,0Jun 37 34 24 59 314 S 19 6,3 E, SE, NW 18 6,3Jul 45 53 11 28 236 S 30 7,2 SE 17 5,8Aug 66 69 155 45 245 SW 18 6,4 SW 26 6,6Sep 64 65 69 94 147 S 21 7,3 SW 25 8,7Okt 57 56 46 59 141 S 26 9,4 SW 40 9,0Nov 62 63 62 45 38 NE 31 8,8 SW 27 8,3Dec 57 46 54 99 24 NE 35 8,4 SW 46 11,3
Not/Note : Före 1.10.1995 utfördes temperatur- och nederbördsmätningarna vid Mariehamns f lygplats, därefter i Jomala, Söder-sunda. Fr o m 2007 utförs mätningarna i Jomalaby. Soltimmarna mäts i Mariehamn. Vindriktning och medelvindhastighet uppmättespå Nyhamn, Lemland/Until 30.9.1995, temperature and precipitation measurements were carried out at Mariehamn airport and thereafter in Jomala, Södersunda. Since 2007, the measurements are carried out in Jomala, Jomalaby. Hours of sunshinemeasurements are carried out in Mariehamn. Prevailing wind direction and average windspeed measurements are carriedout at Nyhamn, Lemland.
Källa/Source : Finska meteorologiska institutet/Finnish Meteorological Institute
Förhärskande
vindriktning/Prevailing
wind direction
Förhärskande
vindriktning/Prevailing
wind direction
Absolut max.temperatur oC/Absolute max. temperature
Absolut min.temperatur oC/Absolute min.temperature
20112010

Miljö och energi
26 Statistisk årsbok för Åland – Statistical Yearbook of Åland 2012
Figur 1.2. Sommarvädret 1996-2011 Figure 1.2. Summer weather 1996-2011
1.5. Graddagar 2000-2011 1.5. Degree days 2000-2011
0
5
10
15
20
0
50
100
150
200
250
300
350
400
1996 1997 1998 1999 2000 2001 2002 2003 2004 2005 2006 2007 2008 2009 2010 2011
Medeltemperatur/Mean temperature
Nederbörd/Preci-pitation, mm
Nederbörd/Precipitation, mm Medeltemperatur/Mean temperature
Not/Note : I diagrammet ingår uppgifter för juni, juli och augusti respektive år /Information only for the months
of June, July and August each year included.
Månad/Month 2000 2004 2005 2006 2007 2008 2009 2010 2011
Jan-Dec 3 343 3 782 3 681 3 627 3 508 3 192 3 712 4 391 3 489
Jan 546 626 513 599 532 476 574 734 601Feb 513 548 549 597 620 418 550 667 694Mar 522 534 659 705 445 516 537 593 549Apr 349 374 390 418 369 362 376 426 367Maj 182 239 223 213 185 172 167 207 166Jun 54 47 48 24 0 7 92 16 0Jul 0 0 0 0 0 6 6 0 0Aug 19 6 0 0 39 13 0 30 0Sep 188 124 99 44 122 159 79 108 55Okt 181 322 272 239 295 224 382 348 274Nov 325 472 389 389 443 412 372 529 344Dec 464 490 539 399 458 427 577 733 439
Not/Note : Sedan 2008 mäts graddagarna i Mariehamn, tidigare mättes de i Jomala. Graddagarna beräknas utifrån utetempe-raturen och är ett mått på uppvärmningsbehovet. Graddagar används t.ex. för att normalårskorrigera energiåtgången föruppvärmning/Since 2008 degree days are measured in Mariehamn. They are calculated based on outdoor temperatureand form av standard for the need of heating used e.g. to standardize the consumption of energy for heating.
Källa/Source : Finska meteorologiska institutet/Finnish Meteorological Institute

Miljö och energi
Statistisk årsbok för Åland – Statistical Yearbook of Åland 2012 27
1.6. Slemmerns islossning 1958-2012 1.6. Break-up of the ice of Slemmern 1958-2012
1.7. I lag skyddade naturskyddsområden 1980-2011, hektar 1.7. Protected areas 1980-2011, hectares
År/Year Datum/Date År/Year År/Year Datum/Date
1958 2 maj/May 1977 23 april/April 1996 27 april/April1959 2 april/April 1978 20 april/April 1997 4 april/April1960 22 april/April 1979 30 april/April 1998 1 april/April1961 .. 1980 18 april/April 1999 8 april/April1962 23 april/April 1981 14 april/April 2000 11 april/April1963 30 april/April 1982 17 april/April 2001 11 april/April1964 24 april/April 1983 18 april/April 2002 3 april/April1965 18 april/April 1984 20 april/April 2003 20 april/April1966 7 maj/May 1985 5 maj/May 2004 10 april/April1967 10 april/April 1986 16 april/April 2005 9 april/April1968 11 april/April 1987 30 april/April 2006 22 april/April1969 22 april/April 1988 9 april/April 2007 31 mars/March1970 2 maj/May 1989 11 mars/March 2008 ..1971 14 april/April 1990 20 febr/Feb 2009 11 april/April1972 19 april/April 1991 2 april/April 2010 17 april/April1973 .. 1992 10 mars/March 2011 18 april/April1974 6 april/April 1993 26 mars/March 2012 25 mars/March1975 5 april/April 1994 17 april/April1976 18 april/April 1995 16 mars/March
Not/Note : I Mariehamn anses vintern vara över när Slemmern, f järden öster om staden, är isfri. Datumet för Slemmernsislossning härrör sig från den tippningstävling som Club Lions i Mariehamn anordnar sedan 1958/In Mariehamn, winter isconsidered to be over when the Bay of Slemmern is free of ice. The date for the break-up of the ice of Slemmern is providedby the Lions Club in Mariehamn which organises an annual competition for the forecast of this date.
Källa/Source: Club Lions
Datum/Date
1980 1990 2000 2005 2011
LandNaturreservat/Nature reserves 616 1 058 1 475 1 909 2 597% av Åland/% of Åland 0,4 0,7 1,0 1,3 1,7
Samhällsägt/Government-owned 520 903 1 124 1 435 1 895
Privatägt/Privately owned 96 155 351 474 702
Naturminnen, antal/Natural monuments 8 9 10 10 10
Fågelskyddsområden, antal/Bird protection areas 2 5 8 9 9
Vatten/WaterNaturreservat/Nature reserves 6 292 7 438 8 605 10 657 32 947% av Åland/% of Åland 1,2 1,4 1,6 0,9 2,8
Samhällsägt/Government-owned 6 292 7 438 7 935 9 987 32 277Privatägt/Privately owned - - 670 670 670
Not/Note : Ålands vattenareal utökad/Åland's water area has been enlarged
Källa/Source : LR Miljöbyrån/The Government of Åland, Environmental Office

Miljö och energi
28 Statistisk årsbok för Åland – Statistical Yearbook of Åland 2012
1.8. Vattenförsörjningen 2005-2011, 1 000 m3
1.8. Water supply 2005-2011, 1 000 m3
1.9. Ålands Vatten Ab:s vattenförsörjning 2000-2011 1.9. Water supply by Ålands Vatten Ab 2000-2011
1.10. Avloppsvattenreningen i Mariehamn 2000-2011 1.10. The treatment of waste water, Mariehamn waste water treatment plant 2000-2011
År/
Year Ålands Bocknäs Sundets Tjenan Kökar
Totalt Vatten Vatten Vatten Vatten kommun
2005 2 068 1 853 164 20 15 17
2006 2 190 1 969 164 20 16 21
2007 2 150 1 935 154 21 24 16
2008 2 333 2 100 180 21 17 14
2009 2 169 1 940 185 18 12 14
2010 2 216 1 970 200 20 12 14
2011 2 250 1 986 216 22 12 14
Källa/Source : LR Miljöbyrån, respektive vattenbolag/The Government of Åland, Environmental Office, The water companiesrespectively
Bolag/Company
År/YearOrganiskt material/ Vattenpris/
Totalt Marie- Lands- Organic material Price of water
hamn kommunerna mg/l 1) EUR/m3
2000 1 649 926 723 1,4 0,72
2005 1 853 1 025 828 1,4 0,80
2006 1 969 1 085 884 1,7 0,80
2007 1 935 1 047 888 1,8 0,80
2008 2 100 1 126 974 1,7 0,80
2009 1 940 1 041 899 1,6 0,80
2010 1 970 1 045 925 1,7 0,802011 1 986 1 056 930 1,6 0,851) Organiskt material i renvattnet anges som COD-tal. Fr o m 1.1.2001 är gränsvärdet 5 mg/l COD/The unit is COD. As of 1.1.2001, the upper limit is 5 mg/l COD.
Källa/Source : Ålands Vatten Ab
Vattenkonsumtion, 1 000 m3/Water consumption
År/Year Inkommande obehandlat avloppsvatten/ Utgående avloppsvatten (inkl bräddning)/Waste water before treatment Waste water after treatment
BOD7 1) P tot 1) N tot 1) BOD7
1) P tot 1) N 1)
m3/d kg/d kg/d kg/d kg/d kg/d kg/d2000 5 536 1 254 29 209 61,0 2,9 1662005 5 212 1 256 47 217 59,0 2,6 1702006 5 975 1 343 45 239 18,4 1,6 662007 6 579 1 128 43 265 18,1 1,2 702008 8 390 1 392 42 280 38,5 1,6 872009 6 458 1 673 51 292 25,8 1,3 662010 6 368 1 560 51 314 13,4 1,0 762011 7 419 1 450 51 334 23,8 1,3 781) BOD7= Halten av organiskt material/Share of organic materials . P= Fosfor/Phosphorus . N= Kväve/Nitrogen .Not/Note : Nya tillståndsvillkor från 1.1.2006, reningsprocessen förbättrad/Discharge allowances changed from 1.1.2006, the cleaning process improved.
Källa/Source : Mariehamns stad, Lotsbroverket/The City of Mariehamn, Lotsbroverket

Miljö och energi
Statistisk årsbok för Åland – Statistical Yearbook of Åland 2012 29
1.11. Vattendragsbelastningen på Åland 1996-2011 1.11. Strain on watercourse in Åland 1996-2011
1996 2000 2005 2006 2007 2008 2009 2010 2011
Fosfor, ton/år/Phosphorus, tonnes/year 54,9 52,2 39,1 42,1 42,4 48,0 42,3 40,4 40,2
Bosättning/Settlement
Mariehamn (inkl. industri/incl. industry) 0,6 0,9 0,7 0,6 0,4 0,6 0,5 0,4 0,5
Landsbygden (tätorter med reningsverk/ 0,3 0,3 0,3 0,3 0,3 0,3 0,3 0,3 0,3
populated area with sewage treatment plants)
Landsbygden (enskilda avlopp/ 3,7 3,6 3,6 3,1 3,1 3,1 3,1 3,1 3,1
sparsely populated area without sewage treat-
ment plants)
Jordbruk och fiskodling/Agriculture
and fish culture
Jordbruk/Agriculture 3,2 4,4 2,6 3,1 3,9 5,7 3,1 4,1 3,6
Husdjurshållning/Livestock farms 0,5 0,2 0,1 0,1 0,1 0,1 0,1 0,1 0,1
Fiskodling/Fish culture 41,6 36,0 28,0 30,0 28,0 28,0 30,0 25,5 26,6
Industri/Industry 0,8 0,5 0,4 0,4 0,4 0,4 0,5 0,5 0,4
Turism/Tourism 0,6 0,6 0,6 0,7 0,7 0,7 0,6 0,6 0,5
Naturlig avrinning/Natural draining 3,7 5,8 2,8 3,8 5,6 9,3 4,0 5,8 5,2
Kväve, ton/år/Nitrogen, tonnes/year 785 913 659 693 760 930 712 753 731
Bosättning/Settlement
Mariehamn (inkl. industri/incl. industry) 45 61 57 24 26 32 24 28 28
Landsbygden (tätorter med reningsverk/ 13 13 13 13 7 7 7 7 6
populated area with sewage treatment plants)
Landsbygden (enskilda avlopp/ 29 29 29 26 26 26 26 26 26
sparsely populated area without sewage treat-
ment plants)
Jordbruk och fiskodling/Agriculture
and fish culture
Jordbruk/Agriculture 249 322 216 241 284 402 243 298 273
Husdjurshållning/Livestock farms 11 4 2 2 2 2 2 2 2
Fiskodling/Fish culture 302 305 228 249 244 233 245 206 219
Industri/Industry 4 5 5 5 5 5 5 6 6
Turism/Tourism 5 5 5 5 5 5 5 5 5
Naturlig avrinning/Natural draining 127 169 104 145 165 218 155 176 166
Atmosfärisk deposition på vattenområden/
Athmospherical deposition over water area
Fosfor, ton/år/Phosphorus, tonnes/year 39 39 39 39 39 39 39 39 39
Kväve, ton/år/Nitrogen, tonnes/year 1 835 2 261 1 530 1 953 2 072 2 371 1 853 1 743 2 052
Källa/Source : LR Miljöbyrån/The Government of Åland, Environmental Office

Miljö och energi
30 Statistisk årsbok för Åland – Statistical Yearbook of Åland 2012
1.12. Uppkommet avfall efter avfallsslag 2010, ton 1.12. Generated waste by waste type 2010, tonnes
Totalt
Totalt 40 980 3 211 37 769
Lösningsmedel/Spent solvents 36 36 -Surt, alkaliskt eller salthaltigt/Acid, alkaline or saline 1 1 -Olja/Used oil 271 271 -Kemiskt/Chemical 94 94 0Avloppsslam från industrier/Industrial effluent sludges 45 45 -Slam och flytande avfall från avfallsbehandling/Sludgesand liquid wastes from waste treatment - - -Sjukvård och biologiskt/Health care and b iological 0 0 0Metall (järn)/Metallic (ferrous) - - -Metall (andra metaller än järn)/Metallic (non-ferrous) 102 - 102Metall (blandat järn och andra metaller)/Metallic(mixed ferrous and non-ferrous) 2 108 - 2 108Glas/Glass 570 - 570Papper och papp/Paper and cardboard 2 972 - 2 972Gummi/Rubber 183 - 183Plast/Plastic 295 - 295Trä/Wood 794 142 652Textil/Textile - - -Avfall som innehåller PCB/Waste containing PCB - - -Kasserad utrustning (exkl fordon, batterier etc)/Discarded equipment (excl. vehicles, batteries etc 207 207 0Kasserade fordon/Discardes vehicles 1 129 1 129 -Batterier och ackumulatorer/Batteries and accumulators 140 108 32Animaliskt och blandat matavfall/Animal and mixed waste 3 829 - 3 829Vegetabiliskt/Vegetal 53 - 53Spillning och urin från djur samt naturgödsel/Animalfaeces, urine and manure - - -Hushåll och liknande avfall/Household and similar wastes 6 564 - 6 564Blandade och ej differentierade material/Mixed and undifferentiated materials 121 4 117
Sorteringsrester/Sorting residues 79 - 79Vanligt slam/Common sludges 1) 6 817 - 6 817Mineraliskt bygg- och rivningsavfall/Mineral wastefrom construction and demolition 11 576 1 145 10 431Annat mineralavfall/Other mineral wastes 1 842 31 1 812Förbränning/Combustion 703 0 703Jordmassor/Soils 450 - 450Muddermassor/Dredging spoils - - -Mineralavfall från avfallsbehandling och stabiliserat avfall/Mineral wastes from waste treatment and stab ilished wastes - - -1)Uppgiften redovisad i torrsubstans/The figures include (normal) dry waste only
Källa/Source : ÅSUB, Avfallsstatistik/Statistics Åland, Waste Statistics
Avfallsslag/Type of wasteIcke farligt avfall/ Non-hazardous
Farligt avfall/ Hazardous waste

Miljö och energi
Statistisk årsbok för Åland – Statistical Yearbook of Åland 2012 31
1.13. Uppkommet avfall efter bransch 2004-2010, ton 1.13. Generated waste by industry 2004-2010, tonnes
1.14. Avfall efter destination 2004-2010, ton 1.14. Waste by destination 2004-2010, tonnes
1.15. Växtnäring som sålts till jordbrukslägenheterna 2004-2011 1.15. Sales of fertilizers to farms 2004-2011
Bransch/Industry 2004 2006 2008 2010
Totalt 31 827 27 015 29 303 40 980
Jord- o skogsbruk, fiske/Agriculture 638 1 050 614 730
Industri/Industry 4 893 3 899 7 931 7 586
Byggnadsverksamhet/Construction 1 323 1 984 1 268 11 762
Övriga tjänster/Other services 16 398 12 368 13 061 10 685Hushåll/Household 8 575 7 714 6 430 10 217
Not/Note : Uppgifterna är reviderade och redovisade i torrsubstans. På grund av att näringsgrensindelningen uppdaterades 2008 ärinte de branschvisa uppgifterna helt jämförbara med tidigare år/The figures are revised and include (normal) dry waste only. Asthe industrial classification was updated in 2008, the industrial data are not entirely comparable with previously published figures.
Källa/Source : ÅSUB, Avfallsstatistik/Statistics Åland, Waste Statistics
Destinationsort/Destination 2004 2006 2008 2010
Totalt 34 260 26 111 27 390 50 705Åland 17 584 9 783 9 667 23 101Finland 12 829 11 932 12 511 19 749Sverige/Sweden 3 846 3 471 4 375 6 629Litauen/Lithuania - - 24 1 156Estland/Estonia - 925 782 26Polen/Poland - - 15 17Peru - - 15 13Ryssland/Russia - - - 13Ukraina/Ukraine - 0 - -
Not/Note : Differensen i totalsumman gentemot uppkommet avfall i tab 1.12 och 1.13 beror på att allt avfall inte borttransporterassamma år/The difference between the total sums of generated waste (Tab. 1.12 and 1.13) and waste by destination is due to thefact that all waste is not transported in the same year as it is generated.
Källa/Source : ÅSUB, Avfallsstatistik/Statistics Åland, Waste Statistics
Gödslingsår/Year of fertilization Näringsämne/Chemical substance
Kväve/ Fosfor/ Kalium/
Nitrogen Phosphorus Potassium
Ton/Tonnes2004-2005 881 94 4272005-2006 680 69 3842006-2007 759 77 4072007-2008 791 72 3672008-2009 739 53 3172009-2010 771 65 2902010-2011 685 63 283Kg/hektar odlad åker/Kg/hectare of cultivated land2004-2005 64 7 312005-2006 51 5 292006-2007 55 6 292007-2008 57 5 262008-2009 53 4 232009-2010 55 5 212010-2011 50 5 21
Källa/Source : Yara Suomi, Tigoteam

Miljö och energi
32 Statistisk årsbok för Åland – Statistical Yearbook of Åland 2012
1.16. Oljebolagens försäljning av några vanliga oljeprodukter på Åland 1985-2011 1.16. Supply of some of the common oil products by the oil companies in Åland 1985-2011
1.17. Elförsörjningen 1995-2011, Gigawattimmar (GWh) 1.17. Supply of electricity 1995-2011, GWh
År/Year Bensin/ Dieselolja/ Lätt eldningsolja/
Gasoline, m 3 Diesel oil, m 3 Heating oil, m 3
1985 11 641 4 783 35 7181986 12 409 5 019 36 8731987 13 436 5 796 37 7981988 13 420 5 813 37 3141989 13 502 4 914 34 7161990 15 530 6 314 35 2541991 14 942 7 025 34 6391992 14 876 4 946 39 9651993 14 083 5 375 34 1351994 15 030 5 769 35 9661995 14 159 5 337 34 3441996 13 283 5 721 35 3451997 14 658 4 715 35 3361998 13 718 5 426 35 8061999 14 023 6 104 39 4572000 14 069 6 902 39 0842001 14 217 7 180 41 0092002 14 152 7 250 39 7712003 13 504 7 257 40 1132004 13 999 7 355 38 4622005 14 313 7 600 39 0112006 16 939 8 168 37 5402007 17 442 8 782 30 7262008 .. .. ..2009 14 276 9 645 28 2652010 14 528 10 127 33 2512011 15 243 11 297 24 238
Källa/Source : Oljebranschens centralförbund/Finnish Oil and Gas Federation
1995 2000 2005 2008 2009 2010 2011
Anskaffning/Purchase 211 242 267 267 276 300 284Import, Sverige/Sweden 123 194 225 185 193 206 193Import, Finland 9 14 18 12 17 22 16Egen produktion/Own production 79 34 23 70 67 72 74
olja/from oil 78 20 4 2 2 8 2vindkraft/wind power 1 15 19 62 54 53 65biokraft/bio energy .. .. .. 5 11 11 8
Försäljning/Sale 186,7 209,3 241,4 240,8 249,8 271,7 260,1Ålands elandelslag 106,3 126,6 144,7 144,4 149,8 167,2 155,9 Enskilda/Households 50,0 56,9 67,3 66,8 71,9 82,9 74,9 Jordbruk/Agriculture 17,9 17,7 18,0 17,1 17,5 19,0 16,9 Förädling/Manufacturing 15,4 19,9 21,0 20,9 20,4 23,1 22,8 Service/Services 13,5 19,0 23,2 24,5 25,0 26,5 26,3 Off. sektor/Public sector 9,5 13,1 15,2 15,1 15,0 15,7 15,0
Mariehamns stads elverk 80,4 82,7 96,7 96,4 100,0 104,5 104,2 Enskilda/Households 31,3 31,3 37,7 37,3 40,6 43,0 41,8 Förädling/Manufacturing 10,8 9,5 9,4 9,1 9,0 10,2 9,8 Service/Services 26,3 26,0 30,9 29,6 28,0 30,7 27,9 Off. sektor/Public sector 12,0 15,9 18,7 20,4 22,4 20,6 24,7
Not/Note : Skillnaden mellan anskaffning och försäljning utgörs av kraftverkets egen förbrukning samt nätförluster/The discrepancy between purchases and sales is due to losses and the board's own consumption.
Källa/Source : Kraftnät Åland, Mariehamns stads elverk och Ålands elandelslag

2
2. Befolkning 2. Population
0
5 000
10 000
15 000
20 000
25 000
30 000
35 000
40 000
1910 1920 1930 1940 1950 1960 1970 1980 1990 2000 2010 2020 2030 2040
Personer/Persons
Befolkning och befolkningsprognos 1910-2040 Population and population projection 1910-2040
Befolkning/Population Befolkningsprognos/Population projection

Befolkning Befolkningsstatistiken omfattar uppgifter om såväl befolkningsrörelsen som befolkningens storlek och struktur inklusive hushåll och familjer. Därtill ingår i detta kapitel statistik över befolkningens huvudsakliga verksamhet samt befolkningsprognoser. Objekt för statistiken är individerna. Uppgifter om befolkningens struktur och dess förändringar presenteras i de flesta fall både som absoluta tal och i procent. Vissa av befolkningsrörelseuppgifterna anges också som relationstal per 1 000 personer. Förutom för hela Åland redovisas en stor del av statistiken i detta kapitel även efter kommun och region, antalet invånare också efter by och stadsdel. En utförligare beskrivning av befolkningsstatistiken inklusive definitioner av variabler finns på ÅSUBs webbplats www.asub.ax under Statistik efter ämne/Befolkning. Där finns också information om befolkningsdatasystemet. Källorna anges under varje tabell. Tillförlitligheten är hög i och med att statistiken baseras på de uppgifter som finns i befolkningsregistret och de anmälningar om förändringar som inkommer dit. Befolkningsrörelsesiffrorna (inklusive korrigeringar) stämmer helt överens med de förändringar av befolkningens storlek som noteras årligen. Jämförbarheten är god såväl när det gäller jämförelser över tiden som med andra statistikområden, t.ex. arbetsmarknad, socialväsende, utbildning och val, där uppgifterna sätts i relation till befolkningen. ÅSUB publicerar en detaljerad befolkningsstatistik, bl.a. en större årlig statistikrapport som kan beställas från ÅSUB och som även finns tillgänglig på ÅSUBs webbplats. Där finns också ett antal statistikmeddelanden och webbpubliceringar liksom befolkningsstatistik i form av Excel- och PC-Axis-tabeller. Ansvarig för befolkningsstatistiken på ÅSUB är Kenth Häggblom, [email protected].
Population The chapter on population statistics includes data on population changes, the size and structure of the population as well as population projections. More population statistics are available at the website of Statistics Åland, www.asub.ax, in Excel-tables and PC-Axis-databases in English. Contact person is Kenth Häggblom, [email protected].

Befolkning
Statistisk årsbok för Åland – Statistical Yearbook of Åland 2012 35
2.1. Befolkning efter region, födelseort, språk och kön 31.12.2011 2.1. Population by region, place of birth, language and sex 31.12.2011
Figur 2.1. Befolkning efter födelseort och språk 31.12.2011 Figure 2.1. Population by place of birth and language 31.12.2011
Region
Födelseort/Place of b irth Procentuell fördelning/
Språk/Language Antal Procent
Kvinnor Män Kvinnor Män
Totalt 28 355 100,0 14 219 14 136 50,1 49,9
RegionMariehamn 11 263 39,7 5 878 5 385 52,2 47,8Landsbygden 14 873 52,5 7 291 7 582 49,0 51,0Skärgården 2 219 7,8 1 050 1 169 47,3 52,7
Födelseort/Place of birthÅland 18 824 66,4 8 958 9 866 47,6 52,4Finland 5 513 19,4 3 311 2 202 60,1 39,9Sverige/Sweden 2 187 7,7 1 054 1 133 48,2 51,8Övr. Norden/Other Nordic countries 96 0,3 45 51 46,9 53,1Övr. länder/Other countries 1 592 5,6 769 823 48,3 51,7Okänt/Unknown 143 0,5 82 61 57,3 42,7
Språk/LanguageSvenska/Swedish 25 361 89,4 12 531 12 830 49,4 50,6
Finska/Finnish 1 371 4,8 912 459 66,5 33,5Övriga/Other 1 623 5,7 776 847 47,8 52,2
Källa/Source : ÅSUB, Befolkningsregistercentralen/Statistics Åland, Central Population Register
Befolkning totalt/
Total population
Per cent
Antal
Fördelning på kön/Distribution by sex
0
2 000
4 000
6 000
8 000
10 000
12 000
14 000
16 000
18 000
20 000
Åland Finland Utomlands/Other countries
Personer/Persons
Födelseort/Place of birth
Annat språk/Other
Svenska/Swedish

Befolkning
36 Statistisk årsbok för Åland – Statistical Yearbook of Åland 2012
2.2. Befolkning efter kön, födelseort och språk 1920-2011 2.2. Population by sex, country of birth and language 1920-2011
År/Year Totalt K M Åland Finland Utomlands/ Svenska/ Finska/ Övriga/
Foreign count. Swedish Finnish Other
Antal1920 20 423 10 911 9 512 .. .. .. 19 650 766 71930 19 705 10 517 9 188 .. .. .. 19 050 647 81940 21 196 11 013 10 183 18 381 2 428 387 20 293 885 181950 21 690 11 229 10 461 18 300 2 926 464 20 879 770 411960 20 981 10 722 10 259 17 521 2 930 530 20 257 715 91970 20 666 10 417 10 249 16 473 3 316 877 19 903 733 301980 22 783 11 509 11 274 17 364 4 477 942 21 682 1 005 961990 24 604 12 497 12 107 18 229 4 857 1 518 23 243 1 128 2332000 25 776 13 076 12 700 18 682 5 109 1 985 24 169 1 238 3692001 26 008 13 208 12 800 18 694 5 246 2 068 24 323 1 271 4142002 26 257 13 325 12 932 18 679 5 331 2 247 24 461 1 301 4952003 26 347 13 390 12 957 18 617 5 331 2 399 24 485 1 298 5642004 26 530 13 428 13 102 18 582 5 378 2 570 24 522 1 339 6692005 26 766 13 521 13 245 18 618 5 395 2 753 24 636 1 344 7862006 26 923 13 571 13 352 18 618 5 390 2 915 24 684 1 352 8872007 27 153 13 691 13 462 18 623 5 388 3 142 24 764 1 367 1 0222008 27 456 13 815 13 641 18 660 5 413 3 383 24 871 1 385 1 2002009 27 734 13 927 13 807 18 686 5 465 3 583 25 028 1 388 1 3182010 28 007 14 054 13 953 18 732 5 490 3 785 25 173 1 373 1 4612011 28 355 14 219 14 136 18 824 5 513 4 018 25 361 1 371 1 623
Procent/Per cent1920 100,0 53,4 46,6 .. .. .. 96,2 3,8 0,01930 100,0 53,4 46,6 .. .. .. 96,7 3,3 0,01940 100,0 52,0 48,0 86,7 11,5 1,8 95,7 4,2 0,11950 100,0 51,8 48,2 84,4 13,5 2,1 96,3 3,6 0,21960 100,0 51,1 48,9 83,5 14,0 2,5 96,5 3,4 0,01970 100,0 50,4 49,6 79,7 16,0 4,2 96,3 3,5 0,11980 100,0 50,5 49,5 76,2 19,7 4,1 95,2 4,4 0,41990 100,0 50,8 49,2 74,1 19,7 6,2 94,5 4,6 0,92000 100,0 50,7 49,3 72,5 19,8 7,7 93,8 4,8 1,42001 100,0 50,8 49,2 71,9 20,2 8,0 93,5 4,9 1,62002 100,0 50,7 49,3 71,1 20,3 8,6 93,2 5,0 1,92003 100,0 50,8 49,2 70,7 20,2 9,1 92,9 4,9 2,12004 100,0 50,6 49,4 70,0 20,3 9,7 92,4 5,0 2,52005 100,0 50,5 49,5 69,6 20,2 10,3 92,0 5,0 2,92006 100,0 50,4 49,6 69,2 20,0 10,8 91,7 5,0 3,32007 100,0 50,4 49,6 68,6 19,8 11,6 91,2 5,0 3,82008 100,0 50,3 49,7 68,0 19,7 12,3 90,6 5,0 4,42009 100,0 50,2 49,8 67,4 19,7 12,9 90,2 5,0 4,82010 100,0 50,2 49,8 66,9 19,6 13,5 89,9 4,9 5,22011 100,0 50,1 49,9 66,4 19,4 14,2 89,4 4,8 5,7
Källa/Source : ÅSUB, Befolkningsregistercentralen/Statistics Åland, Central Population Register
Språk/LanguageFödelseort/Country of b irthKön/Sex

Befolkning
Statistisk årsbok för Åland – Statistical Yearbook of Åland 2012 37
2.3. Befolkning efter kommun 31.12.1910-2011 2.3. Population by municipality 31.12.1910-2011
Figur 2.2. Befolkningsutvecklingen i regionerna 1910-2011 Figure 2.2. Population development in the regions 1910-2011
Kommun 1910 1920 1930 1940 1950 1960 1970 1980 1990 2000 2010 2011
Brändö 1 147 1 142 1 021 984 927 766 612 550 529 514 488 480
Eckerö 1 082 1 133 1 050 1 028 942 846 690 685 811 830 943 978
Finström 2 105 1 958 2 014 2 014 2 089 1 801 1 678 2 052 2 206 2 299 2 502 2 527
Föglö 1 457 1 424 1 418 1 349 1 188 1 022 684 608 606 595 580 577
Geta 969 868 783 756 775 594 471 471 478 478 475 492
Hammarland 1 669 1 542 1 338 1 488 1 454 1 202 1 024 1 196 1 233 1 351 1 508 1 526
Jomala 2 418 2 370 2 176 2 735 3 413 1 977 2 051 2 615 3 025 3 328 4 098 4 249
Kumlinge 917 895 860 833 788 625 523 454 465 405 364 361
Kökar 879 875 785 741 683 561 369 304 296 296 259 249
Lemland 1 615 1 460 1 342 1 459 1 342 927 691 954 1 269 1 585 1 814 1 860
Lumparland 564 489 419 482 448 359 312 302 322 377 394 399
Saltvik 2 595 2 416 2 529 2 232 2 041 1 656 1 469 1 564 1 634 1 679 1 802 1 810
Sottunga 366 373 348 339 299 259 175 149 133 129 119 103
Sund 1 521 1 439 1 376 1 441 1 382 1 151 949 939 948 1 013 1 019 1 032
Vårdö 1 037 965 777 698 646 550 422 387 386 409 452 449
Mariehamn 1 015 1 074 1 469 2 617 3 273 6 685 8 546 9 553 10 263 10 488 11 190 11 263
Landskomm. 20 341 19 349 18 236 18 579 18 417 14 296 12 120 13 230 14 341 15 288 16 817 17 092
-Landsbygden 14 538 13 675 13 027 13 635 13 886 10 513 9 335 10 778 11 926 12 940 14 555 14 873
-Skärgården 5 803 5 674 5 209 4 944 4 531 3 783 2 785 2 452 2 415 2 348 2 262 2 219
Åland 21 356 20 423 19 705 21 196 21 690 20 981 20 666 22 783 24 604 25 776 28 007 28 355
Not/Note : Delar av Jomala inkorporerades med Mariehamn 1.1.1961. Inkorporeringen är dock beaktad i siffrorna för 1960/On 1.1.1961, parts of Jomala were incorporated into Mariehamn. The incorporation is observed in the figures for 1960.
Källa/Source : ÅSUB, Befolkningsregistercentralen/Statistics Åland, Central Population Register
Skärgården/Archipelago
Landsbygden/Rural districts
Mariehamn
0
5 000
10 000
15 000
20 000
25 000
30 000
1910 1920 1930 1940 1950 1960 1970 1980 1990 2000 2010 2011
Antal

Befolkning
38 Statistisk årsbok för Åland – Statistical Yearbook of Åland 2012
2.4. Befolkning efter kommun och kön 31.12.2000 och 2011 2.4. Population by municipality and sex 31.12.2000 and 2011
2.5. Antal kvinnor i åldern 15-44 år per 100 män i samma ålder 31.12.1980-2011 2.5. Women aged 15-44 per 100 men aged 15-44 31.12.1980-2011
Kommun
Kvinnor Män Kvinnor Män Kvinnor Män Kvinnor Män
Brändö 247 267 48,1 51,9 220 260 45,8 54,2
Eckerö 418 412 50,4 49,6 472 506 48,3 51,7
Finström 1 170 1 129 50,9 49,1 1 269 1 258 50,2 49,8
Föglö 293 302 49,2 50,8 279 298 48,4 51,6
Geta 232 246 48,5 51,5 232 260 47,2 52,8
Hammarland 664 687 49,1 50,9 753 773 49,3 50,7
Jomala 1 639 1 689 49,2 50,8 2 070 2 179 48,7 51,3
Kumlinge 182 223 44,9 55,1 175 186 48,5 51,5
Kökar 134 162 45,3 54,7 109 140 43,8 56,2
Lemland 772 813 48,7 51,3 898 962 48,3 51,7
Lumparland 179 198 47,5 52,5 195 204 48,9 51,1
Saltvik 837 842 49,9 50,1 903 907 49,9 50,1
Sottunga 72 57 55,8 44,2 51 52 49,5 50,5
Sund 493 520 48,7 51,3 499 533 48,4 51,6
Vårdö 199 210 48,7 51,3 216 233 48,1 51,9
Mariehamn 5 545 4 943 52,9 47,1 5 878 5 385 52,2 47,8
Landskomm. 7 531 7 757 49,3 50,7 8 341 8 751 48,8 51,2
-Landsbygden 6 404 6 536 49,5 50,5 7 291 7 582 49,0 51,0
-Skärgården 1 127 1 221 48,0 52,0 1 050 1 169 47,3 52,7
Åland 13 076 12 700 50,7 49,3 14 219 14 136 50,1 49,9
Källa/Source : ÅSUB, Befolkningsregistercentralen/Statistics Åland, Central Population Register
Antal Procent
2000 2011
Antal Procent
Kommun 1980 1985 1990 1995 2000 2005 2006 2007 2008 2009 2010 2011
Brändö 68 74 82 85 94 79 75 79 78 88 93 88
Eckerö 84 95 95 94 96 87 84 84 80 79 90 89
Finström 87 94 101 100 98 94 97 98 100 101 104 97
Föglö 65 79 88 104 85 82 75 79 81 79 74 84
Geta 78 70 82 74 91 96 85 96 87 82 77 74
Hammarland 83 84 85 91 91 98 103 103 101 105 96 99
Jomala 92 96 100 101 100 94 93 91 94 94 93 98
Kumlinge 66 82 79 89 86 58 59 66 64 73 72 59
Kökar 75 71 72 96 81 78 76 89 90 97 80 67
Lemland 88 97 96 103 99 99 92 93 94 92 89 88
Lumparland 95 94 89 88 75 94 91 85 81 98 95 82
Saltvik 92 87 92 92 90 87 85 90 92 91 91 90
Sottunga 53 70 67 89 129 88 76 63 86 78 68 63
Sund 80 83 90 81 87 92 94 90 90 91 93 92
Vårdö 76 79 79 88 100 87 92 96 94 88 81 71
Mariehamn 102 105 108 105 105 101 101 101 101 99 99 97
Landskomm. 84 89 93 95 94 91 90 91 92 93 92 92
-Landsbygden 88 91 95 95 95 93 93 93 94 94 94 94
-Skärgården 68 77 80 92 91 78 76 80 81 84 79 75
Åland 92 96 99 99 99 95 95 95 96 96 95 94
Källa/Source : ÅSUB, Befolkningsregistercentralen/Statistics Åland, Central Population Register

Befolkning
Statistisk årsbok för Åland – Statistical Yearbook of Åland 2012 39
2.6. Folktäthet efter kommun 31.12.1950-2011, invånare per km2 land 2.6. Population density by municipality 31.12.1950-2011, inhabitants per km2 of land area
2.7. Befolkning i och utanför tätorter 1970-2011 2.7. Population in and outside urban areas 1970-2011
Kommun 1950 1960 1970 1980 1990 2000 2005 2009 2010 2011
Brändö 9,3 7,7 6,1 5,5 5,1 5,0 5,0 4,6 4,5 4,4Eckerö 8,7 7,9 6,4 6,4 7,3 7,5 8,3 8,6 8,8 9,1Finström 17,2 14,8 13,8 16,8 18,2 18,9 20,1 20,2 20,3 20,5Föglö 9,4 8,0 5,4 4,8 4,6 4,5 4,5 4,2 4,3 4,3Geta 9,6 7,3 5,8 5,8 5,7 5,7 5,3 5,4 5,6 5,8Hammarland 11,4 9,5 8,1 9,4 9,3 10,1 10,4 10,6 10,9 11,0Jomala 23,6 14,3 14,8 18,9 21,4 23,4 25,5 28,2 28,7 29,8Kumlinge 8,7 6,9 5,8 5,0 4,8 4,2 3,7 3,7 3,7 3,6Kökar 11,3 9,3 6,1 5,0 5,1 5,1 5,3 4,1 4,1 3,9Lemland 12,4 8,6 6,4 8,8 11,4 14,2 15,2 15,8 16,0 16,4Lumparland 12,8 10,2 8,9 8,6 9,0 10,6 10,8 10,8 10,9 11,0Saltvik 14,3 11,6 10,3 10,9 10,8 11,1 11,5 11,8 11,8 11,9Sottunga 11,8 10,2 6,9 5,9 5,0 4,8 4,7 4,5 4,2 3,7Sund 11,9 10,0 8,3 8,2 8,7 9,3 9,5 9,5 9,4 9,5Vårdö 7,2 6,1 4,7 4,3 3,8 4,0 4,2 4,4 4,5 4,4
Mariehamn 1 055,8 571,4 776,9 868,5 884,7 904,1 929,3 943,4 949,1 954,5
Landskomm. 12,5 9,7 8,2 9,0 9,5 10,1 10,6 10,8 10,9 11,1-Landsbygden 14,1 10,8 9,6 11,0 11,9 13,0 13,7 14,3 14,5 14,8-Skärgården 9,2 7,7 5,6 5,0 4,7 4,5 4,5 4,2 4,2 4,1
Åland 14,6 14,2 14,0 15,4 16,1 16,9 17,5 17,9 18,0 18,3
Not/Note : Delar av Jomala inkorporerades med Mariehamn 1.1.1961. Inkorporeringen är dock beaktad i sif frorna för 1960/On 1.1.1961, parts of Jomala were incorporated into Mariehamn. The incorporation is observed in the figures for 1960.
Källa/Source : ÅSUB, Befolkningsregistercentralen/Statistics Åland, Central Population Register
1970 1980 1990 2000 2010 2011
Antal tätorter/Number of urban areas 3 5 8 8 11 8
Befolkning, antal/Population, number 20 666 22 783 24 604 25 776 28 007 28 355I tätorter/In urban areas 9 140 10 784 13 751 14 840 16 702 16 810Utanför tätorter/Outside urban areas 11 526 11 999 10 853 10 936 11 305 11 545ProcentI tätorter/In urban areas 44,2 47,3 55,9 57,6 59,6 59,3Utanför tätorter/Outside urban areas 55,8 52,7 44,1 42,4 40,4 40,7
Not/Note : Som tätorter betraktas, oberoende av administrativa gränser, alla byggnadsgrupper med minst 200 invånare, där
avståndet mellan byggnaderna i allmänhet inte överstiger 200 meter./Urban areas are all groups of buildings with at least
200 inhabitants where the distance between the bulidings generally does not exceed 200 metres, irrespective of admi-
nistrative borders. Tätorter/urban areas 2011: Storby, Godby, Kattby, Söderby, Haraldsby, Rangsby, Ödkarby samt/and
Mariehamn - centrala/central Jomala.
Källa/Source : Statistikcentralen, Folkräkningen/Statistics Finland, Population Census

Befolkning
40 Statistisk årsbok för Åland – Statistical Yearbook of Åland 2012
2.8. Byarnas och stadsdelarnas befolkning 31.12.2010-2011 2.8. Population of the villages and of the districts in Mariehamn 31.12.2010-2011
Kommun Kommun Kommun
By/Village 2010 2011 By/Village 2010 2011 By/Village 2010 2011
Hela Åland 28 007 28 355 Finholma 19 21 Strömma 35 39Flisö 14 13 Sålis 50 50
Brändö 488 480 Granboda 24 24 Torp 167 169Asterholma 10 11 Hastersboda 28 27 Torsholma - -Baggholma 12 12 Horsholma 16 15 Västmyra 18 18Björnholma 14 13 Hummersö 12 12 Äppelö 4 4Brändö 113 108 Jyddö 9 8 Öra 6 6Fiskö 42 40 Järsö - - Övriga 15 17Jurmo 49 53 Kallsö 13 12Korsö 19 20 Nötö 17 17 Jomala 4 098 4 249Lappo 51 46 Prästgården 31 25 Andersböle 4 6Torsholma 90 89 Sanda 21 20 Björsby 95 111Åva 84 85 Skogboda 14 12 Brändö 21 21Övriga 4 3 Sommarö 16 18 Buskböle 14 15
Sonboda 76 82 Dalkarby 77 84
Eckerö 943 978 Stentorpa 11 11 Djurvik 29 31Björnhuvud 29 30 Ulversö 22 23 Gottby 240 239Finbo - - Överö 17 17 Gölby 205 200Kyrkoby 129 130 Övriga 7 4 Hammarudda 11 16Marby 47 47 Hindersböle 3 5Storby 503 526 Geta 475 492 Ingby 256 304Torp 119 117 Andersö 4 3 Jettböle 4 5Överby 107 116 Bolstaholm 11 12 Jomalaby 80 82Övriga 9 12 Dånö 19 19 Karrböle 53 54
Finnö 37 38 Kila 1 1
Finström 2 502 2 527 Gräggnäs 38 38 Kungsö 189 195Bamböle 130 122 Höckböle 8 8 Möckelby 110 108Bartsgårda 64 71 Isaksö 10 19 Möckelö 231 226Bastö 54 55 Labbnäs 6 6 Norrsunda 38 38Bergö 25 23 Möckelgräs 7 5 Prästgården 419 420Bjärström 93 94 Olofsnäs 23 27 Ringsböle 22 20Emkarby 86 86 Pantsarnäs 19 17 Sviby 269 276Enbolstad 7 7 Rankoskär - - Södersunda 116 120Godby 879 887 Skinnarböle 34 43 Torp 153 162Grelsby 144 138 Snäckö 17 18 Ulfsby 52 51Kulla 63 66 Vestergeta 146 144 Vargsunda 26 25Markusböle 59 57 Östergeta 88 89 Vestansunda 142 142Pettböle 31 31 Övriga 8 6 Vesterkalmare 381 402Prästgården 26 27 Ytterby 70 67Pålsböle 132 126 Hammarland 1 508 1 526 Ödanböle 21 21Rågetsböle 35 35 Boda 66 61 Önningeby 182 195Strömsvik 23 22 Borgö - - Österkalmare 352 370Stålsby 33 32 Bovik 78 78 Överby 192 196Svartsmara 71 75 Bredbolstad 67 74 Övriga 40 41Tjudö 114 119 Byttböle 12 11Torrbolstad 60 60 Djekenböle 42 41 Kumlinge 364 361Tärnebolstad 17 19 Drygsböle 10 11 Björkö 13 13Vestanträsk 109 110 Frebbenby 198 199 Enklinge 90 89Åttböle 16 16 Fågelö - - Kumlinge 189 198Ämnäs 204 221 Hellesby 51 53 Prästgården 23 17Övriga 27 28 Kattby 118 121 Seglinge 46 41
Kråkböle 7 7 Övriga 3 3
Föglö 580 577 Lillbolstad 53 54Björsboda 22 24 Mörby 109 108 Kökar 259 249Bråttö 14 12 Näfsby 77 77 Finnö 17 17Brändö - 1 Postad 76 74 Hamnö 23 25Bänö 2 2 Prästgården 224 230 Hellsö 60 56Degerby 175 177 Skarpnåtö 25 24 Karlby 76 79

Befolkning
Statistisk årsbok för Åland – Statistical Yearbook of Åland 2012 41
Kommun Kommun KommunBy/Village 2010 2011 By/Village 2010 2011 By/Village 2010 2011Kyrkogårdsö 10 10 Långbergsöda 40 43 Övriga 8 7Österbygge 33 25 Näs 118 119Överboda 39 36 Ovanåker 53 52 Vårdö 452 449Övriga 1 1 Prästgården 148 151 Bergö - -
Rangsby 83 80 Bussö 6 6
Lemland 1 814 1 860 Ryssböle 5 5 Grundsunda 29 28Bengtsböle 17 50 Ryssö - - Ledsöra - -Bistorp 53 50 Saggö - - Listersby 38 36Björklund 3 3 Sonröda 14 14 Lövö 74 75Flaka 154 156 Strömma 19 17 Mickelsö 26 30Granboda 91 93 Syllöda 14 15 Sandö 39 38Haddnäs 17 14 Sålis 53 46 Simskäla 41 40Hellestorp 171 169 Tengsöda 67 75 Töftö 38 39Järsö 148 164 Toböle 42 41 Vargata 108 104Knutsboda 145 148 Vassböle 11 10 Vårdö 44 46Kungsholm - - Åsgårda 62 62 Ängö 5 5Lemböte 150 156 Ödkarby 357 351 Övriga 4 2Norrby 132 130 Övriga 7 11Nåtö 85 87 Mariehamn 11 190 11 263Prästgården 88 93 Sottunga 119 103 StadsdelarRörstorp 53 56 Finnö 1 1 Apalängen 59 67Stackskär 7 5 Husö 6 5 Backeberg 714 738Söderby 342 336 Hästö 2 2 Dalberg 396 379Vessingsboda 47 48 Mosshaga - - Dalbo 453 465Vesteränga 77 73 Sottunga 108 93 Espholm 7 7Övriga 34 29 Södö - - Främmanberg 520 522
Övriga 2 2 Hindersböle 494 490Lumparland 394 399 Johannebo 859 863Klemetsby 125 128 Sund 1 019 1 032 Kasberget 146 158Krogstad 35 32 Berg 1 1 Klinten 463 479Lumparby 85 92 Björby 28 28 Kvarnberg 602 596Lumpo 36 36 Bomarsund o Prästö 89 96 Lotsberget 274 281Norrboda 42 38 Brändbolstad 36 39 Norrböle 35 39Skag 12 14 Domarböle 8 7 Nyängen 545 554Svinö 54 54 Finby 83 86 Rossen 10 14Övriga 5 5 Gesterby 13 14 Sjukhuset 4 11
Gunnarsby 4 6 Storgärdan 1 11Saltvik 1 802 1 810 Hulta 40 40 Storängen 620 643Antböle 22 16 Högbolstad 49 42 Strandnäs 230 230Bertby 51 53 Jussböle 4 4 Sveden 547 547Borgboda 4 5 Kastelholm 113 115 Vreten 515 519Boxö - - Kulla 56 55 Västernäs 974 964Daglösa 16 19 Lappböle 32 33 Västra Klinten 230 226Fremmanby 34 32 Lövvik - - Västra Ytternäs 374 360Germundö 5 5 Mångstekta 50 57 Ytternäs 168 166Haga 96 93 Persby 12 12 Österbacka 37 65Haga kungsgård 13 14 Prästgården 2 1 Östernäs 1 069 1 061Haraldsby 256 267 Rosenberg 2 2 ByarHjortö 39 38 Sibby 34 31 Dalkarby 231 221Hullby 4 5 Smedsböle 74 83 Espholm 19 25Kuggböle 19 19 Strömbolstad 37 39 Hindersböle 22 18Kvarnbo 73 70 Sundby 83 79 Styrsö 9 10Laby 31 31 Svensböle 13 13 Sviby 247 245Lagmansby 27 26 Tosarby 31 33 Svinö 1 1Lavsböle 10 12 Tranvik 87 80 Ytternäs 116 114Lavö 2 3 Träsk 10 9 Övernäs - -Liby 7 10 Vivasteby 20 20 Övriga 199 174Not/Note : Kategorin "övriga" omfattar personer som har sin hemort i kommunen, men som inte har någon bostadsadress
inom kommunen t.ex. för att de bor på åldringshem eller dyl/"Övriga" includes persons without permanent address in
the munic ipality, for instance persons living in a home for aged people.
Källa/Source : ÅSUB, Befolkningsregistercentralen/Statistics Åland, Central Population Register

Befolkning
42 Statistisk årsbok för Åland – Statistical Yearbook of Åland 2012
2.9. Befolkning efter ålder och kön 31.12.2011 2.9. Population by age and sex 31.12.2011
Födelseår/ Ålder/ Födelseår/ Ålder/
Year of b irth Age Totalt Kvinnor Män Year of b irth Age Totalt Kvinnor MänTotalt 28 355 14 219 14 1362011 0 289 153 136 1959 52 404 211 1932010 1 297 148 149 1958 53 387 189 1982009 2 280 119 161 1957 54 385 214 1712008 3 313 150 163 1956 55 384 199 1852007 4 320 156 164 1955 56 374 202 1722006 5 330 157 173 1954 57 432 221 2112005 6 301 146 155 1953 58 440 214 2262004 7 317 147 170 1952 59 439 241 1982003 8 299 143 156 1951 60 387 203 1842002 9 294 153 141 1950 61 373 198 1752001 10 308 149 159 1949 62 416 216 2002000 11 301 128 173 1948 63 424 189 2351999 12 324 148 176 1947 64 418 209 2091998 13 346 165 181 1946 65 445 226 2191997 14 326 172 154 1945 66 383 186 1971996 15 322 156 166 1944 67 344 171 1731995 16 378 188 190 1943 68 305 140 1651994 17 324 170 154 1942 69 297 142 1551993 18 355 177 178 1941 70 277 118 1591992 19 334 154 180 1940 71 252 115 1371991 20 311 145 166 1939 72 235 128 1071990 21 320 136 184 1938 73 222 110 1121989 22 292 126 166 1937 74 221 118 1031988 23 307 142 165 1936 75 202 105 971987 24 287 132 155 1935 76 206 120 861986 25 280 128 152 1934 77 180 99 811985 26 294 139 155 1933 78 172 92 801984 27 301 148 153 1932 79 169 89 801983 28 327 170 157 1931 80 161 89 721982 29 349 166 183 1930 81 116 63 531981 30 329 157 172 1929 82 149 90 591980 31 365 164 201 1928 83 126 67 591979 32 322 156 166 1927 84 138 80 581978 33 321 154 167 1926 85 134 98 361977 34 324 176 148 1925 86 111 68 431976 35 363 181 182 1924 87 102 70 321975 36 378 159 219 1923 88 82 50 321974 37 362 177 185 1922 89 75 52 231973 38 366 181 185 1921 90 54 39 151972 39 348 182 166 1920 91 51 41 101971 40 384 188 196 1919 92 34 27 71970 41 373 183 190 1918 93 34 28 61969 42 361 180 181 1917 94 20 15 51968 43 421 216 205 1916 95 13 10 31967 44 462 241 221 1915 96 22 17 51966 45 426 213 213 1914 97 12 11 11965 46 448 220 228 1913 98 6 5 11964 47 415 218 197 1912 99 1 - 11963 48 381 192 189 1911 100 4 4 -1962 49 379 170 209 1910 101 - - -1961 50 383 203 180 1909 102 3 2 11960 51 397 206 191
Källa/Source : ÅSUB, Befolkningsregistercentralen/Statistics Åland, Central Population Register

Befolkning
Statistisk årsbok för Åland – Statistical Yearbook of Åland 2012 43
Figur 2.3. Befolkning efter kön och ålder 31.12.2011, % Figure 2.3. Population by sex and age 31.12.2011, %
Landsbygden Skärgården
Hela Åland Mariehamn
0123456
0-4 5-910-1415-1920-2425-2930-3435-3940-4445-4950-5455-5960-6465-6970-7475-7980-8485-8990-9495+
0 1 2 3 4 5 6 0123456
0-4 5-910-1415-1920-2425-2930-3435-3940-4445-4950-5455-5960-6465-6970-7475-7980-8485-8990-9495+
0 1 2 3 4 5 6
0123456
0-4 5-910-1415-1920-2425-2930-3435-3940-4445-4950-5455-5960-6465-6970-7475-7980-8485-8990-9495+
0 1 2 3 4 5 6 0123456
0-4 5-910-1415-1920-2425-2930-3435-3940-4445-4950-5455-5960-6465-6970-7475-7980-8485-8990-9495+
0 1 2 3 4 5 6
Män/Males Kvinnor/FemalesMän/Males Kvinnor/Females
Män/Males Kvinnor/Females Män/Males Kvinnor/Females

Befolkning
44 Statistisk årsbok för Åland – Statistical Yearbook of Åland 2012
2.10. Befolkning efter ålder och kommun 31.12.2011 2.10. Population by age and municipality 31.12.2011
Kommun Totalt 0-17 18-64 65+ 0-6 7-15 16-29 30-49 50-64 65-74 75-84 85+
Antal
Brändö 480 66 289 125 18 42 64 100 131 70 34 21
Eckerö 978 176 597 205 69 81 155 231 237 111 60 34
Finström 2 527 575 1 500 452 226 286 363 691 509 262 121 69
Föglö 577 95 328 154 24 62 73 123 141 75 52 27
Geta 492 97 282 113 38 47 80 121 93 60 38 15
Hammarland 1 526 328 912 286 136 149 239 404 312 163 96 27
Jomala 4 249 1 059 2 639 551 448 503 617 1 322 808 344 145 62
Kumlinge 361 50 210 101 17 28 48 67 100 46 39 16
Kökar 249 43 134 72 11 26 29 50 61 39 22 11
Lemland 1 860 460 1 118 282 155 252 275 511 385 173 88 21
Lumparland 399 83 223 93 26 47 44 97 92 62 23 8
Saltvik 1 810 370 1 062 378 135 193 244 456 404 198 129 51
Sottunga 103 9 57 37 1 8 11 19 27 15 10 12
Sund 1 032 211 601 220 83 91 126 277 235 129 65 26
Vårdö 449 83 240 126 29 41 58 101 94 58 51 17
Mariehamn 11 263 1 964 7 136 2 163 714 981 2 033 2 958 2 414 1 176 646 341
Landskomm. 17 092 3 705 10 192 3 195 1 416 1 856 2 426 4 570 3 629 1 805 973 417
-Landsbygden 14 873 3 359 8 934 2 580 1 316 1 649 2 143 4 110 3 075 1 502 765 313
-Skärgården 2 219 346 1 258 615 100 207 283 460 554 303 208 104
Åland 28 355 5 669 17 328 5 358 2 130 2 837 4 459 7 528 6 043 2 981 1 619 758
Procent
Brändö 100,0 13,8 60,2 26,0 3,8 8,8 13,3 20,8 27,3 14,6 7,1 4,4
Eckerö 100,0 18,0 61,0 21,0 7,1 8,3 15,8 23,6 24,2 11,3 6,1 3,5
Finström 100,0 22,8 59,4 17,9 8,9 11,3 14,4 27,3 20,1 10,4 4,8 2,7
Föglö 100,0 16,5 56,8 26,7 4,2 10,7 12,7 21,3 24,4 13,0 9,0 4,7
Geta 100,0 19,7 57,3 23,0 7,7 9,6 16,3 24,6 18,9 12,2 7,7 3,0
Hammarland 100,0 21,5 59,8 18,7 8,9 9,8 15,7 26,5 20,4 10,7 6,3 1,8
Jomala 100,0 24,9 62,1 13,0 10,5 11,8 14,5 31,1 19,0 8,1 3,4 1,5
Kumlinge 100,0 13,9 58,2 28,0 4,7 7,8 13,3 18,6 27,7 12,7 10,8 4,4
Kökar 100,0 17,3 53,8 28,9 4,4 10,4 11,6 20,1 24,5 15,7 8,8 4,4
Lemland 100,0 24,7 60,1 15,2 8,3 13,5 14,8 27,5 20,7 9,3 4,7 1,1
Lumparland 100,0 20,8 55,9 23,3 6,5 11,8 11,0 24,3 23,1 15,5 5,8 2,0
Saltvik 100,0 20,4 58,7 20,9 7,5 10,7 13,5 25,2 22,3 10,9 7,1 2,8
Sottunga 100,0 8,7 55,3 35,9 1,0 7,8 10,7 18,4 26,2 14,6 9,7 11,7
Sund 100,0 20,4 58,2 21,3 8,0 8,8 12,2 26,8 22,8 12,5 6,3 2,5
Vårdö 100,0 18,5 53,5 28,1 6,5 9,1 12,9 22,5 20,9 12,9 11,4 3,8
Mariehamn 100,0 17,4 63,4 19,2 6,3 8,7 18,1 26,3 21,4 10,4 5,7 3,0
Landskomm. 100,0 21,7 59,6 18,7 8,3 10,9 14,2 26,7 21,2 10,6 5,7 2,4
-Landsbygden 100,0 22,6 60,1 17,3 8,8 11,1 14,4 27,6 20,7 10,1 5,1 2,1
-Skärgården 100,0 15,6 56,7 27,7 4,5 9,3 12,8 20,7 25,0 13,7 9,4 4,7
Åland 100,0 20,0 61,1 18,9 7,5 10,0 15,7 26,5 21,3 10,5 5,7 2,7
Källa/Source : ÅSUB, Befolkningsregistercentralen/Statistics Åland, Central Population Register

Befolkning
Statistisk årsbok för Åland – Statistical Yearbook of Åland 2012 45
Figur 2.4. Befolkningens åldersstruktur efter region 1970-2011 Figure 2.4. Age structure of the population by region 1970-2011
Figur 2.5. Försörjningskvoten 1980-2011 Figure 2.5. Dependency ratio 1980-2011
0 %
20 %
40 %
60 %
80 %
100 %
1970
1990
2011
1970
1990
2011
1970
1990
2011
Mariehamn Landsbygden Skärgården
65+år/years
15-64år/years
-14år/years
0
10
20
30
40
50
60
70
80
1980 1984 1988 1992 1996 2000 2004 2008
Procent/Per cent
Totalt Barn och unga/Children (0-19 years) Äldre/Elderly (65+ years)
Not/Note : Antal barn och unga (0-19 år) samt antal äldre (65+ år) per 100 personer i yrkesaktiv
ålder (20-64 år)/Number of children (aged 0-19) and elderly (aged 65+) per 100 persons aged 20-64.

Befolkning
46 Statistisk årsbok för Åland – Statistical Yearbook of Åland 2012
Figur 2.6. Andel barn (0-17 år) kommunvis 31.12.2011, procent Figure 2.6. Children (0-17 years old) by municipality 31.12.2011, per cent
Figur 2.7. Andel pensionärer kommunvis 31.12.2011, procent Figure 2.7. Share of pensioners by municipality 31.12.2011, per cent

Befolkning
Statistisk årsbok för Åland – Statistical Yearbook of Åland 2012 47
Figur 2.8. Befolkning efter födelseort 1940-2011 Figure 2.8. Population by country of birth 1940-2011
2.11. Befolkning efter födelseort 31.12.1990-2011 2.11. Population by country of birth 31.12.1990-2011
0
5 000
10 000
15 000
20 000
25 000
30 000
1940 1950 1960 1970 1980 1990 2000 2010 2011
Utomlands/Foreign count.
Finland
Åland
Födelseort/Country of b irth 1990 1995 2000 2005 2008 2009 2010 2011
Totalt 24 604 25 202 25 776 26 766 27 456 27 734 28 007 28 355Åland 18 229 18 581 18 682 18 618 18 660 18 686 18 732 18 824
Finland 4 857 4 944 5 109 5 395 5 413 5 465 5 490 5 513
Sverige/Sweden 989 1 098 1 354 1 712 1 949 2 040 2 098 2 187
Övriga länder/Other countries 529 579 631 1 041 1 434 1 543 1 687 1 831 Norge/Norway 45 44 47 49 53 48 48 51 Danmark/Denmark 20 16 24 27 26 25 25 28 Island/Iceland 4 17 8 7 8 11 10 12 Storbritannien/United Kingdom 31 31 44 51 60 59 61 59 Tyskland/Germany 27 21 25 52 69 79 80 90 Estland/Estonia .. 11 24 76 103 116 128 141 Lettland/Latvia .. 1 6 70 124 163 198 227 Polen/Poland .. 12 14 35 46 47 48 50 Rumänien/Romania .. 2 3 30 116 126 165 193 Ryssland/Russia .. 10 18 41 56 53 57 61 Övriga Europa/Rest of Europe 34 42 50 133 173 202 223 245 Afrika/Africa 12 25 30 35 52 57 61 68 USA och Kanada/USA & Canada 80 68 64 60 56 58 55 58 Latinamerika/Latin America 14 15 18 29 39 39 40 39 Iran 19 29 43 80 105 106 101 104 Filippinerna/Philippines .. 7 10 21 44 47 52 56 Thailand .. 13 17 46 94 101 111 118 Övriga Asien/Rest of Asia 17 22 23 46 61 60 76 82 Oceanien/Oceania 4 5 5 3 4 3 4 6 Okänt utland/Unknown 222 188 158 150 145 143 144 143
Procent/Per cent
Åland 74,1 73,7 72,5 69,6 68,0 67,4 66,9 66,4
Finland 19,7 19,6 19,8 20,2 19,7 19,7 19,6 19,4
Sverige/Sweden 4,0 4,4 5,3 6,4 7,1 7,4 7,5 7,7Övriga/Other 2,2 2,3 2,4 3,9 5,2 5,6 6,0 6,5
Källa/Source : ÅSUB, Befolkningsregistercentralen/Statistics Åland, Central Population Register

Befolkning
48 Statistisk årsbok för Åland – Statistical Yearbook of Åland 2012
Figur 2.9. Mariehamns befolkning efter födelseort 1950-2011 Figure 2.9. Population of Mariehamn by place of birth 1950-2011
2.12. Befolkning efter födelseort och kommun 31.12.2011 2.12. Population by place of birth and municipality 31.12.2011
0
2 000
4 000
6 000
8 000
10 000
12 000
1950 1960 1985 2000 2011
Personer/Persons
Utlandet/Foreign countr.
Finland
Skärgården
Landsbygden
Mariehamn
Not/Note : I siffrorna för 1950 och 1960 ingår invånarna på de områden som inkorporerades från Jomala 1961/
In the figures for 1950 and 1960, the inhabitants of the areas incorporated from Jomala in 1961 are included.
Kommun
Totalt Nuvarande Övriga Utanför Nuvarande Övriga Utanför
hemkom./ Åland/ Åland/ hemkom./ Åland/ Åland/
Present Other Outside Present Other Outside
residence Åland Åland residence Åland Åland
Brändö 480 254 43 183 52,9 9,0 38,1
Eckerö 978 441 198 339 45,1 20,2 34,7
Finström 2 527 1 029 834 664 40,7 33,0 26,3
Föglö 577 295 107 175 51,1 18,5 30,3
Geta 492 218 120 154 44,3 24,4 31,3
Hammarland 1 526 624 499 403 40,9 32,7 26,4
Jomala 4 249 1 392 1 659 1 198 32,8 39,0 28,2
Kumlinge 361 203 45 113 56,2 12,5 31,3
Kökar 249 123 26 100 49,4 10,4 40,2
Lemland 1 860 603 695 562 32,4 37,4 30,2
Lumparland 399 164 120 115 41,1 30,1 28,8
Saltvik 1 810 819 576 415 45,2 31,8 22,9
Sottunga 103 55 23 25 53,4 22,3 24,3
Sund 1 032 445 326 261 43,1 31,6 25,3
Vårdö 449 198 103 148 44,1 22,9 33,0
Mariehamn 11 263 3 827 2 760 4 676 34,0 24,5 41,5
Landskomm. 17 092 6 863 5 374 4 855 40,2 31,4 28,4
-Landsbygden 14 873 5 735 5 027 4 111 38,6 33,8 27,6
-Skärgården 2 219 1 128 347 744 50,8 15,6 33,5
Åland 28 355 10 690 8 134 9 531 37,7 28,7 33,6
Källa/Source : ÅSUB, Befolkningsregistercentralen/Statistics Åland, Central Population Register
Antal Procent
Födelseort/Place of b irth

Befolkning
Statistisk årsbok för Åland – Statistical Yearbook of Åland 2012 49
2.13. Befolkning efter språk 31.12.1990-2011 2.13. Population by mother tongue 31.12.1990-2011
Figur 2.10. Befolkning med andra språk än svenska som modersmål efter region 31.12.2000 och 2011 Figure 2.10. Population with other native languages than Swedish by region 31.12.2000 and 2011
Språk/Mother tongue 1990 1995 2000 2005 2008 2009 2010 2011
Totalt 24 604 25 202 25 776 26 766 27 456 27 734 28 007 28 355Svenska/Swedish 23 243 23 732 24 169 24 636 24 871 25 028 25 173 25 361
Finska/Finnish 1 128 1 184 1 238 1 344 1 385 1 388 1 373 1 371
Lettiska/Latvian - - 5 64 115 159 195 231
Rumänska/Romanian - 1 2 29 116 127 166 197
Estniska/Estonian - 9 23 79 112 126 138 145
Ryska/Russian - 18 26 66 89 101 103 114
Thai/Thai 2 12 12 39 87 95 104 113
Engelska/English 51 53 69 82 99 99 97 107
Tyska/German 30 27 31 54 68 78 76 85
Kurdiska/Kurdish - - 18 47 70 67 63 65
Tagalog/Pilipino - 5 10 20 42 44 50 54
Polska/Polish 8 10 11 27 43 44 46 49
Persiska/Persian 21 30 27 37 47 44 43 45
Litauiska/Lithuanian - - - 18 22 26 33 38
Arabiska/Arabic 5 10 17 16 29 31 36 35
Norska/Norwegian 39 34 36 37 40 36 34 35
Spanska/Spanish 6 6 16 21 27 24 32 32
Albanska/Albanian - - - 11 22 25 28 28
Italienska/Italian 1 1 2 5 4 10 18 21
Serbiska/Serbian 1 - - 12 15 16 17 21
Ukrainska/Ukrainian - - 3 9 12 17 16 18
Danska/Danish 17 11 10 13 14 13 13 17
Serbokroat./Serbo-Cr. - 2 1 11 11 11 15 15
Vietnames./Vietnam. - 6 9 13 13 13 12 13
Turkiska/Turkish 1 2 2 3 4 7 11 12
Franska/French 2 7 5 11 12 11 10 12
Isländska/Icelandic 4 17 8 7 7 11 10 12
Ungerska/Hungarian 4 4 9 10 10 12 11 10
Övriga/Other 19 20 17 43 68 68 79 95Okänt/Unknown 22 1 - 2 2 3 5 4
Källa/Source : ÅSUB, Befolkningsregistercentralen/Statistics Åland, Central Population Register
0
2
4
6
8
10
12
14
2000 2011 2000 2011 2000 2011
Mariehamn Landsbygden Skärgården
Procent
Övriga/Other
Finska/Finnish
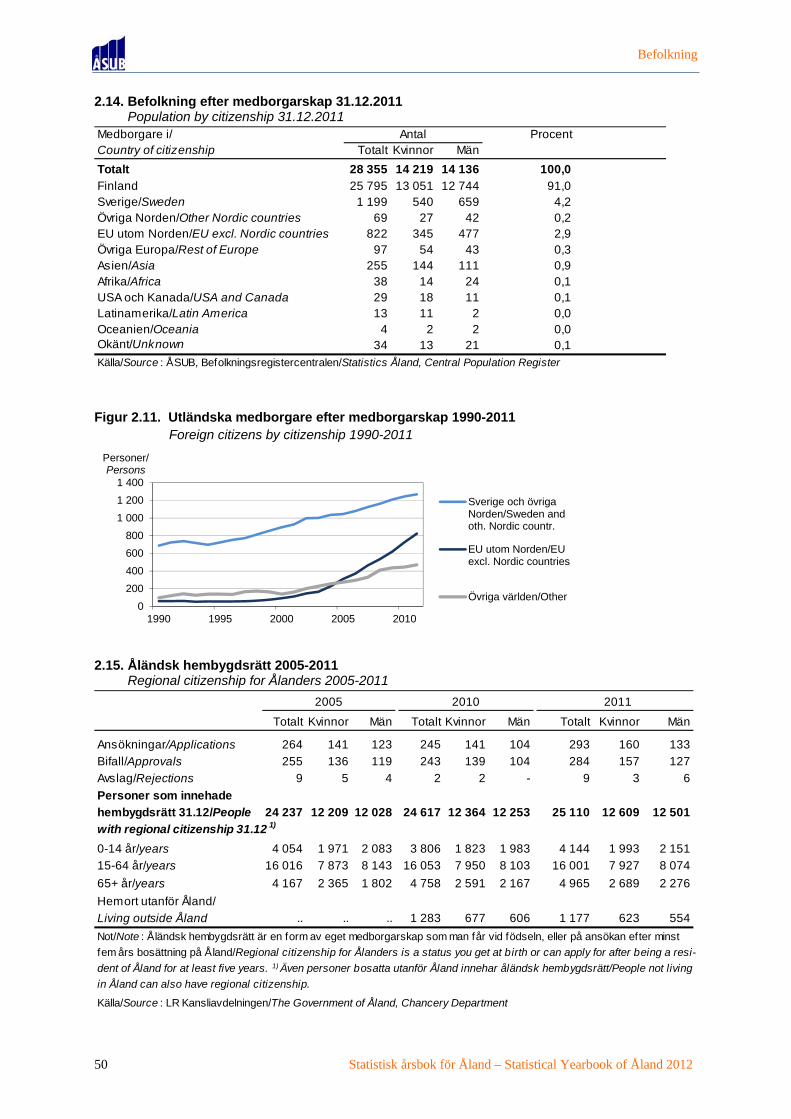
Befolkning
50 Statistisk årsbok för Åland – Statistical Yearbook of Åland 2012
2.14. Befolkning efter medborgarskap 31.12.2011 2.14. Population by citizenship 31.12.2011
Figur 2.11. Utländska medborgare efter medborgarskap 1990-2011 Figure 2.11. Foreign citizens by citizenship 1990-2011
2.15. Åländsk hembygdsrätt 2005-2011 2.15. Regional citizenship for Ålanders 2005-2011
Medborgare i/ ProcentCountry of citizenship Totalt Kvinnor Män
Totalt 28 355 14 219 14 136 100,0Finland 25 795 13 051 12 744 91,0Sverige/Sweden 1 199 540 659 4,2Övriga Norden/Other Nordic countries 69 27 42 0,2EU utom Norden/EU excl. Nordic countries 822 345 477 2,9Övriga Europa/Rest of Europe 97 54 43 0,3Asien/Asia 255 144 111 0,9Afrika/Africa 38 14 24 0,1USA och Kanada/USA and Canada 29 18 11 0,1Latinamerika/Latin America 13 11 2 0,0Oceanien/Oceania 4 2 2 0,0Okänt/Unknown 34 13 21 0,1
Källa/Source : ÅSUB, Befolkningsregistercentralen/Statistics Åland, Central Population Register
Antal
0
200
400
600
800
1 000
1 200
1 400
1990 1995 2000 2005 2010
Personer/Persons
Sverige och övrigaNorden/Sweden andoth. Nordic countr.
EU utom Norden/EUexcl. Nordic countries
Övriga världen/Other
2005 2010 2011
Totalt Kvinnor Män Totalt Kvinnor Män Totalt Kvinnor Män
Ansökningar/Applications 264 141 123 245 141 104 293 160 133
Bifall/Approvals 255 136 119 243 139 104 284 157 127
Avslag/Rejections 9 5 4 2 2 - 9 3 6
Personer som innehade
hembygdsrätt 31.12/People 24 237 12 209 12 028 24 617 12 364 12 253 25 110 12 609 12 501
with regional citizenship 31.12 1)
0-14 år/years 4 054 1 971 2 083 3 806 1 823 1 983 4 144 1 993 2 151
15-64 år/years 16 016 7 873 8 143 16 053 7 950 8 103 16 001 7 927 8 074
65+ år/years 4 167 2 365 1 802 4 758 2 591 2 167 4 965 2 689 2 276
Hemort utanför Åland/
Living outside Åland .. .. .. 1 283 677 606 1 177 623 554
Not/Note : Åländsk hembygdsrätt är en form av eget medborgarskap som man får vid födseln, eller på ansökan efter minst
fem års bosättning på Åland/Regional citizenship for Ålanders is a status you get at birth or can apply for after being a resi-
dent of Åland for at least five years. 1) Även personer bosatta utanför Åland innehar åländsk hembygdsrätt/People not living
in Åland can also have regional citizenship.
Källa/Source : LR Kansliavdelningen/The Government of Åland, Chancery Department

Befolkning
Statistisk årsbok för Åland – Statistical Yearbook of Åland 2012 51
2.16. Befolkning efter religionssamfund och ålder 31.12.2011 2.16. Population by religion and age 31.12.2011
2.17. Folkmängd efter civilstånd, kön och ålder 31.12.2011 2.17. Population by marital status, sex and age 31.12.2011
Religionssamfund/Religion
Totalt -14 15-29 30-39 40-59 60-69 70+
Totalt 28 355 4 645 4 781 3 478 8 075 3 792 3 584
Ev.-lutherska kyrkan/Lutheran National Church 23 270 3 820 3 829 2 512 6 472 3 310 3 327
Andra religionssamfund/Other religions 269 49 39 42 74 36 29
Ortodoxa kyrkan/Greek Orthodox 54 .. .. .. .. .. ..
Jehovas vittnen/Jehovah´s Witn. 50 .. .. .. .. .. ..
Adventskyrkan/Adventists 14 .. .. .. .. .. ..
Katolska kyrkan/Roman Catholic 92 .. .. .. .. .. ..
Övriga inkl. okänt/Other, unknown 59 .. .. .. .. .. ..
Utan samfund/Not member of a community 4 816 776 913 924 1 529 446 228
Procent/Per cent 100,0 100,0 100,0 100,0 100,0 100,0 100,0
Ev.-lutherska kyrkan/Lutheran National Church 82,1 82,2 80,1 72,2 80,1 87,3 92,8
Andra religionssamfund/Other religions 0,9 1,1 0,8 1,2 0,9 0,9 0,8
Utan samfund/Not member of a community 17,0 16,7 19,1 26,6 18,9 11,8 6,4
1990-2011 1990 2000 2009 2010
Tot. K M
Totalt 100,0 100,0 100,0 100,0 100,0 100,0 100,0
Ev.-lutherska kyrkan/Lutheran National Church 94,8 92,7 84,8 83,3 82,1 83,8 80,4
Andra religionssamfund/Other Religions 0,5 0,5 0,8 0,9 0,9 1,1 0,8Utan samfund/Not member of a community 4,7 6,8 14,3 15,8 17,0 15,2 18,8
Källa/Source : Statistikcentralen/Statistics Finland
2011
Ålder/Age
Civilstånd/Marital statusKön/Sex Totalt 0-19 20-29 30-39 40-64 65+ Totalt 0-19 20-29 30-39 40-64 65+
Totalt 28 355 6 358 3 068 3 478 10 093 5 358 100,0 100,0 100,0 100,0 100,0 100,0Ogifta/Single 14 457 6 356 2 748 2 053 2 845 455 51,0 100,0 89,6 59,0 28,2 8,5Gifta/Married 10 063 2 282 1 238 5 612 2 929 35,5 0,0 9,2 35,6 55,6 54,7Frånskilda/Divorced 2 277 - 38 186 1 429 624 8,0 - 1,2 5,3 14,2 11,6Änkor, änklingar/Widows, widowers 1 558 - - 1 207 1 350 5,5 - - 0,0 2,1 25,2
Kvinnor 14 219 3 079 1 432 1 687 5 136 2 885 100,0 100,0 100,0 100,0 100,0 100,0Ogifta/Single 6 659 3 077 1 219 909 1 292 162 46,8 99,9 85,1 53,9 25,2 5,6Gifta/Married 5 014 2 183 680 2 875 1 274 35,3 0,1 12,8 40,3 56,0 44,2Frånskilda/Divorced 1 276 - 30 97 812 337 9,0 - 2,1 5,7 15,8 11,7Änkor, änklingar/Widows, widowers 1 270 - - 1 157 1 112 8,9 - - 0,1 3,1 38,5
Män 14 136 3 279 1 636 1 791 4 957 2 473 100,0 100,0 100,0 100,0 100,0 100,0Ogifta/Single 7 798 3 279 1 529 1 144 1 553 293 55,2 100,0 93,5 63,9 31,3 11,8Gifta/Married 5 049 - 99 558 2 737 1 655 35,7 - 6,1 31,2 55,2 66,9Frånskilda/Divorced 1 001 - 8 89 617 287 7,1 - 0,5 5,0 12,4 11,6Änkor, änklingar/Widows, widowers 288 - - - 50 238 2,0 - - - 1,0 9,6
Not/Note : I kategorin gifta ingår 13 personer i registrerat partnerskap/In the figures for married, 13 persons with registered partnershipsare included.Källa/Source : ÅSUB, Befolkningsregistercentralen/Statistics Åland, Central Population Register
Antal Procent

Befolkning
52 Statistisk årsbok för Åland – Statistical Yearbook of Åland 2012
Figur 2.12. Antal hushåll och personer i hushållen 1970-2011 Figure 2.12. Number of households and persons per household 1970-2011
2.18. Bostadshushåll efter personantal 31.12.1970-2011 2.18. Household dwelling units by number of persons 31.12.1970-2011
0,0
0,5
1,0
1,5
2,0
2,5
3,0
0
2 500
5 000
7 500
10 000
12 500
15 000
1970 1980 1990 2000 2011
Personer per hushåll/Persons per
household
Antal hushåll/Households
Antalhushåll/Households
Personer perhushåll/Persons perhousehold
År/Year
Totalt 1 2 3 4 5 6+
Antal hushåll/Number of dwellings1970 7 227 1 722 1 791 1 415 1 209 641 4491980 9 037 2 674 2 497 1 615 1 515 531 2051990 10 335 3 481 2 931 1 676 1 518 541 1882000 11 074 3 933 3 296 1 573 1 442 602 2282008 12 551 4 817 4 009 1 612 1 414 516 1832009 12 723 4 895 4 108 1 626 1 398 517 1792010 12 894 4 975 4 176 1 657 1 421 489 1762011 13 033 4 986 4 278 1 637 1 452 504 176Procent av hushållen/Per cent of dwellings1970 100,0 23,8 24,8 19,6 16,7 8,9 6,21980 100,0 29,6 27,6 17,9 16,8 5,9 2,31990 100,0 33,7 28,4 16,2 14,7 5,2 1,82000 100,0 35,5 29,8 14,2 13,0 5,4 2,12008 100,0 38,4 31,9 12,8 11,3 4,1 1,52009 100,0 38,5 32,3 12,8 11,0 4,1 1,42010 100,0 38,6 32,4 12,9 11,0 3,8 1,42011 100,0 38,3 32,8 12,6 11,1 3,9 1,4
Antal personer i hushåll/Number of persons in dwellings1970 20 531 1 722 3 582 4 245 4 836 3 205 2 9411980 22 549 2 674 4 994 4 845 6 060 2 655 1 3211990 24 390 3 481 5 862 5 028 6 072 2 705 1 2422000 25 499 3 933 6 592 4 719 5 768 3 010 1 4772008 27 072 4 817 8 018 4 836 5 656 2 580 1 1652009 27 317 4 895 8 216 4 878 5 592 2 585 1 1512010 27 559 4 975 8 352 4 971 5 684 2 445 1 1322011 27 910 4 986 8 556 4 911 5 808 2 520 1 129
Procent av personerna/Per cent of persons1970 100,0 8,4 17,4 20,7 23,6 15,6 14,31980 100,0 11,9 22,1 21,5 26,9 11,8 5,91990 100,0 14,3 24,0 20,6 24,9 11,1 5,12000 100,0 15,4 25,9 18,5 22,6 11,8 5,82008 100,0 17,8 29,6 17,9 20,9 9,5 4,32009 100,0 17,9 30,1 17,9 20,5 9,5 4,22010 100,0 18,1 30,3 18,0 20,6 8,9 4,12011 100,0 17,9 30,7 17,6 20,8 9,0 4,0
Källa/Source : Statistikcentralen Folkräkningen/Statistics Finland Population Census
Personantal per bostadshushåll/Number of persons per household dwelling unit

Befolkning
Statistisk årsbok för Åland – Statistical Yearbook of Åland 2012 53
2.19. Bostadshushållens antal och storlek efter kommun 1995-2011 2.19. Number and size of household dwelling units by municipality 1995-2011
2.20. Antal familjer efter familjetyp 31.12.2011 2.20. Number of families by family type 31.12.2011
Kommun
1995 2000 2005 2010 2011 1995 2000 2005 2010 2011
Brändö 230 227 223 222 222 2,35 2,23 2,25 2,14 2,13Eckerö 339 346 397 433 447 2,42 2,37 2,31 2,16 2,15Finström 876 900 1 001 1 073 1 083 2,55 2,52 2,42 2,30 2,29Föglö 269 252 268 267 268 2,22 2,32 2,17 2,09 2,10Geta 189 200 199 215 219 2,41 2,37 2,21 2,17 2,22Hammarland 516 547 599 660 663 2,48 2,46 2,29 2,26 2,27Jomala 1 168 1 240 1 414 1 606 1 666 2,67 2,65 2,52 2,52 2,51Kumlinge 193 184 172 169 168 2,24 2,17 2,05 2,14 2,13Kökar 134 138 135 130 122 2,34 2,14 2,24 1,98 2,03Lemland 528 580 649 706 725 2,71 2,73 2,59 2,52 2,53Lumparland 130 150 173 176 179 2,56 2,49 2,23 2,21 2,20Saltvik 666 685 736 794 811 2,43 2,43 2,33 2,25 2,20Sottunga 55 59 58 56 54 2,29 2,19 2,19 2,09 1,87Sund 408 425 469 478 484 2,36 2,36 2,18 2,11 2,12Vårdö 164 169 183 195 195 2,45 2,39 2,32 2,30 2,29
Mariehamn 4 900 4 972 5 370 5 714 5 727 2,10 2,09 1,98 1,92 1,93
Landskomm. 5 865 6 102 6 676 7 180 7 306 2,50 2,48 2,37 2,31 2,31-Landsbygden 4 820 5 073 5 637 6 141 6 277 2,54 2,52 2,40 2,34 2,34-Skärgården 1 045 1 029 1 039 1 039 1 029 2,31 2,25 2,20 2,13 2,13
Åland 10 765 11 074 12 046 12 894 13 033 2,32 2,30 2,19 2,14 2,14
Källa/Source : Statistikcentralen, Befolkning/Statistics Finland, Population
Antal hushåll/HouseholdsMedelhushållsstorlek/Average household size
Pers. per hushåll/Persons per household
Marie- Lands- Skär- Marie- Lands- Skär-hamn bygden gården Åland hamn bygden gården Åland
Familjetyp/Family typeTotalt 2 983 4 334 581 7 898 100,0 100,0 100,0 100,0
Makar utan barn/Married coupleswithout children 989 1 371 226 2 586 33,2 31,6 38,9 32,7
Makar med barn/Married coupleswith children 696 1 234 169 2 099 23,3 28,5 29,1 26,6
Sambor utan barn/Unmarriedcouples without children 474 570 50 1 094 15,9 13,2 8,6 13,9
Sambor med barn/Unmarriedcouples with children 353 686 65 1 104 11,8 15,8 11,2 14,0
Mor och barn/Mothers with children 401 336 53 790 13,4 7,8 9,1 10,0
Far och barn/Fathers with children 70 137 18 225 2,3 3,2 3,1 2,8
Antal personer per familj/Numberof persons per family 2,68 2,86 2,83 2,79
Andel samboende par av alla par, procent/Share of unmarried couples, per cent 32,9 32,5 22,5 31,9
7 999 12 376 1 647 22 022
Not/Note : Begreppet med/utan barn gäller hemmaboende barn/"With/without children" refers to children living at home.
Källa/Source : Statistikcentralen, Befolkning, ÅSUB/Statistics Finland, Population, Statistics Åland
Personer i familj/Persons in families
Antal Procent

Befolkning
54 Statistisk årsbok för Åland – Statistical Yearbook of Åland 2012
Figur 2.13. Familjer efter typ 1990-2011 Figure 2.13. Families by family type 1990-2011
2.21. Antal barnfamiljer efter familjetyp och kommun 31.12.2011. Familjer med barn under 18 år 2.21. Families with children under 18 years by family type and municipality 31.12.2011
0
1 000
2 000
3 000
4 000
5 000
6 000
7 000
8 000
9 000
1990 1995 2000 2005 2011
Antal
En förälder medbarn/One parent withchildren
Par med barn/Coupleswith children
Par utan barn/Coupleswithout children
Kommun Antal Antal barn
Totalt Äkta Sambor/ Mor/ Far/ barn/ per familj/ makar/ Un- Mothers Fathers Number Number Antal % av in-
Married married of of children vån./%couples couples children per family of inh.
Brändö 39 15 17 7 - 66 1,69 149 31,0Eckerö 102 56 28 11 7 174 1,71 375 38,3Finström 323 151 112 39 21 562 1,74 1 186 46,9Föglö 54 27 15 10 2 95 1,76 202 35,0Geta 55 29 16 7 3 96 1,75 203 41,3Hammarland 193 81 75 28 9 321 1,66 693 45,4Jomala 584 318 191 54 21 1 048 1,79 2 212 52,1Kumlinge 26 16 7 3 - 49 1,88 115 31,9Kökar 24 10 6 5 3 43 1,79 91 36,5Lemland 245 132 80 25 8 458 1,87 959 51,6Lumparland 48 30 11 6 1 83 1,73 178 44,6Saltvik 212 102 76 26 8 366 1,73 788 43,5Sottunga 5 3 - 2 - 9 1,80 19 18,4Sund 121 67 28 16 10 208 1,72 441 42,7Vårdö 47 37 8 2 - 83 1,77 186 41,4
Mariehamn 1 181 544 312 283 42 1 940 1,64 4 140 36,8
Landskomm. 2 078 1 074 670 241 93 3 661 1,76 7 797 45,6-Landsbygden 1 883 966 617 212 88 3 316 1,76 7 035 47,3-Skärgården 195 108 53 29 5 345 1,77 762 34,3
Åland 3 259 1 618 982 524 135 5 601 1,72 11 937 42,1 - Procent 100,0 49,6 30,1 16,1 4,1
Källa/Source : Statistikcentralen, Befolkning, ÅSUB/Statistics Finland, Population, Statistics Åland
Personer i barnfamiljer/
Persons in families
Familjen försörjs av/Family provider

Befolkning
Statistisk årsbok för Åland – Statistical Yearbook of Åland 2012 55
2.22. Antal barnfamiljer efter familjetyp 31.12.1990-2011. Familjer med barn under 18 år 2.22. Families with children under 18 years by family type 31.12.1990-2011
2.23. Befolkning efter huvudsaklig verksamhet och kommun 31.12.2010 2.23. Population by main activity and municipality 31.12.2010
År/ Antal Antal barn
Year Totalt barn/ per familj/
Married couples Number Children
of children per family
Antal Procent Antal Procent Antal Procent Antal Procent (0-17 år)
1990 3 162 2 077 65,7 616 19,5 412 13,0 57 1,8 5 321 1,68
2000 3 142 1 757 55,9 797 25,4 516 16,4 72 2,3 5 608 1,78
2001 3 173 1 739 54,8 831 26,2 527 16,6 76 2,4 5 628 1,77
2002 3 192 1 730 54,2 861 27,0 515 16,1 86 2,7 5 651 1,77
2003 3 187 1 697 53,2 881 27,6 526 16,5 83 2,6 5 623 1,76
2004 3 226 1 729 53,6 876 27,2 533 16,5 88 2,7 5 657 1,75
2005 3 233 1 706 52,8 902 27,9 524 16,2 101 3,1 5 653 1,75
2006 3 236 1 688 52,2 914 28,2 535 16,5 99 3,1 5 649 1,75
2007 3 226 1 652 51,2 928 28,8 544 16,9 102 3,2 5 616 1,74
2008 3 134 1 662 51,4 932 28,8 540 16,7 98 3,0 5 625 1,74
2009 3 218 1 641 51,0 933 29,0 550 17,1 94 2,9 5 616 1,75
2010 3 229 1 613 50,0 959 29,7 550 17,0 107 3,3 5 573 1,73
2011 3 259 1 618 49,6 982 30,1 524 16,1 135 4,1 5 601 1,72
Källa/Source : Statistikcentralen, Befolkning/Statistics Finland, Population
Familjen försörjs av/Family provider
Sambor/Un-
married couples Mothers
Mor/ Far/
Fathers
Äkta makar/
Kommun Hela
bef./
Total pop. Totalt
Syssel-satta/
Arb. lösa/ Totalt
0-14 år/
Stud./ skol-
elever/Pensio-
närer/ Övriga/Arb.
kraft/Utanför
arb.kraft/
Em-ployed
Unem-ployed
Age 0 -14
Stud- ents
Pens-ioners Other
Labour force
Not in labour
force
Brändö 488 232 225 7 256 63 32 141 20 47,5 52,5Eckerö 943 459 432 27 484 135 46 234 69 48,7 51,3Finström 2 502 1 275 1235 40 1 227 465 135 517 110 51,0 49,0Föglö 580 277 270 7 303 81 20 167 35 47,8 52,2Geta 475 226 218 8 249 67 28 121 33 47,6 52,4Hammarland 1 508 755 735 20 753 253 91 327 82 50,1 49,9Jomala 4 098 2 149 2 106 43 1 949 859 246 628 216 52,4 47,6Kumlinge 364 163 156 7 201 44 23 114 20 44,8 55,2Kökar 259 115 109 6 144 34 16 79 15 44,4 55,6Lemland 1 814 901 877 24 913 374 114 311 114 49,7 50,3Lumparland 394 183 180 3 211 70 20 95 26 46,4 53,6Saltvik 1 802 899 873 26 903 309 89 420 85 49,9 50,1Sottunga 119 57 55 2 62 16 3 35 8 47,9 52,1Sund 1 019 523 506 17 496 152 69 232 43 51,3 48,7Vårdö 452 192 187 5 260 69 23 137 31 42,5 57,5
Mariehamn 11 190 5 726 5 522 204 5 464 1 591 711 2 430 732 51,2 48,8
Landskomm. 16 817 8 406 8 164 242 8 411 2 991 955 3 558 907 50,0 50,0-Landsbygden 14 555 7 370 7 162 208 7 185 2 684 838 2 885 778 50,6 49,4-Skärgården 2 262 1 036 1 002 34 1 226 307 117 673 129 45,8 54,2
Åland 28 007 14 132 13 686 446 13 875 4 582 1 666 5 988 1 639 50,5 49,5
Källa/Source : Statistikcentralen, Befolkning/Statistics Finland, Population
Labour force
Tillhör arbetskraften/ Procent
Per cent
Utanför arbetskraften/
Not in labour force

Befolkning
56 Statistisk årsbok för Åland – Statistical Yearbook of Åland 2012
Figur 2.14. Befolkning efter huvudsaklig verksamhet 1990-2010 Figure 2.14. Population by main activity 1990-2010
2.24. Befolkning efter huvudsaklig verksamhet och ålder 31.12.2010 2.24. Population by main activity and age 31.12.2010
0
2 000
4 000
6 000
8 000
10 000
12 000
14 000
16 000
Arb.kr/Labourforce
0-14 år/Age 0-14 Stud., skolelever/Students
Pensionärer/Pensioners
Övriga/Other
Antal personer/Persons
1990 2000 2010
Ålder/ Hela Arbetskraften/Labour force Utanför arbetskraften/Not in labour forceAge bef./ Totalt Syssel- Arbets- Totalt 0-14 - Stud., Pensio- Övriga/
Total satta/ lösa/Un- åringar/ skolelever/ närer/ Otherpop. Employed employed Age 0-14 Students Pensioners
Totalt 28 007 14 132 13 686 446 13 875 4 582 1 666 5 988 1 639 0-6 2 097 - - - 2 097 2 097 - - - 7-14 2 485 - - - 2 485 2 485 - - -15-19 1 732 288 254 34 1 444 - 1 293 7 14420-24 1 426 1 036 966 70 390 - 207 24 15925-29 1 544 1 263 1 213 50 281 - 59 19 20330-34 1 669 1 424 1 389 35 245 - 34 27 18435-39 1 809 1 601 1 573 28 208 - 24 32 15240-44 2 019 1 818 1 783 35 201 - 15 43 14345-49 1 985 1 784 1 727 57 201 - 17 49 13550-54 1 941 1 729 1 682 47 212 - 7 81 12455-59 2 065 1 731 1 680 51 334 - 5 188 14160-64 2 090 1 211 1 172 39 879 - 3 758 11865-69 1 625 242 242 - 1 383 - - 1 312 7170-74 1 151 5 5 - 1 146 - 2 1 079 6575+ 2 369 - - - 2 369 - - 2 369 -
Källa/Source : Statistikcentralen, Befolkning/Statistics Finland, Population

Befolkning
Statistisk årsbok för Åland – Statistical Yearbook of Åland 2012 57
Figur 2.15. Kvinnor i och utanför arbetskraften efter ålder 31.12.2010 Figure 2.15. Females in labour force and not in labour force by age 31.12.2010
Figur 2.16. Män i och utanför arbetskraften efter ålder 31.12.2010 Figure 2.16. Males in labour force and not in labour force by age 31.12.2010
0
200
400
600
800
1 000
1 200
0 - 45 - 9 10 -14
15 -19
20 -24
25 -29
30 -34
35 -39
40 -44
45 -49
50 -54
55 -59
60 -64
65 -69
70 -74
75 -79
80 -84
85+
Kvinnor
Ålder/Age
Arbetskraften/In labour force Utanför arbetskraften/Not in labour force
0
200
400
600
800
1 000
1 200
0 - 45 - 9 10 -14
15 -19
20 -24
25 -29
30 -34
35 -39
40 -44
45 -49
50 -54
55 -59
60 -64
65 -69
70 -74
75 -79
80 -84
85+
Män
Ålder/Age
Arbetskraften/In labour force Utanför arbetskraften/Not in labour force

Befolkning
58 Statistisk årsbok för Åland – Statistical Yearbook of Åland 2012
Figur 2.17. Befolkningsrörelsen 1971-2011 Figure 2.17. Vital statistics 1971-2011
2.25. Befolkningsrörelsen efter kön och region 2011 2.25. Population changes by sex and region 2011
-100
0
100
200
300
400
500
1970 1975 1980 1985 1990 1995 2000 2005 2010
Antal
Födelsenetto/Excess of births Flyttningsnetto/Net migration
Folkökning/Population growth
Totalt Kvinnor Män Mariehamn Landsbygden Skärgården
Födda/Births 285 149 136 110 166 9
Döda/Deaths 277 145 132 120 125 32
Födelsenetto/Excess of b irths 8 4 4 -10 41 -23
Inflyttade/Immigration 955 491 464 888 1 180 1) 126 1)
Utflyttade/Emigration 622 322 300 798 915 1) 148 1)
Flyttningsnetto/Net immigration 333 169 164 90 265 -22
Folkökning/Increase in population 341 173 168 80 306 -45
Korrigering/Correction 7 -8 15 -7 12 2
Hela förändringen/Total change 348 165 183 73 318 -431) Inkluderar f lyttning mellan de åländska kommuerna/Includes migration to and from the municipalities in Åland.
Källa/Source : Statistikcentralen, Befolkning/Statistics Finland, Population
Kön/Sex Region

Befolkning
Statistisk årsbok för Åland – Statistical Yearbook of Åland 2012 59
2.26. Befolkningsrörelsen efter kommun 2011 2.26. Population changes by municipality 2011
2.27. Befolkningsrörelsen i kommunerna under en tioårsperiod 2002-2011 2.27. Population changes in municipalities 2002-2011
Kommun Levande Födelse- Flyttnings- Folk- Korri- Hela Vigda Skils-
födda/ Döda/ netto/ netto/ ökning/ gering/ förändr./ par/ mässor/
Live Deaths Excess Net Population Correc- Total Marriages Divorces
births of b irths migration growth tion changeBrändö 1 7 -6 -3 -9 1 -8 - 1Eckerö 13 8 5 24 29 6 35 5 1Finström 29 25 4 21 25 - 25 9 7Föglö 4 11 -7 - -7 4 -3 1 2Geta 6 5 1 13 14 3 17 1 -Hammarland 25 17 8 10 18 - 18 5 3Jomala 51 31 20 128 148 3 151 19 2Kumlinge 2 7 -5 2 -3 - -3 2 -Kökar - 3 -3 -7 -10 - -10 - -Lemland 14 16 -2 52 50 -4 46 11 1Lumparland 1 1 - 2 2 3 5 1 1Saltvik 19 13 6 -1 5 3 8 7 7Sottunga - - - -15 -15 -1 -16 - -Sund 8 9 -1 16 15 -2 13 4 2Vårdö 2 4 -2 1 -1 -2 -3 4 -
Mariehamn 110 120 -10 90 80 -7 73 44 26
Landskomm. 175 157 18 243 261 14 275 69 27-Landsbygden 166 125 41 265 306 12 318 62 24-Skärgården 9 32 -23 -22 -45 2 -43 7 3
Åland 285 277 8 333 341 7 348 113 53
Källa/Source: Statistikcentralen, Befolkning/Statistics Finland, Population
Kommun Födelse- Ändring i Korri- Hela
Födda/ Döda/ netto/ folkmängd/ gering/ förändr./
Births Deaths Excess of In/ Ut/ Netto/ Change Correc- Total
b irths To From Net in pop tion changeBrändö 27 75 -48 280 259 21 -27 6 -21Eckerö 84 81 3 701 571 130 133 6 139Finström 281 212 69 1 730 1 579 151 220 3 223Föglö 45 80 -35 306 288 18 -17 5 -12Geta 42 66 -24 293 265 28 4 12 16Hammarland 173 131 42 996 895 101 143 10 153Jomala 482 275 207 3 073 2 399 674 881 12 893Kumlinge 22 56 -34 158 170 -12 -46 3 -43Kökar 20 46 -26 201 217 -16 -42 -1 -43Lemland 186 108 78 1 190 1 017 173 251 -9 242Lumparland 40 22 18 227 232 -5 13 5 18Saltvik 177 173 4 1 074 984 90 94 -5 89Sottunga 5 14 -9 80 99 -19 -28 3 -25Sund 91 104 -13 694 660 34 21 -2 19Vårdö 31 44 -13 251 196 55 42 3 45
Mariehamn 1 087 1 051 36 8 575 7 977 598 634 20 654
Landskomm. 1 706 1 487 219 11 254 9 831 1 423 1 642 51 1 693-Landsbygden 1 556 1 172 384 9 978 8 602 1 376 1 760 32 1 792-Skärgården 150 315 -165 1 276 1 229 47 -118 19 -99
Åland 2 793 2 538 255 19 829 17 808 2 021 2 276 71 2 3471) Inkluderar f lyttning mellan de åländska kommunerna/Includes migration to and from the municipalities in Åland.
Källa/Source : Statistikcentralen, Befolkning/Statistics Finland, Population
Flyttning/Migration 1)

Befolkning
60 Statistisk årsbok för Åland – Statistical Yearbook of Åland 2012
2.28. Befolkningsrörelsen efter region 2002-2011 per 1 000 personer av medelfolkmängden 2.28. Population changes by region 2002-2011 per 1 000 of the mean population
Figur 2.18. Nativitetsnetto per 1 000 personer av befolkningen efter region 1992-2011 Figure 2.18. Excess of births per 1 000 of mean population by region 1992-2011
Region 2002 2003 2004 2005 2006 2007 2008 2009 2010 2011
Födda/Births 10,3 10,0 10,6 10,1 11,0 10,6 10,8 9,7 10,3 10,1Mariehamn 10,6 9,6 11,4 8,7 10,5 10,0 11,0 8,6 9,7 9,8
Landsbygden 10,1 10,3 11,0 11,4 12,0 11,8 11,4 11,2 11,7 11,3
Skärgården 9,9 9,8 5,1 8,1 7,3 5,6 5,7 5,3 4,0 4,0
Döda/Deaths 9,0 10,2 9,9 9,7 9,6 9,2 9,2 9,0 8,4 9,8Mariehamn 9,8 9,6 10,2 10,2 8,4 9,9 10,4 9,1 8,2 10,7
Landsbygden 7,8 10,1 9,2 8,6 9,4 7,6 7,7 8,1 7,7 8,5
Skärgården 12,4 13,2 12,8 14,1 15,9 15,6 12,2 13,2 12,8 14,3
Nativitetsnetto/Excess
of births 1,3 -0,2 0,7 0,3 1,4 1,4 1,6 0,7 1,9 0,3Mariehamn 0,8 - 1,2 -1,5 2,0 0,1 0,6 -0,5 1,4 -0,9
Landsbygden 2,3 0,2 1,8 2,9 2,6 4,3 3,7 3,1 3,9 2,8
Skärgården -2,6 -3,4 -7,7 -6,0 -8,6 -10,0 -6,5 -7,9 -8,8 -10,3
Flyttningsnetto/Net
immigration 8,5 3,8 6,5 7,7 3,3 6,5 9,1 9,2 8,0 11,8Mariehamn 1,4 -0,3 7,4 7,4 1,2 6,3 7,7 11,1 4,5 8,0
Landsbygden 12,9 6,5 6,5 10,1 5,2 7,1 12,3 9,3 10,7 18,0
Skärgården 15,4 6,4 3,0 -4,7 1,7 4,8 -3,9 -1,3 8,4 -9,8
Folkökning/Increase
in population 9,7 3,5 7,3 8,0 4,7 7,9 10,7 9,9 9,9 12,1Mariehamn 2,3 -0,3 8,6 5,9 3,2 6,4 8,3 10,6 5,9 7,1
Landsbygden 15,2 6,7 8,3 13,0 7,8 11,3 16,0 12,4 14,7 20,8
Skärgården 12,9 3,0 -4,7 -10,7 -6,9 -5,2 -10,5 -9,2 -0,4 -20,1
Äktenskap/Marriages 3,4 4,2 5,1 4,1 4,3 4,3 5,1 4,3 5,1 4,0
Skilsmässor/Divorces 2,5 2,1 2,0 1,5 2,3 2,2 1,6 1,9 1,9 1,9
Källa/Source : Statistikcentralen, Befolkning/Statistics Finland, Population
-14,0
-12,0
-10,0
-8,0
-6,0
-4,0
-2,0
0,0
2,0
4,0
6,0
8,0
1992 1994 1996 1998 2000 2002 2004 2006 2008 2010
Landsbygden
Mariehamn
Skärgården
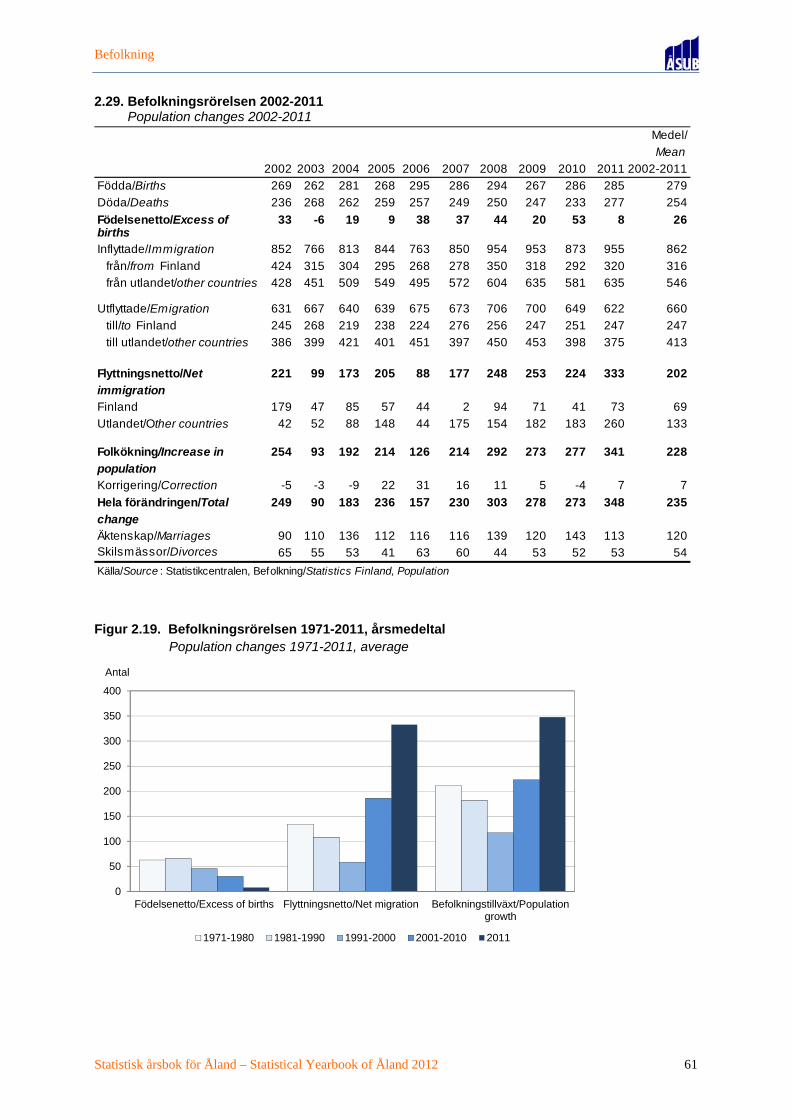
Befolkning
Statistisk årsbok för Åland – Statistical Yearbook of Åland 2012 61
2.29. Befolkningsrörelsen 2002-2011 2.29. Population changes 2002-2011
Figur 2.19. Befolkningsrörelsen 1971-2011, årsmedeltal Figure 2.19. Population changes 1971-2011, average
Medel/
Mean
2002 2003 2004 2005 2006 2007 2008 2009 2010 2011 2002-2011
Födda/Births 269 262 281 268 295 286 294 267 286 285 279
Döda/Deaths 236 268 262 259 257 249 250 247 233 277 254
Födelsenetto/Excess of 33 -6 19 9 38 37 44 20 53 8 26birthsInflyttade/Immigration 852 766 813 844 763 850 954 953 873 955 862
från/from Finland 424 315 304 295 268 278 350 318 292 320 316
från utlandet/other countries 428 451 509 549 495 572 604 635 581 635 546
Utflyttade/Emigration 631 667 640 639 675 673 706 700 649 622 660
till/to Finland 245 268 219 238 224 276 256 247 251 247 247
till utlandet/other countries 386 399 421 401 451 397 450 453 398 375 413
Flyttningsnetto/Net 221 99 173 205 88 177 248 253 224 333 202
immigrationFinland 179 47 85 57 44 2 94 71 41 73 69
Utlandet/Other countries 42 52 88 148 44 175 154 182 183 260 133
Folkökning/Increase in 254 93 192 214 126 214 292 273 277 341 228
populationKorrigering/Correction -5 -3 -9 22 31 16 11 5 -4 7 7
Hela förändringen/Total 249 90 183 236 157 230 303 278 273 348 235
changeÄktenskap/Marriages 90 110 136 112 116 116 139 120 143 113 120Skilsmässor/Divorces 65 55 53 41 63 60 44 53 52 53 54
Källa/Source : Statistikcentralen, Befolkning/Statistics Finland, Population
0
50
100
150
200
250
300
350
400
Födelsenetto/Excess of births Flyttningsnetto/Net migration Befolkningstillväxt/Populationgrowth
Antal
1971-1980 1981-1990 1991-2000 2001-2010 2011

Befolkning
62 Statistisk årsbok för Åland – Statistical Yearbook of Åland 2012
Figur 2.20. Födda, döda och födelsenetto 1951-2011 Figure 2.20. Births, deaths and excess of births 1951-2011
2.30. Födslar 1992-2010 2.30. Confinements 1992-2010
-50
0
50
100
150
200
250
300
350
400
1950 1955 1960 1965 1970 1975 1980 1985 1990 1995 2000 2005 2010
Personer/Persons
Födda/Births
Döda/Deaths
Födelsenetto/Excess of births
År/ Födslar Tvilling-
Year totalt/ födslar/ Dödfödda/ Flickor/ Pojkar/
Confinements With twins Still-b irths Totalt Girls Boys
Summa 1992-2010 5 427 105 14 5 518 2 661 2 8571992 324 6 5 325 150 175
1993 321 9 1 329 166 163
1994 299 4 - 303 159 144
1995 331 8 1 338 170 168
1996 288 2 - 290 141 149
1997 283 4 1 286 146 140
1998 308 3 - 311 146 165
1999 279 8 - 287 141 146
2000 250 9 1 258 113 145
2001 281 4 2 283 139 144
2002 261 9 1 269 130 139
2003 256 7 1 262 130 132
2004 280 1 - 281 127 154
2005 263 6 1 268 131 137
2006 292 3 - 295 137 158
2007 280 6 - 286 142 144
2008 289 5 - 294 138 156
2009 263 4 - 267 109 158
2010 279 7 - 286 146 140
Källa/Source : Statistikcentralen, Befolkning/Statistics Finland, Population
Levande födda/Live-b irths

Befolkning
Statistisk årsbok för Åland – Statistical Yearbook of Åland 2012 63
2.31. Levande födda barn efter moderns ålder 2003-2011, fruktsamhet 2.31. Live-births by age of mother 2003-2011, fertility rates
Figur 2.21. Födda efter moderns ålder 1991-2011 Figure 2.21. Births by age of mother 1991-2011
Moderns ålder/
Age of mother 2003 2004 2005 2006 2007 2008 2009 2010 2011
Antal 262 281 268 295 286 294 267 286 285 -19 3 3 5 5 5 4 1 6 4
20-24 30 32 37 26 31 31 25 38 28
25-29 74 66 74 88 79 88 73 92 80
30-34 101 99 94 102 117 91 99 89 107
35-39 50 64 44 59 40 65 55 52 53
40-44 4 17 12 14 14 14 14 9 13
45+ - - 2 1 - 1 - - -
Per 1 0001)
-19 4,1 4,0 6,4 6,2 6,1 4,8 1,2 7,0 4,7
20-24 47,1 51,1 60,3 42,5 51,5 51,8 41,1 60,6 42,4
25-29 99,9 90,4 101,4 121,0 109,5 118,7 95,7 120,0 105,8
30-34 121,6 121,9 116,3 127,3 145,4 112,4 122,7 110,4 132,4
35-39 49,0 62,9 44,3 61,0 43,0 73,0 62,7 59,4 60,5
40-44 4,4 18,5 12,8 14,6 13,9 13,2 13,1 8,7 12,8
45+ - - 2,1 1,0 - 1,1 - - -
Summerad fruktsamhet/
Total fertility rate 1 640 1 752 1 717 1 867 1 847 1 881 1 694 1 834 1 801
Bruttoreproduktionstal/
Gross reproduction rate 0,814 0,792 0,839 0,867 0,917 0,883 0,692 0,936 0,942
Nettoreproduktionstal/
Net reproduction rate 0,801 0,787 0,820 0,867 0,909 0,857 0,685 0,916 ..1)Per 1 000 kvinnor i respektive åldersgrupp/Pro 1 000 females in each age group respectively.
Källa/Source : Statistikcentralen, Befolkning/Statistics Finland, Population
0
50
100
150
200
250
1991 1993 1995 1997 1999 2001 2003 2005 2007 2009 2011
Antal födda/Births
-30år/years
30-34år/years
35+år/years

Befolkning
64 Statistisk årsbok för Åland – Statistical Yearbook of Åland 2012
2.32. Döda efter ålder och kön 2009-2011 2.32. Deaths by age and sex 2009-2011
Ålder/Age
Totalt Kvinnor Män Totalt Kvinnor Män Totalt Kvinnor Män
Antal 247 121 126 233 114 119 277 145 132 0 - - - 1 1 - - - -
1-4 - - - - - - - - -
5- 9 - - - 1 1 - - - -
10-14 - - - - - - - - -
15-19 - - - - - - 1 - 1
20-24 1 - 1 1 1 - - - -
25-29 2 2 - - - - - - -
30-34 1 - 1 - - - 1 - 1
35-39 - - - - - - 2 - 2
40-44 5 2 3 - - - - - -
45-49 6 2 4 4 1 3 1 - 1
50-54 1 - 1 5 3 2 6 1 5
55-59 13 6 7 13 4 9 10 5 5
60-64 14 7 7 11 5 6 15 8 7
65-69 15 4 11 15 2 13 19 8 11
70-74 22 9 13 17 8 9 23 6 17
75-79 29 13 16 23 8 15 35 14 21
80-84 42 19 23 42 19 23 45 18 27
85-89 43 18 25 54 29 25 56 34 22
90-94 31 22 9 32 22 10 34 29 5
95+ 22 17 5 14 10 4 29 22 7
Per 1 000 personer/
Pro 1 000 persons 9,0 8,7 9,2 8,4 8,1 8,6 9,8 10,3 9,4 0 - - - 3,6 8,0 - - - -
1-4 - - - - - - - - -
5-9 - - - 0,7 1,4 - - - -
10-14 - - - - - - - - -
15-19 - - - - - - 0,6 - 1,2
20-24 0,8 - 1,4 0,7 1,6 - - - -
25-29 1,3 2,6 - - - - - - -
30-34 0,6 - 1,2 - - - 0,6 - 1,2
35-39 - - - - - - 1,1 - 2,1
40-44 2,4 1,9 2,9 - - - - - -
45-49 3,1 2,1 4,2 2,0 1,0 3,1 0,5 - 1,0
50-54 0,5 - 1,1 2,6 3,0 2,2 3,1 1,0 5,4
55-59 6,3 5,6 7,0 6,3 3,7 9,0 4,8 4,7 5,0
60-64 6,8 6,9 6,7 5,3 4,8 5,7 7,3 7,8 6,8
65-69 10,3 5,9 14,2 9,6 2,7 15,6 11,2 9,8 12,5
70-74 19,8 15,5 24,4 14,9 13,7 16,3 19,5 10,3 28,6
75-79 33,8 28,3 40,1 25,8 16,7 36,5 37,7 27,8 49,6
80-84 56,9 43,6 76,2 57,9 44,7 76,4 64,3 44,8 90,6
85-89 93,7 57,6 170,6 114,0 91,3 160,3 114,5 104,5 134,6
90-94 179,2 168,6 211,8 178,3 157,7 250,0 179,4 195,3 122,0
95+ 349,2 326,9 454,5 205,9 178,6 333,3 429,6 403,7 538,5
Källa/Source : Statistikcentralen, Befolkning/Statistics Finland, Population
2009 2010 2011

Befolkning
Statistisk årsbok för Åland – Statistical Yearbook of Åland 2012 65
Figur 2.22. Döda per 1 000 personer efter ålder 1996-2011 Figure 2.22. Deaths per 1 000 persons by age 1996-2011
2.33. Döda efter dödsorsak 2010 2.33. Deaths by causes of death 2010
0
20
40
60
80
100
120
0-9 10-19 20-29 30-39 40-49 50-59 60-69 70-79 80-
Döda per 1 000 personer/Deaths
per1 000 persons
1996 2000 2004 2008 2011
Dödsorsak/
Causes of death
Tot. K M Totalt K M
Summa 239 114 125 857,5 814,8 900,6Infektionssjukdomar, parasitära sjukdomar/
Infective and parasitic diseases 2 1 1 7,2 7,1 7,2
Tumörer/Neoplasms 76 35 41 272,7 250,2 295,4
Endokrina systemets sjukdomar/
Endocrine diseases 5 3 2 17,9 21,4 14,4
Mentala rubbningar/Mental disorders 5 2 3 17,9 14,3 21,6
Nervsystemets och sinnesorg. sjukdomar/
Diseases of the nervous sys. and sense or 25 14 11 89,7 100,1 79,3
Cirkulationsorganens sjukdomar/
Diseases of the circulatory system 95 46 49 340,9 328,8 353,0
Andningsorganens sjukdomar/
Diseases of the respiratory system 11 6 5 39,5 42,9 36,0
Matsmältningsorganens sjukdomar/
Diseases of the digestive system 7 2 5 25,1 14,3 36,0
Urogenitalorganens sjukdomar/
Diseases of the genitourinary system 5 1 4 17,9 7,1 28,8
Medfödda missbildningar/Congenital anom 1 - 1 3,6 - 7,2
Skada genom yttre våld förgiftning och olycksfall/
Accidents and violence 6 3 3 21,5 21,4 21,6Självmord/Suicides 1 1 - 3,6 7,1 -
Källa/Source : Statistikcentralen, Befolkning/Statistics Finland, Population
Per 100 000 pers. av medel-
folkmängden/Pro 100 000
persons of mean populationAntal

Befolkning
66 Statistisk årsbok för Åland – Statistical Yearbook of Åland 2012
2.34. Förväntad medellivslängd efter kön 1966-2010 2.34. Average life expectancy by sex 1966-2010
2.35. In- och utvandring efter land 1987-2011 2.35. Immigration and emigration by country 1987-2011
Kön/Sex 1966-1970 1981-1985 2003-2007 2004-2008 2005-2009 2006-2010
Totalt 72,1 76,7 80,9 81,1 81,5 82,0
Kvinnor/Females 75,6 80,6 83,7 83,1 83,1 83,8
Män/Males 68,5 72,9 78,1 79,0 79,7 80,1
Not/Note : Medellivslängden visas för femårsperioder, eftersom de årliga variationerna blir stora i en liten befolkning/Average
life expectancy is shown for five-year periods, since there are large annual variations in a small population.
Källa/Source : Statistikcentralen, Befolkning/Statistics Finland, Population
År/Year Invandring/Immigration ( från/from) Utvandring/Emigration ( till/to) Nettoinvandring/Net migration
Finl./ Sve/ Övr. Övr. Finl./ Sve/ Övr. Övr. Finl./ Sve/ Övr. Övr.
Nord/ värld/ Nord/ värld/ Nord/ värld/
Totalt Finl. Swe Nordic World Totalt Finl. Swe NordicWorld Totalt Finl. Swe NordicWorld
Summa
1987-2011 15 936 6 799 6 807 492 1 838 12 618 4 870 6 664 502 582 3 318 1 929 143 -10 1 2561987 380 209 140 8 23 312 132 163 12 5 68 77 -23 -4 18
1988 474 230 218 9 17 346 144 172 14 16 128 86 46 -5 1
1989 457 167 227 26 37 322 138 159 12 13 135 29 68 14 24
1990 488 222 200 34 32 278 130 130 8 10 210 92 70 26 22
1991 495 232 199 24 40 357 146 162 29 20 138 86 37 -5 20
1992 400 191 155 14 40 308 140 142 22 4 92 51 13 -8 36
1993 352 199 120 11 22 356 143 160 17 36 -4 56 -40 -6 -14
1994 389 237 111 10 31 377 149 187 29 12 12 88 -76 -19 19
1995 380 224 128 17 11 437 194 204 18 21 -57 30 -76 -1 -10
1996 446 223 178 20 25 425 203 192 20 10 21 20 -14 - 15
1997 508 249 201 13 45 435 159 228 34 14 73 90 -27 -21 31
1998 595 294 246 18 37 446 177 199 44 26 149 117 47 -26 11
1999 576 270 241 37 28 483 150 283 31 19 93 120 -42 6 9
2000 645 292 274 26 53 576 193 310 32 41 69 99 -36 -6 12
2001 728 396 260 34 38 558 201 308 19 30 170 195 -48 15 8
2002 852 424 310 28 90 631 245 339 20 27 221 179 -29 8 63
2003 766 315 342 27 82 667 268 349 14 36 99 47 -7 13 46
2004 813 304 354 22 133 640 219 385 12 24 173 85 -31 10 109
2005 844 295 408 13 128 639 238 360 15 26 205 57 48 -2 102
2006 763 268 352 12 131 675 224 409 22 20 88 44 -57 -10 111
2007 850 278 405 10 157 673 276 350 20 27 177 2 55 -10 130
2008 954 350 422 22 160 706 256 397 17 36 248 94 25 5 124
2009 953 318 459 23 153 700 247 398 13 42 253 71 61 10 111
2010 873 292 391 14 176 649 251 348 13 37 224 41 43 1 139
2011 955 320 466 20 149 622 247 330 15 30 333 73 136 5 119
Källa/Source : Statistikcentralen, Befolkning/Statistics Finland, Population
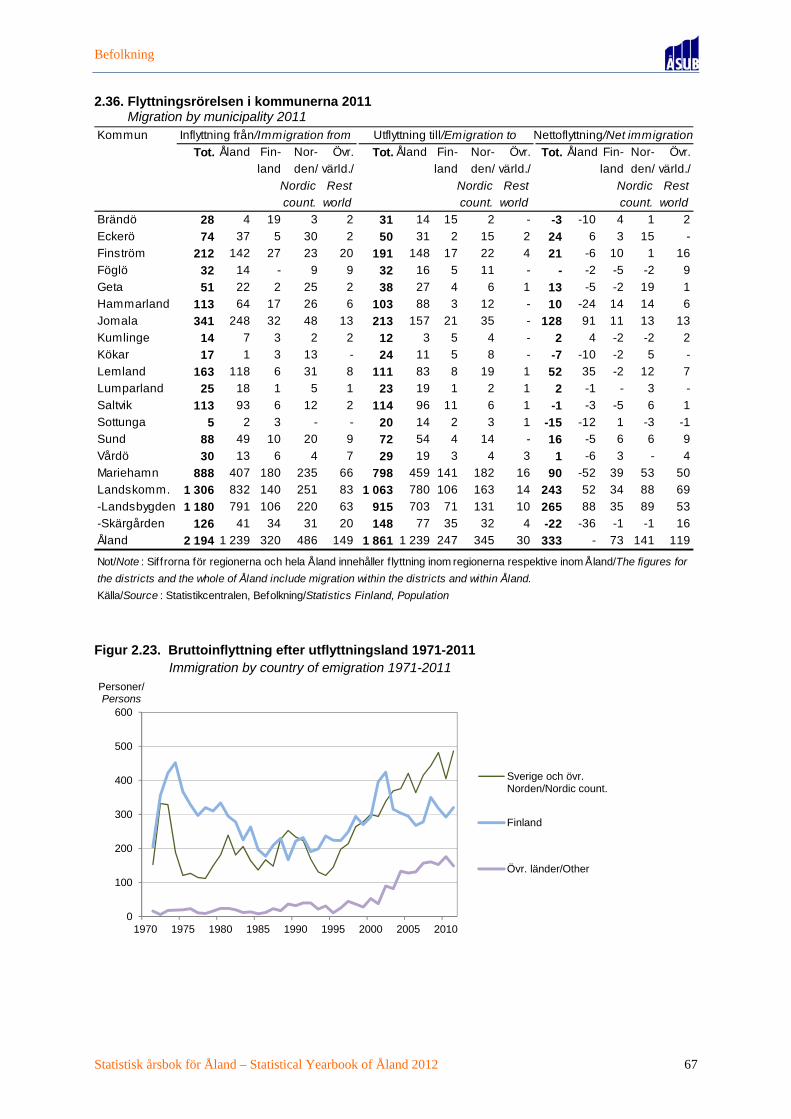
Befolkning
Statistisk årsbok för Åland – Statistical Yearbook of Åland 2012 67
2.36. Flyttningsrörelsen i kommunerna 2011 2.36. Migration by municipality 2011
Figur 2.23. Bruttoinflyttning efter utflyttningsland 1971-2011 Figure 2.23. Immigration by country of emigration 1971-2011
Kommun Inflyttning från/Immigration from Utflyttning till/Emigration to Nettoflyttning/Net immigration
Tot. Åland Fin- Nor- Övr. Tot. Åland Fin- Nor- Övr. Tot. Åland Fin- Nor- Övr.
land den/ värld./ land den/ värld./ land den/ värld./
Nordic Rest Nordic Rest Nordic Rest
count. world count. world count. world
Brändö 28 4 19 3 2 31 14 15 2 - -3 -10 4 1 2
Eckerö 74 37 5 30 2 50 31 2 15 2 24 6 3 15 -
Finström 212 142 27 23 20 191 148 17 22 4 21 -6 10 1 16
Föglö 32 14 - 9 9 32 16 5 11 - - -2 -5 -2 9
Geta 51 22 2 25 2 38 27 4 6 1 13 -5 -2 19 1
Hammarland 113 64 17 26 6 103 88 3 12 - 10 -24 14 14 6
Jomala 341 248 32 48 13 213 157 21 35 - 128 91 11 13 13
Kumlinge 14 7 3 2 2 12 3 5 4 - 2 4 -2 -2 2
Kökar 17 1 3 13 - 24 11 5 8 - -7 -10 -2 5 -
Lemland 163 118 6 31 8 111 83 8 19 1 52 35 -2 12 7
Lumparland 25 18 1 5 1 23 19 1 2 1 2 -1 - 3 -
Saltvik 113 93 6 12 2 114 96 11 6 1 -1 -3 -5 6 1
Sottunga 5 2 3 - - 20 14 2 3 1 -15 -12 1 -3 -1
Sund 88 49 10 20 9 72 54 4 14 - 16 -5 6 6 9
Vårdö 30 13 6 4 7 29 19 3 4 3 1 -6 3 - 4
Mariehamn 888 407 180 235 66 798 459 141 182 16 90 -52 39 53 50
Landskomm. 1 306 832 140 251 83 1 063 780 106 163 14 243 52 34 88 69
-Landsbygden 1 180 791 106 220 63 915 703 71 131 10 265 88 35 89 53
-Skärgården 126 41 34 31 20 148 77 35 32 4 -22 -36 -1 -1 16
Åland 2 194 1 239 320 486 149 1 861 1 239 247 345 30 333 - 73 141 119
Not/Note : Siffrorna för regionerna och hela Åland innehåller f lyttning inom regionerna respektive inom Åland/The figures for
the districts and the whole of Åland include migration within the districts and within Åland.
Källa/Source : Statistikcentralen, Befolkning/Statistics Finland, Population
0
100
200
300
400
500
600
1970 1975 1980 1985 1990 1995 2000 2005 2010
Personer/Persons
Sverige och övr.Norden/Nordic count.
Finland
Övr. länder/Other

Befolkning
68 Statistisk årsbok för Åland – Statistical Yearbook of Åland 2012
2.37. Befolkningsprognos efter ålder 2012-2040 2.37. Population projection by age 2012-2040
2.38. Befolkningsprognos efter kommun 2012-2040 2.38. Population projection by municipality 2012-2040
Ålder/Age 2012 2015 2020 2025 2030 2035 2040
Inklusive flyttningsrörelsen/Including migration
Antal 28 659 29 598 31 244 32 892 34 394 35 721 36 876 0-14 4 663 4 739 4 984 5 168 5 372 5 490 5 55515-64 18 429 18 701 19 126 19 766 20 242 20 693 21 26465- 5 567 6 158 7 134 7 958 8 780 9 538 10 057
Procent/Per cent 0-14 16,3 16,0 16,0 15,7 15,6 15,4 15,115-64 64,3 63,2 61,2 60,1 58,9 57,9 57,765- 19,4 20,8 22,8 24,2 25,5 26,7 27,3
Exklusive flyttningsrörelsen/Excluding migration
Antal 28 362 28 379 28 381 28 399 28 359 28 146 27 755 0-14 4 593 4 418 4 212 4 040 4 078 4 125 4 05715-64 18 216 17 884 17 234 16 767 16 108 15 390 14 94265- 5 553 6 077 6 935 7 592 8 173 8 631 8 756
Procent/Per cent 0-14 16,2 15,6 14,8 14,2 14,4 14,7 14,615-64 64,2 63,0 60,7 59,0 56,8 54,7 53,865- 19,6 21,4 24,4 26,7 28,8 30,7 31,5
Källa/Source : Statistikcentralen/Statistics Finland
Kommun 2012 2015 2020 2025 2030 2035 2040
Brändö 471 460 458 464 475 486 496Eckerö 993 1 039 1 118 1 193 1 258 1 315 1 362Finström 2 548 2 610 2 724 2 845 2 955 3 048 3 133Föglö 577 578 580 594 615 632 645Geta 501 525 567 603 637 668 696Hammarland 1 552 1 628 1 749 1 858 1 955 2 036 2 106Jomala 4 360 4 676 5 192 5 648 6 040 6 385 6 681Kumlinge 360 361 369 377 384 392 399Kökar 243 232 229 232 237 239 244Lemland 1 892 1 983 2 121 2 265 2 397 2 516 2 611Lumparland 400 406 415 428 437 447 452Saltvik 1 821 1 860 1 931 2 008 2 089 2 162 2 223Sottunga 99 95 94 93 94 93 94Sund 1 040 1 052 1 091 1 139 1 181 1 223 1 261Vårdö 451 460 477 490 504 519 532
Mariehamn 11 351 11 633 12 129 12 655 13 136 13 560 13 941
Landskomm. 17 308 17 965 19 115 20 237 21 258 22 161 22 935-Landsbygden 15 107 15 779 16 908 17 987 18 949 19 800 20 525-Skärgården 2 201 2 186 2 207 2 250 2 309 2 361 2 410
Åland 28 659 29 598 31 244 32 892 34 394 35 721 36 876
Not/Note : Beräkningen innefattar f lyttningsrörelse/Migration included
Källa/Source : Statistikcentralen/Statistics Finland

Befolkning
Statistisk årsbok för Åland – Statistical Yearbook of Åland 2012 69
2.39. De 20 vanligaste efternamnen 31.12.2002 och 31.12.2011 2.39. The 20 most common surnames 31.12.2002 and 31.12.2011
Rang/
Rank Namn/ Antal personer/ Namn/ Antal personer/Name Number of persons Name Number of persons
1 Karlsson 1 254 Karlsson 1 2182 Eriksson 1 003 Eriksson 9603 Mattsson 788 Mattsson 7364 Jansson 773 Jansson 7265 Johansson 599 Johansson 5946 Andersson 536 Andersson 5077 Gustafsson 296 Gustafsson 3158 Häggblom 279 Häggblom 2839 Söderlund 257 Söderlund 249
10 Lindholm 214 Lindholm 22611 Holmström 212 Blomqvist 21012 Henriksson 207 Henriksson 21013 Danielsson 206 Holmström 20914 Blomqvist 204 Danielsson 20515 Nordberg 190 Nordberg 20216 Sjöblom 161 Sjöblom 17117 Sjölund 159 Eklund 16918 Eklund 156 Lundberg 16019 Lindqvist 150 Pettersson 15820 Lindström 149 Sjölund 156
Not/Note : Olika stavningar av samma namn har räknats som ett enda namn/Different spellings of the same name are
considered to be one and the same name.
Källa/Source : ÅSUB, Befolkningsregistercentralen/Statistics Åland, Central Population Register
31.12.2002 31.12.2011


3
3. Boende och byggande 3. Housing and construction
0
20
40
60
80
100
120
140
160
1975 1980 1985 1990 1995 2000 2005 2008 2009 2010 2011
Antal
Färdigställda bostäder efter region 1975-2011Dwellings completed by region 1975-2011
Mariehamn Landsbygden Skärgården

Boende och byggande Statistiken inom områdena boende och byggande omfattar uppgifter om nyproduktionen och beståndet av byggnader och bostäder samt statistik om bostadshushåll och hyresnivåer. Därtill innehåller kapitlet uppgifter om jordförvärv, lantmäteriverksamheten samt försäljning av lägenheter. Objekt för statistiken är i huvudsak byggnader, bostäder och hushåll. Förutom för hela Åland redovisas en hel del av statistiken i detta kapitel också efter kommun och region. En utförligare beskrivning av statistiken om boende och byggande inklusive definitioner av variabler finns på ÅSUBs webbplats www.asub.ax under Statistik efter ämne/Boende respektive Byggande. Källorna anges under varje tabell. Uppgifter om nya och förändrade byggnader och bostäder kommer från de kommunala byggnadsinspektionerna. Tillförlitligheten för statistiken är god eftersom byggdatasystemet och registren över bostäder och hushåll bildar ett sammanhållet system. Jämförbarheten mellan byggande- och boendestatistiken är god i och med att klassificeringarna av lägenhets- och hustyper är desamma och likaså mellan boende- och befolkningsstatistiken. Jämförelser över tiden för byggandestatistiken försvåras dock av att de inkomna uppgifterna var bristfälliga under åren 1999-2005. ÅSUB publicerar statistik om boende och byggande i statistikmeddelanden som finns tillgängliga på ÅSUBs webbplats, där det också finns data i form av Excel- och PC-Axis-tabeller. Ansvarig för statistikområdena boende och byggande på ÅSUB är Kenth Häggblom, [email protected].
Housing and construction The statistics on housing and construction include data on the number and completion of buildings and dwellings as well as statistics on household dwelling units and rents. In addition, this chapter includes data on acquisition of real estate, land survey activities and housing share transactions. More statistics on housing and construction are available at the website of Statistics Åland, www.asub.ax, in Excel-tables and PC-Axis-databases in English. Contact person is Kenth Häggblom, [email protected].

Boende och byggande
Statistisk årsbok för Åland – Statistical Yearbook of Åland 2012 73
3.1. Bostadshushåll efter bostadens upplåtelseform och kommun 2010 3.1. Household dwelling units by tenure status and municipality 2010
3.2. Bostadshushåll, boendeyta och trångboddhet efter kommun 2000 och 2010 3.2. Household dwelling units, living area and occupancy rate by municipality 2000 and 2010
Kommun Antal Pers. i hushåll/
hushåll/ Persons in
Dwellings dwellings Antal Procent Antal Procent Antal Procent
Brändö 222 476 154 69,4 38 17,1 30 13,5Eckerö 433 934 338 78,1 59 13,6 36 8,3Finström 1 073 2 466 848 79,0 154 14,4 71 6,6Föglö 267 558 195 73,0 45 16,9 27 10,1Geta 215 467 181 84,2 22 10,2 12 5,6Hammarland 660 1 490 522 79,1 105 15,9 33 5,0Jomala 1 606 4 045 1 354 84,3 164 10,2 88 5,5Kumlinge 169 361 120 71,0 26 15,4 23 13,6Kökar 130 258 83 63,8 20 15,4 27 20,8Lemland 706 1 780 597 84,6 70 9,9 39 5,5Lumparland 176 389 143 81,3 20 11,4 13 7,4Saltvik 794 1 787 632 79,6 110 13,9 52 6,5Sottunga 56 117 39 69,6 10 17,9 7 12,5Sund 478 1 010 361 75,5 73 15,3 44 9,2Vårdö 195 448 146 74,9 31 15,9 18 9,2
Mariehamn 5 714 10 973 2 778 48,6 2 434 42,6 502 8,8
Landskomm. 7 180 16 586 5 713 79,6 947 13,2 520 7,2-Landsbygden 6 141 14 368 4 976 81,0 777 12,7 388 6,3-Skärgården 1 039 2 218 737 70,9 170 16,4 132 12,7
Åland 12 894 27 559 8 491 65,9 3 381 26,2 1 022 7,9
Not/Note: Bostadens upplåtelseform är inte helt jämförbar med tidigare år/The tenure status figures are not fully comparable with those of earlier years
Källa/Source : Statistikcentralen, Boende/Statistics Finland, Housing
Annan form, okänd/
Other, unknown
Ägarbostäder/Owner
occupied dwellings
Hyresbostäder/
Rented flats
Kommun
2000 2010 2000 2010 2000 2010 2000 2010 2000 2010 2000 2010
Brändö 227 222 89 86 40 40 29 28 12,8 12,6 110 115Eckerö 346 433 99 92 41 43 41 41 11,8 9,5 185 181Finström 900 1 073 103 103 41 45 105 89 11,7 8,3 471 390Föglö 252 267 92 90 39 43 39 22 15,5 8,2 177 91Geta 200 215 99 98 41 45 30 18 15,0 8,4 134 81Hammarland 547 660 100 100 40 44 59 48 10,8 7,3 265 195Jomala 1 240 1 606 105 112 39 44 131 146 10,6 9,1 608 643Kumlinge 184 169 91 83 41 39 15 16 8,2 9,5 68 75Kökar 138 130 85 75 40 38 14 12 10,1 9,2 68 53Lemland 580 706 105 110 38 44 89 94 15,3 13,3 404 404Lumparland 150 176 97 93 39 42 17 13 11,3 7,4 71 52Saltvik 685 794 103 102 42 45 66 68 9,6 8,6 307 299Sottunga 59 56 98 93 44 44 9 4 15,3 7,1 45 19Sund 425 478 95 93 40 44 54 44 12,7 9,2 238 178Vårdö 169 195 104 98 43 43 13 14 7,7 7,2 63 82
Mariehamn 4 972 5 714 83 83 40 43 491 390 9,9 6,8 1 947 1 475
Landskomm. 6 102 7 180 101 101 40 44 711 657 11,7 9,2 3 214 2 858-Landsbygden 5 073 6 141 102 104 40 44 592 561 11,7 9,1 2 683 2 423-Skärgården 1 029 1 039 93 88 41 41 119 96 11,6 9,2 531 435
Åland 11 074 12 894 93 93 40 44 1 202 1 047 10,9 8,1 5 161 4 333
Not/Note : Ett hushåll är trångbott om antalet invånare uppgår till f ler än en person per rum. Köket räknas inte som ett rum/A household
is crowded if the number of persons exceeds the number of rooms, the kitchen not included.
Källa/Source : Statistikcentralen/Statistics Finland
Antal m2/hushåll/ m2/pers/
m 2 /household
Trångbodda hushåll/Crowded dwellings
Antal Procent Personer/Personsm 2 /pers

Boende och byggande
74 Statistisk årsbok för Åland – Statistical Yearbook of Åland 2012
3.3. Antal bostäder efter lägenhets- och hustyp 31.12.2010 3.3. Number of dwellings by type of building 31.12.2010
3.4. Antal bostäder efter hustyp och kommun 31.12.2010 3.4. Number of dwellings by type of building and municipality 31.12.2010
Typ av bostad/ Flervånings- Övriga bygg-
Type of dwelling 1) Fristående småhus/ Rad- och kedjehus/ bostadshus/ nader/Other
Totalt Detached houses Terraced houses Block of flats types of houses
Totalt 14 957 9 261 1 131 4 115 450
1 rum o. kök/kokvrå 1 237 197 186 772 82
2 rum o. kök/kokvrå 3 494 1 017 413 1 924 140
3 rum o. kök/kokvrå 3 320 1 760 355 1 104 101
4 rum o. kök/kokvrå 2 957 2 540 146 231 40
5 rum o. kök/kokvrå 2 174 2 110 16 29 19
6 rum o. kök/kokvrå 919 905 3 3 8
7+ rum o. kök/kokvrå 489 477 3 3 6
Okänd/Unknown 367 255 9 49 541) rum=room , kök=kitchen , kokvrå=kitchenette
Källa/Source : Statistikcentralen, Boende/Statistics Finland, Housing
Kommun Flervånings- Övriga bygg-Fristående småhus/ Rad- och kedjehus/ bostadshus/ nader/Other
Totalt Detached houses Terraced houses Block of flats types of houses
Brändö 310 241 53 - 16Eckerö 494 444 9 18 23Finström 1 199 967 136 63 33Föglö 328 269 32 - 27Geta 255 218 31 - 6Hammarland 738 600 91 16 31Jomala 1 777 1 542 62 111 62Kumlinge 215 180 13 8 14Kökar 188 149 26 5 8Lemland 789 725 43 12 9Lumparland 203 174 23 - 6Saltvik 888 747 104 11 26Sottunga 71 58 9 - 4Sund 542 457 54 7 24Vårdö 228 192 21 3 12
Mariehamn 6 732 2 298 424 3 861 149
Landskomm. 8 225 6 963 707 254 301-Landsbygden 6 885 5 874 553 238 220-Skärgården 1 340 1 089 154 16 81
Åland 14 957 9 261 1 131 4 115 450
Källa/Source : Statistikcentralen, Boende/Statistics Finland, Housing

Boende och byggande
Statistisk årsbok för Åland – Statistical Yearbook of Åland 2012 75
3.5. Färdigställda bostäder efter kommun 1975-2011 3.5. Dwellings completed by municipality 1975-2011
Figur 3.1. Färdigställda bostäder per 1 000 invånare efter region 1975-2011 Figure 3.1. Dwellings completed per 1 000 of population by region 1975-2011
Kommun 1975 1980 1985 1990 1995 2000 2005 2008 2009 2010 2011
Brändö 7 13 4 2 5 4 - 5 6 3 3Eckerö 14 3 2 5 3 4 4 11 6 4 7Finström 26 13 17 14 7 20 26 8 6 13 9Föglö 1 8 1 9 - - 1 15 1 3 1Geta 5 5 12 - - - - 10 8 3 1Hammarland 13 8 5 29 5 4 5 8 9 18 10Jomala 33 36 22 29 9 12 23 62 53 50 45Kumlinge - 4 6 - 1 2 - - 2 - 5Kökar - 1 3 - 3 5 2 1 9 4 1Lemland 17 11 8 18 6 5 10 13 9 11 24Lumparland 5 1 1 2 2 13 3 - 4 1 2Saltvik 4 9 4 14 3 3 7 12 14 13 7Sottunga - - 1 - - - - - - - -Sund 15 3 4 4 - 1 3 3 6 17 5Vårdö 1 3 7 8 3 2 - 1 2 - -
Mariehamn 108 137 85 130 5 56 81 55 94 101 54
Landskomm. 141 118 97 134 47 75 84 149 135 140 120-Landsbygden 132 89 75 115 35 62 81 127 115 130 110-Skärgården 9 29 22 19 12 13 3 22 20 10 10
Åland 249 255 182 264 52 131 165 204 229 241 174
Källa/Source : Statistikcentralen, Boende; ÅSUB Kommunal ekonomi och verksamhet/Statistics Finland, Housing; Statistics Åland,Public Finance and Activity
0
5
10
15
20
25
1975 1978 1981 1984 1987 1990 1993 1996 1999 2002 2005 2008 2011
Antal
År/Year
Mariehamn Landsbygden Skärgården

Boende och byggande
76 Statistisk årsbok för Åland – Statistical Yearbook of Åland 2012
3.6. Färdigställda bostäder efter hustyp, antal och yta 1975-2011 3.6. Dwellings completed by type of building, number and floor area 1975-2011
Figur 3.2. Färdigställda bostäder efter hustyp 1975-2011 Figure 3.2. Dwellings completed by type of building 1975-2011
År/
Year
Antal m² Antal m² Antal m² Antal m² Antal m²
1975 249 21 271 142 15 590 18 679 84 4 745 5 257
1976 296 22 899 139 14 565 27 1 254 128 6 897 2 183
1977 285 23 159 152 16 232 52 2 153 75 4 122 6 652
1978 316 29 377 210 23 294 24 1 363 81 4 658 1 62
1979 209 19 049 128 14 578 8 560 67 3 543 6 368
1980 255 23 655 148 17 488 18 1 040 83 4 802 6 325
1981 229 20 490 139 15 875 15 914 72 3 463 3 238
1982 319 27 365 171 18 749 47 2 954 86 4 998 15 664
1983 254 24 084 167 18 725 17 1 195 65 3 838 5 326
1984 282 23 552 138 15 343 49 3 318 91 4 453 4 438
1985 182 16 391 101 11 719 38 2 024 40 2 490 3 158
1986 148 12 415 76 8 361 44 2 687 26 1 223 2 144
1987 179 14 271 72 8 146 67 3 867 32 1 822 8 436
1988 153 12 152 57 6 837 31 1 782 64 3 457 1 76
1989 201 18 301 85 10 671 50 3 570 66 4 060 - -
1990 264 24 368 124 15 919 40 2 616 77 4 756 23 1 077
1991 240 20 524 102 12 782 38 2 112 83 4 762 17 868
1992 223 20 153 93 12 356 33 2 075 96 5 669 1 53
1993 180 18 169 91 12 738 9 680 58 3 144 22 1 607
1994 83 9 258 55 7 907 2 190 26 1 161 - -
1995 52 6 303 51 6 264 - - - - 1 39
1996 66 5 908 33 4 436 5 128 27 1 301 1 43
1997 50 6 542 49 6 488 - - - - 1 54
1998 50 5 636 35 4 472 - - 14 1 070 1 94
1999 68 .. .. .. .. .. .. .. .. ..
2000 131 .. .. .. .. .. .. .. .. ..
2001 162 .. 52 7 110 - - 59 3 696 16 1 444
2002 208 .. .. .. .. .. .. .. .. ..
2003 172 .. .. .. .. .. .. .. .. ..
2004 172 .. .. .. .. .. .. .. .. ..
2005 165 .. .. .. .. .. .. .. .. ..
2006 204 20 603 112 16 084 - - 90 4 295 2 224
2007 262 25 972 131 18 536 27 1 594 97 5 241 7 601
2008 204 23 559 134 19 090 14 1 242 37 2 417 19 810
2009 229 24 285 120 17 281 29 2 186 70 4 142 10 676
2010 241 26 128 108 16 020 21 1 495 95 7 540 17 1 073
2011 174 19 655 105 14 813 22 1 550 45 3 174 2 118
Not/Note : För åren 1999-2005 f inns inte tillförlitliga uppgifter om bostadens fördelning på hustyp/For 1999-2005 there is no reliable information
about the distribution by type of house.
Källa/Source : Statistikcentralen, Boende/Statistics Finland, Housing
Summa
Fristående små-
hus/Detached
houses
Andra än bostads-
hus/Other types
of houses
Rad- och kedje-
hus/Terraced
houses
Flervåningsbostads-
hus/Block of
flats
0
50
100
150
200
250
300
1975 1980 1985 1990 1995 2006 2011
Antal
Andra än bost.hus/Other types of houses
Våningshus/Block of flats
Radhus/Terraced houses
Fristående småhus/Detached houses

Boende och byggande
Statistisk årsbok för Åland – Statistical Yearbook of Åland 2012 77
3.7. Färdigställda bostäder efter lägenhetstyp, antal och genomsnittlig yta 1980-2011 3.7. Dwellings completed by type, number and average floor area 1980-2011
3.8. Färdigställda bostäder efter ägare 1980-2010 3.8. Dwellings completed by type of ownership 1980-2010
3.9. Antal byggnader efter hustyp, användning och byggnadsår 31.12.2011 3.9. Buildings by type of building, intended use and year of completion 31.12.2011
Typ av lägenhet 1)/ 1980 1985 1990 1995 1997 1998 2007 2008 2009 2010 2011
Type of dwelling 1)
Summa 255 182 264 52 50 50 262 204 229 241 1741 rum, kokvrå 11 9 10 1 - - 37 3 9 11 21 rum, kök 15 12 23 - - - - - 7 1 22 rum, kokvrå 1 6 4 - 1 - 35 12 65 3 92 rum, kök 50 36 43 5 7 7 13 15 15 30 313 rum, kök 49 29 71 8 5 10 61 35 40 58 384 rum, kök 46 45 56 19 18 15 39 29 26 44 355+ rum, kök 83 45 49 19 19 15 53 74 58 61 53Okänd/Unknown - - 8 - - 3 24 36 9 33 4Lägenh. genomsn. yta/
Av. floor area of dw. units 90,7 90,1 92,3 121,2 130,9 112,7 99,1 115,5 106,0 108,4 113,0
1) Rum=room , kokvrå=kitchenette , kök=kitchen
Källa/Source : Statistikcentralen, Boende/Statistics Finland, Housing
Ägare/Owner 1980 1985 1990 1995 1996 1997 1998 2007 2008 2009 2010
Summa 255 182 264 52 66 50 50 262 204 229 241
Enskild person/Private pers. 141 96 108 45 31 48 36 125 123 111 98
Bost.aktieb./Housing ass. 22 55 86 - 6 2 4 35 34 16 61
Fastighetsaktiebolag/ 62 6 21 - - - - 37 16 81 5
Real-estate comp.
Privata företag/Companies 23 4 27 - 1 - 10 56 14 12 5
Offentlig sektor/Public sector 7 21 16 - 26 - - 9 16 8 66Annan/Others - - 6 7 2 - - 1 1 6
Källa/Source : Statistikcentralen, Boende/Statistics Finland, Housing
Hustyp/Type of building 1921- 1940- 1960- 1980- 1990- 2000- 2010- Okänt/
Användning/Intended use Totalt -1920 1939 1959 1979 1989 1999 2009 Unknown
Totalt 12 875 1 123 680 1 368 2 908 2 190 1 553 1 448 291 1 314
Bostadsbyggnader/ 9 903 1 050 630 1 286 2 472 1 520 853 832 225 1 035
Residential buildings
Fristående småhus/Detached houses 9 302 1 036 598 1 216 2 295 1 387 790 762 209 1 009
Radhus/Terraced houses 216 1 - 2 54 85 29 24 8 13
Flervåningsbost.hus/Blocks of flats 385 13 32 68 123 48 34 46 8 13
Övriga byggn./Other buildings 2 972 73 50 82 436 670 700 616 66 279
Affärsbyggn./Shop buildings 1 113 34 18 27 258 339 244 81 8 104
Kontorsbyggn./Office buildings 120 10 4 10 28 30 13 8 1 16
Trafikbyggn./Traffic buildings 932 3 - 7 28 113 276 417 35 53
Vårdbyggn./Institutional buildings 59 1 6 3 13 11 11 6 4 4
Samlingslokaler/Build. for assembly 130 11 5 6 14 28 28 13 - 25
Underv.byggn./Educational buildings 61 6 7 9 16 7 6 2 2 6
Inudstribyggn./Industrial buildings 314 7 7 12 56 87 62 41 5 37
Lagerbyggn./Warehouses 163 - 1 2 15 40 43 42 11 9
Andra byggn./Other buildings 80 1 2 6 8 15 17 6 - 25
Källa/Source : Statistikcentralen, Boende/Statistics Finland, Housing

Boende och byggande
78 Statistisk årsbok för Åland – Statistical Yearbook of Åland 2012
3.10. Antal byggnader efter bränsle och yta 31.12.2011 3.10. Buildings by heating fuel and floor area 31.12.2011
Figur 3.3. Antal bostadsbyggnader efter bränsle 2000-2011 Figure 3.3. Residential buildings by heating fuel 2000-2011
Not/Note: Fjärrvärme=District-, localheat, El=Electricity, Olja, gas=Oil, gas, Koks, trä, torv=Coke, wood, peat
Hustyp/Type of building Fjärr-, Olja, Koks, trä, Övrigt el.
Totalt värme/ gas/ torv/ El/ okänt/
District-, Oil, Coke, Electricity Other or
localheat gas wood, peat unknown
Totalt 12 875 702 4 207 1 604 4 197 2 165
Bostadsbyggnader/
Residential buildings 9 903 530 3 798 1 490 2 989 1 096
Affärsbyggnader/
Shop buildings 1 113 32 96 68 720 197
Kontorsbyggnader/
Office buildings 120 43 41 - 26 10
Trafikbyggnader/
Traffic buildings 932 21 61 15 247 588
Vårdbyggnader/
Institutional buildings 59 17 24 - 11 7
Samlingslokaler/
Buildings for assembly 130 19 30 4 41 36
Undervisningsbyggn/
Educational buildings 61 19 30 1 7 4
Industribyggnader/
Industrial buildings 314 14 95 17 100 88
Lagerbyggnader/
Warehouses 163 4 17 1 35 106
Övriga byggnader/
Other buildings 80 3 15 8 21 33
Källa/Source : Statistikcentralen, Boende/Statistics Finland, Housing
0
500
1 000
1 500
2 000
2 500
3 000
3 500
4 000
4 500
Fjärrvärme El Olja, gas Koks, trä
Antal
2000 2005 2011

Boende och byggande
Statistisk årsbok för Åland – Statistical Yearbook of Åland 2012 79
3.11. Färdigställda ny- och tillbyggnader efter kommun 1980-2010 3.11. Building completions and extensions by municipality 1980-2010
3.12. Färdigställda ny- och tillbyggnader efter användningsområde 1980-2010, yta 1 000 m2 3.12. Building completions and extensions by use of building 1980-2010, floor area 1 000 m2
Kommun 1980 1985 1990 1992 1993 1994 1995 1996 1997 1998 2007 2008 2009 2010
Brändö 19 15 17 11 23 30 19 19 7 19 13 18 19 19Eckerö 47 15 45 29 43 22 34 23 17 13 5 27 24 27Finström 43 44 67 74 51 35 45 32 51 74 30 34 27 26Föglö 36 20 19 19 22 11 26 42 28 10 13 23 18 28Geta 12 24 31 10 8 12 24 9 40 9 9 22 21 23Hammarland 48 26 40 48 56 53 55 30 49 29 37 37 43 39Jomala 65 49 45 43 33 31 38 25 24 9 163 123 69 120Kumlinge 23 18 22 23 16 8 11 22 13 12 9 5 2 3Kökar 5 16 - 44 10 4 9 8 1 34 19 9 10 8Lemland 47 44 43 15 67 39 33 - 39 - 24 31 23 27Lumparland 16 7 11 19 12 9 11 20 12 - 6 4 9 3Saltvik 20 16 59 48 27 16 46 14 29 35 32 33 26 32Sottunga 4 4 4 1 1 1 1 10 6 - 19 1 9 5Sund 17 33 21 21 12 25 3 19 37 25 15 15 28 13Vårdö 14 37 26 48 28 38 20 21 21 32 17 35 19 25
Mariehamn 84 85 81 54 49 52 30 39 44 48 57 68 49 31
Landskomm. 416 368 450 453 409 334 375 294 374 301 411 417 347 398-Landsbygden 315 258 362 307 309 242 289 172 298 194 321 326 270 310-Skärgården 101 110 88 146 100 92 86 122 76 107 90 91 77 88
Åland 500 453 531 507 458 386 405 333 418 349 468 485 396 429
Källa/Source : Statistikcentralen, Boende/Statistics Finland, Housing
Användningsområde/
Use 1980 1985 1990 1992 1993 1994 1995 1996 1997 1998 2007 2008 20094) 2010
Summa3) 68 52 71 62 50 38 34 28 32 31 61 61 55 59
Bostäder/
Dwellings 1) 31 27 34 29 26 16 13 13 13 10 35 32 31 35
Lantbruk/
Agriculture 3 5 6 9 5 11 6 4 7 6 8 6 8 5
Industri/
Industrial 10 1 9 6 3 2 4 2 - 4 1 7 3 5
Affärs,kontor/
Business,office 2) 9 10 12 9 14 3 4 3 2 5 8 5 5 4
Offentliga byggn/
Public buildings 6 1 10 9 3 6 3 2 3 - 3 6 3 3
1)Inkl. fritidsbostäder/Including cottages. 2)Inkl. byggnader för transportväsendet/Including buildings for transportation. 3)Inkl. byggnader
som ej hör till nedannämnda grupper/Including all other types of buildings. 4)Uppgifterna reviderade/Revised figures
Källa/Source : Statistikcentralen, Boende/Statistics Finland, Housing

Boende och byggande
80 Statistisk årsbok för Åland – Statistical Yearbook of Åland 2012
3.13. Fritidshusbeståndet efter kommun 1985-1997 3.13. Cottages by municipality 1985-1997
3.14. Fritidshustätheten efter kommun 1985-1997 3.14. Density of cottages by municipality 1985-1997
Kommun
1985 1990 1997 1985 1990 1997 1985 1990 1997
Brändö 259 304 357 193 227 259 66 77 98Eckerö 831 893 978 392 423 457 439 470 521Finström 535 572 651 367 397 461 168 175 190Föglö 606 667 718 496 544 588 110 123 130Geta 397 444 484 304 342 377 93 102 107Hammarland 548 589 617 384 414 441 164 175 176Jomala 675 709 737 459 488 516 216 221 221Kumlinge 283 348 379 248 297 323 35 51 56Kökar 261 294 326 204 237 267 57 57 59Lemland 1 045 1 106 1 165 758 803 862 287 303 303Lumparland 297 326 352 204 226 252 93 100 100Saltvik 598 653 693 452 493 531 146 160 162Sottunga 160 174 182 94 108 112 66 66 70Sund 472 520 558 389 431 469 83 89 89Vårdö 423 487 555 370 425 486 53 62 69
-Landsbygden 5 398 5 812 6 235 3 709 4 017 4 366 1 689 1 795 1 869-Skärgården 1 992 2 274 2 517 1 605 1 838 2 035 387 436 482
Åland 7 390 8 086 8 752 5 314 5 855 6 401 2 076 2 231 2 351
Källa/Source : Regionplanebyrån, ÅSUB Boende och byggande/The Office of Regional Planning, Statistics Åland
TotaltSommarstugor/
CottagesUthyrningsstugor/Cottages for rent
Kommun
1985 1990 1997 1985 1990 1997
Brändö 2,5 3,0 3,5 1,2 1,3 1,5Eckerö 7,5 8,0 8,8 2,6 2,8 2,9Finström 4,4 4,7 5,4 0,7 0,7 0,7Föglö 4,6 5,1 5,5 2,2 2,6 2,8Geta 4,7 5,3 5,7 2,1 2,3 2,5Hammarland 4,1 4,4 4,6 1,2 1,2 1,2Jomala 4,8 5,0 5,2 0,6 0,6 0,6Kumlinge 2,9 3,6 3,9 1,5 1,8 1,9Kökar 4,5 5,1 5,7 2,1 2,3 2,5Lemland 9,4 9,9 10,4 2,5 2,4 2,1Lumparland 8,3 9,1 9,9 2,4 2,6 2,6Saltvik 4,0 4,3 4,6 1,0 1,0 1,1Sottunga 6,0 6,5 6,8 2,4 3,1 3,3Sund 4,4 4,8 5,1 1,2 1,3 1,4Vårdö 4,2 4,8 5,5 3,0 3,2 3,5
-Landsbygden 5,4 5,8 6,2 1,2 1,3 1,3-Skärgården 3,9 4,4 4,9 2,0 2,2 2,4
Åland 4,8 5,3 5,7 0,8 0,8 0,8
Källa/Source : ÅSUB Boende och byggande/Statistics Åland
Stugor/km²/Cottages/km²
Stugor/hushåll/Cottages/household

Boende och byggande
Statistisk årsbok för Åland – Statistical Yearbook of Åland 2012 81
3.15. Ansökningar om jordförvärv på Åland 2005-2011 3.15. Applications for owning and holding real estate in Åland 2005-2011
3.16. Verksamheten vid Ålands lantmäteribyrå 1995-2011 3.16. Activities of the Åland Office of Land Survey 1995-2011
Ansökande/ApplicantsKön/Sex
2005 2009 2010 2011 2005 2009 2010 2011
Totalt 110 150 168 181 14 17 4 2Finska medborgare/Finnish citizens 44 41 28 53 4 7 3 -
kvinnor/females 22 17 15 27 3 3 2 -män/males 22 24 13 26 1 4 1 -
Utländska medborgare/Foreign citizens 30 43 56 64 10 8 1 -kvinnor/females 14 16 24 26 3 3 - -män/males 16 27 32 38 7 5 1 -
Sammanslutningar/Associations 36 66 84 64 - 2 - 2
Källa/Source : LR, Kansliavdelningen/The Government of Åland, Chancery Department
Beviljade tillstånd/ Avslag/Applications accepted Applications rejected
Verksamhet/Activities
2000 2005 2010 2011 2000 2005 2010 2011
Totalt 323 350 298 313 298 266 356 305
Basförrättningar/ 259 268 226 231 249 222 283 224
Styckningar/Parcel out 239 231 192 .. 223 205 251 ..
Ensk. vägförrättningar/Roadproceedings 15 27 22 .. 17 11 24 ..
Rågångar/Establishment of boundaries 5 10 12 .. 9 6 8 ..
Värderingsförrättningar/ 64 82 72 82 49 44 73 81
Allm. vägförrättningar/Roadproceedings 6 4 4 .. 8 4 4 ..
Klyvningar/Divisions 7 6 7 .. - 2 4 ..
Övriga förrättningar/Other proceedings 51 72 61 .. 41 38 65 ..
Källa/Source : Ålands lantmäteribyrå/The Åland Office of Land Survey
Applications FulfilledAnsökta förrättningar/ Verkställda förrättningar/

Boende och byggande
82 Statistisk årsbok för Åland – Statistical Yearbook of Åland 2012
3.17. Medelmånadshyra EUR per m² efter antal rum i bostaden 1995-2010 3.17. Average monthly rents, euro per square metre, by number of rooms in dwelling 1995-2010
3.18. Medelmånadshyra EUR per m² efter bostadens byggnadsår 1995-2010 3.18. Average monthly rents, euro per square metre, by year of completion of dwelling 1995-2010
3.19. Försäljning av aktielägenheter 2001-2007 3.19. Housing share transactions 2001-2007
År/Year
Totalt 1 2 3 4+
1995 5,11 5,68 5,22 5,21 4,952000 5,78 5,47 5,73 6,06 5,562001 5,93 5,68 6,81 6,34 5,512002 6,49 5,89 7,09 6,59 6,322003 6,91 7,48 7,07 6,96 6,482004 6,93 7,39 7,13 6,74 6,342005 6,91 6,75 7,38 6,62 6,452006 7,32 7,58 7,45 7,64 6,24
2007 7,55 7,55 7,97 7,30 6,53
2008 7,66 8,26 7,84 7,43 6,98
2009 8,26 9,42 8,49 7,88 7,932010 8,35 9,01 8,43 8,01 8,43
Källa/Source : ÅSUB, Hyresstatistik/Statistics Åland, Rental Statistics
Antal rum/Number of rooms
År/Year
Totalt 1951- 1961- 1971- 1981- 1991-
-1950 1960 1970 1980 1990
1995 5,11 4,82 5,36 4,54 5,16 5,74 5,742000 5,78 4,82 6,20 6,17 5,36 6,07 7,352001 5,93 4,48 6,66 6,22 5,59 6,34 7,342002 6,49 5,23 7,34 6,13 6,55 6,93 7,992003 6,91 6,94 6,70 6,45 6,77 6,92 7,782004 6,93 5,99 7,03 6,36 6,52 7,11 8,062005 6,91 5,82 7,16 6,93 6,21 7,26 7,56
2006 7,32 .. 6,55 1) 7,46 6,85 7,45 8,53
2007 7,55 .. 6,30 1) 7,59 7,38 7,87 9,21
2008 7,66 .. .. 6,98 2) 7,34 7,51 8,94
2009 8,26 .. .. 7,90 2) 7,76 8,29 9,13
2010 8,35 .. .. 8,16 2) 8,02 8,46 8,771) Gäller byggnadsår 1960 el. tidigare/Refers to dwellings completed 1960 or earlier. 2) Gäller byggnadsår 1970 el. tidigare/Refers to dwellingscompleted 1970 or earlier.
Källa/Source : ÅSUB, Hyresstatistik/Statistics Åland, Rental Statistics
Byggnadsår/Year of completion
År/ Frifinansierade/Non-subsidised 2)
Year Sålda bo- Värde, Rad- och småhus/
stadslägen- MEUR/ Yta, m2/ Flervåningshus/ Terraced and semi-
heter tot./ Value, Area, EUR/ Totalt Block of flats detached houses
Transac- MEUR m 2 m2
Antal EUR/ Antal EUR/ Antal EUR/
tions, tot 1) m2 m2 m2
2001 61 5 63,8 1 227 60 1 219 41 1 225 19 1 2062002 75 6 67,6 1 272 74 1 259 42 1 283 32 1 2272003 89 7 70,3 1 173 83 1 173 49 1 242 33 1 0702004 101 10 64,7 1 482 96 1 491 74 1 525 21 1 4232005 103 10 68,0 1 472 89 1 493 70 1 535 18 1 2992006 128 14 64,0 1 667 112 1 680 84 1 716 28 1 5712007 97 11 65,0 1 789 83 1 828 58 1 877 24 1 699
1) Innefattar nya och gamla lägenheter samt lägenheter vars hustyp är okänd/Including new and old housing as well as housing for which the
house type is unknown . 2) Innefattar lägenheter som färdigställts två år före statistikåret eller tidigare/Including housing completed two years
before the year of the statistics or earlier.
Källa/Source: Statistikcentralen, Boende/Statistics Finland, Housing

4
4. Jord- och skogsbruk, fiske 4. Agriculture and fishing
Mjölk/Milk
Spannmål/Grain
Kött o ägg/Beef and eggs
Sockerbetor/Sugar beetsPotatis/
Potatoes
Grönsaker/Vegetables
Äppel/Apples
Övrigt/Other
Bruttointäkter för lantbruksprodukter 2011, EURAgricultural gross income 2011, EUR

Jord- och skogsbruk, fiske Kapitlet om jordbruk, skogsbruk och fiske omfattar uppgifter om näringsgrenarnas produktion och dess värde samt för jordbrukets del, och i viss mån skogsbrukets, även om produktionens struktur och resurser. Fiskestatistiken innehåller också uppgifter om fiskodlingen och därtill ingår statistik om jakt i kapitlet. Objekt för statistiken är de producerade nyttigheterna, antal gårdar, antal djur samt arealerna. Uppgifterna gäller i huvudsak hela Åland, men vissa data om jordbruket presenteras också efter kommun. En utförligare beskrivning av statistiken om detta ämnesområde inklusive definitioner av variabler finns på ÅSUBs webbplats www.asub.ax under Statistik efter ämne/Jord- och skogsbruk, fiske. Källorna anges under varje tabell. Tillförlitligheten är hög i och med att statistiken baseras på registerdata och mer eller mindre heltäckande uppgifter från branschernas aktörer. Jämförbarheten över tiden är god. Förutom i Statistisk årsbok publicerar ÅSUB statistik om jordbruk, skogsbruk och fiske på webbplatsen i form av Exceltabeller. Ansvarig för statistikområdet på ÅSUB är Kenth Häggblom, [email protected].
Agriculture, forestry and fishing This chapter includes data on agriculture, forestry, fishing and fish farming as well as hunting. More statistics in this field are available at the website of Statistics Åland, www.asub.ax, in Excel-tables in English. Contact person is Kenth Häggblom, [email protected].
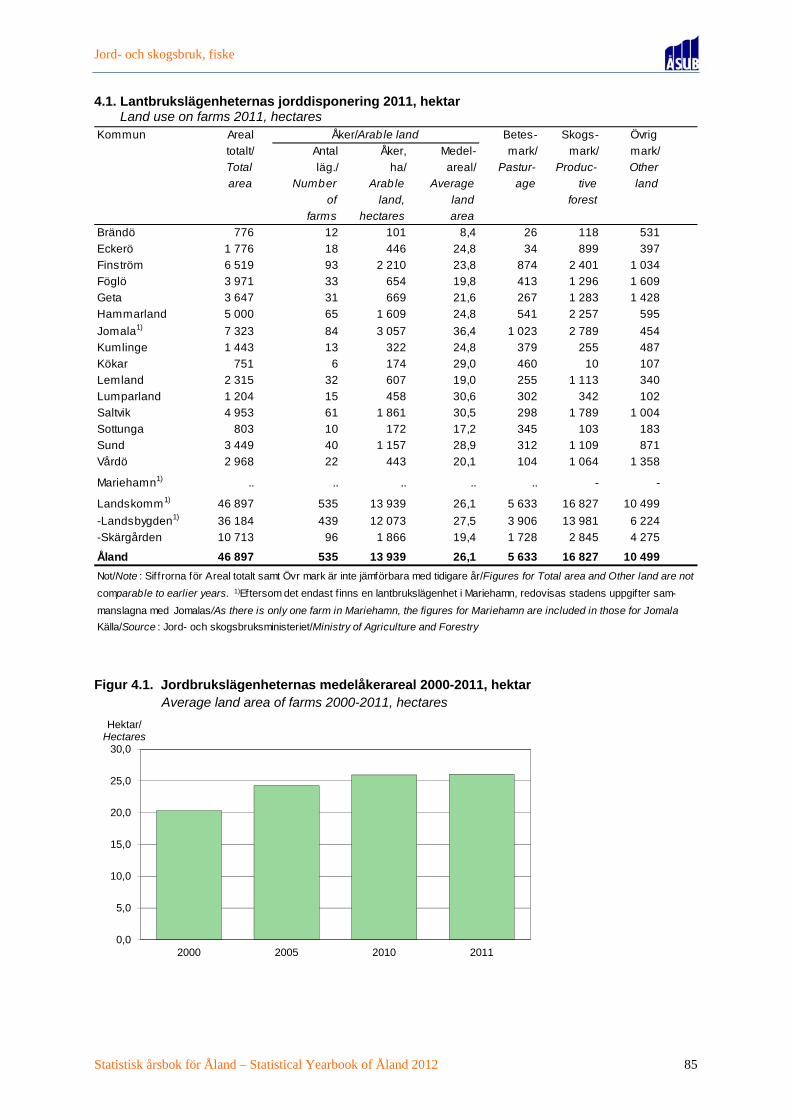
Jord- och skogsbruk, fiske
Statistisk årsbok för Åland – Statistical Yearbook of Åland 2012 85
4.1. Lantbrukslägenheternas jorddisponering 2011, hektar 4.1. Land use on farms 2011, hectares
Figur 4.1. Jordbrukslägenheternas medelåkerareal 2000-2011, hektar Figure 4.1. Average land area of farms 2000-2011, hectares
Kommun Areal Betes- Skogs- Övrig
totalt/ Antal Åker, Medel- mark/ mark/ mark/
Total läg./ ha/ areal/ Pastur- Produc- Other
area Number Arable Average age tive land
of land, land forest
farms hectares area
Brändö 776 12 101 8,4 26 118 531
Eckerö 1 776 18 446 24,8 34 899 397
Finström 6 519 93 2 210 23,8 874 2 401 1 034
Föglö 3 971 33 654 19,8 413 1 296 1 609
Geta 3 647 31 669 21,6 267 1 283 1 428
Hammarland 5 000 65 1 609 24,8 541 2 257 595
Jomala1) 7 323 84 3 057 36,4 1 023 2 789 454
Kumlinge 1 443 13 322 24,8 379 255 487
Kökar 751 6 174 29,0 460 10 107
Lemland 2 315 32 607 19,0 255 1 113 340
Lumparland 1 204 15 458 30,6 302 342 102
Saltvik 4 953 61 1 861 30,5 298 1 789 1 004
Sottunga 803 10 172 17,2 345 103 183
Sund 3 449 40 1 157 28,9 312 1 109 871
Vårdö 2 968 22 443 20,1 104 1 064 1 358
Mariehamn1) .. .. .. .. .. - -
Landskomm1) 46 897 535 13 939 26,1 5 633 16 827 10 499
-Landsbygden1) 36 184 439 12 073 27,5 3 906 13 981 6 224
-Skärgården 10 713 96 1 866 19,4 1 728 2 845 4 275
Åland 46 897 535 13 939 26,1 5 633 16 827 10 499
Not/Note : Siffrorna för Areal totalt samt Övr mark är inte jämförbara med tidigare år/Figures for Total area and Other land are not
comparable to earlier years. 1)Eftersom det endast f inns en lantbrukslägenhet i Mariehamn, redovisas stadens uppgifter sam-
manslagna med Jomalas/As there is only one farm in Mariehamn, the figures for Mariehamn are included in those for Jomala
Källa/Source : Jord- och skogsbruksministeriet/Ministry of Agriculture and Forestry
Åker/Arable land
0,0
5,0
10,0
15,0
20,0
25,0
30,0
2000 2005 2010 2011
Hektar/Hectares

Jord- och skogsbruk, fiske
86 Statistisk årsbok för Åland – Statistical Yearbook of Åland 2012
4.2. Aktiva jordbrukslägenheter efter storleksklass 1980-2011 4.2. Active farms by size category 1980-2011
4.3. Jordbrukslägenheter efter huvudproduktionsinriktning 1990-2011 4.3. Farms by main type of production 1990-2011
Brukad
åkerareal, ha/ 1980 1990 1995 2000 2005 2009 2010 2011
Arable land, ha
Antal 1 008 885 809 667 579 534 527 506 2- 4,99 320 181 151 92 66 70 69 63 5- 9,99 286 224 168 125 110 90 94 9210-19,99 274 287 234 190 142 127 117 11120-29,99 85 122 128 100 92 74 72 6330-49,99 34 60 104 118 107 101 103 10450+ 9 11 24 42 62 72 72 73
Procent 100,0 100,0 100,0 100,0 100,0 100,0 100,0 100,0 2- 4,99 31,7 20,5 18,7 13,8 11,4 13,1 13,1 12,5 5- 9,99 28,4 25,3 20,8 18,7 19,0 16,9 17,8 18,210-19,99 27,2 32,4 28,9 28,5 24,5 23,8 22,2 21,920-29,99 8,4 13,8 15,8 15,0 15,9 13,9 13,7 12,530-49,99 3,4 6,8 12,9 17,7 18,5 18,9 19,5 20,650+ 0,9 1,2 3,0 6,3 10,7 13,5 13,7 14,4
Källa/Source : Statistikcentralen, Jord- och skogsbruk, Tike/Statistics Finland, Agriculture and Forestry, Tike
Huvudproduktionsinriktning/
Type of production 1990 1995 2000 2005 2010 2011Antal lägenheter/Farms 979 860 713 614 561 535Djurhållning/Livestock farms 321 314 249 215 194 185
mjölk/milk 207 172 128 89 53 48övr. boskap/cattle 49 64 59 62 68 66svin/pigs 10 10 5 3 1 1fjäderfä/poultry 11 10 8 4 4 4får, get/sheep, goats 41 54 44 50 61 59hästar/horses 3 4 5 7 7 7
Växtodling o. annan prod./Crop and other production 658 546 464 399 367 350
spannmål/grain 278 217 168 130 108 99specialväxter/special crops 142 155 130 123 83 81trädg.växter (friland)/horticulture, outdoor 150 146 130 105 96 89annan prod/other production 88 28 36 41 80 81
Procent av lägenheterna/ 100,0 100,0 100,0 100,0 100,0 100,0Per cent of farmsDjurhållning/Livestock farms 32,8 36,5 34,9 35,0 34,6 34,6
mjölk/milk 21,1 20,0 18,0 14,5 9,4 9,0övr. boskap/cattle 5,0 7,4 8,3 10,1 12,1 12,3svin/pigs 1,0 1,2 0,7 0,5 0,2 0,2fjäderfä/poultry 1,1 1,2 1,1 0,7 0,7 0,7får, get/sheep, goats 4,2 6,3 6,2 8,1 10,9 11,0hästar/horses 0,3 0,5 0,7 1,1 1,2 1,3
Växtodling o. annan prod./Crop and other production 67,2 63,5 65,1 65,0 65,4 65,4
spannmål/grain 28,4 25,2 23,6 21,2 19,3 18,5specialväxter/special crops 14,5 18,0 18,2 20,0 14,8 15,1trädg.växter (friland)/horticulture, outdoor 15,3 17,0 18,2 17,1 17,1 16,6annan prod/other production 9,0 3,3 5,0 6,7 14,3 15,1
Not/Note : Uppgifterna gäller lägenheter med produktion. 1990 ingår endast lägenheter med en åkerareal större än en hektar/The figures refer to productive farms. In 1990, only farms with more than one hectare arable land are included.
Källa/Source : Jord- och skogsbruksministeriet/Ministry of Agriculture and Forestry

Jord- och skogsbruk, fiske
Statistisk årsbok för Åland – Statistical Yearbook of Åland 2012 87
4.4. Husdjurshållningen 1995-2011, antal lägenheter och antal djur 4.4. Livestock 1995-2011, number of farms and number of animals
Figur 4.2. Husdjurshållning 2000-2011, antal djur Figure 4.2. Livestock 2000-2011, number of animals
Djurslag/Livestock 1995 2000 2005 2009 2010 2011
Antal lägenheter/Number of farmsNötboskap/Cattle 278 224 168 146 146 140
Svin/Pigs 16 16 3 3 1 1
Höns/Hens 100 35 20 16 19 15
Får/Sheep 130 94 89 100 98 97
Hästar/Horses 44 37 53 48 43 39
Antal djur/Number of animalsNötboskap/Cattle 7 755 7 608 7 257 7 694 7 645 7 546
varav mjölkkor/of which dairy cows 2 358 2 260 1 901 1 792 1 860 1 764
Svin/Pigs 1 878 1 032 403 294 .. ..
Värphöns/Hens 11 900 9 174 12 835 12 780 14 289 12 199
Får/Sheep 6 222 5 232 6 151 13 124 13 535 12 660Hästar/Horses 143 181 240 257 248 215
Not/Note : Antalet hästar gäller enbart hästar på jordbrukslägenheter/The figures for horses include only horses onagricultural farms.
Källa/Source : Jord- och skogsbruksministeriet/Ministry of Agriculture and Forestry
0
2 000
4 000
6 000
8 000
10 000
12 000
14 000
16 000
2000 2002 2004 2006 2008 2010
Antal djur/Animals
Värphöns/Hens
Får/Sheep
Övr. nöt/Oth. cattle
Mjölkkor/Dairy cows

Jord- och skogsbruk, fiske
88 Statistisk årsbok för Åland – Statistical Yearbook of Åland 2012
4.5. Användning av åkerarealen 1995-2011 4.5. Use of arable land 1995-2011
4.6. Ekologisk odling 1995-2011, hektar åkermark 4.6. Ecological production 1995-2011, hectares arable land
Gröda/Crop 1995 2000 2005 2008 2009 2010 2011
Antal hektar/Hectares
Odlad åkermark totalt/ 14 282 13 757 13 790 13 951 13 962 13 929 13 788
Arable land under cultivation, totalVall, åkerbete/Grasslands, pasture 3 421 4 236 5 470 6 239 6 244 6 534 6 572
Fodersäd/Coarse grain 4 006 3 875 2 927 2 679 2 720 2 268 2 241
Brödsäd/Bread grain 1 845 1 817 1 544 2 187 2 206 1 722 1 818
Oljeväxter/Oil plants 145 28 40 302 209 518 341
Sockerbeta/Sugar beets 1 167 1 119 1 167 143 141 110 108
Potatis/Potatoes 851 779 748 866 879 930 860
Övriga växter/Other crops 1 608 911 790 726 712 771 804
Träda/Fallow 1 240 992 1 104 809 851 1 076 1 044
Procent
Odlad åkermark totalt/ 100,0 100,0 100,0 100,0 100,0 100,0 100,0
Arable land under cultivation, totalVall, åkerbete/Grasslands, pasture 24,0 30,8 39,7 44,7 44,7 46,9 47,7
Fodersäd/Coarse grain 28,0 28,2 21,2 19,2 19,5 16,3 16,3
Brödsäd/Bread grain 12,9 13,2 11,2 15,7 15,8 12,4 13,2
Oljeväxter/Oil plants 1,0 0,2 0,3 2,2 1,5 3,7 2,5
Sockerbeta/Sugar beets 8,2 8,1 8,5 1,0 1,0 0,8 0,8
Potatis/Potatoes 6,0 5,7 5,4 6,2 6,3 6,7 6,2
Övriga växter/Other crops 11,3 6,6 5,7 5,2 5,1 5,5 5,8Träda/Fallow 8,7 7,2 8,0 5,8 6,1 7,7 7,6
Källa/Source : Jord- och skogsbruksministeriet/Ministry of Agriculture and Forestry
1995 2000 2005 2008 2009 2010 2011
Summa 333 1 275 2 282 2 999 2 813 3 291 3 473
I övergång till eko-odling/Change-over 138 366 702 237 195 404 364I ekologisk produktion/In ecolog. prod. 195 909 1 579 2 762 2 618 2 887 3 108
Andel av den totala åkerarealen, procent/
Share of total arable land, per cent 2,3 9,3 16,5 21,5 20,1 23,6 25,2
Grödor (på arealen i ekologisk produktion)/Crops (in area of ecological production) .. 909 1 579 2 762 2 618 2 887 3 108Brödsäd/Bread grain .. 132 81 109 161 151 152Fodersäd/Coarse grain .. 123 159 164 229 200 169Potatis/Potatoes .. 17 16 5 14 18 19Ärter/Peas .. 22 2 7 2 2 5Vall, träda och övrigt/Grasslands, fallow, other 616 1 321 2 477 2 212 2 516 2 763
Källa/Source : LR Jordbruksbyrån, Jord- och skogsbruksministeriet, Livsmedelssäkerhetsverket/The Government of Åland, Office of Agriculture, Ministry of Agriculture and Forestry, Finnish Food Safety Authority

Jord- och skogsbruk, fiske
Statistisk årsbok för Åland – Statistical Yearbook of Åland 2012 89
4.7. Lantbruksprodukter, såld mängd och bruttointäkter 2009-2011 4.7. Agricultural production and gross income 2009-2011
Figur 4.3. Bruttointäkter för lantbruksprodukter 1995-2011 Figure 4.3. Gross income of agricultural production 1995-2011
Figur 4.4. Stöd till jordbruket 2000-2011, MEUR Figure 4.4. Agricultural subsidies 2000-2011, MEUR
Produkt/Product
2009 2010 2011 2009 2010 2011
Totalt 18 513 19 692 20 869
Kött/Meat 698 674 623 1 520 1 474 1 513
Mjölk (1 000 liter)/Milk (1 000 litres) 13 861 14 459 14 267 6 302 6 161 6 010
Ägg/Eggs 236 296 326 378 492 517
Spannmål/Grain 10 507 6 611 6 931 1 139 1 062 1 315
Sockerbeta/Sugar beets 5 013 4 010 4 760 132 64 48
Potatis/Potatoes 18 642 14 705 16 175 3 001 2 225 2 545
Grönsaker/Vegetables 6 539 8 611 6 177 2 897 3 970 3 317
Äppel/Apples 2 794 3 192 3 634 2 792 3 878 4 883
Övrigt/Other 352 367 720
Not/Note : I grönsaker ingår lök, gurka, purjo, kinakål, tomater, isbergssallat, bladselleri o. morot. Övriga grönsaker ingår i Övrigt/
Vegetables include onions, cucumbers, leek, Chinese leaves, tomatoes, iceberg lettuce, celery and carrots. Other vegetables
are included in Other.Källa/Source : ÅSUB/Statistics Åland
Production, tonnesSålda produkter, ton/ Bruttointäkter 1 000 EUR/
Gross income 1 000 EUR
0
2
4
6
8
10
12
Husdjursprodukter/Animal products
Spannmål/Grain Sockerbeta,potatis/Sugar beets,
potatoes
Grönsaker/Vegetables Äppel/Apples
MEUR
1995 2000 2005 2011
0,0
2,0
4,0
6,0
8,0
10,0
12,0
14,0
16,0
18,0
20,0
2000 2001 2002 2003 2004 2005 2006 2007 2008 2009 2010 2011
MEUR
Övrigt/Other
Gårdsstöd/Single farm payment
Investeringsstöd/Investmentsupport
LFA/LFA Allowance
Miljöstöd/Environmental support

Jord- och skogsbruk, fiske
90 Statistisk årsbok för Åland – Statistical Yearbook of Åland 2012
4.8. Skogsbruket. Markklasser 1963-2007 4.8. Forestry, land classes 1963-2007
4.9. Det totala virkesförrådet efter trädslag 1978-2007 4.9. Volume of the growing stock by species 1978-2007
4.10. Skogsmarkens fördelning på ägarkategorier 2007, procent 4.10. Ownership of forest land and forestry land 2007, per cent
Inventeringsår/ Total- Skogsbruksmark, ha/Forestry land, hectares Övrigt/Year of inventory areal/ Skogs- Tvin- Impe- Other
Total Summa mark/ mark/ diment/ Vägar mm/ land
area Forest land Scrub land Waste land Roads etc.
1963 148 100 117 200 54 600 16 500 45 700 400 30 900
1971 148 300 129 300 70 000 30 000 29 000 300 19 000
1978 148 200 116 600 63 600 23 600 29 100 300 31 600
1986 152 650 120 200 72 500 1) 20 400 27 000 300 32 450
1997 152 750 116 800 61 700 27 300 27 500 300 35 950
2007 155 300 125 500 67 400 2) 26 300 30 600 1 200 29 8001)Endast ca 60 000 ha bedöms vara tillgängligt för skogsbruk p.g.a. tomter, naturskydd m.m./Only about 60 000 hectares are avai-
lable for forestry, the rest is used as grounds, protection areas etc. 2) Ca 63 300 ha tillgängligt/About 63 300 hectares available for
forestry
Källa/Source : LR Skogsbruksbyrån, ÅSUB/The Government of Åland, Office of Forestry, Statistics Åland
Trädslag/
Species 1 000 m3 Procent 1 000 m3 Procent 1 000 m3 Procent 1 000 m3 Procent
1978 8 930 100,0 5 378 60,2 2 141 24,0 1 411 15,8
1986 9 824 100,0 5 411 55,1 2 421 24,6 1 992 20,3
1997 9 266 100,0 5 124 55,3 2 061 22,2 2 081 22,5
2007 11 711 100,0 6 117 52,2 2 340 20,0 3 254 27,8
Källa/Source : LR Skogsbruksbyrån, ÅSUB/The Government of Åland, Office of Forestry, Statistics Åland
Totalt Tall/Pine Gran/Spruce Lövträd/Broadleaves
Typ av mark/Type of land Areal, ha/ Totalt Enskilda/ Bolag/ Övriga/Area, ha Private Compan. Other
Skogsmark/Forest land 67 400 100,0 90,4 2,2 7,4
Skogsbruksmark/Forestry land 125 500 100,0 87,8 1,8 10,4
Källa/Source : LR Skogsbruksbyrån, ÅSUB/The Government of Åland, Office of Forestry, Statistics Åland

Jord- och skogsbruk, fiske
Statistisk årsbok för Åland – Statistical Yearbook of Åland 2012 91
4.11. Skogsvårdsarbeten i privatägda skogar 1990-2011, hektar 4.11. Forest improvement work on private forest land 1990-2011, hectares
4.12. Skogsbruket 2000-2011. Sålt virke efter mängd och leveransvärde 4.12. Forestry 2000-2011. Production by volume and delivery value
Figur 4.5. Sålt virke 1980-2011 Figure 4.5. Delivery of pulp and logs 1980-2011
År/Year Plantröjning/ Markberedning/ Plantering/Artificial regeneration 1)
Seedling stand Preparation Tall/ Gran/ Löv/improvement of areas Pine Spruce Broadleaves
1990 389,7 285,5 264,9 110,2 ..1995 447,9 153,8 63,0 75,9 7,51996 382,6 183,0 58,5 70,2 0,41997 519,9 128,9 84,3 73,2 1,01998 601,8 145,6 44,6 59,7 0,21999 652,5 128,2 61,7 70,7 -2000 743,3 152,4 59,0 59,9 0,22001 678,3 161,6 50,5 57,8 0,32002 437,3 188,6 70,5 63,7 0,22003 706,5 214,2 53,1 74,7 0,22004 656,2 279,6 72,6 83,0 0,22005 668,3 310,4 86,7 93,1 2,02006 637,9 229,4 97,7 119,6 0,82007 667,7 229,8 79,5 61,3 0,12008 652,2 268,1 98,0 96,3 -2009 622,3 216,2 76,0 82,0 -2010 580,9 229,5 46,1 95,2 2,12011 591,9 254,1 62,6 90,1 0,41)Både skogsförbättrings- och normalplantering, fr.o.m. 1996 endast normalplantering/Both forest improvement and artificialregeneration, after 1996 only artificial regeneration.
Källa/Source : LR Skogsbruksbyrån/The Government of Åland, Office of Forestry
År/Year
Totalt Barr/ Löv/ Barr/ Löv/ Totalt Barr/ Löv/ Barr/ Löv/Softwood Hardwood Softwood Hardwood Softwood Hardwood Softwood Hardwood
2000 148 982 55 043 203 73 822 19 914 4 005 1 972 6 1 632 3952001 142 016 48 907 174 72 663 20 272 3 894 1 776 5 1 705 4082002 185 070 67 736 214 99 076 18 044 4 507 2 203 7 1 991 3062003 189 225 66 214 186 100 468 22 357 4 126 2 069 6 1 720 3312004 216 819 73 234 184 113 859 29 542 4 007 2 226 6 1 462 3132005 190 309 57 780 90 105 383 27 056 3 401 1 778 3 1 340 2802006 171 261 62 108 241 87 507 21 405 3 401 2 024 7 1 113 2572007 182 796 66 004 199 91 710 24 883 4 679 2 773 7 1 535 3642008 178 505 53 289 206 94 292 30 719 4 603 2 104 10 1 927 5622009 176 787 45 507 163 97 055 34 062 4 019 1 775 6 1 701 5372010 203 921 60 738 159 107 779 35 246 4 275 2 280 5 1 588 4012011 196 421 59 929 97 105 617 30 778 4 350 2 324 4 1 647 375
Källa/Source : Skogsbolagen, ÅSUB/The forest companies, Statistics Åland
m3 1 000 EURTimmer/Logs Massaved/Pulp Timmer/Logs Massaved/Pulp
0
50 000
100 000
150 000
200 000
1980 1983 1986 1989 1992 1995 1998 2001 2004 2007 2010
m3
Massaved/Pulp Timmer/Logs

Jord- och skogsbruk, fiske
92 Statistisk årsbok för Åland – Statistical Yearbook of Åland 2012
4.13. Fiskets avkastning 2009-2011 4.13. The yield of fishing 2009-2011
4.14. Fiskodlingen 2007-2011 4.14. Fish culture 2007-2011
Fiskslag/Fish Fångst, Förs.värde Fångst, Förs.värde Fångst, Förs.värde
ton/ 1 000 EUR/ ton/ 1 000 EUR/ ton/ 1 000 EUR/Catch, Gross Catch, Gross Catch, Gross
tonnes value tonnes value tonnes value
Totalt 2 090 1 716 3 415 2 503 4 216 3 713Abborre Perch 81 206 69 194 84 282Braxen Bream 15 7 16 7 15 9Flundra Flounder 38 28 13 13 4 8Gädda Pike 16 29 11 22 14 28Gös Pike-perch 11 80 11 83 14 103Havsöring Trout 2 8 1 5 1 4Lake Burbot 2 8 1 4 1 3Lax Salmon 10 44 10 55 20 119Vildfångad Rainbow regnbågslax trout, wild 3 7 0 0 0 1Sik Whitefish 54 332 43 274 63 355Strömming o. Baltic herring vassbuk and sprat 1 355 293 2 686 967 3 346 1 775Torsk Cod 468 611 521 805 610 983Andra fiskslag Other species 34 7 34 16 43 3
Kräftor, st Crayfish, pcs 24 580 57 29 704 59 17 713 40
Not/Note : I tabellen ingår även f isk såld utanför Åland/The figures also include fish sold outside the Åland Islands.
Källa/Source : LR Fiskeribyrån/The Government of Åland, Office of Fisheries
2009 2010 2011
2007 2008 2009 2010 2011
Antal företag 31.12/ 11 11 10 10 10
Number of firms
Antal enheter 31.12/ 36 36 29 27 24
Number of units
Såld fisk, ton/Fish sold, tonnes 4 156 4 139 4 527 4 118 3 487
Produktionens värde, 1 000 EUR1)/ 14 500 12 800 14 950 15 790 13 307
Value of production, 1 000 EUR 1)
Antal sysselsatta (årsarbeten)1)/ 76 76 76 75 68
Number of employed persons (man years) 1)
1)Ungefärliga siffror/Approximate data.Källa/Source : LR Fiskeribyrån/The Government of Åland, Office of Fisheries

Jord- och skogsbruk, fiske
Statistisk årsbok för Åland – Statistical Yearbook of Åland 2012 93
Figur 4.6. Fisket och fiskodlingen 2000-2011, volym och värde Figure 4.6. Fishing and fish culture 2000-2011, tonnes and value
4.15. Jakt på hjortdjur 2000-2011 4.15. Hunt on deers 2000-2011
Figur 4.7. Fällda rådjur 1973-2011 Figure 4.7. Roe deers shot 1973-2011
0
1 000
2 000
3 000
4 000
5 000
6 000
7 000
8 000
0
2 000
4 000
6 000
8 000
10 000
12 000
14 000
16 000
18 000
20 000
22 000
24 000
2000 2002 2004 2006 2008 2010
Ton/Tonnes1 000 EUR
Värde fångad fisk/Catches value
Värde odlad fisk/Cult. fish value
Mängd fångad fisk/Catches volume
Mängd odlad fisk/Cult. fish volume
År/YearTotalt Tjur/ Ko/ Kalv/ Totalt Bock/ Get/ Killing/
Bulls Cows Calves He-deer Hind Young deer2000 239 76 51 112 4 041 1 323 895 1 8232001 237 74 51 112 4 449 1 463 1 017 1 9692002 239 74 52 113 5 302 1 795 1 258 2 2492003 225 62 58 105 4 700 1 532 1 235 1 9332004 197 57 43 97 4 355 1 282 1 163 1 9102005 161 49 34 78 4 420 1 324 1 104 1 9922006 170 52 36 82 3 757 1 331 902 1 5242007 163 45 46 72 4 197 1 350 1 044 1 8032008 182 60 36 86 4 597 1 538 1 145 1 9142009 186 59 46 81 4 162 1 411 1 034 1 7172010 189 61 42 86 2 993 1 074 656 1 2632011 179 61 39 79 2 231 763 439 1 029
Källa/Source : LR Skogsbruksbyrån/The Government of Åland, Office of Forestry
Fällda rådjur/Roe deers shot Fällda älgar/Elks shot
0
1 000
2 000
3 000
4 000
5 000
6 000
7 000
1973 1976 1979 1982 1985 1988 1991 1994 1997 2000 2003 2006 2009
Antal
År/Year

Jord- och skogsbruk, fiske
94 Statistisk årsbok för Åland – Statistical Yearbook of Åland 2012
Figur 4.8. Fällda sälar 2000-2011 Figure 4.8. Seals shot 2000-2011
4.16. Utgivna jaktkort 1998-2011 4.16. Issued hunting licences 1998-2011
0
50
100
150
200
250
2000 2001 2002 2003 2004 2005 2006 2007 2008 2009 2010 2011
Antal
År/Year
År/Year Inkomst brutto/
Totalt Icke ålänningar/ Licences fees
K M Non-Ålanders EUR1998 4 266 140 4 126 662 80 4061999 4 273 158 4 115 509 82 0342000 4 747 169 4 578 661 87 2602001 4 238 153 4 085 494 91 2762002 4 243 151 4 092 510 87 9342003 4 276 166 4 110 562 94 0002004 4 318 168 4 150 557 97 2112005 4 354 177 4 177 602 99 6272006 4 231 182 4 049 690 93 8392007 4 134 188 3 946 721 94 8122008 4 136 192 3 944 723 82 7202009 4 330 196 4 134 785 86 6002010 4 487 242 4 245 963 134 6102011 4 563 249 4 314 962 136 890
Källa/Source : LR Skogsbruksbyrån/The Government of Åland, Office of Forestry
Kön/Sex

Jord- och skogsbruk, fiske
Statistisk årsbok för Åland – Statistical Yearbook of Åland 2012 95
4.17. Utbetalade hjortdjursskadebidrag 2000-2011, EUR 4.17. Compensation for damages caused by roe deer and elk 2000-2011, EUR
År/Year Stängselbidrag o.a. föreb.åtg./Subsidies
Skog/ Odlingar/ Motorfordon/ Husdjur/ for fencing and otherTotalt Forest Plants Vehicles Pets prevention
2000 42 509 17 390 8 090 - - 17 029
2001 15 960 7 811 3 416 - - 4 733
2002 27 418 7 130 8 438 - - 11 850
2003 19 827 11 905 3 131 - - 4 791
2004 27 443 9 856 1 056 900 1 585 14 046
2005 16 816 4 394 1 059 700 - 10 663
2006 23 462 7 116 - - - 16 346
2007 23 623 4 929 6 642 - - 12 053
2008 15 424 4 409 1 817 - - 9 197
2009 16 174 5 031 - - - 11 143
2010 12 160 4 458 - - - 7 7022011 15 188 2 869 6 101 - - 6 218
Källa/Source : LR Skogsbruksbyrån/The Government of Åland, Office of Forestry
Bidrag för skador på/Damage to

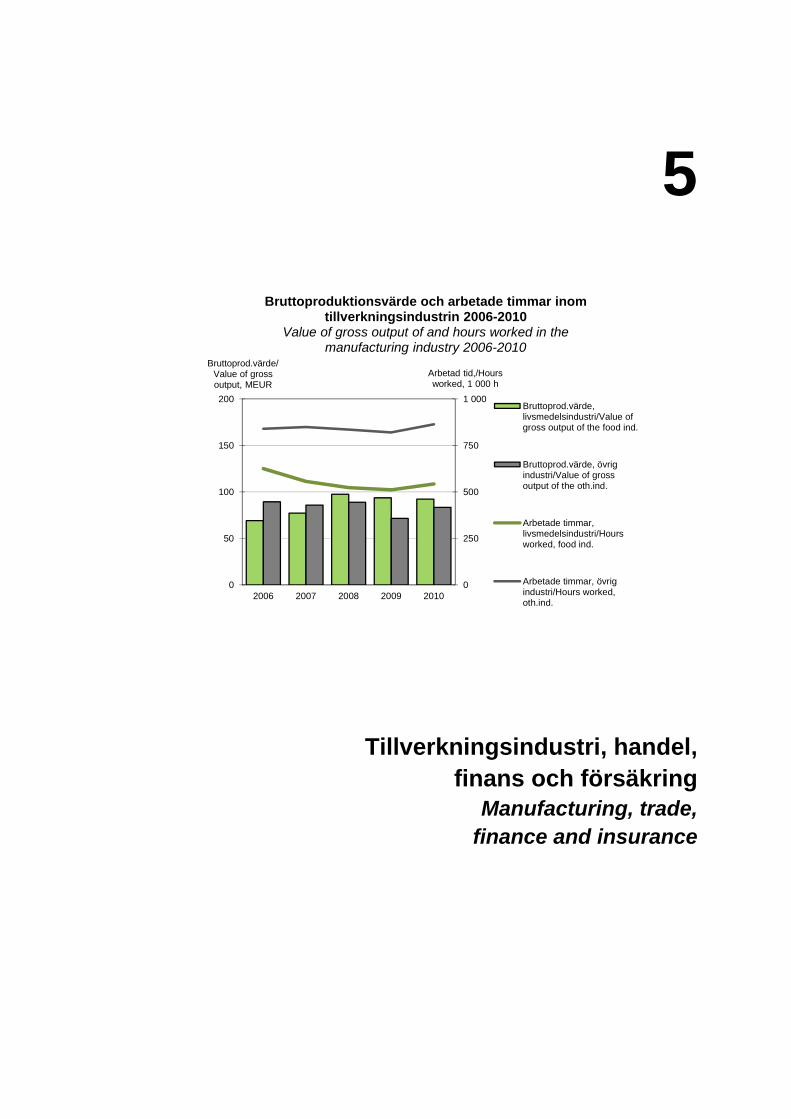
5
5. Tillverkningsindustri, handel, finans och försäkring
5. Manufacturing, trade, finance and insurance
0
250
500
750
1 000
0
50
100
150
200
2006 2007 2008 2009 2010
Arbetad tid,/Hours worked, 1 000 h
Bruttoprod.värde/Value of gross output, MEUR
Bruttoproduktionsvärde och arbetade timmar inom tillverkningsindustrin 2006-2010
Value of gross output of and hours worked in the manufacturing industry 2006-2010
Bruttoprod.värde,livsmedelsindustri/Value ofgross output of the food ind.
Bruttoprod.värde, övrigindustri/Value of grossoutput of the oth.ind.
Arbetade timmar,livsmedelsindustri/Hoursworked, food ind.
Arbetade timmar, övrigindustri/Hours worked,oth.ind.

Tillverkningsindustri, handel, finans och försäkring Statistiken om dessa tre näringsgrenar omfattar förutom ekonomiska data också uppgifter om arbetsställen samt för industrins del även arbetade timmar. Objekt för statistiken är bl.a. omsättning, förädlingsvärde, investeringar, personal och krediter. Uppgifterna gäller i huvudsak hela Åland, men siffrorna om arbetsställen redovisas också efter region. En utförligare beskrivning av statistiken inklusive definitioner av variabler finns på ÅSUBs webbplats www.asub.ax under Statistik efter ämne/Tillverkningsindustri respektive Handel samt Finansiering och försäkring. Källorna anges under varje tabell. Tillförlitligheten för statistiken är god i och med att den baseras på registerdata och heltäckande uppgifter från branschernas aktörer. Jämförbarheten över tiden är god liksom med andra närliggande statistikområden såsom nationalräkenskaper och företag. Ansvarig för tillverkningsindustri, finans och försäkring på ÅSUB är Kenth Häggblom, [email protected] och för handel Jonas Karlsson, [email protected].
Manufacturing, trade, finance and insurance The statistics in this chapter include economical data and information on work places as well as on hours worked in the manufacturing industry. Contact person is Kenth Häggblom, [email protected] for manufacturing, finance and insurance and for trade Jonas Karlsson, [email protected].

Tillverkningsindustri, handel, finans och försäkring
Statistisk årsbok för Åland – Statistical Yearbook of Åland 2012 99
5.1. Arbetsställen inom tillverkningsindustrin efter region, personalens storlek och näringsgren 2003-2011 5.1. Work places in the manufacturing industry by region, size of workforce and industry 2003-2011
Figur 5.1. Arbetstagare, tjänstemän och företagare inom industrin 1995-2008 Figure 5.1. Employees, white-collar workers and entrepreneurs in industry 1995-2008
Region
Personalens storleksklass/Workforce
Näringsgren/Industry 2003 2004 2005 2006 2007 2008 2009 2010 2011
Totalt 203 195 195 182 185 162 167 162 164
Region
Mariehamn 89 86 81 77 74 67 69 66 67Landsbygden 91 84 93 86 91 79 82 81 82Skärgården 23 25 21 19 20 16 16 15 15
Personalens storleksklassWorkforce by size class0-4 144 142 156 150 150 133 139 132 1285-9 11 12 11 6 8 6 8 10 1410-19 14 11 11 11 9 8 9 7 620-49 9 10 9 12 12 10 8 10 1050+ 5 5 4 3 4 2 2 2 2Okänd/Unknown 20 15 4 - 2 3 1 1 4
Näringsgren/IndustryLivsmedelsindustri/Food industry 36 31 30 27 27 25 26 27 26
Trävaruindustri/Manufacture
of wood products 25 26 25 22 21 23 25 26 26
Grafisk produktion
Printing production 24 25 24 22 22 6 5 6 3
Kemisk ind. inkl. plastind./
Chemical industry 7 7 8 7 7 8 9 7 7
Metallindustri/Metal industry 70 65 66 67 69 49 53 50 48Övrig industri/Other manufacturing 41 41 42 37 39 51 49 46 50Not/Note : Näringsgrensindelning förändrades 2008. En stor del av branschen Förlagsverksamhet och grafisk produktionräknas inte längre till industrin. En del av branschen Metallindustri har f lyttats till Övrig industri/The industrial classificationsystem was revised 2008. A large part of the Printing industry is no longer included in the Manufacturing industry. Part ofthe Metal industry has been moved to Other manufacturingKälla/Source : Statistikcentralen, Företagsregister, ÅSUB/Statistics Finland Register of Enterprises, ÅSUB
0
100
200
300
400
500
600
700
800
1995 1997 1999 2001 2003 2005 2007
Personer/Persons
Arbetstagare/Employees Tjänstemän/White-collar workers
Företagare/Self-employed

Tillverkningsindustri, handel, finans och försäkring
100 Statistisk årsbok för Åland – Statistical Yearbook of Åland 2012
5.2. Tillverkningsindustrins bruttoproduktionsvärde efter bransch 2006-2010, MEUR 5.2. Value of gross output of the manufacturing industry by industry 2006-2010, MEUR
5.3. Tillverkningsindustrins förädlingsvärde efter bransch 2000-2010, MEUR 5.3. Value added of the manufacturing industry by industry 2000-2010, MEUR
Bransch/Industry 2006 2007 2008 2009 2010
Industrin totalt/Manufacturing 158 163 186 165 176
Livsmedelsindustri/Food industry 69 77 97 94 92
Trävaruindustri/Manufacture of wood products 15 17 16 14 16
Grafisk produktion/Printing production 6 6 6 5 4
Kemisk ind. inkl. plastind./Chemical industry 33 29 31 23 28
Metallindustri/Metal industry 24 25 26 21 24
Övrig industri/Other manufacturing 11 10 10 10 11
Källa/Source : Statistikcentralen, Industristatistik/Statistics Finland
Bransch/Industry 2000 2001 2002 2003 2004 2005 2006 2007 2008 2009 2010
Industrin totalt/Manuf. industry 48,4 50,7 54,6 60,4 49,7 48,0 60,4 78,5 47,2 57,3 59,1
Livsmedelsindustri/
Food industry 15,5 16,4 17,7 16,0 15,8 16,4 19,0 18,8 21,3 21,6 23,6
Trävaruindustri/Manufacture
of wood products 4,2 5,4 4,7 5,0 4,0 4,1 4,8 5,1 3,9 3,8 5,0
Grafisk produktion/Printing production 8,4 10,7 11,2 15,8 8,2 6,1 5,3 6,4 2,1 2,2 1,8
Kemisk ind. inkl. plastind./
Chemical industry 8,2 7,4 8,6 7,7 8,3 8,8 18,0 37,2 7,0 13,9 13,1
Metallindustri/Metal industry 7,3 6,4 8,3 11,3 9,4 9,1 9,3 7,5 8,3 11,4 11,0
Övrig industri/Other manufacturing 4,8 4,4 4,2 4,6 3,8 3,7 3,9 3,5 4,7 4,5 4,6
Not/Note : Reviderade uppgifter för 2008-2009/Revised figure for 2008-2009
Källa/Source : ÅSUB, Nationalräkenskaper/Statistics Åland, National Accounts

Tillverkningsindustri, handel, finans och försäkring
Statistisk årsbok för Åland – Statistical Yearbook of Åland 2012 101
5.4. Arbetade timmar inom tillverkningsindustrin efter anställningsförhållande och bransch 2006-2010, 1 000 timmar 5.4. Hours worked in the manufacturing industry by employment position and industry 2006-2010, 1 000 hours
Figur 5.2. Arbetade timmar inom tillverkningsindustrin 1995-2010 Figur 5.2. Hours worked in the manufacturing industry 1995-2010
Bransch/Industry 2006 2007 2008 2009 2010
Industrin totalt/All industry 1 465 1 406 1 359 1 331 1 407
Livsmedelsindustri/Food industry 625 557 523 511 543
Trävaruindustri/Manufacture of wood prod. 109 118 122 112 144
Grafisk produktion/Printing production 58 65 61 61 46
Kemisk ind. inkl. plastind./Chemical industry 282 292 298 281 296
Metallindustri/Metal industry 268 264 252 231 253
Övrig industri/Other manufacturing 123 110 103 135 125
Källa/Source: Statistikcentralen, Industristatistik/Statistics Finland
0
200
400
600
800
1 000
1 200
1 400
1 600
1 800
2 000
1995 1997 1999 2001 2003 2005 2007 2009
1 000 timmar/hours
NI‐2002
NI‐2008

Tillverkningsindustri, handel, finans och försäkring
102 Statistisk årsbok för Åland – Statistical Yearbook of Åland 2012
5.5. Investeringar inom tillverkningsindustrin efter investeringsslag och bransch 2006-2010, 1 000 EUR 5.5. Investments in the manufacturing industry by type of investment and industry 2006-2010, 1 000 EUR
Investeringsslag/Type of investmentBransch/Industry 2006 2007 2008 2009 2010
Investeringar totalt/Total investments 9 429 6 536 6 590 5 827 5 603
Livsmedelsindustri/Food industry 4 003 2 970 2 525 3 706 3 194
Trävaruindustri/Manufacture of wood prod. 990 439 1 816 140 1 069
Grafisk produktion/Printing production 391 1 604 147 33 120
Kemisk ind. Inkl. plastind./Chemical industry 2 242 806 606 1 323 420
Metallindustri/Metal industry 277 304 1 024 502 283
Övrig industri/Other manufacturing 1 526 413 472 123 517
Byggnader och konstruktioner/
Buildings and constructions 2 955 677 2 399 3 511 2 001
Livsmedelsindustri/Food industry 904 436 358 2 835 1 549
Trävaruindustri/Manufacture of wood prod. 248 55 1 130 13 347
Grafisk produktion/Printing production 50 19 0 0 0
Kemisk ind. Inkl. plastind./Chemical industry 1 258 95 165 414 85
Metallindustri/Metal industry 56 27 710 217 14
Övrig industri/Other manufacturing 439 45 36 32 6
Maskiner/Machinery 6 200 5 852 4 127 2 099 3 406
Livsmedelsindustri/Food industry 3 050 2 530 2 155 657 1 453
Trävaruindustri/Manufacture of wood prod. 720 384 675 126 722
Grafisk produktion/Printing production 341 1 584 147 33 120
Kemisk ind. Inkl. plastind./Chemical industry 780 707 441 909 335
Metallindustri/Metal industry 221 276 272 282 264
Övrig industri/Other manufacturing 1 088 371 437 92 512
Not/Note: Investeringar totalt innehåller andra investeringar än byggnader och maskiner/Total investments include invest-
ments other than buildings and mashinery
Källa/Source : Statistikcentralen, Industristatistik/Statistics Finland

Tillverkningsindustri, handel, finans och försäkring
Statistisk årsbok för Åland – Statistical Yearbook of Åland 2012 103
5.6. Handelns arbetsställen efter region, personalens storlek och näringsgren 2003-2011 5.6. Work places in trade and services by region, workforce size and industry 2003-2011
5.7. Handelns omsättning efter bransch 2000-2011, MEUR 5.7. Turnover in trade and services by industry 2000-2011, MEUR
5.8. Handelns förädlingsvärde efter bransch 2000-2010, MEUR 5.8. Value added in trade and services by industry 2000-2010, MEUR
RegionPersonalens storlek/Workforce sizeNäringsgren/Industry 2003 2004 2005 2006 2007 2008 2009 2010 2011
Totalt 650 650 657 649 652 662 666 676 676
RegionMariehamn 371 358 346 322 325 334 337 343 343Landsbygden 216 227 245 261 260 263 262 265 265Skärgården 63 65 66 66 67 65 67 68 68
Personalens storleksklass/Workforce by size class0-4 499 505 545 554 558 550 558 569 5695-9 58 58 63 54 59 55 59 60 6010-19 23 19 20 20 23 25 24 22 2220-49 8 8 8 8 7 11 11 13 1350+ 2 2 2 2 2 2 2 2 2Okänd/Unknown 60 58 19 11 3 19 12 10 10
Näringsgren/IndustryHandel med motorfordon/Car sales 78 79 77 73 73 65 69 71 71Partihandel/Wholesale trade 124 121 115 115 120 117 120 120 120Detaljhandel/Retail trade 264 259 274 276 272 291 283 286 286Hotell- och logiverksamhet/Hotels 98 98 96 91 95 99 101 100 100Restaurangv./Restaurants 86 93 95 94 92 90 93 99 99
Källa/Source : Statistikcentralen, Företagsregister, ÅSUB/Statistics Finland Register of Enterprises, ÅSUB
Bransch/Industry 2000 2002 2003 2004 2005 2006 2007 2008 2009 2010 2011
Totalt 393 412 440 455 492 510 520 551 514 582 635Handel med motorfordon/
Car Sales 55 51 55 56 61 64 64 33 27 29 33
Partihandel/Wholesale trade 156 170 189 197 227 235 230 273 245 291 298
Detaljhandel/Retail trade 149 158 162 167 168 173 188 201 197 218 253
Hotell- och restaurang/
Hotels and restaurants 32 33 34 34 35 37 38 43 45 43 51
Not/Note: 2010 års siffror är reviderade/The figures for 2010 are revised
Källa/Source : ÅSUB, Momsregistret/Statistics Åland, VAT-register
Bransch/Industry 2000 2002 2003 2004 2005 2006 2007 2008 2009 2010
Totalt 68,6 67,3 76,5 80,9 85,5 96,8 99,1 83,6 94,0 100,7Handel med motorfordon/Car Sales 7,3 7,8 7,0 6,1 6,9 7,2 7,9 6,0 3,7 7,6Partihandel/Wholesale trade 18,3 16,5 26,2 33,9 36,1 44,7 41,2 29,0 39,3 38,5Detaljhandel/Retail trade 27,6 28,5 29,3 26,5 26,3 27,2 31,5 30,1 31,3 34,8Hotell- och restaurang/Hotels and restaurants 15,3 14,5 13,9 14,5 16,2 17,8 18,6 18,5 19,7 19,7
Källa/Source : ÅSUB, Nationalräkenskaper/Statistics Åland, National Accounts

Tillverkningsindustri, handel, finans och försäkring
104 Statistisk årsbok för Åland – Statistical Yearbook of Åland 2012
5.9. Utrikeshandel efter varuslag 2010-2011, 1 000 EUR 5.9. Imports and exports by commodity group 2010-2011, 1 000 EUR
5.10. Utrikeshandel efter näringsgren 2010-2011, 1 000 EUR 5.10. Imports and exports by industry 2010-2011, 1 000 EUR
Varuslag/Commodity group 2010 2011 2010 2011
Totalt 222 777 267 741 53 514 72 069Levande djur, animaliska produkter/Live animals, products of animal origin 33 422 39 819 4 302 4 813Vegetabiliska produkter/Vegetable products 7 660 10 031 352 1 094Beredda livsmedel, drycker, sprit, tobak/Edib le prepar., beverages, liquors, tobacco 29 694 30 992 511 2 797Mineraliska produkter/Mineral products 12 501 16 235 362 192Prod. av kemiska ind. etc/Prod. fr. chem. ind. 8 834 9 423 6 846 6 518Plast- o. gummivaror/Art. of plastics and rubber 13 677 17 670 17 872 21 902Lädervaror/Articles of leather 400 483 3 0Trä, varor av trä, kork/Wood, art. of wood, cork 3 037 3 489 8 958 7 429Massa av ved,papper,pappersvaror/Pulp,paper 20 742 23 802 884 584Textilvaror/Textile articles 21 668 33 443 1 128 3 027Skor, käppar, piskor, hattar/Shoes, canes, whips, hats 436 763 11 91Varor av sten, gips, cement etc./Articles of stone, plaster, cement etc 3 316 3 575 65 45Smycken, ädelsten/Jewellery, precious stones 1 643 1 319 26 39Oädla metaller, varor av dessa/Base metals 5 069 6 182 2 066 3 839Maskiner, apparater, redskap/Machinery, equipment, appliances 38 098 45 537 2 824 1 858Fordon, fartyg, transportutrustning etc./Vehicles, ships, transport equipment 6 362 3 854 789 431Optiska instrument etc./Optical appliances 4 209 5 899 4 830 4 373Vapen och ammunition/Arms and ammunition 44 43 25 42Diverse varor/Miscellaneous articles 11 823 15 156 1 595 1 873Konstverk, antikviteter/Works of art, antiques 142 23 63 999Okänt (leverans till fartyg)/Unknown (delivery to vessels) - 2 - 10 125
Not/Note : Tabellen gäller handel med varor, inte tjänster. Gäller ej handeln med Finland. Siffrorna är inte jämförbara med
tidigare år/Trade with goods, not services. Trade with Finland excluded. The figures are not comparable with previously
published figures.
Källa/Source : ÅSUB Handel/Statistics Åland, Trade
Import/Imports Export/Exports
Näringsgren/Industry2010 2011 2010 2011 2010 2011
Totalt 222 777 267 741 53 514 72 069 -169 264 -195 673A Jordbruk,skogsbruk och fiske/Agriculture,
forestry and fishing 6 050 6 287 .. .. .. ..B-C Tillverkning, utvinning av mineral/Manufacturing
mining and quarrying .. .. 46 469 51 445 .. ..D-E El, gas, värme och vatten, avlopp och avfall/
Energy and water supply, sewerage and waste management .. .. .. .. .. ..
F Byggverksamhet/Construction 10 616 10 657 .. 902 .. -9 755G Handel, rep. av motorfordon och motorcyklar/
Wholesale and retail trade; repair of motor veh. 90 737 114 987 2 484 .. -88 254 ..H Transp. och magasinering/Transp. and storage 3 761 .. .. .. .. ..I Hotell- och restaurangverks./Accomodation
and food service activities 686 1 736 - .. -686 ..J Informations- och kommunikationsverksamhet/
Information and communication 1 447 1 339 .. .. .. ..K Finans- och försäkringsverksamhet/Financial
and insurance activities .. 339 .. .. .. ..L Fastighetsverksamhet/Real estate activities .. 283 - - .. -283M-S Övriga tjänster/Other services .. .. .. .. .. ..
Övriga aktörer/Other 42 431 44 086 815 1 121 -41 616 -42 964
Not/Note : Uppgifterna är ej jämförbara med tidigare publicerade uppgifter. Tabellen gäller handel med varor, inte tjänster.Gäller ej handeln med Finland/The figures are not comparable with previously published figures. Trade with goods, notservices. Trade with Finland excluded.
Källa/Source : ÅSUB Handel/Statistics Åland, Trade
Handelsnetto/Import/Imports Export/Exports Trade balance
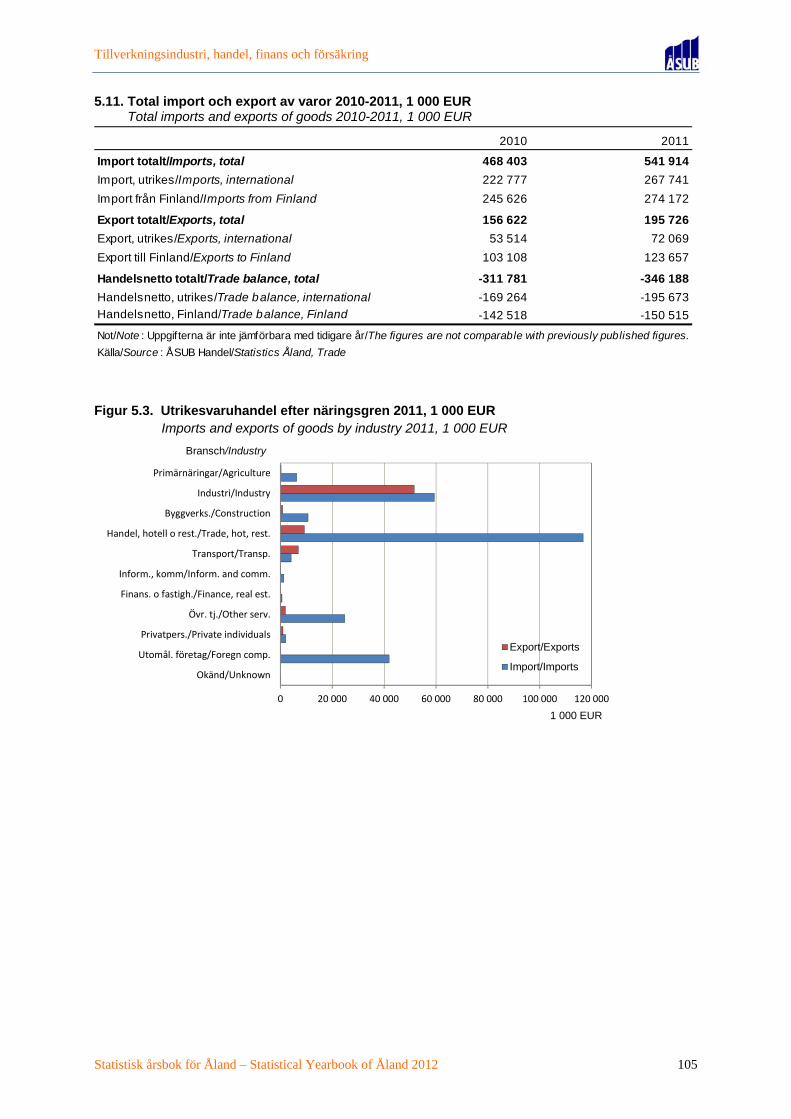
Tillverkningsindustri, handel, finans och försäkring
Statistisk årsbok för Åland – Statistical Yearbook of Åland 2012 105
5.11. Total import och export av varor 2010-2011, 1 000 EUR 5.11. Total imports and exports of goods 2010-2011, 1 000 EUR
Figur 5.3. Utrikesvaruhandel efter näringsgren 2011, 1 000 EUR Figure 5.3. Imports and exports of goods by industry 2011, 1 000 EUR
2010 2011
Import totalt/Imports, total 468 403 541 914
Import, utrikes/Imports, international 222 777 267 741
Import från Finland/Imports from Finland 245 626 274 172
Export totalt/Exports, total 156 622 195 726
Export, utrikes/Exports, international 53 514 72 069
Export till Finland/Exports to Finland 103 108 123 657
Handelsnetto totalt/Trade balance, total -311 781 -346 188
Handelsnetto, utrikes/Trade balance, international -169 264 -195 673
Handelsnetto, Finland/Trade balance, Finland -142 518 -150 515
Not/Note : Uppgifterna är inte jämförbara med tidigare år/The figures are not comparable with previously published figures.
Källa/Source : ÅSUB Handel/Statistics Åland, Trade
0 20 000 40 000 60 000 80 000 100 000 120 000
Okänd/Unknown
Utomål. företag/Foregn comp.
Privatpers./Private individuals
Övr. tj./Other serv.
Finans. o fastigh./Finance, real est.
Inform., komm/Inform. and comm.
Transport/Transp.
Handel, hotell o rest./Trade, hot, rest.
Byggverks./Construction
Industri/Industry
Primärnäringar/Agriculture
1 000 EUR
Bransch/Industry
Export/Exports
Import/Imports

Tillverkningsindustri, handel, finans och försäkring
106 Statistisk årsbok för Åland – Statistical Yearbook of Åland 2012
5.12. Bankväsendet 2005-2011, ekonomiska uppgifter, kontor och personal 5.12. Financial system 2005-2011, economic information, offices and employees
5.13. Kreditgivning efter kredittagar- och kreditgivarsektor 2000-2008. Kreditbestånd vid årets slut, MEUR 5.13. Loans by sector of borrower and lender 2000-2008. Credit stock at year-end, MEUR
2005 2007 2008 2009 2010 2011
Ränteintäkter/Interest income 28,4 43,2 56,6 40,0 .. 35,3
Räntekostnader/Interest expenses 20,4 30,4 55,1 13,2 .. 28,1
Löner och arvoden till personalen/
Wages and salaries 9,2 10,0 12,4 13,0 .. ..
Provisionsintäkter/Commission income 8,7 10,3 10,8 10,1 9,7 12,1
Balansräkning/Balance sheet 640,9 1 024,6 1 281,2 1 143,6 1 222,2 1 464,1
Skulder till allmänheten och offentliga samfund
(inhemska)/Liab ilities to the public and public
sector entities 665,6 1 000,3 1 374,6 1 165,9 1 215,8 1 166,0
Fordringar på allmänheten och offentliga samfund
(inhemska)/Claims on the public and public sector entities 709,1 1 043,4 1 291,7 1 329,7 1 367,2 1 130,4
Antal kontor/Number of offices 29 28 26 26 28 30
Personal, personer/Number of employees 247 276 262 304 296 291
Not/Note : Gäller bankkontoren på Åland/Concerns bank offices on Åland
Källa/Source : Statistikcentralen, Finansiering och försäkring /Statistics Finland Financing and insurance
Kredittagarsektor/Sector of borrowerKreditgivarsektor/Sector of lender 2000 2001 2002 2003 2004 2005 2006 2007 2008
Totalt 751 746 737 807 969 1 046 1 011 1 204 1 374
Kredittagarsektor/Sector of borrower
Företag och bostadsbolag/
Companies and housing corp. 385 371 332 346 441 427 384 523 643
Offentliga sektorn/Public sector 7 6 8 18 39 46 49 47 45
Icke-vinstsyftande organisation/
Non-profit institutions 19 1 1 1 2 2 2 3 5
Hushåll/Households 271 300 328 369 415 499 504 556 609
Näringsidkarhushåll/Own-
account workers 38 38 39 40 43 47 43 50 56
Löntagarhushåll/Employees 214 245 269 306 346 420 428 469 513
Övriga hushåll/Other households 19 17 20 23 26 32 33 37 40
Ofördelat/Unspecified 68 68 68 73 74 72 74 75 72
Kreditgivarsektor/Sector of lender
Finans.företag/Financial institutions 650 648 654 716 872 954 918 1 089 1 256
Förs.bolag och socialskyddsfonder/
Insurance corporations and social
security funds 32 30 13 18 23 21 20 41 44
Landskapet Åland/Government
of Åland 68 68 68 73 74 72 74 75 72
Av krediterna: bostadslån/Of the
credit stock: Housing loans 216 249 267 314 355 396 432 468 518
Källa/Source : Statistikcentralen, Finansiering och försäkring, Ålands landskapsregering/Statistics Finland Financing and in-surance, Government of Åland
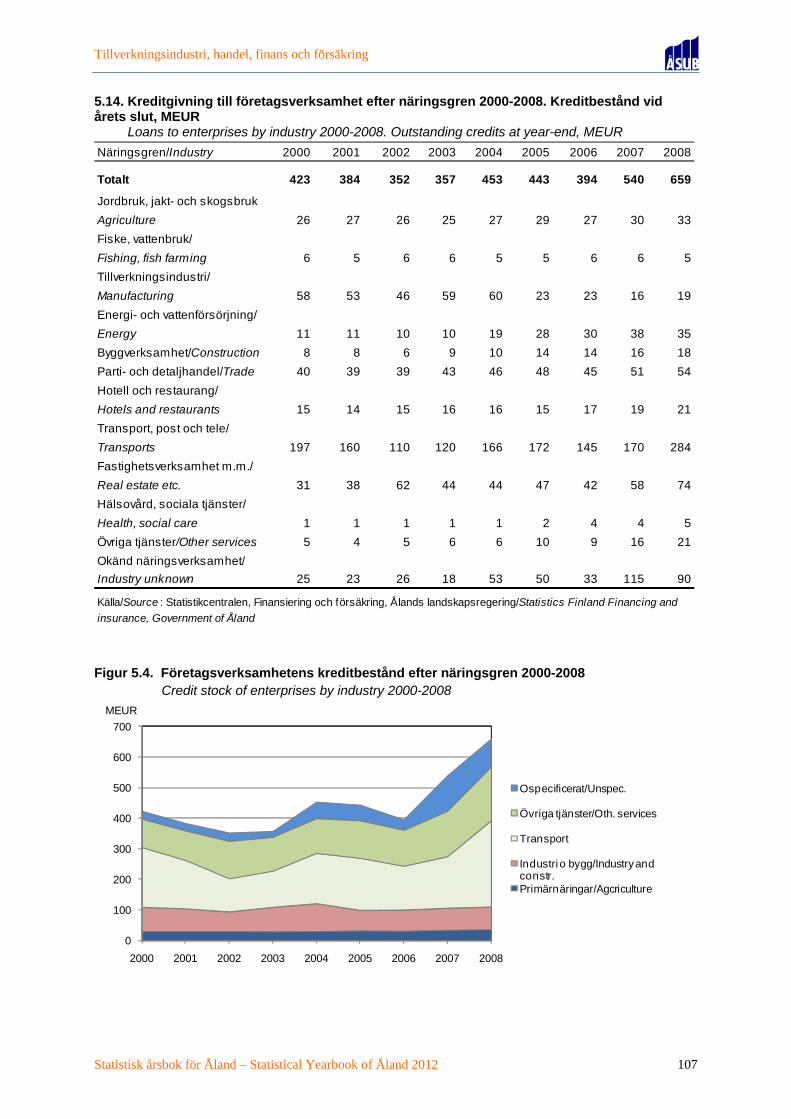
Tillverkningsindustri, handel, finans och försäkring
Statistisk årsbok för Åland – Statistical Yearbook of Åland 2012 107
5.14. Kreditgivning till företagsverksamhet efter näringsgren 2000-2008. Kreditbestånd vid årets slut, MEUR 5.14. Loans to enterprises by industry 2000-2008. Outstanding credits at year-end, MEUR
Figur 5.4. Företagsverksamhetens kreditbestånd efter näringsgren 2000-2008 Figure 5.4. Credit stock of enterprises by industry 2000-2008
Näringsgren/Industry 2000 2001 2002 2003 2004 2005 2006 2007 2008
Totalt 423 384 352 357 453 443 394 540 659
Jordbruk, jakt- och skogsbruk
Agriculture 26 27 26 25 27 29 27 30 33
Fiske, vattenbruk/
Fishing, fish farming 6 5 6 6 5 5 6 6 5
Tillverkningsindustri/
Manufacturing 58 53 46 59 60 23 23 16 19
Energi- och vattenförsörjning/
Energy 11 11 10 10 19 28 30 38 35
Byggverksamhet/Construction 8 8 6 9 10 14 14 16 18
Parti- och detaljhandel/Trade 40 39 39 43 46 48 45 51 54
Hotell och restaurang/
Hotels and restaurants 15 14 15 16 16 15 17 19 21
Transport, post och tele/
Transports 197 160 110 120 166 172 145 170 284
Fastighetsverksamhet m.m./
Real estate etc. 31 38 62 44 44 47 42 58 74
Hälsovård, sociala tjänster/
Health, social care 1 1 1 1 1 2 4 4 5
Övriga tjänster/Other services 5 4 5 6 6 10 9 16 21
Okänd näringsverksamhet/
Industry unknown 25 23 26 18 53 50 33 115 90
Källa/Source : Statistikcentralen, Finansiering och försäkring, Ålands landskapsregering/Statistics Finland Financing and
insurance, Government of Åland
0
100
200
300
400
500
600
700
2000 2001 2002 2003 2004 2005 2006 2007 2008
MEUR
Ospecificerat/Unspec.
Övriga tjänster/Oth. services
Transport
Industri o bygg/Industry and constr.Primärnäringar/Agcriculture


6
6. Sjöfart och turism 6. Shipping and tourism
0
50 000
100 000
150 000
200 000
250 000
Hotell/Hotels Gästhem/Guesthouses
Stugor/Cottages Camping
Antal
Övernattningar efter inkvarteringstyp och gästernas hemland 2011
Nights spent in accommodation by type of accommodation and home country of guests 2011
Övriga/Other Sverige/Sweden Finland

Sjöfart och turism Kapitlet om sjöfart och turism omfattar uppgifter om den åländska handelsflottan, hamnar och farleder, inresande, övernattningar samt företag inom turistbranschen. Objekt för statistiken är antal fartyg och deras kapacitet, antal anställda, antal inresande och övernattande samt antal företag. Uppgifterna gäller hela Åland. En utförligare beskrivning av statistikområdena inklusive definitioner av variabler finns på ÅSUBs webbplats www.asub.ax under Statistik efter ämne/Sjöfart respektive Turism. Källorna anges under varje tabell. Tillförlitligheten är hög i och med att sjöfartsstatistiken baseras på uppgifter från Sjöfartsverkets fartygsregister samt från rederibranschens organsationer och turiststatistiken på totaluppgifter från aktörerna i branschen. En begränsning är att inkvarteringsstatistiken inte omfattar anläggningar med mindre än fyra rum eller stugor. Jämförbarheten över tiden är god. ÅSUB publicerar en detaljerad turiststatistik, bl.a. en större årlig statistikrapport som kan beställas från ÅSUB och som även finns tillgänglig på ÅSUBs webbplats. Där finns också månatliga statistikmeddelanden liksom sjöfarts- och turiststatistik i form av Excel- och PC-Axis-tabeller. Ansvarig för sjöfartsstatistiken på ÅSUB är Iris Åkerberg, [email protected] och för turiststatistiken Christina Lindström, [email protected]
Shipping and tourism The chapter on shipping and tourism includes data on the merchant fleet of Åland, ports and waterways, arrived guests and nights spent as well as accommodation establishments. More statistics on these subject areas are available at the website of Statistics Åland, www.asub.ax, in Excel-tables and PC-Axis-databases in English. Contact persons are Iris Åkerberg, [email protected] (shipping) and Christina Lindström, [email protected] (tourism)

Sjöfart och turism
Statistisk årsbok för Åland – Statistical Yearbook of Åland 2012 111
6.1. Den åländska handelsflottan 1975-2011 6.1. The merchant fleet of Åland 1975-2011
Figur 6.1. Fartyg efter bruttodräktighet 2000-2011 Figure 6.1. Vessels by gross ton 2000-2011
År/ Antal fartyg/ BT/ Dwt/ Bruttofrakter/ Löner/Year Number of Gross freight Wages
vessels GT Net ton MEUR MEUR1975 76 626 490 1 023 900 74,7 23,51980 68 608 949 926 594 187,6 46,81985 36 415 581 563 156 314,9 80,81990 12 210 250 44 465 339,2 80,11995 18 271 628 68 787 386,2 109,32000 29 413 185 138 930 581,3 122,92005 35 438 552 150 406 553,2 129,62010 34 495 785 173 516 .. ..2011 34 495 785 173 516 .. ..
Not/Note : T.o.m. 1999 ingår endast fartyg som hör till Ålands Redarförening r.f., därefter även fartyg som hör till Frakt-fartygsföreningen. Ålands Redarförening r f och Fraktfartygsföreningen har från 2008 uppgått i Rederierna i Finland/Upto year 2000, only vessels of the Åland Shipowners' Association included, as of year 2000 also vessels of the CargoshipAssociation included. 2008 were the Åland Shipowners and the Cargoship Association merged to Finnish Shipowners'Association.
Källa/Source : Rederierna i Finland, Trafiksäkerhetsverket/The Finnish Shipowners' Association, Finnish Transport SafetyAgency
0
100 000
200 000
300 000
400 000
500 000
600 000
2000 2002 2004 2006 2008 2010
BT/GT

Sjöfart och turism
112 Statistisk årsbok för Åland – Statistical Yearbook of Åland 2012
6.2. Den åländska handelsflottan, passagerarfartyg 1975-2011 6.2. The merchant fleet of Åland, passenger vessels 1975-2011
Figur 6.2. Passagerar- och lastfartyg efter bruttoregisterton 2000-2011 Figure 6.2. Passenger and cargo ships by gross ton 2000-2011
År/Year Antal BT/ % av flottan/ Dwt/ % av flottan/GT % of fleet Net ton % of fleet
1975 14 50 075 8,0 11 631 1,11980 13 102 943 16,9 23 028 2,51985 11 114 700 27,6 21 328 3,81990 8 192 472 91,5 21 921 49,31995 9 211 185 77,7 23 237 33,82000 10 262 598 63,6 27 233 19,62005 11 263 286 60,0 29 260 19,52010 7 282 651 57,0 26 424 ..2011 7 282 651 57,0 26 424 ..
Not/Note : Andelarna är reviderade/The per cent is revised
Källa/Source : Rederierna i Finland, Trafiksäkerhetsverket/The Finnish Shipowners' Association, Finnish Transport Safety Agency
0
50 000
100 000
150 000
200 000
250 000
300 000
350 000
400 000
450 000
500 000
550 000
600 000
2000 2001 2002 2003 2004 2005 2006 2007 2008 2009 2010 2011
BT/GT
År/YearLastfartyg/Cargo ships Passagerarfartyg/Passenger ships

Sjöfart och turism
Statistisk årsbok för Åland – Statistical Yearbook of Åland 2012 113
6.3. Den åländska handelsflottan 1986-2011. Tonnage under åländsk och finländsk flagg samt tonnage under annan flagg (inkl. charter) 6.3. The merchant fleet of Åland 1986-2011. Fleet under the flags of Åland and Finland and fleet under other flags (time-charter incl.)
6.4. Åldersfördelning av det åländska tonnaget 2011 6.4. The fleet of Åland by age 2011
År/Year Åländsk och finländsk BT/ Fartyg under BT 1)/
flagg/Åland and Finnish utländsk flagg 1)/
flag GT Foreign flag 1) GT 1)
1986 29 184 344 27 655 110
1990 23 226 500 29 735 000
1995 30 310 871 14 670 424
2000 30 414 730 11 449 000
2005 35 438 552 17 478 524
2010 34 495 785 .. ..2011 34 495 785 .. ..1) Siffrorna fr.o.m. 1990 för de utf laggade fartygen är inte jämförbara med tidigare år eftersom vissa rederier inte längreär med i statistiken/The data for fleet under foreign flag from 1990 are not comparable with those from earlier years, assome shipping companies are not included in the figures from 1990.
Källa/Source : Ålands Redarförening, Rederierna i Finland, Trafiksäkerhetsverket/The Åland Shipowners' Association, The Finnish Shipowners' Association, Finnish Transport Safety Agency
Ålder/Age Antal fartyg/Ships BT/GT Procent
Totalt 34 495 785 100,0
-4 år/years 2 31 172 6,3
5-9 år/years - - -
10-14 år/years 8 74 177 15,0
15-19 år/years 5 129 410 26,1
20-24 år/years 8 124 995 25,2
25+ år/years 11 136 031 27,4
Källa/Source : Trafiksäkerhetsverket/Finnish Transport Safety Agency

Sjöfart och turism
114 Statistisk årsbok för Åland – Statistical Yearbook of Åland 2012
6.5. Ombordanställda på fartyg efter kön 1980-2007 6.5. Employees on ships by sex 1980-2007
6.6. Ombordanställda efter befattning 1990-2007 6.6. Employees on ships by rank 1990-2007
År/ Kvinnor/ Män/ Därav på passagerarfartyg/Year Females Males Employees on passengerships
Totalt Antal Procent Antal Procent Antal Procent Antal % av hela flottan% of the whole fleet
1980 3 476 1 000 28,8 2 476 71,2 1 145 32,9 1 860 53,51981 3 570 1 200 33,6 2 370 66,4 960 26,9 2 013 56,41982 3 237 1 250 38,6 1 987 61,4 920 28,4 1 987 61,41983 3 067 1 170 38,1 1 897 61,9 955 31,1 1 873 61,11984 3 346 1 360 40,6 1 986 59,4 900 26,9 2 272 67,91985 3 152 1 350 42,8 1 802 57,2 800 25,4 2 447 77,61986 2 697 1 035 38,4 1 662 61,6 600 22,2 2 316 85,91987 2 980 1 400 47,0 1 580 53,0 700 23,5 2 745 92,11988 3 005 1 200 39,9 1 805 60,1 750 25,0 2 850 94,81989 3 216 1 335 41,5 1 881 58,5 680 21,1 3 061 95,21990 2 742 1 380 50,3 1 362 49,7 580 21,2 2 640 96,31991 2 850 1 500 52,6 1 350 47,4 600 21,1 2 700 94,71992 3 125 1 500 48,0 1 625 52,0 700 22,4 2 995 95,81993 3 000 1 500 50,0 1 500 50,0 700 23,3 2 900 96,71994 3 000 1 400 46,7 1 600 53,3 800 26,7 2 900 96,71995 2 800 1 300 46,4 1 500 53,6 750 26,8 2 600 92,91996 2 750 1 250 45,5 1 500 54,5 750 27,3 2 550 92,71997 2 700 1 200 44,4 1 500 55,6 770 28,5 2 500 92,61998 2 800 1 250 44,6 1 550 55,4 800 28,6 2 600 92,91999 2 870 1 250 43,6 1 620 56,4 845 29,4 2 645 92,22000 2 860 1 220 42,7 1 640 57,3 835 29,2 2 635 92,12001 2 840 1 220 43,0 1 620 57,0 835 29,4 2 618 92,22002 3 050 1 200 39,3 1 850 60,7 867 28,4 2 620 85,92003 2 949 1 104 37,4 1 845 62,6 899 30,5 2 535 86,02004 3 106 1 046 33,7 2 060 66,3 756 24,3 2 340 75,32005 3 136 1 207 38,5 1 929 61,5 685 21,8 2 644 84,32006 2 820 1 107 39,3 1 713 60,7 724 25,7 2 400 85,12007 2 750 1 122 40,8 1 628 59,2 744 27,1 2 350 85,5
Not/Note : T.o.m. 2001 ingår endast fartyg som hör till Ålands Redarförening r.f., därefter även fartyg som hör till Fraktfartygs-föreningen r.f ./Up to year 2002, only vessels of the Åland Shipowners' Association included, as of year 2002 also vessels of the Cargoship Association included.
Källa/Source : Ålands Redarförening, Fraktfartygsföreningen/The Åland Shipowners' Association, The Cargoship Association
Därav ålänningar/Of which Ålanders
Befattning/Rank 1990 1995 2000 2004 2005 2006 2007
Totalt 2 742 2 800 2 860 3 106 3 136 2 820 2 750
Befälhavare/Captains 29 40 41 66 71 64 60
Styrmän/
Navigating officers 94 105 132 185 193 170 163
Maskinmästare/Engineers 99 120 146 197 198 194 190
Telegrafister/Radio men 5 - - - - - -
Ekonomipersonal/Services 2 168 2 120 2 052 2 084 2 097 1 924 1 895
Däcksmanskap/Sailors 197 265 304 372 366 303 269Maskinmanskap/Machinists 150 150 185 202 211 165 173
Not/Note : T.o.m. 2001 ingår endast fartyg som hör till Ålands Redarförening r.f., därefter även fartyg som hör till Fraktfartygs-föreningen r.f ./Up to year 2002, only vessels of the Åland Shipowners' Association included, as of year 2002 also vessels ofthe Cargoship Association included.
Källa/Source : Ålands Redarförening, Fraktfartygsföreningen/The Åland Shipowners' Association, The Cargoship Association

Sjöfart och turism
Statistisk årsbok för Åland – Statistical Yearbook of Åland 2012 115
6.7. Ankommande fartyg efter hamn, antal och nettodräktighet 2008-2011 6.7. Vessels arriving by destination, number and net tonnage 2008-2011
6.8. Farleder 31.12.2005 och 2011, km 6.8. Waterways 31.12.2005 and 2011, km
Figur 6.3. Till Åland anlända resenärer 1958-2011 Figure 6.3. Travellers arrived 1958-2011
Hamn/
Destination Antal Netto- Antal Netto- Antal Netto- Antal Netto-
dräktighet 1) dräktighet 1) dräktighet 1) dräktighet 1)
1 000 ton 1 000 ton 1 000 ton 1 000 ton
Summa 8 135 160 437 8 141 168 397 8 088 168 787 7 981 169 282
Mariehamn 5 407 117 445 5 416 122 836 5 364 123 671 5 267 122 890
Eckerö 962 3 567 973 3 608 973 3 608 934 3 463
Långnäs 1 766 39 425 1 752 41 954 1 751 41 508 1 780 42 9291) Net tonnage.
Källa/Source : Mariehamns hamn, Eckerölinjen, Långnäs hamn/The Port of Mariehamn, Eckerölinjen, The Port of Långnäs
2011201020092008
År/Year
Totalt -3,9 4,0-7,9 8,0
2005 1 319 501 616 202
2011 1 316 494 633 189
Källa/Source : Trafikverket/Finnish Transport Agency
Djupgående/Draught, m
0
500 000
1 000 000
1 500 000
2 000 000
2 500 000
1958 1962 1966 1970 1974 1978 1982 1986 1990 1994 1998 2002 2006 2010
Antal
År/Year

Sjöfart och turism
116 Statistisk årsbok för Åland – Statistical Yearbook of Åland 2012
6.9. Till Åland anlända resenärer efter transportmedel och land 2009-2011 6.9. Travellers arrived by type of transport and country 2009-2011
6.10. Till Åland anlända fordon efter fordonstyp och land 2005-2011 6.10. Arrived vehicles by type of vehicle and country 2005-2011
Land/Country Förändring i %/Change in %
Transportmedel/Type of transport 2009 2010 2011 2009-2010 2009-2011
Totalt 2 285 017 2 173 485 2 192 381 -4,9 0,9
Från Sverige/From Sweden 1 943 420 1 828 370 1 845 575 -5,9 0,9
Kryssningsresenärer/On
cruise liners 997 252 941 290 924 016 -5,6 -1,8
Övriga/Other travellers 946 168 887 080 921 559 -6,2 3,9
Från Finland/From Finland 332 510 334 772 336 848 0,7 0,6
Landskapets färjor/Archipelago
ferries 58 943 55 533 57 715 -5,8 3,9
Övriga/Others 273 567 279 239 279 133 2,1 0,0
Från övriga länder/Other countries 9 087 10 343 9 958 13,8 -3,7
Källa/Source : ÅSUB Turiststatistik/Statistics Åland, Tourism Statistics
Land/Country
Fordon/Vehicle 2005 2008 2009 2010 2011
Totalt 214 562 218 501 226 615 222 571 218 989
Bilar/Cars 184 090 187 046 196 405 193 049 188 938
Lastbilar, långtradare/Lorries, trucks 4 376 4 806 5 325 5 398 5 572
Bussar/Buses 2 486 2 652 2 686 2 960 3 315
Från Sverige/From Sweden 156 770 159 106 166 425 162 304 156 701
Bilar/Cars 151 809 153 666 160 338 155 729 150 162
Lastbilar, långtradare/Lorries, trucks 2 940 3 198 3 761 4 050 4 182
Bussar/Buses 2 021 2 242 2 326 2 525 2 357
Från Finland/From Finland 1) 57 005 57 495 58 650 58 059 60 203
Bilar/Cars 31 558 31 718 34 584 35 221 36 786
Lastbilar, långtradare/Lorries, trucks 1 377 1 383 1 516 1 253 1 329
Bussar/Buses 460 397 351 421 924
Från övriga länder/Other countries 787 1 900 1 540 2 208 2 085
Bilar/Cars 723 1 662 1 483 2 099 1 990
Lastbilar, långtradare/Lorries, trucks 59 225 48 95 61
Bussar/Buses 5 13 9 14 341)Anlända fordon med skärgårdsfärjorna ingår endast i totalsumman. Uppgifterna för linjen Nådendal-Långnäs saknas/Vehiclesarrived on the archipelago ferries are included only in the total figures. Data for the route Nådendal-Långnäs are not included.
Källa/Source : Respektive rederi/Each shipowner respectively

Sjöfart och turism
Statistisk årsbok för Åland – Statistical Yearbook of Åland 2012 117
6.11. Anlända gäster och övernattningar i inkvarteringsanläggningar efter hemland 2011 6.11. Guests arrived and nights spent in accommodation by home country 2011
Figur 6.4. Antal övernattningar på hotell efter gästernas hemland 1995-2011 Figure 6.4. Nights spent at hotels by home country of guests 1995-2011
Not/Note: Hotellanläggningarna utökades 2011/In 2011, the number of hotels increased
Hemland/ Anlända/ Övernattningar/Nights Övernattn. per gäst/
Home country Arrived Antal Procent Nights per guest
Totalt 211 784 458 838 100,0 2,2Norden tot. Nordic countries 192 825 407 348 88,8 2,1Åland Åland Islands 229 429 0,1 1,9Finland Finland 91 877 174 385 38,0 1,9Sverige Sweden 96 577 223 603 48,7 2,3Norge Norway 2 003 4 772 1,0 2,4Danmark Denmark 2 017 3 929 0,9 1,9Färöarna Faroe Islands 24 39 0,0 1,6Grönland Greenland 8 18 0,0 2,3Island Iceland 90 173 0,0 1,9Tyskland Germany 4 202 13 579 3,0 3,2Estland Estonia 4 670 7 983 1,7 1,7Ryssland Russia 2 379 6 818 1,5 2,9Lettland Latvia 1 176 4 906 1,1 4,2Polen Poland 567 2 542 0,6 4,5Schweiz Switzerland 732 2 067 0,5 2,8Nederländerna Netherlands 631 1 596 0,3 2,5Litauen Lithuania 754 1 494 0,3 2,0Tjeckien Czech Republic 272 1 425 0,3 5,2Storbritannien Great Britain 557 1 389 0,3 2,5Övriga Europa Rest of Europe 627 1 524 0,3 2,4USA, Kanada USA, Canada 515 1 145 0,2 2,2Övriga världen Rest of world 612 1 671 0,4 2,7Okänt Unkonwn 62 126 0,0 2,0
Not/Note : Gästhem, pensionat och stugbyar om minst 5 rum resp. stugor/Hotels, guest houses and holiday villageswith more than 4 rooms or cottages.
Källa/Source : ÅSUB Turiststatistik/Statistics Åland, Tourism Statistics
0
50 000
100 000
150 000
200 000
250 000
1995 1996 1997 1998 1999 2000 2001 2002 2003 2004 2005 2006 2007 2008 2009 2010 2011
Antal
År/YearÖvriga/Other Sverige/Sweden Finland

Sjöfart och turism
118 Statistisk årsbok för Åland – Statistical Yearbook of Åland 2012
6.12. Anlända gäster och övernattningar efter land och typ av inkvarteringsanläggning 2011 6.12. Guests arrived and nights spent in accommodation by country and type of accommodation 2011
6.13. Båtplatser och båtnätter i de åländska gästhamnarna efter region 1995-2011 6.13. Capacity of and nights spent in marinas of Åland by region 1995-2011
6.14. Antal företag i turistbranschen 2003-2011 6.14. Number of accommodation establishments 2003-2011
Hemland/ Förändring av ÖvernattningarHome country övern./Change per anländ gäst/
Antal Procent Antal Procent 2010-2011, % Nights per guest
Totalt 211 784 100,0 458 838 100,0 7,0 2,2Åland/Åland Islands 229 0,1 429 0,1 -13,5 1,9Finland 91 877 43,4 174 385 38,0 0,8 1,9Sverige/Sweden 96 577 45,6 223 603 48,7 11,0 2,3Övriga länder/Other 23 101 10,9 60 421 13,2 13,5 2,6Hotell/Hotels 117 030 100,0 200 997 100,0 2,5 1,7Åland/Åland Islands - - - - - ..Finland 56 019 47,9 88 337 43,9 -3,4 1,6Sverige/Sweden 53 204 45,5 97 275 48,4 7,6 1,8Övriga länder/Other 7 807 6,7 15 385 7,7 17,3 2,0Gästhem/Guest houses 24 320 100,0 46 837 100,0 12,0 1,9Åland/Åland Islands 61 0,3 175 0,4 133,3 2,9Finland 10 556 43,4 21 168 45,2 16,2 2,0Sverige/Sweden 11 051 45,4 20 935 44,7 1,9 1,9Övriga länder/Other 2 652 10,9 4 559 9,7 56,2 1,7Stugbyar/Cottages 32 790 100,0 125 157 100,0 11,0 3,8Åland/Åland Islands 153 0,5 230 0,2 -37,2 1,5Finland 11 608 35,4 41 655 33,3 5,4 3,6Sverige/Sweden 15 333 46,8 57 933 46,3 14,5 3,8Övriga länder/Other 5 696 17,4 25 339 20,2 12,8 4,4Camping 37 644 100,0 85 847 100,0 8,5 2,3Åland/Åland Islands 15 0,0 24 0,0 -56,4 1,6Finland 13 694 36,4 23 225 27,1 -2,6 1,7Sverige/Sweden 16 989 45,1 47 460 55,3 17,0 2,8Övriga länder/Other 6 946 18,5 15 138 17,6 2,9 2,2
Not/Note : Gästhem, pensionat och stugbyar om minst fem rum resp. stugor/Hotels, guest houses and holiday villages withmore than four rooms or cottages.
Källa/Source : ÅSUB Turiststatistik/Statistics Åland, Tourism Statistics
Anlända gäster/ Övernattningar/Guests arrived Guestnights
Region 1995 2000 2005 2008 2009 2010 2011
TotaltAntal hamnar/Marinas 20 20 17 19 19 20 21
Båtplatser/Capacity 1 494 1 396 1 212 1 212 1 292 1 317 1 252
Båtnätter/Nights spent 25 032 30 165 28 247 28 990 29 722 30 324 30 071Fasta Åland/Mainland Åland
Antal hamnar/Marinas 8 11 7 9 9 9 9
Båtplatser/Capacity 757 806 696 736 814 819 736
Båtnätter/Nights spent 15 629 19 876 19 435 20 283 20 816 21 319 21 054SkärgårdenAntal hamnar/Marinas 12 9 10 10 10 11 12
Båtplatser/Capacity 737 590 516 476 478 498 516
Båtnätter/Nights spent 9 403 10 289 8 812 8 707 8 906 9 005 9 017
Källa/Source : ÅSUB Turiststatistik/Statistics Åland, Tourism Statistics
Företag/Company 2003 2004 2005 2006 2007 2008 2009 2010 2011Campingplatser/Camping sites 15 15 14 13 14 14 12 13 14Hotell, gästhem,pensionat/Hotels, guest houses etc. 36 36 33 35 35 35 34 34 33Stugbyar/Holiday villages 61 57 57 58 65 64 62 55 63
Not/Note : Gästhem, pensionat och stugbyar om minst 5 rum resp. stugor/Hotels, guest houses and holiday villages withmore than four rooms or cottages.Källa/Source : ÅSUB Turiststatistik/Statistics Åland, Tourism Statistics

7
7. Transport och kommunikationer 7. Transport and communications
0
5 000
10 000
15 000
20 000
25 000
1962 1966 1970 1974 1978 1982 1986 1990 1994 1998 2002 2006 2010
Antal
Fordonsbeståndets utveckling 1962-2011 Development of vehicle stock 1962-2011
Personbilar/Cars Övriga motorfordon/Other vehicles

Transport och kommunikationer Statistiken över transport och kommunikationer omfattar vägtrafiken, skärgårdsfärjorna, flygtrafiken samt postverksamheten. Objekt för statistiken är antal fordon, personer, olyckor och försändelser samt väglängd i kilometer. Statistiken i detta kapitel redovisas i huvudsak för hela Åland men i viss mån även för kommuner och regioner. En utförligare beskrivning av statistiken på området inklusive definitioner av variabler finns på ÅSUBs webbplats www.asub.ax under Statistik efter ämne/Transport och kommunikationer. Källorna anges under varje tabell. Tillförlitligheten är hög i och med att statistiken baseras på registerdata och på totaluppgifter från branschens aktörer. Jämförbarheten över tiden är i allmänhet god. ÅSUB publicerar statistik över området på webbplatsen i form av Excel- och PC-Axis-tabeller. En rapport med uppföljning av trafikolyckor finns också tillgänglig där. Ansvarig för transport- och kommunikationsstatistiken på ÅSUB är Iris Åkerberg, [email protected].
Transport and communications The statistics on transport and communications include road traffic (vehicles, driving licences, accidents, bus traffic and roads), archipelago ferry service, air traffic and postal services. More statistics on these subject areas are available at the website of Statistics Åland, www.asub.ax, in Excel-tables and PC-Axis-databases in English. Contact person is Iris Åkerberg, [email protected]

Transport och kommunikationer
Statistisk årsbok för Åland – Statistical Yearbook of Åland 2012 121
7.1. Antal registrerade fordon efter innehavarens hemkommun 31.12.2011 7.1. Number of registered vehicles by residence of the owner 31.12.2011
Figur 7.1. Personbilar per 1 000 invånare efter kommun 31.12.2011 Figure 7.1. Cars per 1 000 inhabitants by municipality 31.12.2011
Kommun Person-Person- Paket- Last- Bilar Motor- Mope- Trak- Släp- bilar/
bilar/ bilar/ bilar/ Bussar/ totalt/ cyklar/ der/ torer/ vagnar/ 1 000 inv.Cars, Cars/
Cars Vans Lorries Buses total MC:s Mopeds Tractors Trailers 1 000 inh.Brändö 300 89 14 - 403 30 55 135 120 625Eckerö 763 182 34 8 987 59 62 191 282 780Finström 1 933 379 24 2 2 338 171 178 453 674 765Föglö 379 111 18 - 508 27 36 154 163 657Geta 346 114 9 - 469 26 35 142 134 703Hammarland 1 151 252 49 - 1 452 84 101 313 442 754Jomala 2 586 564 106 1 3 257 234 234 525 954 609Kumlinge 234 59 11 - 304 12 38 118 103 648Kökar 148 49 9 1 207 11 40 73 53 594Lemland 1 149 229 19 - 1 397 79 116 224 460 618Lumparland 294 53 9 - 356 23 45 118 136 737Saltvik 1 353 290 48 5 1 696 95 110 400 471 748Sottunga 73 21 5 - 99 4 9 51 29 709Sund 814 180 23 5 1 022 80 83 243 283 789Vårdö 309 75 7 3 394 28 32 121 136 688
Mariehamn 7 931 1 239 281 12 9 463 482 541 395 2 498 704
Övriga1) 398 183 32 4 617 35 61 38 215 ..
Landskomm. 11 832 2 647 385 25 14 889 963 1 174 3 261 4 440 692-Landsbygden 10 389 2 243 321 21 12 974 851 964 2 609 3 836 699-Skärgården 1 443 404 64 4 1 915 112 210 652 604 650
Åland 20 161 4 069 698 41 24 969 1 480 1 776 3 694 7 153 7111)Fordon som är registrerade på Åland, trots att innehavaren bor på annan ort/Vehicles registered in Åland, but owner livingelsewhere.
Källa/Source : LR, Motorfordonsbyrån/The Government of Åland, The Office of Motor Vehicles
0 100 200 300 400 500 600 700 800 900
Brändö
Eckerö
Finström
Föglö
Geta
Hammarland
Jomala
Kumlinge
Kökar
Lemland
Lumparland
Saltvik
Sottunga
Sund
Vårdö
Mariehamn
Antal

Transport och kommunikationer
122 Statistisk årsbok för Åland – Statistical Yearbook of Åland 2012
7.2. Registrerade nya fordon 1995-2011 7.2. Registered new vehicles 1995-2011
7.3. Fördelning av bilar och traktorer efter första bruksår 2011 7.3. Distribution of cars and tractors by first year of use 2011
År/ Person- Paket- Last- Motor- Trak- Mope-Year Totalt bilar/ bilar/ bilar/ Bussar/ cyklar/ torer/ Släp/ der/
Cars Vans Lorries Buses MC:s Tractors Trailers Mopeds
1995 386 255 23 9 - 1 27 71 ..
1996 498 333 42 8 2 2 25 86 ..
1997 685 456 62 12 - 7 47 101 ..
1998 1 022 645 107 15 3 15 42 195 ..
1999 1 145 703 128 9 3 30 47 225 ..
2000 1 123 640 97 13 4 24 47 263 35
2001 907 482 79 10 1 16 60 215 44
2002 924 453 83 15 - 11 28 245 89
2003 1 152 615 84 10 3 19 41 271 109
2004 1 144 518 99 11 1 12 35 332 136
2005 1 181 509 83 15 3 24 55 305 187
2006 1 101 501 73 13 - 15 26 289 184
2007 1 006 405 81 8 1 26 36 297 152
2008 1 076 547 79 7 4 20 27 286 106
2009 777 348 41 1 - 13 20 274 80
2010 893 429 61 8 2 11 27 267 882011 1 060 521 73 15 3 22 35 315 76
Källa/Source : LR, Motorfordonsbyrån/The Government of Åland, The Office of Motor Vehicles
År/ Bilar tot/ Person- Paket- Last- Motor-Year Cars, bilar/ bilar/ bilar/ Bussar/ cyklar/ Mopeder/ Traktorer/
total Cars Vans Lorries Buses MC:s Mopeds Tractors
Totalt 24 969 20 161 4 069 698 41 1 480 1 776 3 694
-1997 11 468 9 008 2 106 341 13 818 390 3 1171998 1 302 1 073 192 37 - 60 36 531999 1 552 1 286 229 35 2 72 29 552000 1 358 1 103 215 39 1 73 35 432001 1 062 865 168 28 1 58 39 542002 994 797 159 37 1 49 96 312003 1 170 976 166 24 4 37 106 552004 1 057 863 166 26 2 39 141 382005 995 815 150 28 2 54 171 522006 891 739 118 34 - 44 168 262007 731 590 120 20 1 62 170 342008 752 641 95 11 5 43 126 32
2009 456 401 44 8 3 33 100 29
2010 555 473 67 12 3 15 90 322011 626 531 74 18 3 23 79 43
Källa/Source: LR, Motorfordonsbyrån/The Government of Åland, The Office of Motor Vehicles

Transport och kommunikationer
Statistisk årsbok för Åland – Statistical Yearbook of Åland 2012 123
7.4. Fordonsbeståndets utveckling 1962-2011 7.4. Development of vehicle stock 1962-2011
År/ Person- Paket- Last- Special- Motor- Mopeder/ Trak- Motor- Släp-Year Totalt bilar/ bilar/ bilar/ bilar/Bussar/ cyklar/ torer/ redskap/ vagnar/
Special Motor-Cars Vans Lorries vehicles Buses MC:s Mopeds Tractors machines Trailers
1962 4 542 1 992 265 298 26 30 587 .. 1 314 4 261963 5 000 2 320 279 295 36 26 588 .. 1 422 6 281964 5 553 2 777 287 285 39 27 613 .. 1 480 11 341965 5 627 3 123 314 281 43 24 270 .. 1 514 23 351966 5 989 3 348 340 286 43 24 278 .. 1 590 36 441967 6 392 3 625 388 302 52 23 242 .. 1 662 43 551968 6 518 3 830 357 311 38 20 156 .. 1 693 42 711969 7 144 4 297 395 330 56 20 172 .. 1 717 51 1061970 7 719 4 750 487 314 53 23 207 .. 1 710 50 1251971 8 012 4 902 576 300 44 22 225 .. 1 735 53 1551972 8 683 5 410 600 305 46 24 252 .. 1 791 60 1951973 9 192 5 852 636 296 46 26 245 .. 1 802 67 2221974 9 587 6 119 655 305 46 27 249 .. 1 861 73 2521975 10 133 6 449 708 309 46 30 221 .. 1 974 76 3201976 10 407 6 591 743 301 45 28 218 .. 2 004 82 3951977 10 809 6 814 792 302 40 28 213 .. 2 089 87 4441978 11 377 7 135 840 302 40 28 205 .. 2 157 92 5781979 11 965 7 553 888 309 48 29 165 .. 2 178 96 6991980 12 658 7 917 1 015 300 56 30 185 .. 2 253 100 8021981 13 376 8 302 1 110 306 52 32 217 .. 2 335 107 9151982 14 312 8 780 1 209 298 60 33 300 .. 2 445 115 1 0721983 15 226 9 235 1 329 302 66 34 356 .. 2 534 129 1 2411984 15 958 9 591 1 451 298 63 33 400 .. 2 609 130 1 3831985 16 610 9 967 1 511 293 67 35 422 .. 2 678 141 1 4961986 17 408 10 450 1 612 297 70 36 434 .. 2 733 148 1 6281987 18 451 11 091 1 757 317 84 37 437 .. 2 807 159 1 7621988 19 312 11 581 1 904 318 84 40 430 .. 2 859 175 1 9211989 20 365 12 076 2 128 321 94 38 438 .. 2 979 214 2 0771990 21 318 12 530 2 332 330 98 40 454 .. 3 062 236 2 2361991 21 879 12 754 2 451 317 97 38 477 .. 3 111 243 2 3911992 22 048 12 771 2 500 290 100 39 481 .. 3 110 254 2 5031993 22 057 12 672 2 536 284 102 37 483 .. 3 096 255 2 5921994 22 073 12 601 2 547 296 68 33 501 .. 3 095 255 2 6771995 22 377 12 783 2 581 325 24 32 517 .. 3 109 264 2 7421996 22 914 13 170 2 621 318 19 35 514 .. 3 120 273 2 8441997 22 724 12 807 2 570 337 15 35 517 .. 3 162 275 3 0061998 23 460 13 189 2 638 361 8 36 541 .. 3 197 295 3 1951999 24 236 13 525 2 720 388 8 38 577 .. 3 245 310 3 4252000 25 122 13 979 2 805 403 7 41 619 .. 3 277 320 3 6712001 25 944 14 360 2 863 424 7 39 672 .. 3 337 341 3 9012002 26 702 14 658 2 931 450 2 39 728 .. 3 354 351 4 1892003 27 704 15 194 2 968 463 2 40 777 .. 3 398 365 4 4972004 28 634 15 536 3 104 480 1 40 843 .. 3 409 390 4 8312005 29 529 15 868 3 175 501 1 43 936 .. 3 449 404 5 1522006 30 418 16 256 3 220 540 1 42 995 .. 3 469 414 5 4812007 33 082 16 800 3 335 577 .. 43 1 082 1 505 3 499 439 5 8022008 34 717 17 661 3 522 595 .. 46 1 162 1 580 3 539 453 6 1592009 36 192 18 373 3 683 629 .. 43 1 286 1 655 3 570 464 6 4892010 37 896 19 240 3 915 674 .. 43 1 373 1 740 3 637 483 6 7912011 39 574 20 161 4 069 698 .. 41 1 480 1 776 3 694 502 7 153
Not/Note: Sedan 2007 ingår mopeder i totalsumman/Since 2007 the total includes mopeds. Specialbilar ingår i sina respektivefordonsklasser/Special vehicles are included in their respective groups of vehicles.
Källa/Source: LR, Motorfordonsbyrån/The Government of Åland, The Office of Motor Vehicles
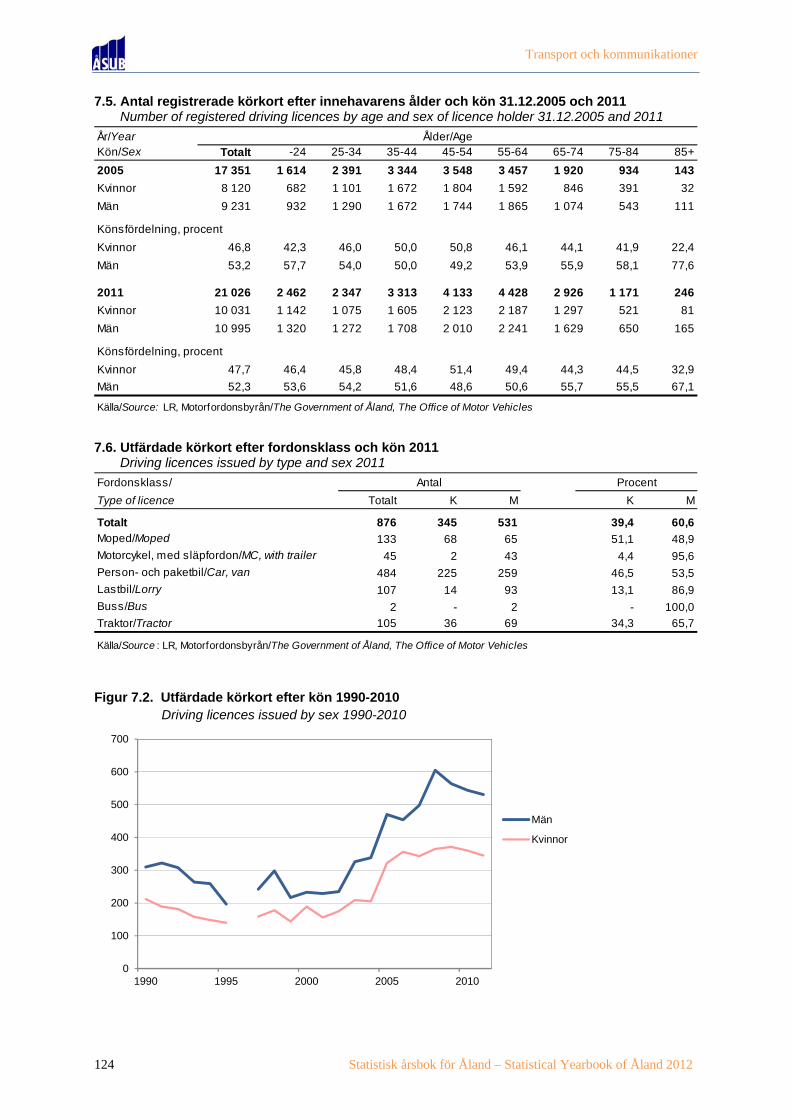
Transport och kommunikationer
124 Statistisk årsbok för Åland – Statistical Yearbook of Åland 2012
7.5. Antal registrerade körkort efter innehavarens ålder och kön 31.12.2005 och 2011 7.5. Number of registered driving licences by age and sex of licence holder 31.12.2005 and 2011
7.6. Utfärdade körkort efter fordonsklass och kön 2011 7.6. Driving licences issued by type and sex 2011
Figur 7.2. Utfärdade körkort efter kön 1990-2010 Figure 7.2. Driving licences issued by sex 1990-2010
År/YearKön/Sex Totalt -24 25-34 35-44 45-54 55-64 65-74 75-84 85+
2005 17 351 1 614 2 391 3 344 3 548 3 457 1 920 934 143
Kvinnor 8 120 682 1 101 1 672 1 804 1 592 846 391 32
Män 9 231 932 1 290 1 672 1 744 1 865 1 074 543 111
Könsfördelning, procent
Kvinnor 46,8 42,3 46,0 50,0 50,8 46,1 44,1 41,9 22,4
Män 53,2 57,7 54,0 50,0 49,2 53,9 55,9 58,1 77,6
2011 21 026 2 462 2 347 3 313 4 133 4 428 2 926 1 171 246
Kvinnor 10 031 1 142 1 075 1 605 2 123 2 187 1 297 521 81
Män 10 995 1 320 1 272 1 708 2 010 2 241 1 629 650 165
Könsfördelning, procent
Kvinnor 47,7 46,4 45,8 48,4 51,4 49,4 44,3 44,5 32,9
Män 52,3 53,6 54,2 51,6 48,6 50,6 55,7 55,5 67,1
Källa/Source: LR, Motorfordonsbyrån/The Government of Åland, The Office of Motor Vehicles
Ålder/Age
Fordonsklass/
Type of licence Totalt K M K M
Totalt 876 345 531 39,4 60,6Moped/Moped 133 68 65 51,1 48,9
Motorcykel, med släpfordon/MC, with trailer 45 2 43 4,4 95,6
Person- och paketbil/Car, van 484 225 259 46,5 53,5
Lastbil/Lorry 107 14 93 13,1 86,9
Buss/Bus 2 - 2 - 100,0
Traktor/Tractor 105 36 69 34,3 65,7
Källa/Source : LR, Motorfordonsbyrån/The Government of Åland, The Office of Motor Vehicles
Antal Procent
0
100
200
300
400
500
600
700
1990 1995 2000 2005 2010
Män
Kvinnor

Transport och kommunikationer
Statistisk årsbok för Åland – Statistical Yearbook of Åland 2012 125
7.7. Vägtrafikolyckor 2000-2011 7.7. Road traffic accidents 2000-2011
7.8. Dödade eller skadade personer i vägtrafikolyckor samt offrets trafikantgrupp 2000-2011 7.8. Persons killed or injured in road traffic accidents by group of road-users 2000-2011
Olyckor med endast
Dödlig utgång/ Personskada/ egendomsskada/
År/ Fatal Non-fatal injuries Property damage
Year Marie- Hela Marie- Hela Marie- Hela Marie- Hela
hamn Åland hamn Åland hamn Åland hamn Åland
2000 159 588 - 3 13 37 146 548
2001 170 582 - - 16 40 154 542
2002 145 570 - 1 11 35 134 534
2003 141 477 2 3 9 40 130 434
2004 112 447 - 2 6 21 106 424
2005 105 359 - 1 12 31 93 327
2006 92 317 - 2 12 41 80 274
2007 98 285 1 1 14 44 83 240
2008 85 222 2 5 15 24 68 193
2009 84 221 - 1 12 34 72 186
2010 78 203 - - 4 28 74 187
2011 81 207 - 1 14 30 67 176
Källa/Source : Statistikcentralen/Statistics Finland
Totalt
Offrets trafikantgrupp/Victim involved in accidentMotor-cykel, Fot-
År/ Dödade/ Skadade/ Förare/ Pass. moped/ Cykel/ gängare/Year Totalt Killed Injured Driver Pass. MC Bicycle Pedestrian2000 40 3 37 15 8 6 7 22001 40 - 40 21 7 4 3 22002 36 1 35 13 7 3 7 32003 43 3 40 12 15 6 1 42004 23 2 21 10 5 4 - 12005 32 1 31 10 2 7 5 32006 43 2 41 14 9 11 - 62007 45 1 44 14 6 17 1 22008 29 5 24 12 2 5 2 62009 35 1 34 13 10 9 1 12010 28 - 28 12 10 4 2 -2011 31 1 30 15 6 5 2 1
Källa/Source : Statistikcentralen/Statistics Finland
Personbil/Pass.car

Transport och kommunikationer
126 Statistisk årsbok för Åland – Statistical Yearbook of Åland 2012
7.9. Viltolyckor 1975-2011 7.9. Accidents caused by wild animals 1975-2011
7.10. Väghållningen, allmänna vägar och cykelleder 1985-2008, km 7.10. Public roads and bicycle roads 1985-2008, km
År/ Totalt Älg/Elk Rådjur/Roe deer Vitsvanshjort/
Year Whitetailed deer
1975 18 - 18 -
1980 72 3 69 -
1985 149 4 145 -
1990 206 2 204 -
1991 234 7 227 -
1992 230 8 222 -
1993 271 2 269 -
1994 238 4 234 -
1995 277 7 270 -
1996 276 4 272 -
1997 233 5 228 -
1998 244 8 236 -
1999 285 8 277 -
2000 297 11 286 -
2001 297 9 288 -
2002 339 9 329 1
2003 318 7 311 -
2004 279 4 275 -
2005 211 5 206 -
2006 246 6 239 1
2007 217 10 207 -
2008 215 6 208 1
2009 197 11 185 1
2010 186 9 177 -2011 146 8 138 -
Källa/Source : LR Skogbruksbyrån/The Government of Åland, Office of Forestry
Vägtyp/ 1985 1990 1995 2003 2004 2005 2006 2007 2008Type of road
Allmänna vägar/Public roads 886,0 895,9 908,0 912,0 912,4 914,5 914,4 916,6 918,1
Landsvägar/Main roads 420,4 425,4 424,6 426,0 425,6 424,0 424,0 425,1 425,8
Bygdevägar/Local roads 214,6 213,8 214,8 214,0 213,8 214,0 214,0 214,0 214,0
Kommunalvägar/Municipal roads 251,1 256,7 268,6 272,0 273,0 276,0 276,4 277,4 278,8
Ytbelagda/Paved roads 431,5 534,6 589,4 714,0 723,0 728,5 738,9 773,4 757,6
Landsvägar/Main roads 302,3 359,0 378,8 410,0 409,8 408,0 408,7 410,5 410,6
Bygdevägar/Local roads 72,2 87,6 102,9 144,0 147,5 153,8 158,0 184,5 165,8
Kommunalvägar/Municipal roads 57,0 88,0 107,7 160,0 165,7 166,7 172,2 178,4 181,2
Cykelleder, hela Åland/Bicycle routes 1) 347,0 350,0 350,0 354,0 356,5 360,1 367,2
Gång- o. cykelvägar, asfalterade, Mariehamn/ 30,0 25,0 25,0 25,0 25,0 25,0 25,0
Paved bicycle roads in Mariehamn 1)
Gång- och cykelvägar, landsbygden/ 13,0 15,6 16,2 23,0 25,5 29,1 36,2
Bicycle roads, rural district 1)
1) Ungefärliga uppgifter/Rough estimate.
Källa/Source : LR Trafikavdelningen/The Government of Åland, Department of Communications

Transport och kommunikationer
Statistisk årsbok för Åland – Statistical Yearbook of Åland 2012 127
7.11. Trafiken på skärgårdsfärjorna. Antal passagerare och fordon 2000-2011 7.11. Archipelago ferry service. Number of passengers and vehicles 2000-2011
7.12. Trafiken på skärgårdsfärjorna. Transporterade fordon efter fordonsslag 2011 7.12. Archipelago ferry service. Transported vehicles by type of vehicle 2011
Linje/Ferry line2000 2005 2010 2011 2000 2005 2010 2011
Totalt 1 048 933 1 056 539 1 067 460 1 073 487 525 070 559 538 572 639 586 528
Norra linjen 124 916 110 235 109 792 105 782 53 447 49 570 53 339 51 393
Södra linjen 107 632 121 621 115 212 115 621 44 091 42 221 41 099 40 930
Brändö-Osnäslinjen 121 669 95 086 77 966 83 256 43 791 37 858 34 299 33 274
Föglölinjen 181 718 185 025 184 997 199 455 93 967 102 055 105 093 112 187
Snäckö-Långnäs 17 343 22 958 21 848 21 669 8 250 12 907 13 183 13 131
Åva-Jurmo . 20 189 23 470 23 211 . 9 602 11 469 11 024
Asterholmalinjen 15 333 11 773 10 432 8 050 6 996 5 248 5 254 4 218
Enklinge-Kumlinge 7 890 9 850 12 369 14 491 3 882 5 216 6 834 8 218
Töftölinjen1) 316 179 320 787 359 645 356 862 177 185 198 935 209 823 221 156
Embarsundslinjen1) 61 922 68 384 58 430 2) 57 643 38 124 41 154 37 217 2) 38 022
Simskälalinjen1) 34 110 36 945 42 027 39 227 19 207 21 688 22 609 21 765
Seglingelinjen1) 33 802 31 665 30 549 25 938 19 019 18 552 18 428 15 879
Björkölinjen1) 16 196 13 743 11 477 11 742 10 644 9 035 7 837 8 305
Ängösundslinjen1)10 223 8 278 9 246 10 540 6 467 5 497 6 155 7 026
1)Vajerfärja/Cable ferry2)Föglötrafiken gick via Överö en del av året/Part of the year, the ferry traffic to Föglö went via Överö.
Källa/Source : LR, Ålandstrafiken/The Government of Åland, Ålandstrafiken
Personer/Passengers Fordon/Vehicles
Linje/ Totalt Personbil/ Lastbil/ Buss/ Traktor/ Övriga/ Efterlämn.Ferry line Cars Lorries Buses Tractors Others fordon/
Vehiclesleft behind
Totalt 586 528 492 308 27 304 4 473 5 573 56 870 491
Norra linjen 51 393 37 979 2 487 296 487 10 144 158
Södra linjen 40 930 30 073 2 350 112 639 7 756 55
Brändö-Osnäslinjen 33 274 23 505 2 247 475 239 6 808 81
Föglölinjen 112 187 99 037 6 015 36 290 6 809 158
Snäckö-Långnäs 13 131 9 177 1 122 10 169 2 653 23
Åva-Jurmo 11 024 8 651 377 2 122 1 872 16
Asterholmalinjen 4 218 3 067 232 1 242 676 -
Enklinge-Kumlinge 8 218 7 319 197 1 149 552 -
Töftölinjen1) 221 156 197 889 8 379 3 454 940 10 494 -
Embarsundslinjen1) 38 022 31 607 2 153 13 1 280 2 969 -
Simskälalinjen1) 21 765 18 105 710 56 175 2 719 -
Seglingelinjen1) 15 879 13 014 572 4 384 1 905 -
Björkölinjen1) 8 305 6 425 210 13 374 1 283 -
Ängösundslinjen1) 7 026 6 460 253 - 83 230 -1)Vajerfärja/Cable ferry
Källa/Source : LR, Ålandstrafiken/The Government of Åland, Ålandstrafiken
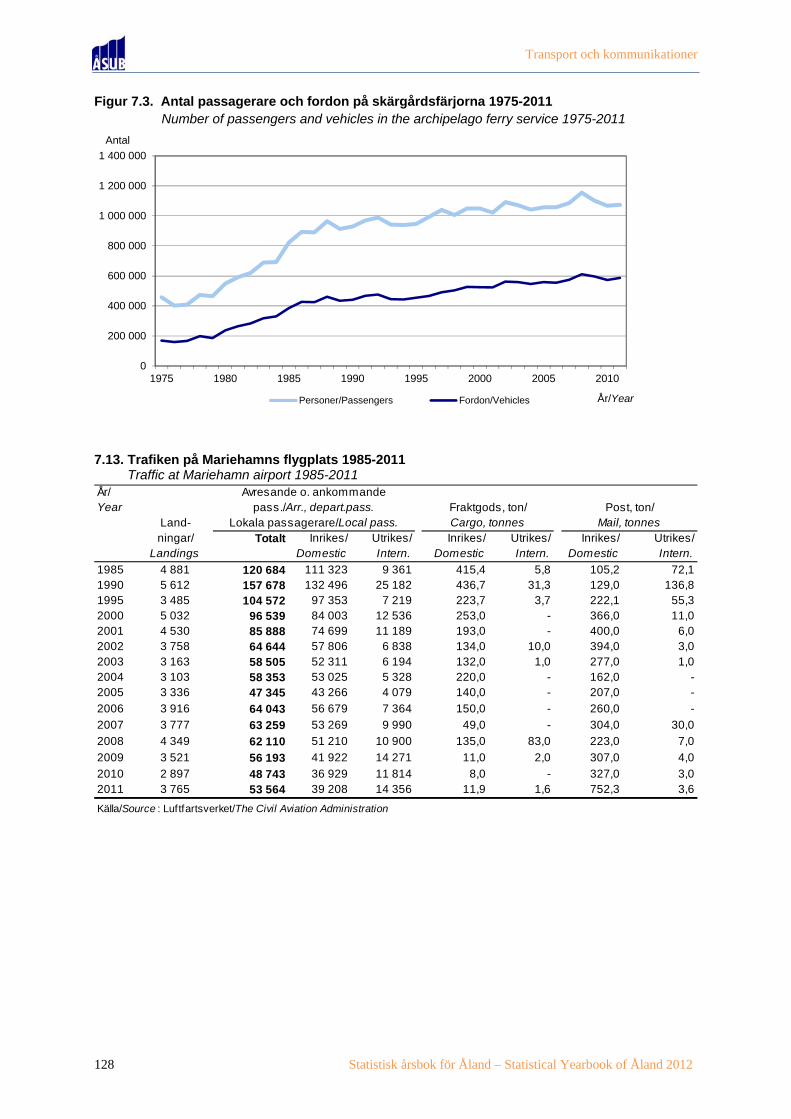
Transport och kommunikationer
128 Statistisk årsbok för Åland – Statistical Yearbook of Åland 2012
Figur 7.3. Antal passagerare och fordon på skärgårdsfärjorna 1975-2011 Figure 7.3. Number of passengers and vehicles in the archipelago ferry service 1975-2011
7.13. Trafiken på Mariehamns flygplats 1985-2011 7.13. Traffic at Mariehamn airport 1985-2011
0
200 000
400 000
600 000
800 000
1 000 000
1 200 000
1 400 000
1975 1980 1985 1990 1995 2000 2005 2010
Antal
År/YearPersoner/Passengers Fordon/Vehicles
År/Year
Land-ningar/ Totalt Inrikes/ Utrikes/ Inrikes/ Utrikes/ Inrikes/ Utrikes/
Landings Domestic Intern. Domestic Intern. Domestic Intern.
1985 4 881 120 684 111 323 9 361 415,4 5,8 105,2 72,11990 5 612 157 678 132 496 25 182 436,7 31,3 129,0 136,81995 3 485 104 572 97 353 7 219 223,7 3,7 222,1 55,32000 5 032 96 539 84 003 12 536 253,0 - 366,0 11,02001 4 530 85 888 74 699 11 189 193,0 - 400,0 6,02002 3 758 64 644 57 806 6 838 134,0 10,0 394,0 3,02003 3 163 58 505 52 311 6 194 132,0 1,0 277,0 1,02004 3 103 58 353 53 025 5 328 220,0 - 162,0 -2005 3 336 47 345 43 266 4 079 140,0 - 207,0 -
2006 3 916 64 043 56 679 7 364 150,0 - 260,0 -
2007 3 777 63 259 53 269 9 990 49,0 - 304,0 30,0
2008 4 349 62 110 51 210 10 900 135,0 83,0 223,0 7,0
2009 3 521 56 193 41 922 14 271 11,0 2,0 307,0 4,0
2010 2 897 48 743 36 929 11 814 8,0 - 327,0 3,02011 3 765 53 564 39 208 14 356 11,9 1,6 752,3 3,6
Källa/Source : Luftfartsverket/The Civil Aviation Administration
Post, ton/Mail, tonnes
Avresande o. ankommandepass./Arr., depart.pass.
Lokala passagerare/Local pass.Fraktgods, ton/Cargo, tonnes

Transport och kommunikationer
Statistisk årsbok för Åland – Statistical Yearbook of Åland 2012 129
7.14. Busslinjetrafiken på Åland, antal passagerare 2004-2011 7.14. Bus transports, number of passengers 2004-2011
7.15. Postförsändelser 2004-2011, 1 000 st 7.15. Postal consignments 2004-2011, 1 000 pcs
År/ Linje 1/ Linje 2/ Linje 3/ Linje 4/ Linje 5/ Linje 6/ Linje 7/Year Route 1 Route 2 Route 3 Route 4 Route 5 Route 6 Route 7
Marie- Marie- Marie- Marie- Marie- Marie- Marie-hamn- hamn- hamn- hamn- hamn- hamn- hamn-
Totalt Eckerö Geta Saltvik Vårdö Lumparland Finström Jomala
2004 307 560 104 017 34 501 23 334 62 088 65 501 18 119 ..
2005 306 428 114 377 35 772 22 869 58 685 59 705 15 020 ..
2006 318 647 129 064 34 277 30 520 51 894 60 027 12 865 ..
2007 294 617 113 932 36 323 31 417 53 287 49 967 9 691 ..
2008 323 977 98 857 43 448 28 241 67 904 70 174 12 666 2 687
2009 325 274 89 382 46 725 26 623 58 044 67 116 12 508 24 876
2010 312 975 97 072 41 101 28 742 49 962 65 791 7 006 23 301
2011 302 564 98 586 32 769 30 461 48 328 61 130 9 347 21 943
Källa/Source : Williams Buss och Sundqvists Buss/Bus companies respectively
År/ 2 klass/2nd classYear 1 kl brev/ Brev/ Julkort/ Massbrev/ Paket/
1st class Letters Christmas Bulk Parcelsletters Totalt cards letters
2004 1 963 2 675 2 258 227 190 73
2005 1 844 2 688 2 281 214 193 77
2006 1 802 2 445 2 069 197 179 54
2007 2 181 10 101 6 760 190 3 151 291
2008 2 217 13 912 11 028 173 2 711 680
2009 4 172 18 928 14 769 159 4 000 1 184
2010 7 014 22 383 17 817 113 4 453 1 093
2011 1 699 20 683 17 050 133 3 500 1 300
därav skickat inom Åland/of which sent within Åland
2004 903 1 400
2005 913 1 369
2006 927 1 253
2007 921 1 291
2008 905 1 240
2009 899 1 232
2010 789 1 100
2011 568 1 250
Not/Note : T o m 2008 ingår vykort i 1 kl brev. Före 2007 ingår inte postningar för storkunder inom tredjepartslogistik i brevantalet/Upto 2009 1st class letters include postcards. Before 2007, mailings for large customers in third party logistics are not included.
Källa/Source : Posten på Åland/The Åland Post

Transport och kommunikationer
130 Statistisk årsbok för Åland – Statistical Yearbook of Åland 2012

8
8. Arbetsmarknad 8. Labour market
0
2 000
4 000
6 000
8 000
10 000
12 000
14 000
16 000
1960 1970 1980 1990 2000 2009
Personer/Persons
Sysselsatt arbetskraft efter näringsgren 1960-2009Employed persons by industry 1960-2009
Övr tj.sekt./Other serv. Transp. Industri/Industry Primärnär./Agricult.

Arbetsmarknad Arbetsmarknadsstatistiken omfattar uppgifter om arbetskraften, sysselsatta och arbetslöshet. Objekt för statistiken är individerna. Uppgifterna presenteras i de flesta fall både som absoluta tal och i procent. Förutom för hela Åland redovisas en del av statistiken också efter kommun och region. Uppgifter efter näringsgren är centrala och därtill finns uppgifter om arbetsgivarsektor och yrkesställning. För de sysselsatta redovisas statistik över såväl bostadsorten som arbetsplatsens ort. En utförligare beskrivning av arbetsmarknadsstatistiken inklusive definitioner av variabler finns på ÅSUBs webbplats www.asub.ax under Statistik efter ämne/Arbetsmarknad. Källorna anges under varje tabell. Tillförlitligheten är hög i och med att statistiken baseras på registeruppgifter. Detta gör dock att statistiken om arbetskraft och sysselsättning kommer med relativt lång eftersläpning eftersom den kräver att olika register, bl.a. från skattemyndigheten, samkörs. Jämförbarheten är god såväl när det gäller jämförelser över tiden som med andra statistikområden, t.ex. befolkning. ÅSUB publicerar ett månatligt meddelande med arbetslöshetsstatistik och ett årligt meddelande med sysselsättningsstatistik vilka finns tillgängliga på ÅSUBs webbplats. Där finns också arbetsmarknadsstatistik i form av Excel- och PC-Axis-tabeller. Ansvarig för arbetsmarknadsstatistiken på ÅSUB är Jonas Karlsson, [email protected].
Labour market The chapter on the labour market includes data on the labour force, employed persons and unemployment. More statistics on this subject area are available at the website of Statistics Åland, www.asub.ax, in Excel-tables and PC-Axis-databases in English. Contact person is Jonas Karlsson, [email protected].

Arbetsmarknad
Statistisk årsbok för Åland – Statistical Yearbook of Åland 2012 133
8.1. Arbetskraft och befolkning utanför arbetskraften efter ålder och kön 2010 8.1. Labour force and persons not in labour force by age and sex 2010
Figur 8.1. Sysselsättningsgrad 1999-2010 Figure 8.1. Employment rate 1999-2010
Not/Note: Observera att y-axeln inte börjar vid noll/Note that the y-axis is not shown from zero
Ålder/Age Befolkning Arbetskraften/ Sysselsatta/ Arbetslösa/ Utanförtotalt/ arbetskraften/
Population, Labour force Employed Unemployed Not in total labour force
16-64 17 904 13 885 13 439 446 4 019
16-19 1 356 288 254 34 1 068
20-24 1 426 1 036 966 70 390
25-29 1 544 1 263 1 213 50 281
30-34 1 669 1 424 1 389 35 245
35-39 1 809 1 601 1 573 28 208
40-44 2 019 1 818 1 783 35 201
45-49 1 985 1 784 1 727 57 201
50-54 1 941 1 729 1 682 47 212
55-59 2 065 1 731 1 680 51 334
60-64 2 090 1 211 1 172 39 879
Kvinnor 8 896 7 070 6 850 220 1 826
Män 9 008 6 815 6 589 226 2 193
Procent
16-64 100,0 77,6 75,1 3,2 22,4
16-19 100,0 21,2 18,7 11,8 78,8
20-24 100,0 72,7 67,7 6,8 27,3
25-29 100,0 81,8 78,6 4,0 18,2
30-34 100,0 85,3 83,2 2,5 14,7
35-39 100,0 88,5 87,0 1,7 11,5
40-44 100,0 90,0 88,3 1,9 10,0
45-49 100,0 89,9 87,0 3,2 10,1
50-54 100,0 89,1 86,7 2,7 10,9
55-59 100,0 83,8 81,4 2,9 16,2
60-64 100,0 57,9 56,1 3,2 42,1
Kvinnor 100,0 79,5 77,0 3,1 20,5
Män 100,0 75,7 73,1 3,3 24,3
Källa/Source : Statistikcentralen, Befolkning/Statistics Finland, Population
70
71
72
73
74
75
76
77
78
79
80
1999 2000 2001 2002 2003 2004 2005 2006 2007 2008 2009 2010
Procent
Sysselsättningsgrad, kvinnor/Employment rate, females
Sysselsättningsgrad, män/Employment rate, men

Arbetsmarknad
134 Statistisk årsbok för Åland – Statistical Yearbook of Åland 2012
8.2. Sysselsatta efter näringsgren och kön 31.12.2009 8.2. Employed persons by industry and sex 31.12.2009
Näringsgren/Industry
Totalt K M K M
Totalt 13 687 6 947 6 740 50,8 49,2
A Jord- o. skogsbruk, fiske/Agriculture 587 169 418 28,8 71,2
B Utvinning av mineral/Mining and quarrying 12 - 12 - 100,0
C Tillverkning/Manufacturing 900 269 631 29,9 70,1
Livsmedelsindustri/Food industry 287 98 189 34,1 65,9
Gummi- o. plastindustri/Manufacture of plastic products 172 62 110 36,0 64,0
Övrig industri/Other industry 441 109 332 24,7 75,3
D Försörjning av el, gas, värme o kyla/Energy 80 10 70 12,5 87,5
E Vattenförsörj., avloppsren. o. avfallshant./Water supply 100 16 84 16,0 84,0
F Byggverksamhet/Construction 924 53 871 5,7 94,3
G Handel, rep. av motorfordon/Trade 1 318 608 710 46,1 53,9
H Transport o. magasinering/Transport and storage 1 878 574 1 304 30,6 69,4
Sjötransport/Sea transports 1 155 323 832 28,0 72,0
Övrig transport/Other transports 723 251 472 34,7 65,3
I Hotell- o restaurang/Hotels and restaurants 534 292 242 54,7 45,3
J Informations- o komm.verks./Inform. and comm. 505 174 331 34,5 65,5
K Finans o. förs.verks./Financial and insurance act. 446 296 150 66,4 33,6
L Fastighetsverks./Real estate activities 77 29 48 37,7 62,3
M Verks. inom juridik, ekon. teknik/Prof, scientific, techn. 441 213 228 48,3 51,7
N Uthyrning, fastigh.service, resetj./Adm.supp.serv.act. 328 136 192 41,5 58,5
O Offentlig förvaltning/Public administration 1 065 596 469 56,0 44,0
P Utbildning/Education 797 543 254 68,1 31,9
Q Vård, omsorg, sociala tj./Human health, soc.work act. 2 541 2 275 266 89,5 10,5
R Kultur, nöje o. fritid/Arts, entertainment, recreation 346 166 180 48,0 52,0
S Annan serviceverks./Other services activities 464 290 174 62,5 37,5
X Okänd näringsgren/Industry unknown 344 238 106 69,2 30,8
Not/Note : Ny näringsgrensindelning från 2008, varför branschvisa uppgifter inte längre är jämförbara med tidigare års uppgifter/According to the new industrial classification, the figures are not comparable with previously published figures. Källa/Source : Statistikcentralen, Befolkning/Statistics Finland, Population
Antal Procent

Arbetsmarknad
Statistisk årsbok för Åland – Statistical Yearbook of Åland 2012 135
8.3. Sysselsatta efter näringsgren och kön 1960-2009 8.3. Employed persons by industry and sex 1960-2009
Kön/Sex Jord- och Industri Byggnads- Handel Transp, post- Finansiering Samhälls-År/Year Totalt skogsbruk, verks./ hotell/ och tele, IT/ fastighet/ tjänster/ Okänd/
fiske/ Construc- Trade, Transport, Finance, PublicAgricult Industry tion hotels tele, IT real estate services Unknown
Antal sysselsatta/EmployedTotalt1960 9 353 3 800 766 689 751 1 748 113 1 388 981970 9 621 2 262 1 050 794 1 545 1 820 251 1 740 1591980 10 607 1 628 1 001 638 1 667 2 423 517 2 663 701990 12 407 1 401 1 311 845 1 833 2 234 993 3 094 6962000 12 932 807 1 287 787 1 715 2 410 1 012 4 440 474
2008 13 960 606 1 122 939 1 823 2 566 1 293 5 473 138
2009 13 687 587 1 092 924 1 852 2 383 1 292 5 213 344
Kvinnor1960 2 889 1 195 151 11 .. 147 .. 924 251970 3 452 653 293 12 951 324 170 1 009 401980 4 545 554 285 32 991 612 350 1 708 131990 5 953 534 443 50 948 713 630 2 194 4412000 6 354 276 393 48 859 743 506 3 232 297
2008 7 043 181 302 50 903 837 675 4 030 65
2009 6 947 169 295 53 900 748 674 3 870 238
Män1960 6 464 2 605 615 678 .. 1 601 .. 464 731970 6 169 1 609 757 782 594 1 496 81 731 1191980 6 062 1 074 716 606 676 1 811 167 955 571990 6 454 867 868 795 885 1 521 363 900 2552000 6 578 531 894 739 856 1 667 506 1 208 177
2008 6 917 425 820 889 920 1 729 618 1 443 73
2009 6 740 418 797 871 952 1 635 618 1 343 106
Procentuell fördelning/Per centTotalt1960 100,0 40,6 8,2 7,4 8,0 18,7 1,2 14,8 1,01970 100,0 23,5 10,9 8,3 16,1 18,9 2,6 18,1 1,71980 100,0 15,3 9,4 6,0 15,7 22,8 4,9 25,1 0,71990 100,0 11,3 10,6 6,8 14,8 18,0 8,0 24,9 5,62000 100,0 6,2 10,0 6,1 13,3 18,6 7,8 34,3 3,7
2008 100,0 4,3 8,0 6,7 13,1 18,4 9,3 39,2 1,0
2009 100,0 4,3 8,0 6,8 13,5 17,4 9,4 38,1 2,5Kvinnor1960 100,0 41,4 5,2 0,4 .. 5,1 .. 32,0 0,91970 100,0 18,9 8,5 0,3 27,5 9,4 4,9 29,2 1,21980 100,0 12,2 6,3 0,7 21,8 13,5 7,7 37,6 0,31990 100,0 9,0 7,4 0,8 15,9 12,0 10,6 36,9 7,42000 100,0 4,3 6,2 0,8 13,5 11,7 8,0 50,9 4,7
2008 100,0 2,6 4,3 0,7 12,8 11,9 9,6 57,2 0,9
2009 100,0 2,4 4,2 0,8 13,0 10,8 9,7 55,7 3,4
Män1960 100,0 40,3 9,5 10,5 .. 24,8 .. 7,2 1,11970 100,0 26,1 12,3 12,7 9,6 24,3 1,3 11,8 1,91980 100,0 17,7 11,8 10,0 11,2 29,9 2,8 15,8 0,91990 100,0 13,4 13,4 12,3 13,7 23,6 5,6 13,9 4,02000 100,0 8,1 13,6 11,2 13,0 25,3 7,7 18,4 2,7
2008 100,0 6,1 11,9 12,9 13,3 25,0 8,9 20,9 1,12009 100,0 6,2 11,8 12,9 14,1 24,3 9,2 19,9 1,6
Not/Note: På grund av att näringsgrensindelningen uppdaterades 2008 är inte de branschvisa uppgifterna helt jämförbara med tidi-
gare år/As the industrial classification was updated in 2008, the industrial data are not entirely comparable with previously pub-
lished figures.
Källa/Source : Statistikcentralen, Befolkning/Statistics Finland, Population

Arbetsmarknad
136 Statistisk årsbok för Åland – Statistical Yearbook of Åland 2012
8.4. Sysselsatta efter näringsgren och kommun 31.12.2009 8.4. Employed persons by industry and municipality 31.12.2009
Kommun Jord- o. In- Byggn./ Trans- Handel, IT o. Finans. Fastigh. Samh. Pers.Totalt skogs- dustri/ verks./ port/ hotell/ komm./ o. förs./ jur., ek./ tjänster/ tjänster/ Okänd/
bruk/ In- Con- Trans- Trade, Inf. Finance, Real est., Public Pers. Un-fiske/ dustry struct. port hotel and insur. prof. sc. services ser- known
Agricult. comm. techn. vices
Brändö 234 28 5 22 43 28 2 7 12 64 13 10Eckerö 430 33 21 56 73 55 9 7 17 132 14 13Finström 1 212 91 136 109 118 177 40 30 70 369 49 23Föglö 252 27 7 11 45 48 4 4 17 67 13 9Geta 212 31 24 15 27 25 8 4 10 50 11 7Hammarland 723 58 54 81 89 85 12 34 39 235 28 8Jomala 2 084 96 189 155 273 282 85 68 143 627 124 42Kumlinge 168 12 6 6 55 15 1 2 13 48 5 5Kökar 101 6 4 4 27 10 1 1 5 37 3 3Lemland 866 20 71 70 115 104 33 21 60 309 47 16Lumparland 180 14 9 6 26 12 13 7 9 71 6 7Saltvik 866 60 106 69 120 130 23 21 45 232 40 20Sottunga 61 13 4 3 10 3 4 2 2 17 1 2Sund 491 28 66 53 48 57 10 16 32 141 24 16Vårdö 191 39 9 15 26 18 1 5 3 55 10 10
Mariehamn 5 616 31 381 249 783 803 259 217 369 1 949 422 153
Landskomm. 8 071 556 711 675 1 095 1 049 246 229 477 2 454 388 191-Landsbygden 7 064 431 676 614 889 927 233 208 425 2 166 343 152-Skärgården 1 007 125 35 61 206 122 13 21 52 288 45 39
Åland 13 687 587 1 092 924 1 878 1 852 505 446 846 4 403 810 344
Procent
Brändö 100,0 12,0 2,1 9,4 18,4 12,0 0,9 3,0 5,1 27,4 5,6 4,3Eckerö 100,0 7,7 4,9 13,0 17,0 12,8 2,1 1,6 4,0 30,7 3,3 3,0Finström 100,0 7,5 11,2 9,0 9,7 14,6 3,3 2,5 5,8 30,4 4,0 1,9Föglö 100,0 10,7 2,8 4,4 17,9 19,0 1,6 1,6 6,7 26,6 5,2 3,6Geta 100,0 14,6 11,3 7,1 12,7 11,8 3,8 1,9 4,7 23,6 5,2 3,3Hammarland 100,0 8,0 7,5 11,2 12,3 11,8 1,7 4,7 5,4 32,5 3,9 1,1Jomala 100,0 4,6 9,1 7,4 13,1 13,5 4,1 3,3 6,9 30,1 6,0 2,0Kumlinge 100,0 7,1 3,6 3,6 32,7 8,9 0,6 1,2 7,7 28,6 3,0 3,0Kökar 100,0 5,9 4,0 4,0 26,7 9,9 1,0 1,0 5,0 36,6 3,0 3,0Lemland 100,0 2,3 8,2 8,1 13,3 12,0 3,8 2,4 6,9 35,7 5,4 1,8Lumparland 100,0 7,8 5,0 3,3 14,4 6,7 7,2 3,9 5,0 39,4 3,3 3,9Saltvik 100,0 6,9 12,2 8,0 13,9 15,0 2,7 2,4 5,2 26,8 4,6 2,3Sottunga 100,0 21,3 6,6 4,9 16,4 4,9 6,6 3,3 3,3 27,9 1,6 3,3Sund 100,0 5,7 13,4 10,8 9,8 11,6 2,0 3,3 6,5 28,7 4,9 3,3Vårdö 100,0 20,4 4,7 7,9 13,6 9,4 0,5 2,6 1,6 28,8 5,2 5,2
Mariehamn 100,0 0,6 6,8 4,4 13,9 14,3 4,6 3,9 6,6 34,7 7,5 2,7
Landskomm. 100,0 6,9 8,8 8,4 13,6 13,0 3,0 2,8 5,9 30,4 4,8 2,4-Landsbygden 100,0 6,1 9,6 8,7 12,6 13,1 3,3 2,9 6,0 30,7 4,9 2,2-Skärgården 100,0 12,4 3,5 6,1 20,5 12,1 1,3 2,1 5,2 28,6 4,5 3,9
Åland 100,0 4,3 8,0 6,8 13,7 13,5 3,7 3,3 6,2 32,2 5,9 2,5
Not/Note : Ny näringsgrensindelning från 2008, varför branschvisa uppgifter inte längre är jämförbara med tidigare års uppgifter/According to the new industrial classification, the figures are not comparable with previously published figures.
Källa/Source : Statistikcentralen, Befolkning/Statistics Finland, Population

Arbetsmarknad
Statistisk årsbok för Åland – Statistical Yearbook of Åland 2012 137
8.5. Arbetsplatser efter näringsgren och kommun 31.12.2009 8.5. Jobs by industry and municipality 31.12.2009
Kommun Jord- o. In- Byggn.- Trans- Handel, IT o. Finans. Fastigh. Samh. Pers.Totalt skogs- dustri/ verks./ port/ hotell/ komm./ o. förs./ jur., ek./ tjänster/ tjänster/Okänd/
bruk/ In- Con- Trans- Trade, Inf. Finance, Real est Public Pers. Un-fiske/ dustry struct. port hotel and insur. prof. sc.services ser- known
Agricult. comm. techn. vices
Brändö 154 28 1 20 15 20 2 7 6 35 10 10Eckerö 240 33 2 34 35 30 1 2 6 76 8 13Finström 1 020 90 154 79 18 140 1 13 57 428 17 23Föglö 184 29 2 8 12 50 1 4 12 49 8 9Geta 111 30 3 12 2 24 1 1 5 25 1 7Hammarland 302 51 13 47 21 30 1 2 25 91 13 8Jomala 1 855 110 210 231 333 270 33 4 77 350 195 42Kumlinge 79 10 - 4 9 10 - 2 6 30 3 5Kökar 69 5 1 2 7 7 - 1 1 39 3 3Lemland 274 15 4 41 4 24 - 2 22 114 32 16Lumparland 90 19 4 4 14 15 - 1 4 21 1 7Saltvik 419 52 127 42 6 49 1 2 17 79 24 20Sottunga 35 15 - 2 1 4 - 2 - 10 - 1Sund 203 33 14 20 3 10 2 - 10 66 29 16Vårdö 117 40 1 12 4 8 1 2 1 35 3 10
Mariehamn 10 154 22 548 359 2 987 1 167 453 421 585 3 005 453 154
Landskomm. 5 152 560 536 558 484 691 44 45 249 1 448 347 190-Landsbygden 4 514 433 531 510 436 592 40 27 223 1 250 320 152-Skärgården 638 127 5 48 48 99 4 18 26 198 27 38
Åland 15 306 582 1 084 917 3 471 1 858 497 466 834 4 453 800 344
Procent
Brändö 100,0 18,2 0,6 13,0 9,7 13,0 1,3 4,5 3,9 22,7 6,5 6,5Eckerö 100,0 13,8 0,8 14,2 14,6 12,5 0,4 0,8 2,5 31,7 3,3 5,4Finström 100,0 8,8 15,1 7,7 1,8 13,7 0,1 1,3 5,6 42,0 1,7 2,3Föglö 100,0 15,8 1,1 4,3 6,5 27,2 0,5 2,2 6,5 26,6 4,3 4,9Geta 100,0 27,0 2,7 10,8 1,8 21,6 0,9 0,9 4,5 22,5 0,9 6,3Hammarland 100,0 16,9 4,3 15,6 7,0 9,9 0,3 0,7 8,3 30,1 4,3 2,6Jomala 100,0 5,9 11,3 12,5 18,0 14,6 1,8 0,2 4,2 18,9 10,5 2,3Kumlinge 100,0 12,7 - 5,1 11,4 12,7 - 2,5 7,6 38,0 3,8 6,3Kökar 100,0 7,2 1,4 2,9 10,1 10,1 - 1,4 1,4 56,5 4,3 4,3Lemland 100,0 5,5 1,5 15,0 1,5 8,8 - 0,7 8,0 41,6 11,7 5,8Lumparland 100,0 21,1 4,4 4,4 15,6 16,7 - 1,1 4,4 23,3 1,1 7,8Saltvik 100,0 12,4 30,3 10,0 1,4 11,7 0,2 0,5 4,1 18,9 5,7 4,8Sottunga 100,0 42,9 - 5,7 2,9 11,4 - 5,7 - 28,6 - 2,9Sund 100,0 16,3 6,9 9,9 1,5 4,9 1,0 - 4,9 32,5 14,3 7,9Vårdö 100,0 34,2 0,9 10,3 3,4 6,8 0,9 1,7 0,9 29,9 2,6 8,5
Mariehamn 100,0 0,2 5,4 3,5 29,4 11,5 4,5 4,1 5,8 29,6 4,5 1,5
Landskomm. 100,0 10,9 10,4 10,8 9,4 13,4 0,9 0,9 4,8 28,1 6,7 3,7-Landsbygden 100,0 9,6 11,8 11,3 9,7 13,1 0,9 0,6 4,9 27,7 7,1 3,4-Skärgården 100,0 19,9 0,8 7,5 7,5 15,5 0,6 2,8 4,1 31,0 4,2 6,0
Åland 100,0 3,8 7,1 6,0 22,7 12,1 3,2 3,0 5,4 29,1 5,2 2,2
Not/Note : Ny näringsgrensindelning från 2008, varför branschvisa uppgifter inte längre är jämförbara med tidigare års uppgifter. Upp-gifterna i tabellen omfattar de personer som arbetar inom området. I tabellen ingår arbetsplatserna på alla åländska fartyg/Accordingto the new industrial classification, the figures are not comparable with previously published figures. The figures include thepeople working in the area. Jobs on Åland ships are included.
Källa/Source : Statistikcentralen, Befolkning/Statistics Finland, Population

Arbetsmarknad
138 Statistisk årsbok för Åland – Statistical Yearbook of Åland 2012
8.6. Sysselsatt arbetskraft och arbetande i kommunen 31.12.2009, pendling 8.6. Employed and at work in municipality 31.12.2009, commuting
Figur 8.2. Sysselsatta efter näringsgren och kön 31.12.2009, procent Figure 8.2. Employed persons by industry and sex 31.12.2009, per cent
Kommun Arbets-
platsför-
Totalt Totalt sörjning/
Job supply
Antal Procent Antal Procent Antal Procent ProcentBrändö 234 140 59,8 94 40,2 154 14 9,1 65,8Eckerö 430 188 43,7 242 56,3 240 52 21,7 55,8Finström 1 212 440 36,3 772 63,7 1 020 580 56,9 84,2Föglö 252 152 60,3 100 39,7 184 32 17,4 73,0Geta 212 80 37,7 132 62,3 111 31 27,9 52,4Hammarland 723 206 28,5 517 71,5 302 96 31,8 41,8Jomala 2 084 650 31,2 1 434 68,8 1 855 1 205 65,0 89,0Kumlinge 168 75 44,6 93 55,4 79 4 5,1 47,0Kökar 101 55 54,5 46 45,5 69 14 20,3 68,3Lemland 866 179 20,7 687 79,3 274 95 34,7 31,6Lumparland 180 48 26,7 132 73,3 90 42 46,7 50,0Saltvik 866 245 28,3 621 71,7 419 174 41,5 48,4Sottunga 61 30 49,2 31 50,8 35 5 14,3 57,4Sund 491 132 26,9 359 73,1 203 71 35,0 41,3Vårdö 191 100 52,4 91 47,6 117 17 14,5 61,3
Mariehamn 5 616 4 549 81,0 1 067 19,0 10 154 5 605 55,2 180,8
Landskomm. 8 071 2 720 33,7 5 351 66,3 5 152 2 432 47,2 63,8-Landsbygden 7 064 2 168 30,7 4 896 69,3 4 514 2 346 52,0 63,9-Skärgården 1 007 552 54,8 455 45,2 638 86 13,5 63,4
Åland 13 687 7 269 53,1 6 418 46,9 15 306 8 037 52,5 111,8
Not/Note : I sif frorna för antalet arbetande ingår de anställda på åländska fartyg. I siffrorna för regionerna och hela Åland ingåräven pendlare mellan kommunerna/The figures include employees on Åland ships. The figures for the regions and Åland includecommuters between the municipalities.
Källa/Source : Statistikcentralen, Befolkning/Statistics Finland, Population
In home munic. Outcommuters
Inpendlare/
Incommuters
Sysselsatta som bor i kommunen/
Employed living in municipality
Arbetande i kommunen/
Employed in municipality
Utpendlare/
Arbetsplats
i hemkommun/
0 10 20 30 40 50 60
Primärnär./Agricult.
Industri/Industry
Byggverks./Construction
Handel/Trade
Transp./Transport
Hotell o rest./Hotel, rest.
Inf. o komm./Inf. and comm.
Finans o förs./Finance
Fastigh.verks/Real estate
Verks. inom juridik, ekon. teknik/Prof, scientific,techn.
Samh.tj./Publ.serv.
Pers.tj./Pers.serv.
Procent
Kvinnor
Män

Arbetsmarknad
Statistisk årsbok för Åland – Statistical Yearbook of Åland 2012 139
8.7. Inom området arbetande efter kön, yrkesställning, arbetsgivarsektor och kommun 31.12.2009 8.7. Within the area employed by sex, employment status, employer sector and municipality 31.12.2009
Figur 8.3. Egna företagare per 1 000 personer efter kommun 31.12.2010 Figure 8.3. Self-employed per 1 000 persons by municipality 31.12.2010
Kommun
Totalt K M Totalt Offentliga/ Privata/ K M Totalt K M
Public Private
Brändö 154 86 68 123 45 78 74 49 31 12 19Eckerö 240 110 130 167 74 93 86 81 73 24 49Finström 1 020 613 407 850 458 392 567 283 169 46 123Föglö 184 88 96 143 63 80 76 67 40 11 29Geta 111 55 56 67 31 36 41 26 43 13 30Hammarland 302 143 159 188 89 99 116 72 114 27 87Jomala 1 855 827 1 028 1 614 471 1 143 767 847 240 60 180Kumlinge 79 53 26 54 38 16 45 9 25 8 17Kökar 69 45 24 56 43 13 40 16 13 5 8Lemland 274 157 117 198 117 81 138 60 75 19 56Lumparland 90 42 48 68 28 40 34 34 22 8 14Saltvik 419 190 229 312 109 203 159 153 106 31 75Sottunga 35 16 19 15 9 6 9 6 20 7 13Sund 203 105 98 135 84 51 88 47 67 17 50Vårdö 117 66 51 65 35 30 47 18 52 19 33
Mariehamn 10 154 5 079 5 075 9 635 3 405 6 230 4 884 4 751 510 194 316
Landskomm. 5 152 2 596 2 556 4 055 1 694 2 361 2 287 1 768 1 090 307 783-Landsbygden 4 514 2 242 2 272 3 599 1 461 2 138 1 996 1 603 909 245 664-Skärgården 638 354 284 456 233 223 291 165 181 62 119
Åland 15 306 7 675 7 631 13 690 5 099 8 591 7 171 6 519 1 600 501 1 099Not/Note : I uppgifterna för arbetande totalt ingår personer med okänd sektor/The total number of employed includes people
for whom the sector is unknown.
Källa/Source : Statistikcentralen, Befolkning/Statistics Finland, Population
Företagare/Self-employed
Arbetande totalt/Employed persons, total
Anställda efter arbetsgivare och kön/Employees by employer and sex
Not/Note : Exklusive jord- och skogsbrukare/Excluding agricultural workers.

Arbetsmarknad
140 Statistisk årsbok för Åland – Statistical Yearbook of Åland 2012
8.8. Inom området arbetande efter kön, yrkesställning, arbetsgivarsektor och näringsgren 31.12.2009 8.8. Within the area employed by sex, employment status, employer sector and industry 31.12.2009
8.9. Inom området arbetande efter kön, yrkesställning och arbetsgivarsektor 1995-2009 8.9. Within the area employed by sex, employment status and employer sector 1995-2009
Näringsgren/Industry
Totalt K M Totalt Offentl./ Privata/ K M Totalt K MPublic Private
Totalt 15 306 7 675 7 631 13 690 5 099 8 591 7 171 6 519 1 600 501 1 099Jord- o. skogsbruk, fiske/
582 169 413 167 23 144 53 114 415 116 299Energi, vatten o avlopp
192 27 165 191 65 126 27 164 1 - 1Industri/Industry 892 267 625 814 20 794 244 570 78 23 55Byggverksamhet/
917 51 866 608 - 608 40 568 309 11 298Handel, transport, hotell, rest./
5 329 2 154 3 175 4 969 238 4 731 2 030 2 939 360 124 236Informations o kommunikation
497 173 324 488 6 482 171 317 9 2 7Finans. o. förs.verksamhet/
466 304 162 462 - 462 303 159 4 1 3Fastighetsverks./
77 29 48 68 1 67 25 43 9 4 5Juridik, ekon., vetensk,stödtj./Prof.,scientific, techn. act. 757 341 416 604 251 353 285 319 153 56 97Samhällstj./Public services 4 453 3 469 984 4 391 4 198 193 3 430 961 62 39 23Pers.tjänster/Pers.services 800 453 347 696 85 611 375 321 104 78 26
344 238 106 232 212 20 188 44 96 47 49
Not/Note : I uppgifterna för arbetande totalt ingår personer med okänd sektor/The total number of employed includes people for whom the sector is unknown. Näringsgrensklassif ikationen reviderades 2008 varför uppgif terna inte är jämförbara med tidigare år/As the industrial classification was updated in 2008, the industrial data are not entirely comparable with previouslypublished figures.
Källa/Source: Statistikcentralen, Befolkning/Statistics Finland, Population
Okänd/Unknown
Finance, insurance act.
Real estate act.
Construction
Trade, transp., hotels, rest.
Information and communic.
Arbetande totalt/Employed persons, total
Agricult., forestry, fish.
Energy, water, waste
Företagare/Self-employed
Löntagare enl. arbetsgivarsektor o. kön/Employees by employer sector and sex
År/Year
Totalt K M Totalt Offentl./ Privata/ K M Totalt K MPublic Private
Antal1995 13 662 6 742 6 920 11 756 4 093 7 663 6 128 5 628 1 906 614 1 2922000 15 029 7 380 7 649 13 290 4 849 8 441 6 820 6 470 1 739 560 1 1792005 15 276 7 573 7 703 13 585 5 016 8 569 7 041 6 544 1 671 526 1 1452006 15 368 7 586 7 782 13 673 4 971 8 702 7 047 6 626 1 676 533 1 1432007 15 436 7 589 7 847 13 705 4 954 8 751 7 030 6 675 1 700 549 1 1512008 15 818 7 890 7 928 14 152 5 324 8 828 7 346 6 806 1 647 539 1 1082009 15 306 7 675 7 631 13 690 5 099 8 591 7 171 6 519 1 600 501 1 099
Procent1995 100,0 100,0 100,0 86,0 30,0 56,1 90,9 81,3 14,0 9,1 18,72000 100,0 100,0 100,0 88,4 32,3 56,2 92,4 84,6 11,6 7,6 15,42005 100,0 100,0 100,0 88,9 32,8 56,1 93,0 85,0 10,9 6,9 14,92006 100,0 100,0 100,0 89,0 32,3 56,6 92,9 85,1 10,9 7,0 14,72007 100,0 100,0 100,0 88,8 32,1 56,7 92,6 85,1 11,0 7,2 14,72008 100,0 100,0 100,0 89,5 33,7 55,8 93,1 85,8 10,4 6,8 14,02009 100,0 100,0 100,0 89,4 33,3 56,1 93,4 85,4 10,5 6,5 14,4
Not/Note : I uppgifterna för arbetande totalt år 2005-2009 ingår personer med okänd sektor/The total number of employed 2005-2009 includes people for whom the sector is unknown.Källa/Source : Statistikcentralen, Befolkning/Statistics Finland, Population
Employed persons, total Employees by employer Self-employedArbetande totalt/ Löntagare enligt arbetsgivarsektor/ Företagare/

Arbetsmarknad
Statistisk årsbok för Åland – Statistical Yearbook of Åland 2012 141
Figur 8.4. Sysselsatta efter region 1880-2009 Figure 8.4. Employed persons by region 1880-2009
Figur 8.5. Arbetande efter sektor och kön 2009 Figure 8.5. Employed by sector and sex 2009
0
2 000
4 000
6 000
8 000
10 000
12 000
14 000
16 000
1880 1890 1900 1910 1920 1930 1940 1950 1960 1970 1980 1990 2000 2009
Antal
Mariehamn Landsbygden Skärgården
Not/Note : Fr.o.m. 1960 ingår invånarna i de områden som inkorporerades från Jomala 1.1.1961 i
siffrorna för Mariehamn/As of 1960, the inhabitants of the areas incorporated from Jomala
1.1.1961 are included in the figures for Mariehamn.
0
1 000
2 000
3 000
4 000
5 000
6 000
Privata sektorn/Privatesector
Offentliga sektorn/Publicsector
Företagare/Self-employed
Antal
Kvinnor Män
Not/Note : I siffrorna för antalet arbetande ingår de anställda på åländska fartyg/The figures include
employees on Åland ships.

Arbetsmarknad
142 Statistisk årsbok för Åland – Statistical Yearbook of Åland 2012
8.10. De vanligaste yrkesgrupperna efter kön 2009 8.10. The most common occupations by sex 2009
Yrke/Occupation
Totalt K M K M
Primärskötare, närvårdare, barnskötare, hemvårdare m.fl./Practical
nurses, childminders and home care assistants 1 294 1 207 87 93,3 6,7
Sjukhus-, vård- och köksbiträden, städare m.fl./Hospital, domestic,
kitchen and related helpers, cleaners 677 598 79 88,3 11,7
Restaurang- och storhushållspersonal/Housekeeping and restaurant
services workers 653 373 280 57,1 42,9
Försäljare, varudemonstratör/Shop, stall and market salespersons and
demonstrators 587 327 260 55,7 44,3
Byggnadsarbetare m.fl./Building frame and related trades workers 587 17 570 2,9 97,1
Experter inom försäljning och finansiering/Finance and sales associate
professionals 453 198 255 43,7 56,3
Jordbrukare, skogsarbetare m.fl./Skilled agricultural and fishery workers 398 124 274 31,2 68,8
Sjukskötare, barnmorskor m.fl./Nursing and related associate professionals 393 380 13 96,7 3,3
Sekreterare, textbehandlare m.fl./Secretaries and keyboard-operating clerks 333 309 24 92,8 7,2
Fordonsförare/Motor vehicle drivers 329 44 285 13,4 86,6
Drift- och verksamhetschefer/Production and operations managers 300 122 178 40,7 59,3
Ämneslärare och lektorer/Secondary education teaching professionals 293 150 143 51,2 48,8
Administrativa tjänstemän/Administrative associate professionals 269 208 61 77,3 22,7
Personal i kundservicearbete inom penningtrafik/Cashiers, tellers and
related clerks 243 197 46 81,1 18,9
Sjö-, flyg- och hamntrafikbefäl och -ledare/Ship, aircraft and harbour
controllers and technicians 241 4 237 1,7 98,3
Dataspecialister/Computing professionals 219 61 158 27,9 72,1
Experter inom fysik, kemi och teknik/Physical, chemical and engineering
science technicians 218 22 196 10,1 89,9
Biblioteks- och postkontorspersonal m.fl./Library, mail and related clerks 216 118 98 54,6 45,4
Fastighetspersonal och fönsterputsare m.fl./Building caretakers, window
and related cleaners 200 24 176 12,0 88,0
Däckmanskap och maskinpersonal m.fl. sjötrafikarbetare/Ships' deck
and engine crews and related workers 200 2 198 1,0 99,0
Övrig personal i kundservice/Client information clerks 198 158 40 79,8 20,2
Maskinoperatörer, tillverkning av livsmedel och tobaksprodukter/Food
and tobacco products machine operators 192 68 124 35,4 64,6
Chefer för särskilda funktioner/Other specialist managers 183 80 103 43,7 56,3
Arkitekter och övriga specialister inom teknik/Architects and engineering
science professionals 171 26 145 15,2 84,8
El-, tele- och elektronikmontörer och -reparatörer/Electrical, electronic
and telecommunications equipment mechanics and fitters 170 3 167 1,8 98,2
Chef för småföretag/Managers of small companies 162 48 114 29,6 70,4
Övrig kontorspersonal/Other office clerks 157 118 39 75,2 24,8
Maskinmontörer och reparatörer/Machinery mechanics and fitters 157 3 154 1,9 98,1Specialister inom affärslivet och organisationer/Business professionals 151 84 67 55,6 44,4
Källa/Source : Statistikcentralen, Befolkning/Statistics Finland, Population
Antal Procent
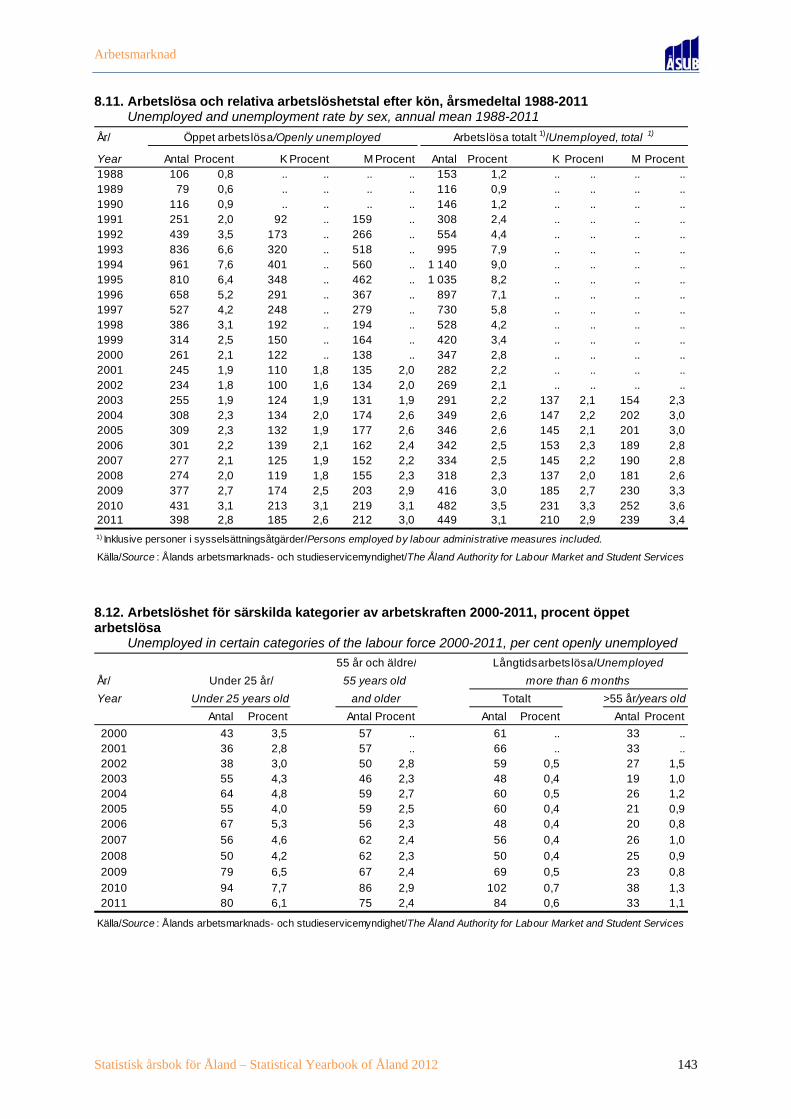
Arbetsmarknad
Statistisk årsbok för Åland – Statistical Yearbook of Åland 2012 143
8.11. Arbetslösa och relativa arbetslöshetstal efter kön, årsmedeltal 1988-2011 8.11. Unemployed and unemployment rate by sex, annual mean 1988-2011
8.12. Arbetslöshet för särskilda kategorier av arbetskraften 2000-2011, procent öppet arbetslösa 8.12. Unemployed in certain categories of the labour force 2000-2011, per cent openly unemployed
År/
Year Antal Procent K Procent M Procent Antal Procent K Procent M Procent1988 106 0,8 .. .. .. .. 153 1,2 .. .. .. ..1989 79 0,6 .. .. .. .. 116 0,9 .. .. .. ..1990 116 0,9 .. .. .. .. 146 1,2 .. .. .. ..1991 251 2,0 92 .. 159 .. 308 2,4 .. .. .. ..1992 439 3,5 173 .. 266 .. 554 4,4 .. .. .. ..1993 836 6,6 320 .. 518 .. 995 7,9 .. .. .. ..1994 961 7,6 401 .. 560 .. 1 140 9,0 .. .. .. ..1995 810 6,4 348 .. 462 .. 1 035 8,2 .. .. .. ..1996 658 5,2 291 .. 367 .. 897 7,1 .. .. .. ..1997 527 4,2 248 .. 279 .. 730 5,8 .. .. .. ..1998 386 3,1 192 .. 194 .. 528 4,2 .. .. .. ..1999 314 2,5 150 .. 164 .. 420 3,4 .. .. .. ..2000 261 2,1 122 .. 138 .. 347 2,8 .. .. .. ..2001 245 1,9 110 1,8 135 2,0 282 2,2 .. .. .. ..2002 234 1,8 100 1,6 134 2,0 269 2,1 .. .. .. ..2003 255 1,9 124 1,9 131 1,9 291 2,2 137 2,1 154 2,32004 308 2,3 134 2,0 174 2,6 349 2,6 147 2,2 202 3,02005 309 2,3 132 1,9 177 2,6 346 2,6 145 2,1 201 3,02006 301 2,2 139 2,1 162 2,4 342 2,5 153 2,3 189 2,82007 277 2,1 125 1,9 152 2,2 334 2,5 145 2,2 190 2,82008 274 2,0 119 1,8 155 2,3 318 2,3 137 2,0 181 2,62009 377 2,7 174 2,5 203 2,9 416 3,0 185 2,7 230 3,32010 431 3,1 213 3,1 219 3,1 482 3,5 231 3,3 252 3,62011 398 2,8 185 2,6 212 3,0 449 3,1 210 2,9 239 3,41) Inklusive personer i sysselsättningsåtgärder/Persons employed by labour administrative measures included.
Källa/Source : Ålands arbetsmarknads- och studieservicemyndighet/The Åland Authority for Labour Market and Student Services
Öppet arbetslösa/Openly unemployed Arbetslösa totalt 1)/Unemployed, total 1)
År/
Year
Antal Procent Antal Procent Antal Procent Antal Procent
2000 43 3,5 57 .. 61 .. 33 ..2001 36 2,8 57 .. 66 .. 33 ..2002 38 3,0 50 2,8 59 0,5 27 1,52003 55 4,3 46 2,3 48 0,4 19 1,02004 64 4,8 59 2,7 60 0,5 26 1,22005 55 4,0 59 2,5 60 0,4 21 0,92006 67 5,3 56 2,3 48 0,4 20 0,8
2007 56 4,6 62 2,4 56 0,4 26 1,0
2008 50 4,2 62 2,3 50 0,4 25 0,9
2009 79 6,5 67 2,4 69 0,5 23 0,8
2010 94 7,7 86 2,9 102 0,7 38 1,32011 80 6,1 75 2,4 84 0,6 33 1,1
Källa/Source : Ålands arbetsmarknads- och studieservicemyndighet/The Åland Authority for Labour Market and Student Services
Långtidsarbetslösa/Unemployed
more than 6 monthsUnder 25 år/
Under 25 years old >55 år/years oldTotalt
55 år och äldre/
55 years old
and older

Arbetsmarknad
144 Statistisk årsbok för Åland – Statistical Yearbook of Åland 2012
8.13. Lediga platser och arbetslösa efter yrke i medeltal 2007-2011 8.13. Job vacancies and unemployed by occupation 2007-2011
8.14. Arbetslöshetsersättningar efter kön 1990-2011 8.14. Unemployment benefits by sex 1990-2011
Yrke/Occupation Lediga platser/Job vacancies Arbetslösa/Unemployed persons
2008 2009 2010 2011 2008 2009 2010 2011
Totalt 258 183 162 216 179 244 285 262
Tekn., naturvet., jur., hum., konstnärl./
Tech., sci., jur., hum., art. 18 17 15 20 25 29 35 32
Hälsovård, socialt arbete/
Health, social work 54 57 42 44 18 27 33 32
Administrativt, kontor/
Administrative, office 22 14 16 19 19 29 38 26
Kommersiellt arbete/
Commercial work 23 14 14 21 15 22 20 21
Jord-, skogsbruk, fiske/
Agricultural, forestry, fishing 8 2 2 1 8 14 13 14
Transport, kommunikation/
Transport, communication 18 14 9 11 17 21 27 28
Husbyggnads, anläggningsarbete/
Construction 7 3 2 7 8 14 13 15
Tillverkningsindustri:metall, el, trä/
Industry: metal, el., wood 13 3 5 8 16 21 22 21
Tillverkningsindustri:livs, glas, plast/
Industry: provisions, glass, plastic 7 2 4 3 12 12 15 11
Tjänster/
Service 87 56 53 82 40 56 68 62
Av vilka sjöfart/Of which shipping 18 15 6 5 16 25 31 24
Källa/Source : Ålands arbetsmarknads- och studieservicemyndighet/The Åland Authority for Labour Market and Student Services
År/Year Ansökningar/ Dagpenningsdagar/
Applications Days of benefits paid Belopp/Costs, 1 000 EUR
Totalt K M Totalt K M Totalt K M
1990 115 .. .. 3 200 .. .. 56 .. ..
1995 1 089 .. .. 100 500 .. .. 1 995 .. ..
1996 960 .. .. 83 800 .. .. 1 662 .. ..
1997 769 .. .. 64 150 .. .. 1 273 .. ..
1998 580 .. .. 45 300 .. .. 915 .. ..
1999 458 .. .. 40 700 .. .. 828 .. ..
2000 249 .. .. 35 837 .. .. 604 .. ..
2001 250 .. .. 32 127 .. .. 544 .. ..
2002 285 .. .. 31 226 .. .. 614 .. ..
2003 359 .. .. 32 475 .. .. 661 .. ..
2004 436 .. .. 45 765 .. .. 960 .. ..
2005 397 .. .. 49 948 .. .. 1 056 .. ..
2006 426 .. .. 45 675 .. .. 978 .. ..
2007 334 159 175 42 327 .. .. 943 .. ..
2008 336 146 190 40 418 18 175 22 243 941 416 525
2009 501 .. .. 56 006 .. .. 1 375 .. ..
2010 570 .. .. 79 775 .. .. 1 778 .. ..2011 579 .. .. 86 157 45 350 40 807 1 842 936 906
Not/Note : Tabellen omfattar grunddagpenning och arbetsmarknadsstöd som utbetalas från Ålands landskapsregering/Basic allowances and labour market subsidies paid by the Government of Åland are included.Källa/Source : Ålands arbetsmarknads- och studieservicemyndighet/The Åland Authority for Labour Market and Student Services

9
9. Löner, inkomster och skatter 9. Wages and salaries, income and
taxes
0 20 40 60 80 100 120 140 160 180 200 220 240 260
Övrigt/Other
Förmögenh./Capital
Näringsverks./Business
Pensioner/Pensions
Arb.ink./Wages andsalaries
MEUR
Fysiska personers inkomst efter kön 2010Income of private individuals by sex 2010
Män Kvinnor

Löner, inkomster och skatter Detta kapitel omfattar statistik om skattepliktiga inkomster och betalade skatter samt om lönenivåer inom den privata och offentliga sektorn. Objekt för statistiken är de ekonomiska uppgifterna: inkomster och skatter efter olika slag, medellöner, antal anställda samt lönerelationer mellan kvinnor och män. Statistiken redovisas i huvudsak för hela Åland, men för vissa beskattningsuppgifter finns det också siffror efter kommun och region. En utförligare beskrivning av statistikområdena inklusive definitioner av variabler finns på ÅSUBs webbplats www.asub.ax under Statistik efter ämne/Löner respektive Inkomster och skatter. Källorna anges under varje tabell. Tillförlitligheten är hög i och med att skatteuppgifterna baseras på registeruppgifter och lönestatistiken på totaluppgifter. För den privata sektorn finns en avgränsning så att lönestatistiken omfattar de företag som har minst tre anställda. Jämförbarheten är god såväl när det gäller jämförelser över tiden som med andra statistikområden, t.ex. nationalräkenskaper och arbetsmarknad. ÅSUB publicerar vartannat år två statistikrapporter med lönestatistik för den privata respektive den offentliga sektorn. Dessa kan beställas från ÅSUB och finns även tillgängliga på ÅSUBs webbplats. Där finns det också statistik om löner respektive inkomster och skatter i form av Excel- och PC-Axis-tabeller. Ansvarig för lönestatistiken på ÅSUB är Jonas Karlsson, [email protected] och för statistiken över inkomster och skatter Iris Åkerberg, [email protected]. Wages and salaries, income and taxes This chapter includes statistics on income subject to taxation and taxes as well as wage and salary levels in the private and public sectors. More statistics on these subject areas are available at the website of Statistics Åland, www.asub.ax, in Excel-tables and PC-Axis-databases in English. Contact persons are Jonas Karlsson, [email protected] (wages and salaries) and Iris Åkerberg, [email protected] (income and taxation).

Löner, inkomster och skatter
Statistisk årsbok för Åland – Statistical Yearbook of Åland 2012 147
9.1. Fysiska personers skattepliktiga inkomster och skatter efter kommun 2008-2010 9.1. Income subject to taxation and taxes of private individuals by municipality 2008-2010
Figur 9.1. Beskattningsbar inkomst och skatt efter person 2005-2010 Figure 9.1. Income subject to taxation and taxes per person 2005-2010
Kommun
2009 2010 2009 2010 2009 2010
Brändö 471 468 12 134 11 760 2 287 2 192Eckerö 835 848 19 307 20 309 3 381 3 647Finström 2 138 2 151 55 950 60 100 11 292 12 536Föglö 561 549 13 507 15 344 2 540 2 987Geta 408 414 8 995 9 460 1 348 1 436Hammarland 1 255 1 283 31 785 33 108 5 484 5 800Jomala 3 311 3 419 90 589 96 660 17 496 19 077Kumlinge 345 345 8 503 8 927 1 662 1 752Kökar 236 235 5 486 5 689 979 1 004Lemland 1 486 1 495 41 229 43 823 7 809 8 563Lumparland 335 348 8 915 9 533 1 685 1 887Saltvik 1 539 1 553 38 495 40 042 6 647 6 973Sottunga 109 114 2 786 2 988 577 628Sund 884 897 22 353 23 018 4 119 4 341Vårdö 394 387 9 298 9 810 1 642 1 751
Mariehamn 10 959 11 086 300 097 312 595 60 369 63 425
Landskomm. 14 307 14 506 369 332 390 571 68 948 74 574-Landsbygden 12 191 12 408 317 618 336 053 59 261 64 260-Skärgården 2 116 2 098 51 714 54 518 9 687 10 314
Åland 25 266 25 592 669 429 703 167 129 317 138 001
Källa/Source : Statistikcentralen, Inkomst och konsumtion/Statistics Finland, Income and consumption
recipientstagare/IncomeAntal inkomst-
Skatter totalt/Taxes total, 1 000 EUR
Skattepliktiga inkomster/Income subject to
taxation, 1 000 EUR
0
2 000
4 000
6 000
8 000
10 000
12 000
14 000
16 000
18 000
20 000
22 000
24 000
26 000
28 000
30 000
2005 2006 2007 2008 2009 2010
EUR
Nettoinkomst/pers/Net income/pers. Skatter/pers/Taxes/pers.
Not/Note : Översta linjen visar privatpersoners totala inkomst, vita fältet visar skatten
och blåa fältet inkomsten efter skatt/The upper line shows the total income of private
individuals, the white area shows the taxes and the blue area shows the income after
tax deductions.

Löner, inkomster och skatter
148 Statistisk årsbok för Åland – Statistical Yearbook of Åland 2012
9.2. Fysiska personers inkomster och beskattning efter inkomstklass 2010 9.2. Income and taxation of private individuals by size of income 2010
Figur 9.2. Beskattning efter inkomstklass 2010, procent av skatterna Figure 9.2. Taxation by size of income 2010, per cent of taxes
Inkomstklass, EUR/ Inkomst/ Skatter/per- Skatter/in-
Size of income, EUR person/In- son/Taxes/ komst/Tax-
come/pers. person es/income
Antal Procent 1 000 EUR Procent 1 000 EUR Procen EUR EUR Procent
- 999 1 558 6,1 447 0,1 34 0,0 287 22 7,6
1 000 - 2 499 857 3,3 1 436 0,2 43 0,0 1 676 50 3,0
2 500 - 4 999 965 3,8 3 508 0,5 105 0,1 3 635 109 3,0
5 000 - 7 499 1 186 4,6 7 551 1,1 328 0,2 6 367 277 4,3
7 500 - 9 999 1 274 5,0 11 178 1,6 476 0,3 8 774 374 4,3
10 000 - 14 999 2 719 10,6 33 945 4,8 2 425 1,8 12 484 892 7,1
15 000 - 19 999 2 359 9,2 41 347 5,9 4 698 3,4 17 528 1 992 11,4
20 000 - 24 999 2 492 9,7 56 200 8,0 7 742 5,6 22 552 3 107 13,8
25 000 - 29 999 2 665 10,4 73 470 10,4 11 858 8,6 27 568 4 449 16,1
30 000 - 39 999 4 609 18,0 159 011 22,6 29 628 21,5 34 500 6 428 18,6
40 000 - 49 999 2 297 9,0 101 863 14,5 22 351 16,2 44 346 9 731 21,9
50 000 - 59 999 1 108 4,3 60 235 8,6 14 743 10,7 54 364 13 306 24,5
60 000 79 999 895 3,5 60 675 8,6 16 069 11,6 67 794 17 954 26,5
80 000 99 999 285 1,1 25 036 3,6 7 206 5,2 87 845 25 284 28,8
100 000 + 323 1,3 67 264 9,6 20 294 14,7 208 248 62 830 30,2
Totalt 25 592 100,0 703 167 100,0 138 001 100,0 27 476 5 392 19,6
Källa/Source : Statistikcentralen, Inkomst och konsumtion/Statistics Finland, Income and consumption
Skatter/Taxes
Personer/Pri-
vate individuals
Skattepl. inkomst/
Income subj. to tax.
0 10 20 30 40 50
-9 999
10 000-19 999
20 000-29 999
30 000-39 999
40 000-49 999
50 000+
Procent/Per cent
EUR

Löner, inkomster och skatter
Statistisk årsbok för Åland – Statistical Yearbook of Åland 2012 149
9.3. Fysiska personers inkomster och beskattning 1995-2010 9.3. Income and taxes of private individuals 1995-2010
Inkomster/Source of income MEUR Procent MEUR Procent MEUR Procent MEUR Procent
Arbetsinkomster/Wages and salaries 218,3 61,7 289,9 58,1 357,6 58,7 432,6 61,5
Pensionsinkomster/Pensions 57,9 16,4 67,7 13,6 87,5 14,4 121,7 17,3
Inkomster av gårdsbruk/Agriculture 8,3 2,3 9,6 1,9 9,1 1,5 9,6 1,4
Inkomster av näringsverksamhet/
Business income 9,4 2,6 16,1 3,2 18,7 3,1 23,3 3,3
Inkomster av förmögenhet/
Capital income 36,3 10,3 77,9 15,6 92,8 15,2 71,4 10,2
Övriga inkomster/Other income 1) 17,5 4,9 30,9 6,2 42,1 6,9 53,5 7,6
Skattepliktiga inkomster/
Income subject to taxation 353,9 100,0 499,0 100,0 609,6 100,0 703,2 100,0
Avdrag vid statsbeskattningen/
Deductions in state taxation 39,2 11,1 2) 46,8 9,4 2) 54,0 8,9 2) 104,8 14,9 2)
Beskattningsbar förvärvsinkomst/
Taxable earned income 275,0 77,7 2) 368,7 73,9 2) 469,2 77,0 2) 539,4 76,7 2)
Beskattningsbar kapitalinkomst/
Taxable capital income 39,8 11,2 2) 83,5 16,7 2) 86,4 14,2 2) 59,0 8,4 2)
Skulder/Liab ilities 203,7 34,1 3) 273,0 30,0 3) 460,2 43,3 3) .. ..
Inkomst- och förmögenhetsskatt/
Income and property tax 38,4 41,0 63,8 52,7 65,9 47,8 44,5 32,3
Kommunalskatt/Municipality tax 42,4 45,4 47,8 39,5 61,3 44,5 76,1 55,1
Folkpensions- och sjukförsäkrings-
avgift/Pension and social contributions 9,2 9,8 5,4 4,5 5,6 4,1 6,9 5,0
Kyrkoskatt/Church tax 3,5 3,7 4,0 3,3 5,0 3,6 6,2 4,5
Skogsvårdsavgift/Forestry duty 0,1 0,1 0,1 0,1 0,0 0,0 0,1 0,1
Summa skatter/Taxes, total 93,5 100,0 121,0 100,0 137,9 100,0 138,0 100,0
Statsskattepliktiga inkomster
minus skatter/Income subject 260,5 73,6 2) 378,0 75,7 2) 471,7 77,4 2) 565,2 80,4 2)
to taxation less taxes
1)Inkl. inkomster från utlandet/Including income from abroad. 2)Procent av statsskattepliktiga inkomster/Per cent of income subject
to taxation. 3)Procent av skattepliktiga tillgångar/Per cent of assets subject to taxation.
Not/Note : Skattepliktiga inkomster för 2005 är inte jämförbara med tidigare år p.g.a. dividendskattereformen/Income subject to
taxation 2005 is not comparable to earlier years because of the dividend tax reform. Förmögenhetsbeskattningen avskaffad
2006/The wealth tax was abolished 2006.
Källa/Source : Statistikcentralen, Inkomst och konsumtion/Statistics Finland, Income and consumption
1995 2000 2005 2010

Löner, inkomster och skatter
150 Statistisk årsbok för Åland – Statistical Yearbook of Åland 2012
9.4. Fysiska personers inkomster och beskattning efter kön 2009-2010 9.4. Income and taxes of private individuals by sex 2009-2010
Inkomster/Source of income
K M K M K M K M
Arbetsinkomster/Wages and salaries 189,8 230,6 45,1 54,9 198,5 234,1 45,9 54,1
Pensionsinkomster/Pensions 51,3 65,1 44,0 56,0 53,6 68,2 44,0 56,0
Inkomster av gårdsbruk/Agriculture 2,9 7,0 29,4 70,6 2,8 6,8 29,2 70,8
Inkomster av näringsverksamhet/
Business income 5,6 16,4 25,5 74,5 6,2 17,1 26,7 73,3
Inkomster av förmögenhet/
Capital income 15,7 38,7 28,8 71,2 20,6 50,8 28,8 71,2
Övriga inkomster/Other income 1) 19,1 38,3 33,3 66,7 15,3 38,2 28,6 71,4
Skattepliktiga inkomster/
Income subject to taxation 282,1 387,4 42,1 57,9 295,6 407,5 42,0 58,0
Avdrag vid statsbeskattningen/
Deductions in state taxation 54,8 54,9 50,0 50,0 52,7 52,1 50,3 49,7
Beskattningsbar förvärvsinkomst/
Taxable earned income 213,6 302,4 41,4 58,6 224,3 315,1 41,6 58,4
Beskattningsbar kapitalinkomst/
Taxable capital income 13,6 30,1 31,1 68,9 18,7 40,3 31,7 68,3
Inkomstskatt/Income tax 12,3 30,8 28,5 71,5 12,7 31,8 28,6 71,4
Kommunalskatt/Municipality tax 29,5 42,0 41,2 58,8 31,3 44,7 41,2 58,8
Folkpensions- och sjukförsäkrings-
avgift/Pension and social contributions 2,3 3,3 41,5 58,5 2,9 4,0 41,6 58,4
Kyrkoskatt/Church tax 2,5 3,4 41,9 58,1 2,6 3,6 42,0 58,0
Skogsvårdsavgift/Forestry duty 0,0 0,1 24,2 75,8 0,0 0,1 25,3 74,7
Summa skatter/Taxes, total 47,9 81,4 37,1 62,9 51,4 86,6 37,3 62,7
Statsskattepliktiga inkomster
minus skatter/Income subject
to taxation less taxes 234,1 306,0 43,3 56,7 244,2 320,9 43,2 56,81)Inkl. inkomster från utlandet/Including income from abroad.
Källa/Source : Statistikcentralen, Inkomst och konsumtion/Statistics Finland, Income and consumption
2009 2010
ProcentMEUR MEUR Procent

Löner, inkomster och skatter
Statistisk årsbok för Åland – Statistical Yearbook of Åland 2012 151
9.5. Fysiska personers inkomster och beskattning efter ålder 2010, 1 000 EUR 9.5. Income and taxes of private individuals by age 2010, 1 000 EUR
Inkomster/Source of income Ålder/Age
-16 17-19 20-24 25-34 35-44 45-54 55-64 65-
Arbetsinkomster/Wages and salaries 381 5 328 23 781 75 756 108 882 117 452 93 993 7 059Pensionsinkomster/Pensions 349 175 239 528 1 186 2 473 25 390 91 404Inkomster av gårdsbruk/Agriculture 0 0 3 863 2 386 3 380 2 126 822Inkomster av näringsverksamhet/Business income 0 2 310 2 007 6 264 7 339 5 821 1 584
Inkomster av förmögenhet/Capital income 167 43 339 2 047 5 951 8 841 27 743 26 300
Övriga inkomster/Other income 1) 37 4 526 2 484 7 182 8 277 9 495 8 991 16 622
Skattepliktiga inkomster/Income subject to taxation 943 5 981 27 118 88 827 132 566 149 041 159 675 139 016
Avdrag vid statsbeskattningen/
Deductions in state taxation 494 1 003 3 648 9 790 14 101 16 442 20 688 38 630Beskattningsbar förvärvsinkomst/Taxable earned income 268 4 928 23 117 77 220 113 850 124 760 116 321 78 908Beskattningsbar kapitalinkomst/Taxable capital income 181 50 353 1 817 4 615 7 839 22 666 21 478
Inkomstskatt/Income tax 49 17 253 3 011 7 426 10 046 13 650 10 066Kommunalskatt/Municipality tax 15 188 2 159 9 774 15 758 17 920 17 278 12 988Folkpensions- och sjukförsäkrings-avgift/Pension and social contributions 2 17 188 851 1 347 1 556 1 557 1 356Kyrkoskatt/Church tax 2 16 175 724 1 229 1 440 1 436 1 147Skogsvårdsavgift/Forestry duty 0 0 0 3 11 19 25 37
Summa skatter/Taxes, total 70 277 2 973 15 055 26 844 32 189 34 907 25 686
Statsskattepliktiga inkomsterminus skatter/Income subject 873 5 705 24 145 73 773 105 721 116 852 124 769 113 329to taxation less taxes
Procent2) 92,6 95,4 89,0 83,1 79,7 78,4 78,1 81,51)Inkl. inkomster från utlandet/Including income from abroad.2)Procent av statsskattepliktiga inkomster/Income subject to taxation, per cent
Källa/Source : Statistikcentralen, Inkomst och konsumtion/Statistics Finland, Income and consumption

Löner, inkomster och skatter
152 Statistisk årsbok för Åland – Statistical Yearbook of Åland 2012
9.6. Antal anställda och medelmånadslön för heltidsanställda i den privata sektorn efter bransch och kön 2010 9.6. Employees and average monthly earnings of full-time employees in the private sector by industry and sex 2010
Bransch/Industry Lönekvot/Wage ratio
Totalt K, % M,% Totalt K M K/MTillverkningsindustri/Manufacture 592 25,8 74,2 2 880 2 629 2 967 0,89Ledning/Managers 87 18,4 81,6 4 872 4 311 4 994 0,86Förmän/Foremen 58 19,0 81,0 3 368 3 314 3 380 0,98Operativ pers./Operative staff 366 22,4 77,6 2 423 2 287 2 462 0,93Servicepers./Service staff 44 36,4 63,6 2 227 2 197 2 245 0,98Adm.pers./Adm.staff 37 75,7 24,3 2 849 2 714 3 278 0,83Energi och vatten/Energy and water 121 13,2 86,8 3 149 2 750 3 217 0,85Ledning/Managers 20 20,0 80,0 4 922 .. .. ..Förmän/Foremen 17 5,9 94,1 3 484 .. .. ..Operativ pers./Operative staff 71 2,8 97,2 2 637 .. .. ..Servicepers./Service staff 2 50,0 50,0 .. .. .. ..Adm.pers./Adm.staff 11 72,7 27,3 .. .. .. ..Byggverksamhet/Construction 426 4,9 95,1 2 806 2 643 2 814 0,94Ledning/Managers 28 10,7 89,3 4 316 .. .. ..Förmän/Foremen 34 2,9 97,1 3 721 .. .. ..Operativ pers./Operative staff 345 0,9 99,1 2 608 .. .. ..Servicepers./Service staff 2 0,0 100,0 .. .. - ..Adm.pers./Adm.staff 17 82,4 17,6 .. .. .. ..Handel/Trade 598 35,5 64,5 2 540 2 200 2 724 0,81Ledning/Managers 69 26,1 73,9 4 031 3 249 4 321 0,75Förmän/Foremen 21 23,8 76,2 3 157 .. .. ..Operativ pers./Operative staff 450 34,9 65,1 2 268 1 966 2 427 0,81Servicepers./Service staff 23 17,4 82,6 2 161 .. .. ..Adm.pers./Adm.staff 35 80,0 20,0 2 734 2 669 2 992 0,89Transport, post, tele/Transport, post, tele 884 44,8 55,2 3 273 2 782 3 646 0,76Ledning/Managers 167 32,3 67,7 5 272 3 888 5 901 0,66Förmän/Foremen 71 29,6 70,4 3 725 3 094 3 981 0,78Operativ pers./Operative staff 514 43,2 56,8 2 716 2 557 2 826 0,90Servicepers./Service staff 21 52,4 47,6 2 221 2 109 2 344 0,90Adm.pers./Adm.staff 111 79,3 20,7 2 770 2 679 3 113 0,86Hotell- och rest./Hotels and rest. 151 49,0 51,0 2 252 2 152 2 344 0,92Ledning/Managers 12 16,7 83,3 3 235 .. .. ..Förmän/Foremen 11 81,8 18,2 2 684 .. .. ..Operativ pers./Operative staff 107 43,0 57,0 2 168 2 066 2 245 0,92Servicepers./Service staff 18 83,3 16,7 .. .. .. ..Adm.pers./Adm.staff 3 66,7 33,3 .. .. .. ..Finans o. försäkr./Finance and insurance 410 62,4 37,6 3 707 3 250 4 453 0,73Ledning/Managers 114 43,9 56,1 5 423 4 910 5 807 0,85Förmän/Foremen 35 62,9 37,1 3 851 3 320 4 707 0,71Operativ pers./Operative staff 230 71,3 28,7 2 951 2 799 3 320 0,84Servicepers./Service staff 15 33,3 66,7 2 811 .. .. ..Adm.pers./Adm.staff 16 93,8 6,3 3 157 .. .. ..Företagstjänster/Company services 467 36,6 63,4 3 236 2 950 3 407 0,87Ledning/Managers 81 22,2 77,8 4 596 4 790 4 548 1,05Förmän/Foremen 51 17,6 82,4 3 844 3 494 3 929 0,89Operativ pers./Operative staff 306 39,2 60,8 2 868 2 743 2 952 0,93Servicepers./Service staff 9 66,7 33,3 2 220 .. .. ..Adm.pers./Adm.staff 20 90,0 10,0 2 872 .. .. ..Övriga tjänster/Other services 469 36,0 64,0 2 959 2 513 3 236 0,78Ledning/Managers 80 28,8 71,3 4 346 3 515 4 694 0,75Förmän/Foremen 37 32,4 67,6 3 472 2 748 3 805 0,72Operativ pers./Operative staff 306 34,6 65,4 2 632 2 293 2 835 0,81Servicepers./Service staff 22 40,9 59,1 2 131 .. .. ..Adm.pers./Adm.staff 24 79,2 20,8 2 706 .. .. ..
Not/Note : Antal anställda gäller anställda i företagen som är med i undersökningen/Number of employees refers to the employees ofthe companies in the survey.
Källa/Source: ÅSUB Lönestatistik/Statistics Åland, Salaries and Wages
Average monthly earnings EURMedellön EUR, ordinarie arbetstid/
Antal anställda/Employees

Löner, inkomster och skatter
Statistisk årsbok för Åland – Statistical Yearbook of Åland 2012 153
9.7. Genomsnittlig timlön inom den privata sektorn efter bransch och kön 2010, samtliga anställda 9.7. Average earnings per hour in the private sector by industry and sex 2010, all employees
Bransch/Industry Lönekvot/
Wage ratioTotalt K, % M, % Totalt K M K/M
Tillverkningsindustri/Manufacture 821 30,8 69,2 15,66 14,78 16,05 0,92Ledning/Managers 91 19,8 80,2 28,41 25,51 29,10 0,88Förmän/Foremen 66 18,2 81,8 19,36 20,78 19,05 1,09Operativ pers./Operative staff 542 28,4 71,6 13,55 13,22 13,68 0,97Servicepers./Service staff 73 42,5 57,5 12,31 13,13 11,71 1,12Adm.pers./Adm.staff 49 77,6 22,4 16,90 16,16 19,62 0,82Energi och vatten/Energy and water 135 14,1 85,9 20,42 17,15 21,01 0,82Ledning/Managers 21 19,0 81,0 29,70 .. .. ..Förmän/Foremen 17 5,9 94,1 21,06 .. .. ..Operativ pers./Operative staff 82 3,7 96,3 18,51 .. .. ..Servicepers./Service staff 3 66,7 33,3 .. .. .. ..Adm.pers./Adm.staff 12 75,0 25,0 .. .. .. ..Byggverksamhet/Construction 562 7,5 92,5 15,94 15,54 15,97 0,97Ledning/Managers 30 10,0 90,0 24,41 .. .. ..Förmän/Foremen 37 8,1 91,9 21,33 .. .. ..Operativ pers./Operative staff 460 1,7 98,3 15,01 11,61 15,07 0,77Servicepers./Service staff 6 50,0 50,0 13,29 .. .. ..Adm.pers./Adm.staff 29 86,2 13,8 16,32 .. .. ..Handel/Trade 896 47,0 53,0 14,10 12,39 15,65 0,79Ledning/Managers 79 29,1 70,9 23,47 19,58 25,22 0,78Förmän/Foremen 24 29,2 70,8 18,80 16,75 19,81 0,85Operativ pers./Operative staff 693 46,9 53,1 12,81 11,45 14,03 0,82Servicepers./Service staff 55 52,7 47,3 11,91 11,06 12,93 0,85Adm.pers./Adm.staff 45 82,2 17,8 15,99 15,66 17,55 0,89Transport, post, tele/Transport, post, tele 1 302 51,6 48,4 18,43 16,64 20,21 0,82Ledning/Managers 173 33,5 66,5 32,36 24,40 36,15 0,67Förmän/Foremen 90 36,7 63,3 22,64 21,05 23,49 0,90Operativ pers./Operative staff 838 50,2 49,8 15,40 15,01 15,76 0,95Servicepers./Service staff 41 61,0 39,0 14,33 14,01 14,83 0,94Adm.pers./Adm.staff 160 84,4 15,6 18,05 17,81 19,36 0,92Hotell- och rest./Hotels and rest. 298 56,4 43,6 12,00 11,52 12,65 0,91Ledning/Managers 13 15,4 84,6 20,00 .. .. ..Förmän/Foremen 13 84,6 15,4 15,46 .. .. ..Operativ pers./Operative staff 223 52,5 47,5 11,46 10,99 12,03 0,91Servicepers./Service staff 42 76,2 23,8 10,75 10,77 10,69 1,01Adm.pers./Adm.staff 7 85,7 14,3 15,96 .. .. ..Finans o. försäkr./Finance and insurance 526 69,2 30,8 22,11 19,55 27,73 0,71Ledning/Managers 131 50,4 49,6 32,51 28,89 35,99 0,80Förmän/Foremen 44 70,5 29,5 23,04 20,33 29,14 0,70Operativ pers./Operative staff 295 75,3 24,7 18,24 17,18 21,37 0,80Servicepers./Service staff 32 68,8 31,3 17,04 .. .. ..Adm.pers./Adm.staff 24 95,8 4,2 19,35 .. .. ..Företagstjänster/Company services 633 44,2 55,8 18,49 16,84 19,86 0,85Ledning/Managers 90 26,7 73,3 27,85 28,22 27,73 1,02Förmän/Foremen 59 23,7 76,3 22,89 21,18 23,46 0,90Operativ pers./Operative staff 419 44,9 55,1 16,83 16,06 17,47 0,92Servicepers./Service staff 36 75,0 25,0 11,82 .. .. ..Adm.pers./Adm.staff 29 93,1 6,9 17,95 .. .. ..Övriga tjänster/Other services 727 49,4 50,6 16,33 14,26 18,67 0,76Ledning/Managers 96 32,3 67,7 26,10 21,14 28,62 0,74Förmän/Foremen 43 32,6 67,4 20,23 16,90 21,70 0,78Operativ pers./Operative staff 478 49,2 50,8 14,83 13,51 16,33 0,83Servicepers./Service staff 55 61,8 38,2 11,94 11,69 12,36 0,95Adm.pers./Adm.staff 55 81,8 18,2 15,60 15,34 17,08 0,90Not/Note : Antal anställda gäller anställda i företagen som är med i undersökningen/Number of employees refers to the employeesof the companies in the survey.
Källa/Source: ÅSUB Lönestatistik/Statistics Åland, Salaries and Wages
Medellön EUR/Average Antal anställda/
Employees earnings, EUR

Löner, inkomster och skatter
154 Statistisk årsbok för Åland – Statistical Yearbook of Åland 2012
9.8. Medelmånadslöner för heltidsanställda vid Ålands landskapsregering efter yrkesgrupp och kön 2010, EUR 9.8. Average monthly earnings of full-time employees of the Government of Åland by category of occupation and sex 2010, EUR
Yrkesgrupp/ Lönekvot/
Category of occupation Wage ratio
Totalt K, % M, % Totalt Kvinnor Män Totalt Kvinnor Män K/M
Totalt 1 596 61,5 38,5 3 105 2 913 3 411 3 301 2 971 3 827 0,78
Chefer och högre tjänste-
män/Legislators, senior
officials and managers 78 50,0 50,0 4 339 4 161 4 517 4 401 4 217 4 585 0,92
Specialister/Professionals 445 55,7 44,3 3 820 3 561 4 147 4 091 3 689 4 597 0,80
Experter/Technicians and
associate professionals 538 65,4 34,6 3 047 2 872 3 380 3 258 2 907 3 923 0,74
Kontorspersonal o personal
inom kundservice/Clerks 93 94,6 5,4 2 403 .. .. 2 418 .. .. ..
Service-, försäljn- o omsorgs-
pers/Service workers, shop
and market sales workers 128 85,2 14,8 2 562 2 581 2 454 2 648 2 643 2 673 0,99
Jord- o skogsbr, fiskodl,
fiskare m.fl/Skilled agricul-
tural and fishery workers 20 35,0 65,0 2 258 2 331 2 218 2 343 2 476 2 272 1,09
Byggn-, reparations- o
tillv.arb/Craft and related
trades workers 27 7,4 92,6 2 440 .. .. 2 545 .. .. ..
Process- o transportarb/
Plant and machine
operators and assemblers 88 - 100,0 2 532 - 2 532 3 059 - 3 059 ..
Övriga arbetstagare/
Elementary occupations 179 76,0 24,0 2 192 2 138 2 360 2 253 2 153 2 567 0,84
Källa/Source : ÅSUB, Lönestatistik/Statistics Åland, Salaries and Wages
Ordinarie lön, EURAntal anställda/
Employees Regular salary, EUR Totallön/Total salary

10
10. Nationalräkenskapsdata, företag och konsumentprisindex
10. National accounts, enterprises and Consumer Price Index

Nationalräkenskapsdata, företag och konsumentprisindex Detta kapitel omfattar statistik om bruttonationalprodukten, förädlingsvärde efter bransch, företagens antal och ekonomi samt konsumentprisindex. Objekt för statistiken är de ekonomiska uppgifterna inom nationalräkenskaperna, företagens bokslutsuppgifter, antal företag och arbetsställen samt konsumentprisindexets belopp och förändringstakt. Statistiken redovisas i huvudsak för hela Åland, men uppgifter om antal företag och arbetsställen finns också efter kommun och region. En utförligare beskrivning av statistikområdena inklusive definitioner av variabler finns på ÅSUBs webbplats www.asub.ax under Statistik efter ämne/Nationalräkenskaper, Företag respektive Konsumentprisindex. Källorna anges under varje tabell. Tillförlitligheten för nationalräkenskaperna är hög i och med att de baseras på dels ett heltäckande företagsbeskattningsregister där brister har kompletterats i efterhand samt dels på offentliga sektorns bokslut. Användandet av skatteregister gör dock att uppgifterna kan färdigställas först med en ganska stor eftersläpning. Företagsstatistiken baseras på företagsregistret och beskattningsregister. Vissa kontroller och bearbetningar har gjorts för att ytterligare höja kvaliteten. Konsumentprisindex tas fram genom en omfattande datainsamling. Jämförbarheten är god såväl när det gäller jämförelser över tiden som med andra statistikområden, t.ex. lönestatistik. ÅSUB publicerar konsumentprisindex månatligen samt nationalräkenskapsdata och bokslutsstatistik årligen i form av statistikmeddelanden. Dessa finns tillgängliga på ÅSUBs webbplats, där det också finns utförlig statistik om områdena i Excel- och PC-Axis-tabeller. Ansvarig för statistikområdena på ÅSUB är Jouko Kinnunen, [email protected]
National accounts, enterprises and Consumer Price Index This chapter includes statistics on the gross domestic product, the value added by industry, the number and finances of enterprises as well as the consumer price index. More statistics on national accounts, enterprises and the consumer price index are available at the website of Statistics Åland, www.asub.ax, in Excel-tables and PC-Axis-databases in English. Contact person is Jouko Kinnunen, [email protected]

Nationalräkenskapsdata, företag och konsumentprisindex
Statistisk årsbok för Åland – Statistical Yearbook of Åland 2012 157
10.1. Bruttonationalprodukten 1975-2010, MEUR 10.1. Gross domestic product 1975-2010, MEUR
Figur 10.1. BNP per capita 1975-2010, fasta priser Figure 10.1. GDP per capita 1975-2010, fixed prices
År/Year Löpande priser/ Fasta priser/ Förändring/Change 1) BNP per capita/
Current prices Fixed prices Procent GDP per capita 1)
1975 98,4 436,2 .. 19 6001976 119,0 460,4 5,5 20 6001977 133,2 457,3 -0,7 20 4001978 148,5 474,4 3,7 21 1001979 189,5 564,7 19,0 25 0001980 211,2 563,7 -0,2 24 8001981 230,9 550,3 -2,4 24 0001982 255,1 556,2 1,1 24 1001983 263,4 529,1 -4,9 22 7001984 282,8 531,2 0,4 22 6001985 327,6 580,8 9,4 24 6001986 .. .. .. ..1987 .. .. .. ..1988 .. .. .. ..1989 482,5 712,9 .. 29 5001990 555,5 771,9 8,3 31 6001991 657,2 880,1 14,0 35 6001992 606,4 791,2 -10,1 31 7001993 569,2 726,0 -8,2 29 0001994 624,5 790,3 8,9 31 5001995 638,7 803,1 1,6 31 9001996 671,1 843,6 5,0 33 4001997 767,2 949,3 12,5 37 5001998 808,4 982,4 3,5 38 5001999 847,4 1 020,8 3,9 39 8002000 886,2 1 037,6 1,6 40 3002001 906,1 1 037,2 0,0 40 1002002 904,9 1 014,7 -2,2 38 8002003 938,9 1 046,1 3,1 39 8002004 962,8 1 071,1 2,4 40 5002005 1 018,9 1 123,6 4,9 42 2002006 1 067,9 1 156,5 2,9 43 1002007 1 138,2 1 211,6 4,8 44 8002008 1 064,9 1 087,8 -10,2 39 8002009 1 133,8 1 155,7 6,2 41 9002010 1 172,2 1 172,2 1,4 42 100
Not/Note : Fasta priser enligt referensår 2010. Reviderade uppgifter/Fixed prices according to reference year 2010.
Revised figures. 1) Beräknat på fasta priser/Calculated on fixed prices.Källa/Source : ÅSUB Nationalräkenskaper/Statistics Åland, National Accounts
0
5 000
10 000
15 000
20 000
25 000
30 000
35 000
40 000
45 000
50 000
1975 1980 1985 1990 1995 2000 2005 2010
EUR

Nationalräkenskapsdata, företag och konsumentprisindex
158 Statistisk årsbok för Åland – Statistical Yearbook of Åland 2012
10.2. Bruttonationalprodukten efter näringsgren 2010 10.2. Gross domestic product by industry 2010
Näringsgren/Industry MEUR %
Näringslivet/Industries 837,2 77,5A Jord- o skogsbruk, fiske/Agriculture, forestry, fishing 28,2 2,6B Utvinning av mineral/Mining and quarrying 0,9 0,1C Tillverkning/Manufacturing 59,1 5,5D Försörjning av el, gas, värme och kyla/Electricity, gas, steam and air conditioning supply 14,6 1,4E Vattenförsörjning, avloppsrening, avfallshantering och sanering/Water supply,
sewerage, waste management and remediation activities 6,6 0,6F Byggverksamhet/Construction 48,1 4,5G Handel; reparation av motorfordon och motorcyklar/Wholesale and retail trade,
repair of motor vehicles and motorcycles 81,0 7,5H Transport och magasinering/Transportation and storage 275,2 25,5
därav Sjötransport/of which Water transport 233,8 21,6I Hotell- och restaurangverksamhet/Accomodation and food service activities 19,7 1,8J Informations- och kommunikationsverksamhet/Information and communication 41,0 3,8K Finans- och försäkringsverksamhet/Financial and insurance activities 67,0 6,2L Fastighetsverksamhet/Real estate actitivites 115,0 10,6M Verksamhet inom juridik, ekonomi, vetenskap och teknik/Professional, scientific
and technical activities 33,1 3,1N Uthyrning, fastighetsservice, resetjänster och andra stödtjänster/Administrative
and support service activities 5,7 0,5O Offentlig förvaltning och försvar, obligatorisk socialförsäkring/Public administration
and defence, compulsory social security 0,0 0,0P Utbildning/Education 0,8 0,1Q Vård och omsorg, sociala tjänster/Human health and social work activities 7,9 0,7R Kultur, nöje och fritid/Arts, entertainment and recreation 27,1 2,5S Annan serviceverksamhet/Other service activities 6,2 0,6T Förvärvsarbete i hushåll, hushållens produktion av diverse varor och tjänster för
eget bruk/Activities of households as employers, undifferentiated goods- andservices-producing activities of households for own use 0,0 0,0
U Verksamhet vid internationella organisationer, utländska ambassader o.d./Activities of extraterritorial organisations and bodies 0,0 0,0
X Näringsgren okänd/Industry unknown 0,0 0,0
Turistsektorn/Tourism sector 238,7 22,1Landturism/Land-based tourism 33,1 3,1Sjöturism/Sea-based tourism 205,6 19,0
Offentlig verksamhet, totalt/Government services total 228,7 21,2Landskapet, kommunerna och kommunalförbunden/Government of Åland and municipalities 205,7 19,0E Vattenförsörjning, avloppsrening, avfallshantering och sanering/Water supply,
sewerage, waste management and remediation activities 0,4 0,0H Transport och magasinering/Transportation and storage 15,4 1,4O Offentlig förvaltning/Public administration 43,4 4,0P Utbildning och forskning/Education and research 44,6 4,1Q Vård och omsorg, sociala tjänster/Human health and social work activities 93,1 8,6R Kultur, nöje och fritid/Arts, entertainment and recreation 8,7 0,8Statens verksamhet/Central government 1) 22,9 2,1
Icke-vinstsyftande verksamhet/Non-profit institutions 1) 14,4 1,3
Hushållstjänster/Households 1) 0,2 0,0
Bruttonationalprodukt till baspris/GDP at producer's price 1 080,4 100,0Indirekta skatter/Indirect taxes 140,6Subventioner/Subsidies -48,8
Bruttonationalprodukt till marknadspris/GDP at market price 1 172,2Not/Note: Näringsgrensklassif ikationen reviderades 2008 varför uppgifterna inte är jämförbara med tidigare år/As the industrial
classification was updated in 2008, the industrial data are not entirely comparable with previously published figures1)Preliminära uppgifter/Preliminary figures
Källa/Source : ÅSUB Nationalräkenskaper/Statistics Åland, National Accounts

Nationalräkenskapsdata, företag och konsumentprisindex
Statistisk årsbok för Åland – Statistical Yearbook of Åland 2012 159
10.3. Bruttonationalprodukten i löpande priser 2000-2010, MEUR 10.3. Gross domestic product in current prices 2000-2010, MEUR
Figur 10.2. BNP efter näringsgren 2010 Figure 10.2. GDP by industry 2010
2000 2004 2005 2006 2007 2008 2009 2010
Bruttonationalprod. till marknadspris/
GDP at market prices 887 963 1 019 1 068 1 138 1 133 1 134 1 172Löner/Wages and salaries 347 383 408 420 446 485 489 510
Arbetsgivarnas socialförsäkringsavgifter/
Employers´ contribution to social security 89 103 108 112 119 127 115 115
Driftsöverskott/Operating surplus 235 257 267 327 366 265 255 254
Kapitalförslitning/Fixed capital depreciation 130 140 163 134 122 191 199 201
Indirekta skatter/Indirect taxes 110 117 127 134 143 130 137 141
Minus subventioner/Less subsidies -23 -38 -54 -58 -58 -63 -61 -49
Procent/Per centLöner/Wages and salaries 39,1 39,8 40,0 39,3 39,2 42,8 43,1 43,5
Arbetsgivarnas socialförsäkringsavg./
Employers´ contribution to social security 10,1 10,7 10,6 10,4 10,4 11,2 10,1 9,8
Driftsöverskott/Operating surplus 26,5 26,7 26,2 30,6 32,2 23,3 22,5 21,7
Kapitalförslitning/Fixed capital depreciation 14,6 14,6 16,0 12,5 10,7 16,9 17,6 17,2
Indirekta skatter/Indirect taxes 12,4 12,2 12,5 12,6 12,5 11,5 12,1 12,0Minus subventioner/Less subsidies -2,6 -3,9 -5,3 -5,5 -5,1 -5,6 -5,4 -4,2
Källa/Source : ÅSUB Nationalräkenskaper/Statistics Åland, National Accounts
0 50 100 150 200 250
Jord- o skogsbruk, fiske/Agriculture,fishing
Industri/Industry
Byggverksamhet/Construction
Handel/Trade
Sjötransport/Sea transport
Övrig transport/Other transport
Hotell- o restaurang/Hotels andrestaurants
Finans, försäkring/Financial,insurance
Fastighetsverksamhet/Real estate
Övriga tjänster/Other services
MEUR, 2010-års priser/MEUR, 2010-year's prices
Bransch/Industry

Nationalräkenskapsdata, företag och konsumentprisindex
160 Statistisk årsbok för Åland – Statistical Yearbook of Åland 2012
10.4. Resultat- och balansräkning för företag inom näringslivet efter näringsgren 2010 10.4. Profit and loss account and balance sheet of business enterprises by industry 2010
Partihan- Detalj- Sjö- Övr tr./ Hot. o. Före- Person-Tillv.ind/ Byggv./ del/Who- handel/ transp./ Other rest./ tagstj./ liga tj./
Manufact. Constr. les.trade Retail Sea transp. Hotels Business Personaltrade transp. services services
Basdata/Basic dataAnt. föret./Numb. of enterpr. 102 119 90 169 22 35 88 191 72Ant. anst./Numb. of empl. 890 630 430 690 2 630 530 440 790 270
Resultaträkningsposter, 1 000 EUR/Income Statement, 1 000 EUROmsättning/Turnover 275 304 103 696 290 002 221 847 836 630 84 091 35 863 123 823 39 057+ Övriga rörelseinkomster/
Other operating charges 4 126 3 357 7 420 3 459 35 219 2 950 2 254 19 375 1 713= Rörelseintäkter totalt/
Total operating income 279 430 107 053 297 422 225 306 871 849 87 041 38 117 143 198 40 770- Material och tjänster totalt/
Goods and services -137 751 -61 538 -223 005 -169 406 -246 364 -29 735 -11 281 -44 838 -17 447- Personalkostnader totalt/
Personnel expenses, total -51 753 -26 760 -21 101 -23 394 -157 555 -21 733 -13 737 -39 841 -11 511- Avskrivn. och nedskrivn./
Depreciation and reduction -16 160 -3 714 -3 628 -2 232 -62 390 -5 889 -1 687 -6 285 -1 929- Övriga rörelsekostnader/
Other operating expenses -49 396 -10 295 -31 117 -18 975 -371 579 -23 241 -9 853 -19 835 -8 844= Rörelsevinst (-förlust)/
Operating profit (-loss) 24 370 4 746 18 571 11 299 33 961 6 443 1 559 32 399 1 039+/-Finansiella int. och kostn./
Financial income and exp. -3 345 1 035 2 126 -569 -7 696 -225 -419 4 173 180+/-Extraordinära poster totalt/
Total extraordinary incomeand exp. 367 2 059 4 279 -3 070 0 360 -17 -2 006 100
+/-Bokslutsdispos. totalt/Year-end adjustments -131 242 -140 -154 -6 666 -1 757 28 -49 58
- Direkta skatter totalt/Total direct taxes -5 148 -1 650 -4 259 -1 623 -6 331 -1 449 -247 -4 252 -737
Räkenskapsperiodens vinst 16 114 6 433 20 577 5 882 13 268 3 370 904 30 264 641
(-förlust)/Profit/loss for the acc.period
Balansräkningsposter, 1 000 EUR/Balance sheet, 1 000 EUR
Aktiva/Assets 640 968 112 511 229 121 111 330 964 125 72 360 40 537 116 465 35 836Summa tillgångar/Total assets 158 352 23 464 45 259 27 680 545 460 43 391 27 038 36 207 9 654Placeringar totalt/Investments 260 489 22 799 49 520 28 457 89 885 4 874 3 344 30 060 8 641Omsättn.tillg./Inventories 34 104 30 971 39 100 21 985 17 355 831 3 189 4 019 3 565Fordringar totalt/Receivables, tot. 167 698 19 580 74 223 16 510 146 254 14 680 4 681 20 114 3 006Finansiella värdepapper/Financial asset securities 570 4 137 5 726 3 0 606 15 3 679 802Kassa och banktillg.hav./Cash and bank deposits 19 756 11 560 15 293 16 695 165 171 7 978 2 269 22 386 10 167
Passiva/Liabilities 640 968 112 511 229 121 111 330 964 125 72 360 40 537 116 464 35 836Eget kapital/Total equity 232 521 54 217 122 387 40 950 230 593 44 084 5 714 68 085 12 165Ackum. bokslutsdisp./Acc. appropriations 40 354 707 2 220 3 509 259 677 4 762 308 4 346 153Oblig. reserveringar tot./Reserves 128 362 0 0 0 0 0 119 7Främmande kapital tot./Liab ilities 367 965 57 224 104 514 66 871 473 854 23 513 34 514 43 915 23 511
Not/Note: På grund av att näringsgrensindelningen uppdaterades 2008 är inte de branschvisa uppgifterna helt jämförbara med tidigareår/As the industrial classification was updated in 2008, the industrial data are not entirely comparable with previously publishedfigures.
Källa/Source : ÅSUB Bokslutsstatistik/Statistics Åland, Annual Accounts

Nationalräkenskapsdata, företag och konsumentprisindex
Statistisk årsbok för Åland – Statistical Yearbook of Åland 2012 161
10.5. Ekonomiska nyckeltal efter näringsgren 2010 10.5. Business ratios by industry 2010
Nyckeltal/ Parti- Detalj- Sjö- Övr tr./ Hot o. Före- Person-Ratios Tillv.ind/ Byggv./ handel/ handel/ transp./ Other rest/ tagstj./ liga tj./
Manufact. Constr. Wholes. Retail Sea transp. Hotels Business Personal trade trade transp. services services
Avkastningsprocent
på investerat kapital/
Return on investment, % 5,5 6,8 10,6 13,7 3,9 9,6 5,4 40,4 4,8
Skuldränta/
Interest rate on debts 1,5 0,9 1,8 1,7 2,4 1,2 1,8 1,1 2,1
Driftsbidrag i procent/
Operating margin, % 14,5 7,9 7,5 6,0 11,1 14,2 8,5 27,5 7,3
Rörelseresultatprocent/
Operating profit, % 8,7 4,4 6,3 5,0 3,9 7,4 4,1 23,0 2,6
Nettoresultatprocent/
Net result, % 5,7 3,9 5,5 4,0 2,3 5,5 2,4 23,0 1,2
Personalkostnader
i procent av oms./
Personnel exp., % of turnover 18,8 25,8 7,3 10,5 18,8 25,8 38,3 32,2 29,5
Soliditet/Equity ratio 42,6 48,8 54,4 39,9 50,9 67,5 14,9 62,2 34,4
Kassalikviditet/Quick ratio 1,8 0,8 1,6 0,8 1,6 1,3 0,6 1,6 1,4
Balanslikviditet/Current ratio 2,1 1,5 2,3 1,4 1,7 1,3 0,8 1,7 1,7
Not/Note: På grund av att näringsgrensindelningen uppdaterades 2008 är inte de branschvisa uppgifterna helt jämförbara medtidigare år/As the industrial classification was updated in 2008, the industrial data are not entirely comparable with previouslypublished figures. Se ÅSUBs hemsida, w w w .asub.ax, för definitioner/See ÅSUB's homepage, www.asub.ax, for definitionsKälla/Source : ÅSUB Bokslutsstatistik/Statistics Åland, Annual Accounts
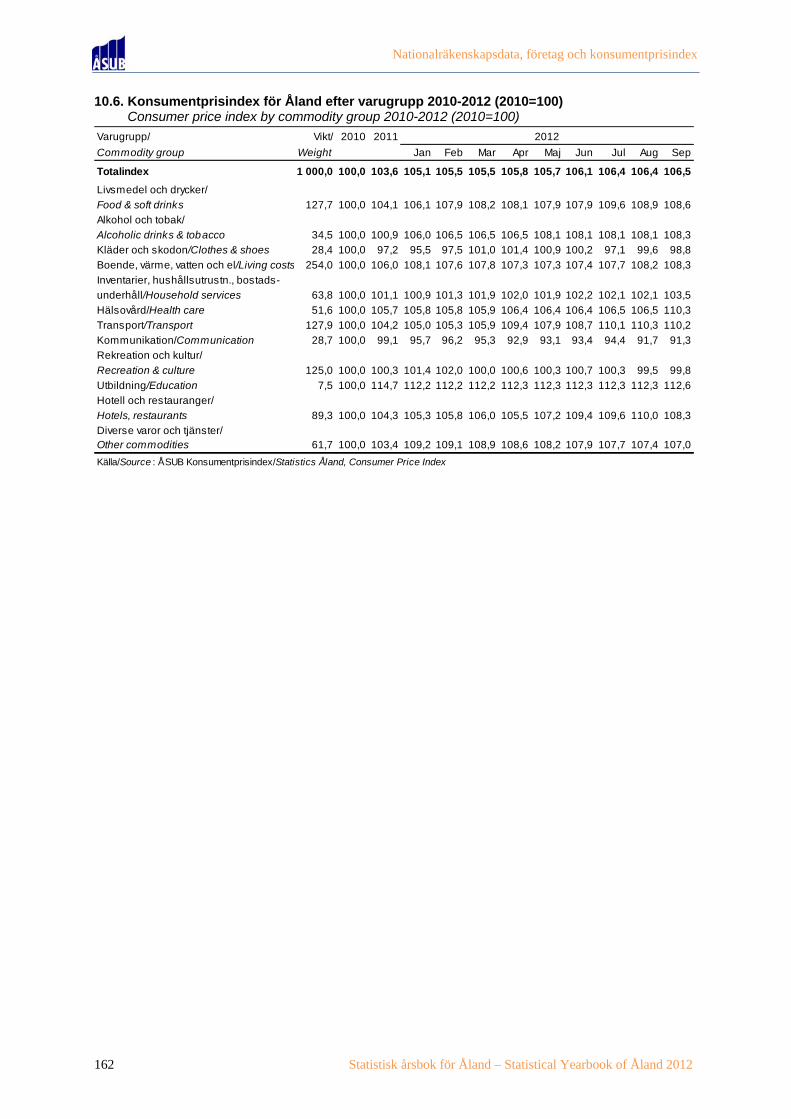
Nationalräkenskapsdata, företag och konsumentprisindex
162 Statistisk årsbok för Åland – Statistical Yearbook of Åland 2012
10.6. Konsumentprisindex för Åland efter varugrupp 2010-2012 (2010=100) 10.6. Consumer price index by commodity group 2010-2012 (2010=100)
Varugrupp/ Vikt/ 2010 2011
Commodity group Weight Jan Feb Mar Apr Maj Jun Jul Aug Sep
Totalindex 1 000,0 100,0 103,6 105,1 105,5 105,5 105,8 105,7 106,1 106,4 106,4 106,5
Livsmedel och drycker/
Food & soft drinks 127,7 100,0 104,1 106,1 107,9 108,2 108,1 107,9 107,9 109,6 108,9 108,6
Alkohol och tobak/
Alcoholic drinks & tobacco 34,5 100,0 100,9 106,0 106,5 106,5 106,5 108,1 108,1 108,1 108,1 108,3
Kläder och skodon/Clothes & shoes 28,4 100,0 97,2 95,5 97,5 101,0 101,4 100,9 100,2 97,1 99,6 98,8
Boende, värme, vatten och el/Living costs 254,0 100,0 106,0 108,1 107,6 107,8 107,3 107,3 107,4 107,7 108,2 108,3
Inventarier, hushållsutrustn., bostads-
underhåll/Household services 63,8 100,0 101,1 100,9 101,3 101,9 102,0 101,9 102,2 102,1 102,1 103,5
Hälsovård/Health care 51,6 100,0 105,7 105,8 105,8 105,9 106,4 106,4 106,4 106,5 106,5 110,3
Transport/Transport 127,9 100,0 104,2 105,0 105,3 105,9 109,4 107,9 108,7 110,1 110,3 110,2
Kommunikation/Communication 28,7 100,0 99,1 95,7 96,2 95,3 92,9 93,1 93,4 94,4 91,7 91,3
Rekreation och kultur/
Recreation & culture 125,0 100,0 100,3 101,4 102,0 100,0 100,6 100,3 100,7 100,3 99,5 99,8
Utbildning/Education 7,5 100,0 114,7 112,2 112,2 112,2 112,3 112,3 112,3 112,3 112,3 112,6
Hotell och restauranger/
Hotels, restaurants 89,3 100,0 104,3 105,3 105,8 106,0 105,5 107,2 109,4 109,6 110,0 108,3
Diverse varor och tjänster/ Other commodities 61,7 100,0 103,4 109,2 109,1 108,9 108,6 108,2 107,9 107,7 107,4 107,0
Källa/Source : ÅSUB Konsumentprisindex/Statistics Åland, Consumer Price Index
2012

Nationalräkenskapsdata, företag och konsumentprisindex
Statistisk årsbok för Åland – Statistical Yearbook of Åland 2012 163
10.7. Konsumentprisindex för Åland 1985-2012 (1985=100) 10.7. Consumer price index 1985-2012 (1985=100)
Figur 10.3. Inflationen månadsvis på Åland 1986-2012 Figure 10.3. Monthly inflation in Åland 1986-2012
År/Year Jan Feb Mar Apr Maj Jun Jul Aug Sep Okt Nov Dec Jan-Dec
1985 98,5 98,5 99,5 99,9 100,2 100,2 100,4 100,3 100,7 100,5 100,8 100,7 100,01986 101,3 101,5 101,4 101,7 101,7 102,3 102,2 102,6 102,9 103,0 102,8 103,0 102,21987 104,2 104,7 105,0 106,1 105,8 106,2 106,6 106,5 107,0 107,1 107,0 107,3 106,11988 108,8 109,0 109,8 110,6 111,7 112,4 112,4 112,4 113,5 113,5 113,5 114,7 111,81989 115,1 115,9 117,3 118,4 119,1 120,7 120,9 121,0 122,6 122,6 122,6 123,8 120,01990 125,1 125,5 125,5 126,2 127,2 127,6 128,1 128,7 129,2 129,5 129,1 129,2 127,61991 130,9 131,7 131,4 132,0 133,0 132,3 132,8 132,8 132,8 133,1 132,5 133,2 132,41992 133,8 134,1 134,7 135,4 135,7 136,3 136,4 136,2 136,7 137,5 137,7 136,8 135,91993 138,0 138,8 139,0 139,4 139,4 138,9 139,0 138,8 139,0 139,5 139,0 138,6 139,01994 138,6 138,9 139,0 139,5 139,6 140,7 140,7 140,8 140,8 141,2 140,9 140,7 140,11995 141,0 141,2 141,0 141,0 141,3 141,4 141,5 140,9 141,2 140,9 140,8 140,7 141,01996 140,4 141,0 141,2 141,2 141,2 140,7 141,3 141,0 141,2 141,3 141,0 140,8 141,01997 141,8 141,9 141,8 142,4 142,9 142,8 143,3 143,8 144,2 144,7 144,5 144,5 143,31998 145,2 144,9 145,9 145,7 145,9 146,6 146,7 146,6 146,2 146,2 145,9 145,6 145,91999 146,0 145,6 145,9 146,6 147,4 147,3 147,6 147,2 147,6 148,0 148,1 148,9 147,22000 149,1 149,4 150,0 150,1 150,8 151,4 152,1 152,3 153,4 153,0 152,8 152,7 151,42001 153,1 153,7 153,8 154,5 155,7 155,7 155,2 155,7 155,8 155,5 155,1 155,2 154,92002 156,8 156,7 157,6 158,1 158,4 158,1 157,8 158,6 159,2 159,1 158,3 158,7 158,12003 159,0 159,5 159,8 159,2 159,1 159,0 158,4 159,3 158,9 159,4 158,9 159,0 159,12004 159,0 159,7 158,8 158,7 159,3 159,2 159,5 159,8 160,2 160,0 159,1 159,0 159,42005 158,9 159,2 160,1 160,5 160,3 160,7 161,2 161,3 161,5 162,2 161,7 161,8 160,82006 162,2 162,7 162,7 163,9 163,9 164,6 164,7 164,4 163,7 163,7 164,0 164,1 163,72007 163,3 164,6 166,1 166,6 166,2 167,1 167,2 167,0 166,9 167,1 167,8 168,8 166,62008 170,5 172,0 173,6 173,6 174,5 175,4 175,3 174,4 175,1 174,4 172,2 171,6 173,62009 172,1 172,8 173,1 173,7 173,8 175,0 174,7 174,8 175,5 174,1 173,9 173,9 173,92010 174,5 175,8 176,3 176,9 176,9 177,6 177,8 177,9 178,0 177,5 178,2 179,7 177,32011 181,1 181,7 183,3 184,0 183,5 184,3 184,6 184,6 184,1 184,3 184,4 183,7 183,62012 186,3 186,9 187,0 187,5 187,4 188,0 188,6 188,6 188,8
Källa/Source : ÅSUB Konsumentprisindex/Statistics Åland, Consumer Price Index
-2,0
-1,0
0,0
1,0
2,0
3,0
4,0
5,0
6,0
7,0
8,0
9,0
10,0
1986 1988 1990 1992 1994 1996 1998 2000 2002 2004 2006 2008 2010 2012
Procent

Nationalräkenskapsdata, företag och konsumentprisindex
164 Statistisk årsbok för Åland – Statistical Yearbook of Åland 2012
10.8. Antal företag efter bransch och kommun 2011 10.8. Enterprises by industry and municipality 2011
10.9. Antal företag efter bransch och personalens storleksklass 2011 10.9. Enterprises by industry and number of employees 2011
Kommun Jord- och Handel, Transport,
Totalt skogsbruk, Byggnads- hotellverk- post- och Finans,förs Övrigafiske/ Industri/ verks./ samhet m.m/ tele, IT o fastigh/ tjänster/
Agriculture, Industry Construc- Trade, hotel Transport, Finance & Otherforestry and tion postal, tele- insurance services
fishing com., ITBrändö 69 6 6 14 17 10 11 5Eckerö 116 11 10 23 42 9 9 12Finström 178 15 19 46 41 18 28 11Föglö 45 3 4 10 15 4 6 3Geta 35 2 2 6 10 4 9 2Hammarland 111 12 9 24 17 14 24 11Jomala 364 14 33 94 96 36 51 40Kumlinge 46 5 2 4 15 5 10 5Kökar 29 - 1 5 10 4 8 1Lemland 133 3 6 43 34 11 25 11Lumparland 31 4 7 6 7 2 3 2Saltvik 123 11 13 24 26 11 24 14Sottunga 10 2 - 2 3 1 2 -Sund 70 5 9 21 9 6 15 5Vårdö 36 5 2 10 7 4 3 5
Mariehamn 954 5 68 107 296 109 234 135Landskomm. 1 396 98 123 332 349 139 228 127-Landsbygden 1 161 77 108 287 282 111 188 108-Skärgården 235 21 15 45 67 28 40 19
Åland 2 350 103 191 439 645 248 462 262Not/Note : Tabellen gäller företag med Åland som hemort och som har arbetsställe på Åland. Som företag räknas de som är mer-värdesskatteskyldiga eller är arbetsgivare. Offentliga myndigheter, stiftelser, idéella föreningar, bostadsaktiebolag och kyrkan ingårinte. På grund av att näringsgrensindelningen uppdaterades 2008 är inte de branschvisa uppgifterna helt jämförbara med tidigare år/In Åland registered enterprises and those who have their work places in Åland. Included enterprises are liable to pay valueadded tax or have paid empoyees. Public authorities, foundations, non-profit organisations, house-owning companies andChurch are not included. As the industrial classification was updated in 2008, the industrial data are not entirely comparablewith previously published figures.
Källa/Source : Statistikcentralen Företagsregister, ÅSUB/Statistics Finland Register of Enterprises, ÅSUB
Storleks- Jord- och Handel, Transport,
klass/ skogsbruk, Byggnads- hotellverk- post- och Finans,förs. Övriga
Size Totalt fiske/ Industri/ verks./ samhet m.m/ tele, IT/ o. fastigh./ tjänster/
group Agriculture, Industry Construc- Trade, hotel Transport, Finance & Other
forestry and tion postal, tele- insurance services
fishing com., IT
Totalt 2 350 103 191 439 645 248 462 262
0-4 2 048 94 150 390 554 203 418 239
5-9 148 7 18 22 51 18 22 10
10-19 59 - 7 12 21 7 8 4
20-49 43 1 10 6 12 9 2 3
50-99 10 - 1 1 3 2 2 1
100-249 9 - 2 - 1 5 - 1
250+ 2 - - - - 1 1 -
Okänt/Unknown 31 1 3 8 3 3 9 4
Not/Note: På grund av att näringsgrensindelningen uppdaterades 2008 är inte de branschvisa uppgifterna helt jämförbara med tidigare år/As the industrial classification was updated in 2008, the industrial data are not entirely comparable with previouslypublished figures.
Källa/Source : Statistikcentralen Företagsregister, ÅSUB/Statistics Finland Register of Enterprises, ÅSUB

Nationalräkenskapsdata, företag och konsumentprisindex
Statistisk årsbok för Åland – Statistical Yearbook of Åland 2012 165
10.10. Arbetsställen efter storleksklass och kommun 2011 10.10. Work places by size group and municipality 2011
10.11. Antal nya och nedlagda företag efter näringsgren 2005-2011 10.11. Enterprises opening and closing by industry 2005-2011
Kommun Storleksklass efter antal anställda/Size group (number of employees)
Totalt 0-4 5-9 10-19 20-49 50-249 250+ Okänt 1)
Brändö 75 71 1 1 1 - - 1Eckerö 122 114 3 2 - - - 3Finström 184 169 7 4 - 1 - 3Föglö 48 43 3 1 1 - - -Geta 31 28 1 1 1 - - -Hammarland 104 96 5 2 - - - 1Jomala 360 296 31 14 11 2 - 6Kumlinge 49 48 1 - - - - -Kökar 24 23 1 - - - - -Lemland 122 112 6 1 - - - 3Lumparland 31 26 4 - - - - 1Saltvik 124 116 6 - 1 1 - -Sottunga 11 11 - - - - - -Sund 69 63 2 - 1 - - 3Vårdö 36 33 2 - - - - 1
Mariehamn 1 191 968 104 54 32 14 1 18
Landskomm. 1 390 1 249 73 26 16 4 - 22-Landsbygden 1 147 1 020 65 24 14 4 - 20-Skärgården 243 229 8 2 2 - - 2
Åland 2 581 2 217 177 80 48 18 1 401) Unknown.Not/Note : Offentliga myndigheter ingår inte. Arbetsställen tillhörande bolag vars hemvist är utanför Åland ingår/Public authoritiesare not included. Work places belonging to firms registered outside Åland are included.Källa/Source : Statistikcentralen Företagsregister, ÅSUB/Statistics Finland Register of Enterprises, ÅSUB
Nya företag/New enterprises Nedlagda företag/Closed enterprisesNäringsgren/Industry 2005 2009 2010 2011 2005 2009 2010 2011Totalt 223 189 220 198 145 159 111 114Primärnäringar/Agriculture 5 5 7 15 2 6 5 4Industri/Industry 14 17 7 12 10 11 4 8Byggverks./Construction 37 27 23 31 17 23 21 16Handel/Trade 57 41 41 25 39 35 30 26Transport och magasinering/Transportation and storage 11 10 7 12 6 11 3 7Hotell o rest./Hotels and restaurants 13 16 23 19 17 15 8 12Informations- och komm.verks./Information and communication 7 7 13 6 8 6 6 1Finansiell verksamhet/Financial business 4 6 2 4 3 3 2 -Företagstjänster/Business services 50 33 64 47 23 26 21 27Personliga tjänster/Personal services 25 27 33 27 20 23 11 13
Not/Note : Siffrorna är reviderade. Enligt den nya näringsgrensindelningen NI2008, ej jämförbar med tidigare publicerade uppgifter/
The figures are revised. According to the new industrial classification NI2008, not comparable with previously published figures.
Källa/Source : Statistikcentralen Företagsregister, ÅSUB/Statistics Finland Register of Enterprises, ÅSUB


11
11. Offentlig ekonomi 11. Public finance
Personal/Personnel
Material/Materials
Köp av tj/Services
Övriga utg./Other
Landskapets verksamhetsutgifter efter slag 2011
Expenses of the Government of Åland by group 2011
Personal/Personnel
Material/Materials
Köp av tj/Services
Övriga utg./Other
Kommunernas verksamhetsutgifter efter slag 2011
Expenses of the municipalities by group 2011

Offentlig ekonomi Statistiken om offentlig ekonomi omfattar uppgifter om landskapet Ålands bokslut samt om den kommunala sektorns bokslut och beskattning. Objekt för statistiken är de ekonomiska uppgifterna: inkomster, utgifter, balansposter och relationstal. Uppgifterna presenteras i huvudsak för hela Åland, men statistiken för den kommunala sektorn redovisas till en del också efter kommun och region. En utförligare beskrivning av statistiken om offentlig ekonomi inklusive definitioner av variabler finns på ÅSUBs webbplats www.asub.ax under Statistik efter ämne/Offentlig ekonomi. Källorna anges under varje tabell. Tillförlitligheten är hög i och med att statistiken baseras på slutliga bokslutsuppgifter. Jämförbarheten över tiden är god. ÅSUB publicerar årligen en statistikrapport om den kommunala sektorns ekonomi och verksamhet. Rapporten kan beställas från ÅSUB och finns också tillgänglig på ÅSUBs webbplats, där det även finns ett antal statistikmeddelanden samt data om den offentliga ekonomin i form av Excel- och PC-Axis-tabeller. Under temaområdet ”Kommunala sektorn” finns förutom statistik också utredningsrapporter som behandlar det kommunala området. Ansvarig för statistiken om offentlig ekonomi på ÅSUB är Iris Åkerberg, [email protected].
Public finance The statistics on public finance include data on the final accounts of the Government of Åland as well as the final accounts and taxation of the municipalities. More statistics on this subject area are available at the website of Statistics Åland, www.asub.ax, in Excel-tables and PC-Axis-databases in English. Contact person is Iris Åkerberg, [email protected]

Offentlig ekonomi
Statistisk årsbok för Åland – Statistical Yearbook of Åland 2012 169
11.1. Landskapet Ålands inkomster och utgifter 2010-2011 11.1. Revenue and expenditure of the Government of Åland 2010-2011
Inkomster/Revenues Budget/Budget Utgifter/Expenditure 1 000 EUR 1 000 EUR Procent
2010 2011 2010 2011 2010 2011
Inkomster/Revenues 308 653 324 939 272 100 301 471 100,0 100,0
Inkomster av blandad natur/
Miscellaneous revenues 52 326 54 145 53 322 54 077 19,6 17,9
Skatter och avgifter av skattenatur,
inkomster av lån och finansiella poster/
Taxes and eq., loans and finance revenue 256 327 270 794 218 778 247 394 80,4 82,1
Utgifter/Expenditure 308 653 324 939 304 446 318 970 100,0 100,0
Lagtinget/The Legislative Assembly 2 775 2 836 2 770 2 834 0,9 0,9
Landskapsregeringen/
The Government of Åland 2 597 2 818 2 556 2 696 0,8 0,8
Kansliavdelningens förvaltningsområde/
Chancery Dept. 17 567 15 271 17 398 15 004 5,7 4,7
Finansavdelningens förvaltningsområde/
Dept. of Finance 38 343 39 211 35 691 35 830 11,7 11,2
Social- och miljöavdelningens
förvaltningsområde/
Dept. of Social and Environmental affairs 116 423 119 701 116 054 118 983 38,1 37,3
Utbildnings- och kulturavdelningens
förvaltningsområde/
Dept. of Education and Culture 57 629 56 526 57 354 55 836 18,8 17,5
Näringsavdelningens förvaltningsområde/
Dept. of Trade and Industry 24 323 22 454 23 454 21 656 7,7 6,8
Trafikavdelningens förvaltningsområde/
Dept. of Communications 31 098 33 395 31 112 33 303 10,2 10,4
Skatter och avgifter av skattenatur,
inkomster av lån och finansiella poster/
Taxes and eq., loans and finance revenue 17 898 32 727 18 057 32 828 5,9 10,3
Underskott/Överskott/Deficit/Surplus -32 346 -17 499 -10,6 -5,5
Källa/Source : LR Bokslut/The Government of Åland, Final Accounts
Bokslut/Financial statements

Offentlig ekonomi
170 Statistisk årsbok för Åland – Statistical Yearbook of Åland 2012
11.2. Landskapet Ålands utgifter 1980-2011, 1 000 EUR 11.2. Expenditure of the Government of Åland 1980-2011, 1 000 EUR
Figur 11.1. Landskapet Ålands utgifter 1980-2011, procentuell fördelning efter huvudtitel Figure 11.1. Expenditure of the Government of Åland by department 1980-2011, per cent
Avdelning/Department 1980 1985 1990 1995 2000 2005 2010 2011
Utgifter totalt/Total expenditure 40 065 66 683 103 360 169 596 234 185 266 216 304 446 318 970
Social- och miljöavdelningen/
Social, environment 7 473 16 156 29 207 56 579 74 183 90 902 116 054 118 983
Utbildnings- o. kulturavdelningen/
Education, Culture 9 877 17 442 22 811 27 361 46 593 50 195 57 354 55 836
Näringsavdelningen/
Trade, Industry 5 824 8 293 12 957 18 988 22 828 22 087 23 454 21 656
Trafikavdelningen/
Communications 9 430 14 495 18 769 21 967 24 457 25 266 31 112 33 303
Övriga/Other 7 461 10 296 19 616 44 702 66 124 77 766 76 473 89 192
Källa/Source : LR Bokslut/The Government of Åland, Final Accounts
0
5
10
15
20
25
30
35
40
45
1980 1985 1990 1995 2000 2005 2006 2007 2008 2009 2010 2011
Procent
Social- o. miljöavd./Soc.,Environm.
Övriga/Other
Utbildnings- o. kulturavd./Educ.,Cult.
Trafikavdelningen/Communications
Näringsavdelningen/Trade, Industry

Offentlig ekonomi
Statistisk årsbok för Åland – Statistical Yearbook of Åland 2012 171
11.3. Sammandrag av landskapet Ålands resultaträkning 2008-2011, 1 000 EUR 11.3. Profit and loss account of the Government of Åland 2008-2011, 1 000 EUR
2008 2009 2010 2011
Verksamhetens intäkter/Returns from operations 24 405 26 104 26 953 26 641Intäkter av verksamheten/Returns from operations 21 745 23 507 23 942 23 724Hyresintäkter och ersättningar/Rents and payments 1 115 1 386 1 361 1 348Verksamhetens övriga intäkter/Other returns fr. operat. 1 545 1 211 1 650 1 569
Verksamhetens kostnader/Operating costs -168 698 -163 322 -155 049 -170 819Personalkostnader/Personnel costs -104 164 -101 591 -97 995 -106 732Material och förnödenheter/Materials and equipment -20 044 -18 060 -17 954 -20 657Hyror/Rents -2 488 -2 656 -2 467 -2 353Inköp av tjänster/Purchase of services -54 369 -48 710 -44 878 -48 273Övriga kostnader/Other costs 12 368 7 696 8 244 7 196
Avskrivningar/Depreciation -10 790 -11 222 -12 369 -18 870
Finansiella intäkter/Financial yields 28 416 27 842 17 989 13 974
Finansiella kostnader/Financing costs -364 -250 -144 -166
Extraordinära intäkter/Extraordinary income 2 147 - 9 061
Extraordinära kostnader/Extraordinary costs -1 374 -2 952 -6 635 -6 926
Pensionsintäkter/Pension income 8 800 12 750 15 500 15 000
Pensionskostnader/Pension costs -17 683 -19 743 -21 051 -22 693
Överföringar/TransfersIntäkter/Income 12 158 8 044 3 527 4 529
Europeiska Unionen/European Union 6 635 4 155 3 112 4 227Övriga överföringar/Other transfers 5 523 3 889 416 302
Kostnader/Costs -95 773 -96 633 -84 812 -86 961Undervisning, kultur, idrott/Education, culture, sport -18 077 -18 379 -17 150 -18 063Social- o. hälsovård, utkomstskydd/Social welfare, health care, unemployment benefits -34 030 -37 638 -39 884 -40 122Arbetsmarknad/Labour market -375 -290 -304 -268Primärnäringar/Primary industries -12 878 -11 583 -11 292 -11 122Övrigt näringsliv/Other industries -7 932 -7 601 -3 797 -6 582Bostadsproduktion/Housing production -1 325 -851 -501 -407Allmänna stöd/General subsidies -9 910 -10 786 -6 207 -6 205Övriga överföringskostnader/Other transfers -11 247 -9 506 -5 678 -4 192
Resultat före skatter och intäkter av skattenatur/Deficit -220 901 -219 235 -216 090 -237 231
Skatter och intäkter av skattenatur/Taxes and revenues 238 669 197 363 185 476 220 390equivalent to taxesAvräkningsbelopp/Equalisation 205 901 164 486 175 029 193 510Skattegottgörelse/Tax retribution 24 198 24 033 3 158 19 768Övriga skatter och intäkter/Other taxes and revenues 8 571 8 843 7 290 7 112
Räkenskapsperiodens underskott/överskott/ 17 768 -21 872 -30 614 -16 841Deficit/surplus of the accounting period
Källa/Source : LR Bokslut/The Government of Åland, Final Accounts

Offentlig ekonomi
172 Statistisk årsbok för Åland – Statistical Yearbook of Åland 2012
11.4. Landskapet Ålands balansräkning 31.12.2008-2011, 1 000 EUR 11.4. Balance sheet of the Government of Åland 31.12.2008-2011, 1 000 EUR
2008 2009 2010 2011
Aktiva/Assets 759 346 742 415 743 044 741 869
Landskapsegendom/Governmental property 1 913 1 933 1 945 2 025
Anläggningstillgångar och övr. långfristiga fordringar/
Fixed assets and other long-term claims
Immateriella tillgångar/Intangib le assets 856 791 651 571
Materiella tillgångar/Material assets 229 549 240 629 262 539 268 652
Värdepapper ingående i anläggningstillgångar och övriga
långfristiga placeringar/Security 275 226 291 480 315 420 311 724
Förvaltade medel/Assets in custody - 329 329 -
Omsättnings- och finansieringstillgångar/Current
and liquid assets
Omsättningstillgångar/Current assets 788 795 845 847
Finansieringstillgångar/Liquid assets 69 678 68 017 65 591 66 939
Kortfristiga fordringar/Short-term claims 22 232 16 250 15 347 21 678
Värdepapper ingående i finansieringstillgångar och övriga
kortfristiga placeringar/Security 144 892 103 169 60 490 51 759
Kassa och banktillgodohavanden samt övriga
finans.tillgångar/Cash and bank deposits and other liquid assets 14 211 19 022 19 887 17 675
Passiva/Liabilities 759 346 742 415 743 044 741 869
Eget kapital/Net worth
Landskapets kapital/Net worth of Government -146 043 -175 293 -177 429 -193 370
Fondernas kapital/Net worth of funds 283 083 310 105 314 025 301 471
Penningautomatmedel/PAF advances 24 483 15 741 13 605 19 370
Obligatoriska reserveringar/Reserves 17 969 13 579 11 188 11 849
Värderingsposter/Valuation items 32 11 035 11 035 11 035
Förvaltat kapital/Capital in custody 132 466 477 185
Främmande kapital/Liabilities
Långfristigt främmande kapital/Long-term debts 552 515 537 907 543 531 557 793
Kortfristigt främmande kapital/Short-term debts 27 175 28 876 26 613 33 536
Källa/Source : LR Bokslut/The Government of Åland, Final Accounts

Offentlig ekonomi
Statistisk årsbok för Åland – Statistical Yearbook of Åland 2012 173
11.5. Kommunernas resultaträkningar 2008-2011, 1 000 EUR 11.5. Profit and loss account of municipalities 2008-2011, 1 000 EUR
2008 2009 2010 2011
Verksamhetens intäkter/Returns from operations 35 814 37 733 38 569 41 155Försäljningsintäkter/Sales revenue 23 493 24 876 25 714 26 416Avgiftsintäkter/Payment revenue 5 780 6 188 6 346 6 661Understöd och bidrag/Aids and subsidies 639 670 798 1 186Övriga intäkter/Other revenue 5 902 5 999 5 712 6 892
Verksamhetens kostnader/Operating costs -136 719 -141 063 -146 537 -152 933Löner och arvoden/Salaries and wages -54 874 -57 537 -59 803 -61 829Lönebikostnader/Other payroll costs -14 376 -14 665 -14 736 -15 270Köp av tjänster/Purchases of services -42 695 -44 349 -47 119 -48 591
Inköp under räkenskapsperioden/Purchases during the accounting period -16 021 -15 709 -15 987 -17 081
Understöd/Subsidies -7 135 -7 369 -7 410 -7 706Övriga kostnader/Other costs -1 618 -1 434 -1 482 -2 456
Verksamhetsbidrag/Operating margin -100 904 -103 335 -107 966 -111 782
Skatteintäkter/Tax revenues 84 217 84 922 86 099 92 989Kommunalskatt/Municipal tax 71 775 72 536 77 944 77 482Fastighetsskatt/Real estate tax 1 526 1 592 1 565 1 662Andel av samfundsskattens avkastning/Share of profitfrom corporate income tax 10 189 9 899 5 816 13 252Övriga skatteintäkter/Other tax revenues 727 895 775 593
Landskapsandelar/Government of Åland subsidies 37 637 41 749 37 703 38 646Allmän/General 9 615 10 635 6 077 6 186därav/of which
allmän landskapsandel/general Gov. of Åland subsidy 1 811 1 884 1 824 1 830finansieringsstöd enligt prövning/financing subsidiesas per separate trials 62 9 22 11komplettering av skatteinkomster/supplementing of tax revenues 2 327 1 897 1 848 1 904
kompensationer från landskapet/compensation from Gov. of Åland 5 415 6 845 2 383 2 441För socialväsendet/For social welfare 14 848 17 392 18 097 18 770För undervisning och kultur/For education and culture 13 172 13 720 13 525 13 693
Finansiella intäkter och kostnader/Financial yields and financing costsRänteintäkter/Income from interest 614 233 145 354Dividendintäkter/Income from dividends 13 10 10 9Övriga finansiella intäkter/Other financial yields 192 105 423 162Räntekostnader/Interest expenditure -2 311 -1 559 -1 204 -1 367Övriga finansiella kostnader/Other financing costs -655 -237 -74 -61
Årsbidrag/Annual margin 18 810 21 890 15 128 18 952Avskrivningar enligt plan/Depreciation according to plan -8 773 -9 220 -9 367 -9 831Nedskrivningar/Devaluation -17 -12 0 0Extraordinära poster/Extraordinary items -25 0 -1 -1 825
Räkenskapsperiodens resultat/Result of the accounting period 9 997 12 657 5 758 7 295Ändring av/Changes in:
avskrivningsdiff./depreciation difference -15 25 70 151reserver/reserves -1 000 -500 0 -200fonder/funds -101 -125 -34 -141
Räkenskapsperiodens överskott/Surplus of the accounting period 8 881 12 056 5 794 7 105
Källa/Source : ÅSUB Offenlig ekonomi/Statistics Åland, Public Finance
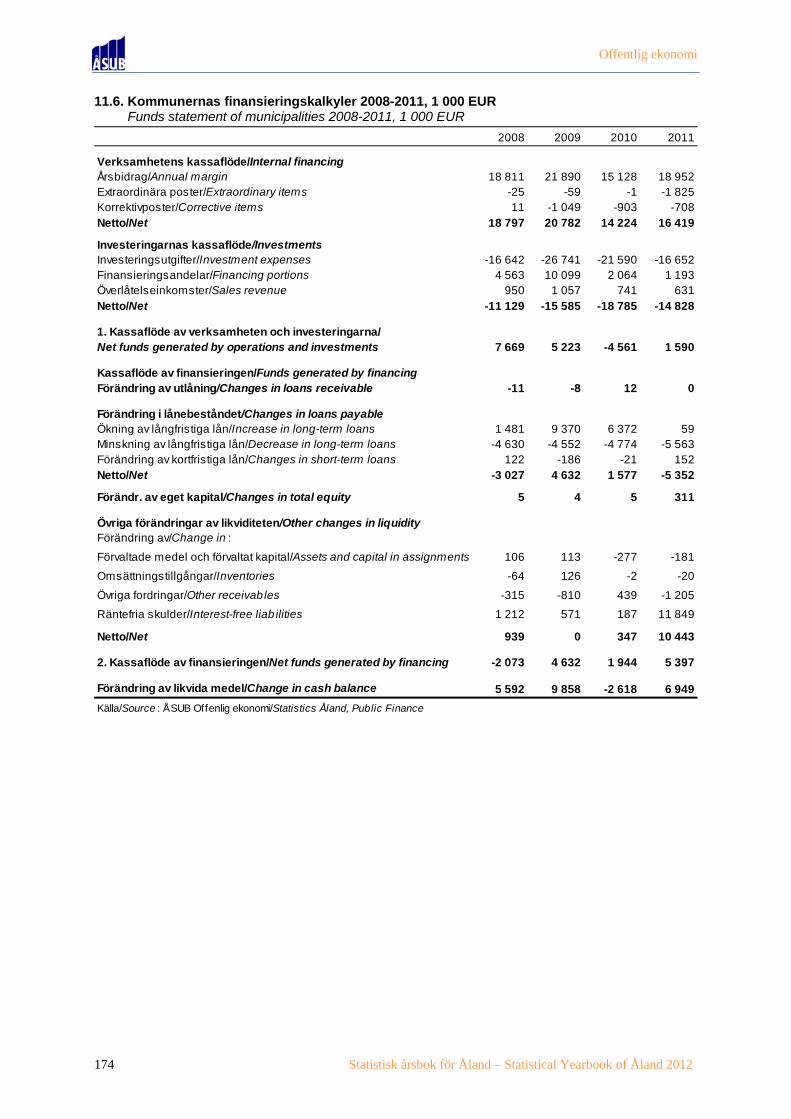
Offentlig ekonomi
174 Statistisk årsbok för Åland – Statistical Yearbook of Åland 2012
11.6. Kommunernas finansieringskalkyler 2008-2011, 1 000 EUR 11.6. Funds statement of municipalities 2008-2011, 1 000 EUR
2008 2009 2010 2011
Verksamhetens kassaflöde/Internal financingÅrsbidrag/Annual margin 18 811 21 890 15 128 18 952Extraordinära poster/Extraordinary items -25 -59 -1 -1 825Korrektivposter/Corrective items 11 -1 049 -903 -708Netto/Net 18 797 20 782 14 224 16 419
Investeringarnas kassaflöde/InvestmentsInvesteringsutgifter/Investment expenses -16 642 -26 741 -21 590 -16 652Finansieringsandelar/Financing portions 4 563 10 099 2 064 1 193Överlåtelseinkomster/Sales revenue 950 1 057 741 631Netto/Net -11 129 -15 585 -18 785 -14 828
1. Kassaflöde av verksamheten och investeringarna/ Net funds generated by operations and investments 7 669 5 223 -4 561 1 590
Kassaflöde av finansieringen/Funds generated by financingFörändring av utlåning/Changes in loans receivable -11 -8 12 0
Förändring i lånebeståndet/Changes in loans payableÖkning av långfristiga lån/Increase in long-term loans 1 481 9 370 6 372 59Minskning av långfristiga lån/Decrease in long-term loans -4 630 -4 552 -4 774 -5 563Förändring av kortfristiga lån/Changes in short-term loans 122 -186 -21 152Netto/Net -3 027 4 632 1 577 -5 352
Förändr. av eget kapital/Changes in total equity 5 4 5 311
Övriga förändringar av likviditeten/Other changes in liquidityFörändring av/Change in :
Förvaltade medel och förvaltat kapital/Assets and capital in assignments 106 113 -277 -181
Omsättningstillgångar/Inventories -64 126 -2 -20
Övriga fordringar/Other receivab les -315 -810 439 -1 205
Räntefria skulder/Interest-free liab ilities 1 212 571 187 11 849
Netto/Net 939 0 347 10 443
2. Kassaflöde av finansieringen/Net funds generated by financing -2 073 4 632 1 944 5 397
Förändring av likvida medel/Change in cash balance 5 592 9 858 -2 618 6 949
Källa/Source : ÅSUB Offenlig ekonomi/Statistics Åland, Public Finance

Offentlig ekonomi
Statistisk årsbok för Åland – Statistical Yearbook of Åland 2012 175
11.7. Kommunernas balanser 2008-2011, 1 000 EUR 11.7. Balance sheet of municipalities 2008-2011, 1 000 EUR
2008 2009 2010 2011
Aktiva/Assets 233 911 251 470 258 140 273 217
A. Bestående aktiva/Fixed assets 196 572 203 675 213 497 219 006I. Immateriella tillgångar/Intangib le assets 3 360 3 251 3 001 2 856
II. Materiella tillgångar/Material assets 173 715 180 477 190 043 195 705
1. Mark- och vattenområden/Land and water areas 17 144 17 380 17 445 17 653
2. Byggnader/Buildings 105 040 107 455 109 149 116 490
Bostadsbyggnader/Housing 19 556 16 439 13 386 12 893
Övriga byggnader/Other buildings 84 449 89 065 95 765 103 596
3. Fasta konstruktioner och anordningar/Fixed constructions, equipment 42 535 47 540 48 698 50 786
4. Maskiner och inventarier/Machines and fixtures 2 817 2 719 2 755 2 880
III. Placeringar/Investments 19 496 19 947 20 449 20 446
1. Aktier och andelar/Stocks and shares 19 456 19 896 20 253 20 249
Andelar i kommunalförbund/Shares in municipality associations 3 801 4 067 4 067 3 802
Övriga aktier och andelar/Other stocks and shares 15 538 15 829 16 187 16 446
B. Förvaltade medel/Assets in assignments 2 005 1 937 1 956 3 253
C. Rörliga aktiva/Current assets 35 335 45 855 42 689 50 956I. Omsättningstillgångar/Inventories 546 429 422 442
II. Fordringar/Receivables 11 426 12 210 11 649 12 974
III. Finansiella värdepapper/Financial asset securities 8 852 7 513 7 523 11 091
IV. Kassa och banktillgodohavanden/Cash and bank deposits 14 508 25 704 23 094 26 449
Passiva/Liabilities 233 911 251 470 258 140 273 217
A. Eget kapital/Total equity 151 641 163 791 169 463 176 999I. Grundkapital/Basic capital 92 048 110 432 110 431 110 618
II - IV Fonder/Funds 247 372 406 519
V. Över- (+)/underskott (-) från tidigare räkeskapsperioder/
Surplus (+)/deficit (-) from previous accounting periods 50 465 40 932 52 829 58 741
VI. Räkenskapsper. över-(+)/underskott(-)/Surplus/deficit fr. account. period 8 880 12 056 5 794 7 123
B. Avskrivningsdifferens o. reserver/Depreciation difference, provisions 2 902 3 355 3 418 3 467
C. Avsättningar/Appropriations 1 422 1 352 795 535
D. Förvaltat kapital/Capital in assignments 2 824 2 885 2 683 3 814
E. Främmande kapital/Liabilities 75 123 80 087 81 782 88 401I. Långfristigt/Long-term 51 869 56 792 58 857 62 501
2. Lån från finansinstitut, försäkr.inr./Loans from financial and insurance corp 33 255 30 283 29 194 25 286
3. Lån från offentliga samfund/Loans from public institutions 16 660 24 246 26 802 25 197
Från landskapet/From the Government of Åland 10 728 10 914 11 057 10 261
4. Övrigt/Other 1 956 2 263 2 859 3 450
II. Kortfristigt/Short-term 23 255 23 295 22 924 25 898
2. Lån från finansinstitut, försäkr.inr./Loans from financial and insurance corp 3 223 3 172 3 162 3 170
3. Lån från offentliga samfund/Loans from public institutions 1 169 1 189 1 219 1 327
6. Skulder till leverantörer/Accounts payable 6 353 8 264 7 952 8 222
5, 7. Övr. kortfristiga skulder/Other short-term liab ilities 4 033 2 610 2 582 2 979
8. Resultatregleringar/Adjusting entries for liab ilities 8 472 8 042 8 007 10 201
Källa/Source : ÅSUB Offenlig ekonomi/Statistics Åland, Public Finance

Offentlig ekonomi
176 Statistisk årsbok för Åland – Statistical Yearbook of Åland 2012
11.8. Kommunernas driftsintäkter och -kostnader efter sektor 2010, 1 000 EUR 11.8. Current finances of municipalities by task group 2010, 1 000 EUR
11.9. Nettodriftskostnader per person efter sektor och kommun 2010, EUR 11.9. Net operating costs per person by task group and municipality 2010, EUR
Sektor/Task group Driftskostnader/ Driftsintäkter/ Nettodriftskostn./Operating costs Operat. revenues Net operat. costs
Totalt 180 335 63 046 117 289
Allm. förvaltn./General administration 9 524 4 507 5 017Socialväsende/Social welfare 70 012 7 997 62 015Barnomsorg/Child day care 19 941 2 340 17 601Vård på åldringshem/Institutional care for elderly 13 797 1 475 12 322Specialomsorgen/Sheltered work, rehabilitation 6 835 11 6 824Hemtjänst/Home-help services 8 354 1 165 7 189Annan serv. för åldr. o. handik./Other serv. for eld., handic. 11 023 1 611 9 412
Undervisning o. kultur/Education and culture 46 315 5 289 41 026Grundskola/Comprehensive school 34 068 1 872 32 196Medborgarinstitut/Adult Education Center 2 303 1 306 997Bibliotek/Public lib raries 2 578 360 2 218Idrott och ungdomsarbete/Sports and youth work 6 080 1 425 4 655
Övriga tjänster/Other services 54 422 45 255 9 167Samhällsplanering/Community amenity services 2 261 1 051 1 210Trafikleder/Traffic routes 4 685 705 3 980Parker o. allmänna områden/Parks and public areas 2 482 958 1 524Brand- o. räddningsväsendet/Fire and rescue services 5 072 2 530 2 542Byggnader o. lokaler/Business premises, leasing services 8 899 8 859 40Vatten- och avloppsverk/Water supply, sewage services 7 592 7 328 264Energiförsörjning/Energy supply services 11 289 11 009 280Avfallshantering/Waste treatment 673 338 335Hamnverksamhet/Port services 5 417 7 547 -2 130
Not/Note : Totalkostnader, d.v.s inklusive interna kostnader/Total costs, i.e. internal costs are included.
Källa/Source : ÅSUB Offenlig ekonomi/Statistics Åland, Public Finance
Kommun Allmän Social- Undervisning ÖvrigaTotalt förvaltn./ väsende/ och kultur/ tjänster/
General adm. Social welfare Educat., culture Other services
Brändö 5 035 541 2 037 1 916 543Eckerö 4 722 414 2 464 1 427 414Finström 4 059 181 2 014 1 693 170Föglö 5 160 438 2 495 1 883 345Geta 4 958 122 3 036 1 541 263Hammarland 3 903 131 1 975 1 462 335Jomala 3 693 72 2 064 1 368 189Kumlinge 5 110 453 2 280 1 766 382Kökar 5 919 320 3 139 2 139 320Lemland 4 059 199 1 674 1 774 415Lumparland 4 708 348 1 579 1 898 883Saltvik 3 877 248 1 869 1 409 353Sottunga 6 840 1 076 2 395 2 613 782Sund 4 958 318 2 839 1 619 186Vårdö 4 774 119 2 381 1 666 611
Mariehamn 4 132 126 2 360 1 292 354
Landskomm. 4 225 215 2 117 1 580 309- Landsbygden 4 070 183 2 072 1 531 285- Skärgården 5 223 419 2 407 1 896 467
Åland 4 188 179 2 214 1 465 327
Källa/Source : ÅSUB Offenlig ekonomi/Statistics Åland, Public Finance

Offentlig ekonomi
Statistisk årsbok för Åland – Statistical Yearbook of Åland 2012 177
11.10. Kommunernas och kommunalförbundens driftshushållning, kostnads- och intäktsslag 2009-2010 11.10. Current finances of municipalities and municipality alliances 2009-2010. Costs and revenues by group of costs and revenues
Kostnads- och intäktsslag/ Procent/ Förändring/Group of costs and revenues Per cent Change
2009 2010 2010 2009-20101 000 EUR 1 000 EUR 1 000 EUR
Kommunerna/Municipalities
Driftskostnader/Operating costsLöner och arvoden/Salaries and wages 57 088 59 367 37,0 2 279Pensionsförs avg. o. pensioner/Pension insur. fees, pensions 11 778 12 209 7,6 431Övriga soc förs avg/Other social insurance costs 3 300 2 992 1,9 -308Kundtj. köpta av -landskapet/Services by Gov. of Åland 3 614 4 030 2,5 416
kommuner/municipalities 1 718 2 005 1,2 287kom. samf/municipality alliances 19 430 19 661 12,3 231övriga/other 4 071 4 923 3,1 852
Köp av övriga tjänster/Purchases of other services 15 959 17 202 10,7 1 243Material, förnödenheter, varor/Materials, equipment, goods 15 889 16 266 10,1 377Understöd/Subsidies 7 355 7 417 4,6 62Hyror/Rents 7 868 8 039 5,0 171Övriga kostnader/Other costs 6 302 6 336 3,9 34Verksamhetskostnader totalt/Operating costs, total 154 364 160 432 100,0 6 068Därav: Interna kostnader totalt/Of which internal costs, tot. 12 198 12 868 8,0 670Avskrivningar, nedskrivningar/Depreciation, devaluation 9 199 9 368 5,8 169
Driftsintäkter/Operating revenueFörsäljningsintäkter/Sales revenue 28 444 29 101 55,4 657Avgifter/Payment revenue 6 252 6 323 12,0 71Understöd och bidrag/Aids and subsidies 658 804 1,5 146Hyror/Rents 10 314 10 618 20,3 304Övriga intäkter/Other revenue 5 442 5 612 10,7 170Verksamhetsintäkter totalt/Returns from operations, tot. 51 114 52 585 100,0 1 471Därav: Interna intäkter totalt/Of which internal revenue, tot. 13 076 13 702 26,1 626
Kommunalförbunden/Municipality alliancesDriftskostnader/Operating costsLöner och arvoden/Salaries and wages 12 778 13 229 55,9 451Pensionsförs avg/Pension insurance fees 3 214 2 671 11,3 -543Övriga soc förs avg/Other social insurance costs 707 591 2,5 -116Kundtj. köpta av landskapet/Services by Gov. of Åland 0 0 0,0 0
kommuner/municipalities 0 13 0,1 13kom. samf/municipality alliances 434 528 2,2 94övriga/other 16 0 0,0 -16
Köp av övriga tjänster/Purchases of other services 3 137 3 199 13,5 62Material, förnödenheter, varor/Materials, equipment, goods 2 661 2 608 11,0 -53Understöd/Subsidies 1 2 0,0 1Hyror/Rents 500 517 2,2 17Övriga kostnader/Other costs 369 315 1,3 -54Verksamhetskostnader totalt/Operating costs, total 23 202 23 672 100,0 470Avskrivningar, nedskrivningar/Depreciation, devaluation 349 420 1,8 71
Driftsintäkter/Operating revenueFörsäljningsintäkter/Sales revenue 21 473 22 397 93,5 924Avgifter/Payment revenue 1 064 973 4,1 -91Understöd och bidrag/Aids and subsidies 143 110 0,5 -33Hyror/Rents 248 264 1,1 16Övriga intäkter/Other revenue 383 217 0,9 -166Verksamhetsintäkter totalt/Returns from operations, tot. 23 312 23 957 100,0 645
Källa/Source : ÅSUB Offenlig ekonomi/Statistics Åland, Public Finance
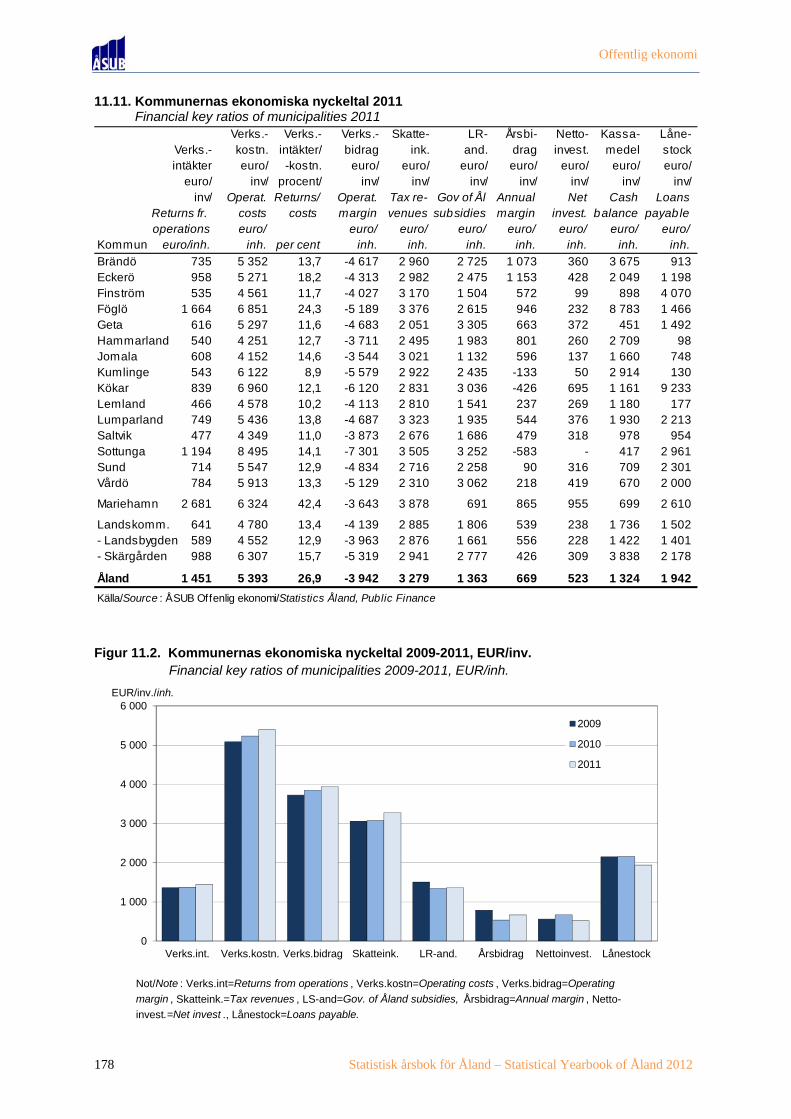
Offentlig ekonomi
178 Statistisk årsbok för Åland – Statistical Yearbook of Åland 2012
11.11. Kommunernas ekonomiska nyckeltal 2011 11.11. Financial key ratios of municipalities 2011
Figur 11.2. Kommunernas ekonomiska nyckeltal 2009-2011, EUR/inv. Figure 11.2. Financial key ratios of municipalities 2009-2011, EUR/inh.
Verks.- Verks.- Verks.- Skatte- LR- Årsbi- Netto- Kassa- Låne-Verks.- kostn. intäkter/ bidrag ink. and. drag invest. medel stockintäkter euro/ -kostn. euro/ euro/ euro/ euro/ euro/ euro/ euro/
euro/ inv/ procent/ inv/ inv/ inv/ inv/ inv/ inv/ inv/inv/ Operat. Returns/ Operat. Tax re- Gov of Ål Annual Net Cash Loans
Returns fr. costs costs margin venues subsidies margin invest. balance payableoperations euro/ euro/ euro/ euro/ euro/ euro/ euro/ euro/
Kommun euro/inh. inh. per cent inh. inh. inh. inh. inh. inh. inh.
Brändö 735 5 352 13,7 -4 617 2 960 2 725 1 073 360 3 675 913Eckerö 958 5 271 18,2 -4 313 2 982 2 475 1 153 428 2 049 1 198Finström 535 4 561 11,7 -4 027 3 170 1 504 572 99 898 4 070Föglö 1 664 6 851 24,3 -5 189 3 376 2 615 946 232 8 783 1 466Geta 616 5 297 11,6 -4 683 2 051 3 305 663 372 451 1 492Hammarland 540 4 251 12,7 -3 711 2 495 1 983 801 260 2 709 98Jomala 608 4 152 14,6 -3 544 3 021 1 132 596 137 1 660 748Kumlinge 543 6 122 8,9 -5 579 2 922 2 435 -133 50 2 914 130Kökar 839 6 960 12,1 -6 120 2 831 3 036 -426 695 1 161 9 233Lemland 466 4 578 10,2 -4 113 2 810 1 541 237 269 1 180 177Lumparland 749 5 436 13,8 -4 687 3 323 1 935 544 376 1 930 2 213Saltvik 477 4 349 11,0 -3 873 2 676 1 686 479 318 978 954Sottunga 1 194 8 495 14,1 -7 301 3 505 3 252 -583 - 417 2 961Sund 714 5 547 12,9 -4 834 2 716 2 258 90 316 709 2 301Vårdö 784 5 913 13,3 -5 129 2 310 3 062 218 419 670 2 000
Mariehamn 2 681 6 324 42,4 -3 643 3 878 691 865 955 699 2 610
Landskomm. 641 4 780 13,4 -4 139 2 885 1 806 539 238 1 736 1 502- Landsbygden 589 4 552 12,9 -3 963 2 876 1 661 556 228 1 422 1 401- Skärgården 988 6 307 15,7 -5 319 2 941 2 777 426 309 3 838 2 178
Åland 1 451 5 393 26,9 -3 942 3 279 1 363 669 523 1 324 1 942
Källa/Source : ÅSUB Offenlig ekonomi/Statistics Åland, Public Finance
0
1 000
2 000
3 000
4 000
5 000
6 000
Verks.int. Verks.kostn. Verks.bidrag Skatteink. LR-and. Årsbidrag Nettoinvest. Lånestock
EUR/inv./inh.
2009
2010
2011
Not/Note : Verks.int=Returns from operations , Verks.kostn=Operating costs , Verks.bidrag=Operating
margin , Skatteink.=Tax revenues , LS-and=Gov. of Åland subsidies, Årsbidrag=Annual margin , Netto-
invest.=Net invest ., Lånestock=Loans payable.

Offentlig ekonomi
Statistisk årsbok för Åland – Statistical Yearbook of Åland 2012 179
11.12. Nyckeltal för den kommunala beskattningen 2010-2012 11.12. Key ratios of municipal taxation 2010-2012
Figur 11.3. Vissa nyckeltal för alla kommuner sammanlagt 2000-2011 Figure 11.3. Financial key ratios of municipalities 2000-2011
Kommun Skatteprocent/Tax rate Fastighetsskatt 2011/Real estate tax 2011
Totalt För för- Andelar Per inv./ 2010 2011 2012 Stadigv. Annan Allmän/värvsink./ av samf.- Pro inh. bostad/ bostad/ GeneralEarned skatten/ Perm. Otherincome Shares of dwelling dwelling
corporate income tax
Brändö 7 878 7 278 600 15 819 17,00 17,00 17,00 0,00 0,90 0,00Eckerö 13 009 11 902 1 106 14 079 18,25 18,00 18,00 0,00 0,90 0,70Finström 37 804 36 942 863 15 207 19,50 19,50 19,50 0,10 0,90 0,75Föglö 8 975 7 917 1 057 15 997 17,00 17,25 17,25 0,00 0,90 0,70Geta 4 932 4 888 44 10 792 18,50 17,75 17,50 0,00 0,90 0,50Hammarland 20 808 20 446 362 14 223 16,50 16,50 16,50 0,00 0,90 0,20Jomala 68 656 64 646 4 009 17 070 17,00 17,00 17,00 0,00 0,90 0,50Kumlinge 5 722 5 591 131 15 382 18,50 18,50 18,50 0,00 0,90 0,40Kökar 3 548 3 498 50 13 592 18,50 18,50 19,50 0,00 0,90 0,60Lemland 29 080 28 607 473 16 319 16,50 16,50 16,25 0,00 0,90 0,15Lumparland 6 323 6 051 272 16 172 18,50 18,50 18,50 0,00 0,90 0,30Saltvik 28 245 25 245 3 000 15 762 16,25 16,25 16,25 0,00 0,90 0,20Sottunga 1 934 1 927 7 15 472 17,50 18,00 18,00 0,00 0,90 0,70Sund 14 643 14 595 48 14 189 18,50 18,50 19,00 0,00 0,90 0,75Vårdö 5 363 5 339 24 12 053 17,50 17,50 18,00 0,00 0,90 0,15
Mariehamn 256 529 202 069 54 460 23 063 16,50 16,50 16,50 0,00 0,90 0,12
Landskomm. 256 919 244 872 12 046 15 467 17,49 17,47 17,49 0,02 0,90 0,47- Landsbygden 223 500 213 323 10 177 15 576 17,48 17,45 17,44 0,02 0,90 0,48- Skärgården 33 419 31 550 1 869 14 774 17,55 17,64 17,84 0,00 0,90 0,38
Åland 513 448 446 942 66 506 18 513 17,04 17,03 17,04 0,01 0,90 0,30
Källa/Source : ÅSUB Offenlig ekonomi/Statistics Åland, Public Finance
Beskattningsbar inkomst/Taxableincome 2010, 1 000 EUR
0
10 000
20 000
30 000
40 000
50 000
60 000
70 000
80 000
90 000
100 000
2000 2002 2004 2006 2008 2010
1 000 EUR
Skatteintäkter/Tax revenues
Lånestock/Loans payable
Landskapsandelar/Gov. of Ål.subsidies
Invest.utg./Invest.costs
Årsbidrag/Annual margin


12
12. Socialväsende, hälso- och sjukvård 12. Social welfare, health and medical care
0
20
40
60
80
100
120
140
65-74år/years
75-84år/years
85- år/years 65-74år/years
75-84år/years
85- år/years
Kvinnor Män
Antal
Antal klienter i äldreomsorgen efter vårdform och kön 2011
Clients in elderly care by type of care and sex 2011
Åldringshem, Gullåsen/Elderly centers Serviceboende/In service homes
Närståendevård/Care by related person

Socialväsende, hälso- och sjukvård Statistiken om socialväsendet samt om hälso- och sjukvården omfattar uppgifter om verksamheten inom kommunernas sociala sektorer samt inom Ålands hälso- och sjukvård (ÅHS) och Ålands miljö- och hälsoskyddsmyndighet (ÅMHM). Därtill kommer statistik om socialförsäkringssystemen. Objekt för statistiken är antal personer/klienter, vårddagar samt ekonomiska uppgifter. Uppgifterna presenteras förutom för hela Åland i betydande utsträckning också efter kommuner och regioner. En utförligare beskrivning av statistiken om områdena inklusive definitioner av variabler finns på ÅSUBs webbplats www.asub.ax under Statistik efter ämne/Socialväsende respektive Hälso- och sjukvård. Källorna anges under varje tabell. Tillförlitligheten är hög i och med att statistiken baseras på heltäckande boksluts-, verksamhets- och registeruppgifter från respektive myndighet. Jämförbarheten är god såväl när det gäller jämförelser över tiden som med andra statistikområden, främst befolkningsstatistik. ÅSUB publicerar statistik över områdena också på webbplatsen i form av Exceltabeller Ansvarig för statistiken om socialväsende samt hälso- och sjukvård på ÅSUB är Iris Åkerberg, [email protected].
Social welfare, health and medical care The statistics in this chapter include data on the activities in the social sectors of the municipalities as well as of the Åland health and medical care oganisation (ÅHS) and the Environmental and health protection agency of the Åland Islands (ÅMHM). In addition, statistics on the social security pension system are included. More statistics on this subject area are available in Excel-tables at the website of Statistics Åland, www.asub.ax. Contact person is Iris Åkerberg, [email protected]

Socialväsende, hälso- och sjukvård
Statistisk årsbok för Åland – Statistical Yearbook of Åland 2012 183
12.1. Barnomsorgen efter kommun 2011 12.1. Child care by municipality 2011
Figur 12.1. Barn i barnomsorgen efter ålder 2011 Figure 12.1. Children in child care by age 2011
Kommun Antal dag-
Daghem/Day Familjedagvård/ Daghem/Day Familjedagvård/ hem/Day
care center Family day care care center Family day care care centers
Brändö 12 1 1 685 184 2Eckerö 44 - 6 994 - 1Finström 131 9 20 832 1 178 3Föglö 18 - 2 910 - 1Geta 23 - 3 174 - 1Hammarland 64 12 9 784 1 813 1Jomala 337 25 48 818 4 681 9Kumlinge 9 - 1 412 - 1Kökar 9 - 1 098 - 1Lemland 111 14 16 503 1 969 4Lumparland 19 - 3 107 - 1Saltvik 74 12 11 692 1 896 2Sottunga - - - - -Sund 51 5 9 145 831 1Vårdö 23 - 3 509 - 1
Mariehamn 549 50 93 612 7 732 13
Landskomm. 925 78 140 663 12 552 29-Landsbygden 854 77 130 049 12 368 23-Skärgården 71 1 10 614 184 6
Åland 1 474 128 234 275 20 284 42
Källa/Source : ÅSUB, Socialväsende/Statistics Åland, Social welfare
Antal barn i/Children in Antal vårddagar i/Care days in
0
50
100
150
200
250
300
350
0 1 2 3 4 5 6 6+
Antal barn/Children
Ålder/Age
Familjedagvård/Family day care Daghem/Day care center

Socialväsende, hälso- och sjukvård
184 Statistisk årsbok för Åland – Statistical Yearbook of Åland 2012
12.2. Äldreomsorgen efter kommun och kön 2011 12.2. Elderly care by municipality and sex 2011
12.3. Antal klienter inom äldreomsorgen efter ålder och region 2005 och 2011 12.3. Clients in elderly care by age and region 2005 and 2011
Kommun Hushåll som Personal Närstående-Totalt Åldringshem o I service- Närstående- fått hemtjänst/ inom hem- vårdare/
Gullåsen/ boende/ vård/Care Households tjänsten/ Related Elderly centers, In service by related receiving Home-help carers
Gullåsen homes person home-help staffBrändö 9 - 8 1 20 5,5 1Eckerö 31 2 14 15 45 11,3 11Finström 74 18 34 22 70 13,2 22Föglö 24 4 10 10 34 1,0 10Geta 20 1 8 11 29 8,0 9Hammarland 37 7 13 17 45 16,0 16Jomala 90 32 17 41 48 11,0 37Kumlinge 18 2 8 8 19 8,0 7Kökar 13 1 11 1 12 9,0 1Lemland 42 6 17 19 28 - 22Lumparland 4 1 - 3 12 2,3 3Saltvik 48 24 - 24 51 4,1 24Sottunga 6 4 - 2 10 1,0 2Sund 41 5 22 14 36 - 25Vårdö 26 1 18 7 31 - 7
Mariehamn 288 95 87 106 228 34,9 104
Landskomm. 483 108 180 195 490 90,3 197-Landsbygden 387 96 125 166 364 65,9 169-Skärgården 96 12 55 29 126 24,5 28
Åland 771 203 267 301 718 125,2 301 - kvinnor 460 141 189 130 .. .. 228 - män 311 62 78 171 .. .. 73
Not/Note : Tabellen omfattar även klienter under 65 år/Clients younger than 65 years of age are also included
Källa/Source : ÅSUB, Socialväsende/Statistics Åland, Social welfare
Antal klienter/Clients
Vårdtyp/Type of care
Region Totalt 65-74 75-84 85- Totalt 65-74 75-84 85-
Åldringshem och Gullåsen, klienter i vård 31.12/Elderly centers and Gullåsen, clients 31.12Mariehamn 105 9 32 64 90 6 28 56Landsbygden 91 9 29 53 89 10 24 55Skärgården 10 2 6 2 12 4 1 7Åland 206 20 67 119 191 20 53 118
Serviceboende för åldringar, boende 31.12/Clients in service homes 31.12Mariehamn 64 10 31 23 82 12 31 39Landsbygden 74 11 26 37 119 16 37 66Skärgården 43 2 19 22 54 2 12 40Åland 181 23 76 82 255 30 80 145
Stöd för närståendevård, vårdade under året/Care by related persons, clients in the yearMariehamn 67 14 24 29 62 21 15 26Landsbygden 79 12 36 31 80 19 30 31Skärgården 15 3 7 5 21 6 12 3Åland 161 29 67 65 163 46 57 60
Hemtjänst, hushåll som fått hemtjänst under året/Households receiving home-help in the yearMariehamn 176 20 66 90 179 24 45 110Landsbygden 210 40 80 90 325 60 112 153Skärgården 94 5 38 51 119 10 34 75
Åland 480 65 184 231 623 94 191 338
Källa/Source : ÅSUB, Socialväsende/Statistics Åland, Social welfare
2005 2011

Socialväsende, hälso- och sjukvård
Statistisk årsbok för Åland – Statistical Yearbook of Åland 2012 185
12.4. Kommunernas driftskostnader för socialväsendet 2010, 1 000 EUR 12.4. Current expenditure on social welfare of municipalities 2010, 1 000 EUR
Kommun Social- Barn- Vård på Hemtjänst/ Övrigförvaltning/ omsorg/ åldrings- social-
hem/ vård/Totalt Administra- Child Inst. care Home-help Other social
tion day care for elderly services careBrändö 1 114 50 265 2 230 567Eckerö 2 590 85 507 156 908 934Finström 5 605 197 1 874 1 188 155 2 191Föglö 1 734 73 316 196 249 900Geta 1 619 63 326 137 564 529Hammarland 3 245 114 1 054 435 590 1 052Jomala 9 174 259 3 973 1 965 618 2 359Kumlinge 944 53 144 57 463 227Kökar 891 53 138 53 246 401Lemland 3 352 294 1 540 182 772 564Lumparland 681 77 276 75 142 111Saltvik 4 280 194 1 154 1 878 334 720Sottunga 293 15 15 230 27 6Sund 3 207 109 870 268 673 1 287Vårdö 1 147 22 331 49 576 169
Mariehamn 30 136 1 330 7 158 6 926 1 807 12 915
Landskomm. 39 876 1 658 12 783 6 871 6 547 12 017-Landsbygden 33 753 1 392 11 574 6 284 4 756 9 747-Skärgården 6 123 266 1 209 587 1 791 2 270
Åland 70 012 2 988 19 941 13 797 8 354 24 932
ProcentBrändö 100,0 4,5 23,8 0,2 20,6 50,9Eckerö 100,0 3,3 19,6 6,0 35,1 36,1Finström 100,0 3,5 33,4 21,2 2,8 39,1Föglö 100,0 4,2 18,2 11,3 14,4 51,9Geta 100,0 3,9 20,1 8,5 34,8 32,7Hammarland 100,0 3,5 32,5 13,4 18,2 32,4Jomala 100,0 2,8 43,3 21,4 6,7 25,7Kumlinge 100,0 5,6 15,3 6,0 49,0 24,0Kökar 100,0 5,9 15,5 5,9 27,7 45,0Lemland 100,0 8,8 45,9 5,4 23,0 16,8Lumparland 100,0 11,3 40,5 11,0 20,9 16,3Saltvik 100,0 4,5 27,0 43,9 7,8 16,8Sottunga 100,0 5,1 5,1 78,5 9,2 2,0Sund 100,0 3,4 27,1 8,4 21,0 40,1Vårdö 100,0 1,9 28,9 4,3 50,2 14,7
Mariehamn 100,0 4,4 23,8 23,0 6,0 42,9
Landskomm. 100,0 4,2 32,1 17,2 16,4 30,1-Landsbygden 100,0 4,1 34,3 18,6 14,1 28,9-Skärgården 100,0 4,3 19,7 9,6 29,3 37,1Åland 100,0 4,3 28,5 19,7 11,9 35,6
Källa/Source : ÅSUB, Offentlig ekonomi/Statistics Åland, Public Finance

Socialväsende, hälso- och sjukvård
186 Statistisk årsbok för Åland – Statistical Yearbook of Åland 2012
12.5. Kommunernas nettodriftskostnader för socialväsendet 2007-2010 12.5. Current net expenditure on social welfare of municipalities 2007-2010
Figur 12.2. Kommunernas kostnader för socialväsendet 2010, procent Figure 12.2. Expenditure on social welfare of municipalities 2010, per cent
Kommun2007 2008 2009 2010 2007 2008 2009 2010
Brändö 921 940 1 006 994 1 806 1 843 2 020 2 037Eckerö 2 241 2 138 2 320 2 324 2 428 2 316 2 511 2 464Finström 3 996 4 605 4 887 5 040 1 626 1 874 1 966 2 014Föglö 1 089 1 144 1 311 1 447 1 871 1 966 2 337 2 495Geta 1 158 1 347 1 456 1 442 2 614 3 041 3 186 3 036Hammarland 2 290 2 572 2 853 2 979 1 625 1 825 1 950 1 975Jomala 6 336 7 098 7 354 8 457 1 679 1 881 1 828 2 064Kumlinge 639 774 804 830 1 746 2 115 2 161 2 280Kökar 729 851 890 813 2 567 2 996 3 410 3 139 Lemland 2 494 2 970 2 847 3 037 1 407 1 675 1 598 1 674Lumparland 554 554 572 622 1 432 1 432 1 463 1 579Saltvik 2 854 3 108 3 206 3 368 1 649 1 795 1 789 1 869Sottunga 113 191 223 285 974 1 647 1 784 2 395Sund 1 691 1 912 2 110 2 893 1 607 1 817 2 045 2 839Vårdö 1 003 1 023 1 053 1 076 2 259 2 304 2 366 2 381
Mariehamn 23 076 24 091 25 322 26 408 2 117 2 210 2 277 2 360
Landskomm. 28 108 31 227 32 892 35 607 1 584 1 668 1 730 1 922
-Landsbygden 23 614 26 304 27 605 30 162 1 547 1 645 1 693 1 886-Skärgården 4 494 4 923 5 287 5 445 1 800 1 808 1 952 2 139
Åland 51 184 55 318 58 214 62 015 1 838 1 885 2 037 2 214
Källa/Source : ÅSUB, Offentlig ekonomi/Statistics Åland, Public Finance
Nettokostnader/Net expenditure, 1 000 EUR Nettokostnader/inv/Net/inhabitant
Barnomsorg/Child day care
Åldringshem/Elderly care
Hemtjänst/Home-help service
Förvaltning/Administration
Övrigt/Other

Socialväsende, hälso- och sjukvård
Statistisk årsbok för Åland – Statistical Yearbook of Åland 2012 187
12.6. Ålands hälso- och sjukvård, besök och insatser på polikliniker och mottagningar 2011 12.6. The Åland health and medical care organisation, consultations and treatment at polyclinics and medical centres 2011
12.7. Ålands hälso- och sjukvård, mottagningsbesök efter kön och ålder 2011 12.7. The Åland health and medical care organization, outpatient’s consultations by sex and age 2011
Enhet Övr. besök TotaltType of health care och insatser/
Läkare/ Vårdpersonal/ Other
Physicians Medical person. treatment
Totalt 67 810 144 001 141 156 352 967
Somatisk specialsjukvård/Somatic specialized care 36 024 39 080 76 855 151 959
Akut/Emergency 9 743 49 16 9 808
Barn- o. ungdom/Pediatrics 2 236 857 5 331 8 424
BB-gyn/Obstetrics, gynaecology 3 568 841 1 888 6 297
Kirurgi/Surgery 5 980 3 199 10 190 19 369
Medicin/Medicine 10 007 17 984 34 841 62 832
Rehab. o. fysiatri/Rehabilitation, physiatrics 389 11 523 14 509 26 421
Ögon/Eyes 2 361 1 378 3 983 7 722
Öron-, näs-, hals-/Ear, nose and throat 1 734 1 172 3 428 6 334
Övriga/Other 6 2 077 2 669 4 752
Psykiatri/Psychiatric care 2 402 13 083 5 664 21 149
Vuxenmottagning/Adults 1 817 4 494 2 392 8 703
Barn- o. ungdom/Children and youth 399 1 797 951 3 147
Dagklinik/Outpatient clinic 167 4 378 1 487 6 032
Övrigt/Other 19 2 414 853 3 267
Primärvård/Primary health care 29 384 91 838 58 637 179 859
Sjukvård/Health care 24 526 31 862 34 879 91 267
Hemsjukvård/Home nursing 217 34 814 17 227 52 258
Mödravård/Maternity care 511 3 700 121 4 332
Barnrådgivning/Child health care 1 197 6 837 299 8 333
Preventivmedel/Contraceptives 650 1 035 549 2 234
Skol- o. stud.hälsov./School- and student health care 1 278 9 921 1 634 12 833
Företagshälsov./Occupational health service 766 1 268 2 362 4 396
Övrigt/Other 239 2 401 1 566 4 206
Källa/Source : ÅHS verksamhetsberättelse/The Åland Health and Medical Care Organisation, Annnual Report
Mottagningsbesök/
Outpatients' consultations
Totalt 0-17 år/ 18-64 år/ 65+ år/
year year year
Totalt 211 818 35 552 91 395 84 871Kvinnor 122 293 18 379 57 852 46 062Män 89 525 17 173 33 543 38 809
Somatisk specialsjukvård/Somatic specialized care 75 111 6 956 36 471 31 684Kvinnor 38 994 3 266 20 827 14 901Män 36 117 3 690 15 644 16 783
Psykiatri/Psychiatric care 15 485 1 976 12 412 1 097Kvinnor 9 726 815 8 080 831Män 5 759 1 161 4 332 266
Primärvård/Primary health care 121 222 26 620 42 512 52 090Kvinnor 73 573 14 298 28 945 30 330Män 47 649 12 322 13 567 21 760
Källa/Source : ÅHS verksamhetsberättelse/The Åland Health and Medical Care Organisation, Annnual Report

Socialväsende, hälso- och sjukvård
188 Statistisk årsbok för Åland – Statistical Yearbook of Åland 2012
12.8. Ålands hälso- och sjukvård, tandvård 2008-2011 12.8. The Åland health and medical care organisation, dental care 2008-2011
12.9. Ålands hälso- och sjukvård, vårdavdelningsverksamhet efter basenhet 2011 12.9. The Åland health and medical care organisation, activities of inpatient departments by unit 2011
Figur 12.3. Vårddagar inom Ålands hälso- och sjukvård 2000-2011 Figure 12.3. Care-days in the Åland health and medical care organisation 2000-2011
2008 2009 2010 2011Antal besök efter personalgrupp/Consultations by type of personnel 16 639 16 192 15 824 17 678Tandläkare/Dentist 15 659 14 427 13 624 15 025Munhygienist/Dental hygienist 616 960 1 242 1 420Tandskötare/Dental nurse 364 805 958 1 233
Antal patienter efter åldersgrupp/Patients by age group 7 776 7 629 7 278 7 925Kostnadsfri tandvård 0-18 år/Free dental care 0-18 years 4 434 4 263 4 122 4 575Avgiftsbelagd tandvård 19+ år/Dental care subject to charges 19+ years 3 342 3 366 3 156 3 350
Besök per patient/Consultations per patient 2,1 2,1 2,2 2,2
Källa/Source : ÅHS verksamhetsberättelse/The Åland Health and Medical Care Organisation, Annnual Report
Enhet Vård- Vård- Belägg- Patien- Vård- Medelvård-Type of health care platser/ dagar/ ning/ ter/ tillfällen/ tid, dagar
Hospitals Care- Occupied Patients Ad- Av. stay,beds days beds, % missions care-days
Specialsjukvård totalt/Specialized care, total 134 25 194 54,9 4 684 6 287 4,0Somatisk spec.sjukv./Somatic specialized care 111 20 746 53,5 4 503 5 949 3,5
Akut/Emergency 5 556 30,5 568 645 0,9Intensivvård/Intensive care 4 602 41,2 . . .Barn- och ungdom/Pediatrics 10 1 346 36,9 376 464 2,9BB-gyn/Obstetrics, gynaecology 27 2 895 29,4 922 982 2,9 - Gyn/Gynaecology 9 589 17,9 346 379 1,6 - Förlossning/Obstetrics 9 1 189 36,2 291 312 3,8 - Nyfödda/Neonates 9 1 117 34,0 285 291 3,8Kirurgi/Surgery 23 5 824 69,4 1 496 2 029 2,9Medicin/Medicine 30 8 013 73,2 1 027 1 527 5,2Rehab.- o fysiatri/Rehab., physiatrics 12 1 510 59,4 114 302 5,0
Psykiatrisk vård/Psychiatric care 23 4 448 53,0 181 338 13,2Psyk akut/Psych. Emergency 15 2 893 52,8 154 290 10,0Psyk rehab/Psych. rehab. 8 1 555 53,3 27 48 32,4
Långvård/Long-term care 68 19 885 80,1 218 307 64,8Källa/Source : ÅHS verksamhetsberättelse/The Åland Health and Medical Care Organisation, Annnual Report
0
5 000
10 000
15 000
20 000
25 000
30 000
35 000
2000 2002 2004 2006 2008 2010
Somatiskspec.sjukv./Somaticspecializedcare
Psykiatriskvård/Psychia-tric care

Socialväsende, hälso- och sjukvård
Statistisk årsbok för Åland – Statistical Yearbook of Åland 2012 189
12.10. Ålands hälso- och sjukvård, vårdavdelningsverksamhet efter basenhet och kön 2011 12.10. The Åland health and medical care organisation, activities of inpatient departments by unit and sex 2011
12.11. Vård utom Åland 2007-2011 12.11. Health care out of Åland 2007-2011
12.12. Ålands hälso- och sjukvård, geriatriska kliniken 2006-2011 12.12. The Åland health and medical care organisation, somatic long-term care 2006-2011
EnhetType of health care Kvinnor Män Kvinnor Män Kvinnor Män
Specialsjukvård totalt/Specialized care, total 2 650 2 034 13 591 11 603 5,1 5,7Somatisk spec.sjukv./Somatic specialized care 2 562 1 941 11 295 9 451 4,4 4,9
Akut/Emergency 303 265 307 249 1,0 0,9
Intensivvård/Intensive care .. .. 233 369 .. ..
Barn- och ungdom/Pediatrics 173 203 758 588 4,4 2,9
BB-gyn/Obstetrics, gynaecology 790 132 2 406 489 3,0 3,7
- Gyn/Gynaecology 345 1 588 1 1,7 1,0
- Förlossning/Obstetrics 291 - 1 189 - 4,1 -
- Nyfödda/Neonates 154 131 629 488 4,1 3,7
Kirurgi/Surgery 733 763 2 953 2 871 4,0 3,8
Medicin/Medicine 496 531 3 862 4 151 7,8 7,8
Rehab.- o fysiatri/Rehab., physiatrics 67 47 776 734 11,6 15,6
Psykiatrisk vård/Psychiatric care 88 93 2 296 2 152 26,1 23,1
Psyk akut/Psych. Emergency 74 80 1 538 1 355 20,8 16,9
Psyk rehab/Psych. rehab. 14 13 758 797 54,1 61,3Långvård/Long-term care 129 89 13 131 6 754 101,8 75,9
Källa/Source : ÅHS verksamhetsberättelse/The Åland Health and Medical Care Organisation, Annnual Report
Patienter/PatientsVårddagar per patient/Care-days per patients
Vårddagar/Care-days
2007 2008 2009 2010 2011
Remitterad vård/Referred careBesök totalt/Consultations, total 3 215 2 868 2 946 2 760 3 127
Finland 2 825 2 262 2 227 1 859 2 505Sverige/Sweden 390 606 719 901 622
Vårddagar totalt/Care-days, total 4 302 5 808 5 966 5 980 6 509Finland 2 883 3 662 3 951 3 561 4 326Sverige/Sweden 1 419 2 146 2 015 2 419 2 183
Akut uppsökt vård/Emergency careBesök/Consultations 364 413 441 372 436Vårddagar/Care-days 189 237 370 195 209
Källa/Source : ÅHS verksamhetsberättelse/The Åland Health and Medical Care Organisation, Annnual Report
2006 2007 2008 2009 2010
Tot K M
Antal bäddplatser/Beds 97 97 84 84 74 68 .. ..Inskrivna patienter/Patients 425 451 220 228 195 218 129 89Avlidna/Deceased 69 64 56 54 47 60 .. ..Antal vårddagar/Patient days 32 946 31 224 27 664 28 126 24 665 19 885 13 131 6 754
Efter ålder/By age -64 2 414 2 365 1 831 3 538 3 328 3 072 1 871 1 20165 - 74 4 652 4 364 4 547 3 659 3 153 2 154 981 1 17375 - 84 11 061 10 268 9 966 9 712 7 816 7 175 4 362 2 81385+ 14 819 14 227 11 320 11 217 10 368 7 484 5 917 1 567
Not/Note : Geriatriska kliniken hette tidigare Gullåsen/Former name of the geriatric clinic was GullåsenKälla/Source : ÅHS verksamhetsberättelse/The Åland Health and Medical Care Organisation, Annnual Report
2011

Socialväsende, hälso- och sjukvård
190 Statistisk årsbok för Åland – Statistical Yearbook of Åland 2012
12.13. Ålands hälso- och sjukvård, bokslutsuppgifter 2005-2011, 1 000 EUR 12.13. The Åland health and medical care organisation, accounts 2005-2011, 1 000 EUR
12.14. Veterinärvård 2006-2011 12.14. Veterinary care 2006-2011
12.15. Aborter efter kvinnans ålder 2005-2011 12.15. Abortions by age of woman 2005-2011
Inkomster/Revenues
Utgifter/Expenditure 2005 2006 2007 2008 2009 2010 2011
Inkomster/Revenues 10 092 10 319 8 790 8 609 10 062 10 719 9 550
Driftsinkomster/Current revenues 5 759 5 671 5 200 5 233 6 762 7 612 6 869
Gullåsen/Gullåsen hospital 4 333 4 648 3 590 3 376 3 300 3 107 2 681
Utgifter/Expenditure 61 849 62 148 66 523 71 043 71 702 70 148 76 950
Personalkostn./Pers. expenses 42 304 41 788 44 037 46 848 46 561 44 936 47 502
Vård utanför Åland/ 5 057 5 943 7 067 7 678 8 394 8 780 8 940
Medical care outside Åland
Övriga konsumtionsutgifter/ 13 593 13 442 14 353 15 532 15 730 15 577 19 035
Other consumption expenditure
Investeringar/Investments 894 975 1 065 985 1 017 856 1 474
Nettoutgifter/Net expenditure 51 757 51 829 57 733 62 434 61 639 59 429 67 401
Källa/Source : ÅHS verksamhetsberättelse/The Åland Health and Medical Care Organisation, Annnual Report
2006 2007 2008 2009 2010 2011Antal besök/Consultations 3 876 3 809 3 705 3 216 3 255 3 295
nyttodjur/livestock 2 491 2 444 2 280 1 974 2 292 2 068
smådjur/pets 1 385 1 365 1 425 1 242 963 1 227
Antal inspektioner/Inspections 80 136 123 8 93 29
Källa/Source : ÅHS verksamhetsberättelse, Ålands miljö- och hälsoskyddsmyndighet /The Åland Health and Medical CareOrganisation, Annual Report, Environmental and Health Protection Agency of the Aland Islands
År/Year Kvinnans ålder/Age of woman
Totalt -19 20-24 25-29 30-34 35-39 40-49Antal2005 68 14 15 18 5 12 42006 53 11 14 11 7 6 42007 73 11 16 22 11 10 32008 66 15 15 14 12 4 62009 68 10 21 15 11 7 42010 70 11 23 12 14 5 5
20112) 73 12 21 18 14 7 1Antal per 1 000 kvinnor i respektive åldersgrupp/Number per 1 000 women by age group 1)
2005 11,7 17,9 24,4 24,7 6,2 12,1 2,12006 9,1 13,7 22,9 15,1 8,7 6,2 2,12007 12,5 13,5 26,6 30,5 13,7 10,8 1,52008 11,3 18,1 25,1 18,9 14,8 4,5 3,02009 11,5 11,9 34,5 19,7 13,6 8,0 2,02010 11,8 12,9 36,7 15,7 17,4 5,7 2,5
20112)12,2 14,1 31,8 23,8 17,3 8,0 0,5
1) Totalt uträknat på 15-49 år. Åldersgruppen -19 år uträknad på 15-19 år/Total calculated for age group 15-49. Age group -19calculated for aged 15-19. 2) Preliminära uppgifter/Preliminary figures
Källa/Source : Institutet för hälsa och välfärd/National Research and Development Centre for Welfare and Health

Socialväsende, hälso- och sjukvård
Statistisk årsbok för Åland – Statistical Yearbook of Åland 2012 191
12.16. Barnbidrag efter kommun december 2011 12.16. Family allowances by municipality December 2011
Figur 12.4. Familjer som fått barnbidrag efter antal barn och region 2011 Figure 12.4. Families receiving family allowance by number of children and region 2011
Kommun Antal Antal Utbetaltbarn/ barnfam./ belopp/
Eligib le Families Paid sum 1 barn/ 2 barn/ 3 barn/ 4+ barn/children w. children 1 000 EUR 1 child 2 children 3 children 4+ children
Brändö 71 42 106 42,9 45,2 11,9 -Eckerö 169 100 242 48,0 39,0 10,0 3,0Finström 564 325 870 43,7 42,8 10,5 3,1Föglö 96 54 145 42,6 42,6 9,3 5,6Geta 89 53 124 47,2 39,6 11,3 1,9Hammarland 324 192 484 42,7 44,8 10,9 1,6Jomala 1 045 590 1 555 41,2 43,7 12,5 2,5Kumlinge 47 25 71 44,0 36,0 0,0 20,0Kökar 42 22 60 40,9 45,5 13,6 -Lemland 452 242 709 40,9 39,3 13,6 6,2Lumparland 83 48 127 41,7 45,8 10,4 2,1Saltvik 361 205 555 43,4 40,5 11,7 4,4Sottunga 11 7 16 57,1 - - 42,9Sund 210 124 307 49,2 33,9 15,3 1,6Vårdö 83 47 119 44,7 38,3 12,8 4,3
Mariehamn 1 949 1 191 2 956 49,0 38,8 10,6 1,6
Landskomm. 3 647 2 076 5 491 43,1 41,6 11,8 3,5-Landsbygden 3 297 1 879 4 974 43,1 41,8 12,0 3,1-Skärgården 350 197 517 43,7 40,1 9,6 6,6
Åland 5 596 3 267 8 447 45,3 40,6 11,4 2,8
Källa/Source: Folkpensionsanstalten/The Social Insurance Institution of Finland
Andel familjer med barn/Families with children, %
0 %
10 %
20 %
30 %
40 %
50 %
60 %
70 %
80 %
90 %
100 %
Mariehamn Landsbygden Skärgården
3+ barn/children
2 barn/children
1 barn/children

Socialväsende, hälso- och sjukvård
192 Statistisk årsbok för Åland – Statistical Yearbook of Åland 2012
12.17. Pensionstagare efter ålder och region 31.12.2010 12.17. Pension beneficiaries by age and region 31.12.2010
12.18. Pensionstagare efter pensionsslag och kommun 31.12.2010 12.18. Pension beneficiaries by type of pension and municipality 31.12.2010
Region Totalt 0-15 16-44 45-54 55-59 60-64 65-69 70-79 80-
Mariehamn 2 733 16 97 81 138 430 573 797 601
Landsbygden 3 269 29 93 100 159 528 778 958 624
Skärgården 738 3 12 15 39 93 154 231 191
Åland 6 740 48 202 196 336 1 051 1 505 1 986 1 416
Källa/Source: Pensionsskyddscentralen/Finnish Centre for Pensions
Kommun
I % av I % av bef. I % av bef.
hela bef./ 16-64 år/ över 16 år/ %
Antal % of Antal % of pop. Antal % of pop. Antal av hela bef./
total pop. 16-64 y. 16+ y. of tot. pop.
Brändö 132 27,0 10 3,4 144 34,2 147 30,1Eckerö 194 20,6 39 6,5 241 30,3 248 26,3Finström 473 18,9 75 4,8 568 28,3 590 23,6Föglö 162 27,9 18 5,3 185 37,3 193 33,3Geta 109 22,9 11 3,8 123 30,5 125 26,3Hammarland 296 19,6 51 5,3 352 28,6 365 24,2Jomala 584 14,3 107 4,0 707 22,2 744 18,2Kumlinge 102 28,0 19 8,8 120 37,6 121 33,2Kökar 67 25,9 11 7,0 81 36,5 87 33,6Lemland 298 16,4 33 2,9 347 24,7 361 19,9Lumparland 89 22,6 12 5,2 105 33,0 111 28,2Saltvik 389 21,6 60 5,4 455 31,0 472 26,2Sottunga 35 29,4 1 1,5 39 37,9 40 33,6Sund 215 21,1 30 4,7 249 29,5 253 24,8Vårdö 129 28,5 13 5,1 146 38,6 150 33,2
Mariehamn 2 180 19,5 376 5,1 2 636 27,8 2 733 24,4
Landskomm. 3 274 19,5 490 4,7 3 862 28,4 4 007 23,8-Landsbygden 2 647 18,2 418 4,6 3 147 27,0 3 269 22,5-Skärgården 627 27,7 72 5,4 715 36,9 738 32,6
Åland 5 454 19,5 866 4,8 6 498 28,2 6 740 24,11)Termen Invalidpension har fr.o.m. 2010 ersatts med termen Sjukpension/As of 2010, the term Invalidity pension has been
replaced by the term Disability pension. 2)Inkl. deltidspensioner och särskilda lantbrukarpensioner/Incl. part-time pensions and
special farmer pensions. 3)Inkluderar familjepensioner/Incl. family pensions.
Källa/Source: Pensionsskyddscentralen/Finnish Centre for Pensions
Samtliga pensioner/
All pensions 3)
Egenpensioner/Personal pensions
Old-age pension Disability pens. 1)
Ålderspension
(inkl. förtida)/
Egenpensioner,
totalt/All personal
Sjuk-
pension/
pensions 2)

Socialväsende, hälso- och sjukvård
Statistisk årsbok för Åland – Statistical Yearbook of Åland 2012 193
12.19. Pensionsutgifter efter pensionsslag och region 2010, MEUR 12.19. Expenditure on pension benefits by type of pension and region 2010, MEUR
Figur 12.5. Arbetspensioner för privata och offentliga sektorn 2000-2010, MEUR Figure 12.5. Employment pensions for private and public sector 2000-2010, MEUR
12.20. Pensionsutgifter efter region och pensionssystem 2000-2010, MEUR 12.20. Expenditure on pension benefits by region and pension system 2000-2010, MEUR
Region Egenpensioner/Personal pensions Familje-Ålders- Arb.löshets- Sjukpens./ Deltids- Pens. för pension/
pens./Old- pens./Un- Disab ility Deltidspens./ lantbr./Far- FamilyTotalt age pens. emp.pens. pension 1) Part-time pens. mer pens. pension
Mariehamn 45,4 40,2 0,1 4,6 0,6 0,0 5,1Landsbygden 46,4 40,1 0,0 5,3 0,5 0,0 3,6Skärgården 10,6 9,5 0,1 0,8 0,0 0,0 0,8
Åland 102,3 89,6 0,3 10,9 1,3 0,2 9,41)Termen Invalidpension har fr.o.m. 2010 ersatts med termen Sjukpension/As of 2010, the term Invalidity pension has been
replaced by the term Disability pension. Källa/Source: Pensionsskyddscentralen/Finnish Centre for Pensions
0
10
20
30
40
50
60
70
2000 2003 2006 2009
MEUR
Privatasektorn
Offentligasektorn
RegionPensionssystem/Pension system 2000 2004 2005 2006 2007 2008 2009 2010MariehamnAlla pensioner/All pensions 32,0 37,8 39,2 39,2 42,6 44,1 48,0 50,6Arbetspensioner/Suppl. pensions 28,0 34,0 35,4 37,1 38,8 41,0 44,8 47,4 Privata sektorn/Private sector 16,2 19,9 20,8 21,9 23,0 24,4 26,7 28,3 Off. sektorn/Public sector 11,8 14,1 14,6 15,2 15,8 16,6 18,2 19,1FPA-pensioner/Soc. sec. pensions 4,0 3,8 3,8 3,8 3,8 3,1 3,2 3,1LandsbygdAlla pensioner/All pensions 27,2 34,8 36,5 38,6 41,0 43,7 48,1 50,0Arbetspensioner/Suppl. pensions 21,1 28,9 30,6 32,9 35,4 38,4 42,4 44,8 Privata sektorn/Private sector 12,7 17,9 18,9 20,5 22,3 24,3 26,8 28,2 Off. sektorn/Public sector 8,4 11,0 11,7 12,3 13,1 14,2 15,7 16,5FPA-pensioner/Soc. sec. pensions 6,1 5,9 5,8 5,8 5,7 5,0 5,3 5,1SkärgårdAlla pensioner/All pensions 7,0 8,6 8,8 9,2 9,8 9,7 10,8 11,4Arbetspensioner/Suppl. pensions 5,0 6,5 6,7 7,2 7,8 8,4 9,2 9,9 Privata sektorn/Private sector 2,4 3,0 3,2 3,4 4,0 4,1 4,9 5,3 Off. sektorn/Public sector 2,6 3,5 3,6 3,7 3,9 3,9 4,3 4,7FPA-pensioner/Soc. sec. pensions 2,0 1,9 1,9 1,7 1,7 1,7 1,7 1,5ÅlandAlla pensioner/All pensions 66,2 81,2 84,5 87,0 93,2 97,5 106,8 112,0Arbetspensioner/Suppl. pensions 54,1 69,4 72,7 77,2 82,1 87,6 96,6 102,1 Privata sektorn/Private sector 31,3 40,8 42,9 45,8 49,3 52,9 58,3 61,8 Off. sektorn/Public sector 22,8 28,6 29,9 31,2 32,8 34,7 38,2 40,3FPA-pensioner/Soc. sec. pensions 12,1 11,6 11,5 11,3 11,1 9,9 10,2 9,9
Källa/Source: Pensionsskyddscentralen/Finnish Centre for Pensions

Socialväsende, hälso- och sjukvård
194 Statistisk årsbok för Åland – Statistical Yearbook of Åland 2012
12.21. Folkpensionsutgifter efter region 2005-2011, 1 000 EUR 12.21. Expenditure on social security pensions by region 2005-2011, 1 000 EUR
Figur 12.6. Pensionstagare 1975-2010 Figure 12.6. Pension beneficiaries 1975-2010
Not/Note: Fram t o m 1995 gäller siffrorna endast folkpensioner/Up to 1995, the figure only concern social security pensions. Termen invalidpension har fr o m 2010 ersatts med termen Sjukpension/As of 2010, the term invalidity pension has been replaced by the term Disability pension
Region
2005 2008 2009 2010 2011 2005 2008 2009 2010 2011
Mariehamn 3 606 2939 3 063 2 990 2 958 427 499 489 516 560
Landsbygden 5 458 4 984 5 138 5 013 4 843 186 200 194 197 214
Skärgården 1 836 1 532 1 525 1 455 1 388 89 76 70 69 71
Åland 10 900 9 455 9 726 9 458 9 190 702 775 753 782 846
Källa/Source : Folkpensionsanstalten/The Social Insurance Institution of Finland
Rental subsidiesSamtliga folkpensioner/All social security pens.
Bostadsbidrag/
0
1 000
2 000
3 000
4 000
5 000
6 000
1975 1980 1985 1990 1995 2000 2005 2010
Ålderspension/Old-age pension
Sjukpension/Disability pension

Socialväsende, hälso- och sjukvård
Statistisk årsbok för Åland – Statistical Yearbook of Åland 2012 195
12.22. Sjukförsäkringsersättningar efter kommun 2008-2009, 1 000 EUR 12.22. Allowances under national health insurance 2008-2009, 1 000 EUR
12.23. Ersättningar för läkemedel, läkartjänster, undersökning och behandling samt resekostnader 2000-2009 12.23. Refunds on medical expenses and sickness allowances 2000-2009
Kommun
2008 2009 2008 2009 2008 2009 2008 2009 2008 2009
Brändö 275 309 72 114 16 11 1 1 185 183Eckerö 742 724 177 228 147 104 31 18 376 370Finström 1 558 1 745 452 430 372 464 43 57 668 758Föglö 317 341 82 132 57 42 5 2 171 163Geta 327 233 78 68 79 38 5 4 159 122Hammarland 861 993 233 290 174 258 22 23 411 405Jomala 2 699 2 850 689 662 855 1 026 114 108 960 996Kumlinge 254 271 94 97 16 14 1 1 141 158Kökar 125 152 37 74 4 0 2 0 83 78Lemland 1 523 1 336 285 283 307 298 35 41 880 687Lumparland 211 214 47 44 69 70 2 8 91 90Saltvik 1 096 1 092 288 298 268 258 36 32 484 487Sottunga 76 55 37 15 - 2 - 1 39 37Sund 547 646 149 248 91 98 19 10 285 289Vårdö 254 296 36 76 48 61 13 8 150 148
Mariehamn 6 853 7 004 1 766 2 073 1 576 1 274 169 198 3247 3355
Landskomm. 10 865 11 257 2 756 3 059 2 503 2 745 329 313 5 083 4 971-Landsbygden 9 564 9 833 2 398 2 551 2 362 2 614 307 300 4 314 4 204-Skärgården 1 301 1 424 358 508 141 130 22 12 769 767
Åland 17 718 18 261 4 521 5 132 4 079 4 019 498 511 8 331 8 3251) Exkl. den specialdagvårdsp. som började betalas ut 1.10.1990 och den ersättning för förlorad inkomst som enligt lagen om smitto-samma sjukdomar har betalats ut/Special day care allowances and compensation for income losses due to communicable diseasesexcluded.
Källa/Source : Folkpensionsanstalten/The Social Insurance Institution of Finland
Föräldradagp. till fäder/Fat-
herhood allow.
Sjukvårds-ersättningar/Medical exp.
Sjukförsäkringser-sättningar totalt 1)/Nat. health ins. tot.
Föräldradagp.till mödrar/Mot-herhood allow.
Sjukdag-penningar/
Sickness allow.
2000 2004 2005 2006 2007 2008 2009Läkemedel/Medicines 1)
grundersatta/basic refunds, 1 000 EUR 974 1 414 1 486 1 486 1 487 1 568 1 672 spec.ersättn./refunds 75-100 %, 1 000 EUR 1 772 2 699 2 841 2 897 2 758 2 939 2 805Totalt, 1 000 EUR 2 868 4 460 4 683 4 876 4 895 5 117 5 227 andel ersättningstagare (75-100%) av bef./ beneficiaries, part of pop. (75-100 %), % 16,7 17,8 17,8 17,6 17,5 17,4 17,4Läkartjänster/Doctor consultations FPA-ersättningar/SII-refunds, 1 000 EUR 152 132 134 145 131 132 174 patientens andel/net cost for benef., 1 000 EU 252 309 352 415 409 460 600 antal besök/visits per 100 inv./inh 38,3 27,8 26,5 28,3 25,4 27,1 32,0Undersökning och behandling/Treatments FPA-ersättningar/SII-refunds, 1 000 EUR 89 100 111 138 159 167 201 patientens andel/net cost for benef., 1 000 EU 164 250 310 371 388 439 543 andel ersättningstagare av befolkn., %/ beneficiaries part of pop. % 6,6 9,6 16,0 20,0 21,4 21,3 23,5Resekostnader/Travel costs 2)
FPA-ersättningar/SII-refunds, 1 000 EUR 674 1 018 1 202 1 476 1 391 1 605 1 415 EUR/ersättningstagare/EUR/beneficiary 323 483 560 629 668 578 586 enkelriktad resa/100 inv./one-way trip/100 inh. 47,6 51,5 54,1 66,4 60,3 71,4 69,01) Läkemedel ersätts fr.o.m. 1994 med 75 eller 100 %/Either 75% or 100% refunded from 1994 onwards. 2) Innefattar också övernatt-ningskostnader/Accommodation costs included.Källa/Source : Folkpensionsanstalten/The Social Insurance Institution of Finland


13
13. Utbildning, kultur och rättsväsende 13. Education and justice
0
200
400
600
800
1 000
1 200
1 400
1 600
Grundskolan/Compreh.school
Efter grundsk./Aftercompr.school
Högskolan påÅland/The Åland
University of AppliedSciences
Studerande utanförÅland/Students outside
Åland
Antal
Åländska studerande efter kön 2011Students by sex 2011
Kvinnor Män

Utbildning, kultur och rättsväsende Statistiken i detta kapitel omfattar uppgifter om alla nivåer i det åländska utbildningssystemet, studerande utanför Åland, befolkningens utbildningsstruktur, biblioteksväsende, bokproduktion, massmedia, muséer och församlingar. Därtill ingår statistik om brottslighet och domstolsverksamhet. Objekt för statistiken är antal personer, besök och ärenden samt vissa ekonomiska uppgifter. Uppgifterna presenteras i huvudsak för hela Åland men i viss mån också för kommuner och regioner. En utförligare beskrivning av statistiken om områdena inklusive definitioner av variabler finns på ÅSUBs webbplats www.asub.ax under Statistik efter ämne/Utbildning respektive Kultur samt Rättsväsende. Källorna anges under varje tabell. Tillförlitligheten är hög i och med att statistiken baseras på heltäckande verksamhets- och bokslutsuppgifter från de olika aktörerna. Uppgifterna om utbildningsstruktur är delvis bristfälliga eftersom data om examina avlagda i utlandet inte är kompletta. Jämförbarheten är god såväl när det gäller jämförelser över tiden som med andra statistikområden, såsom befolkningsstatistik. ÅSUB publicerar årligen ett antal meddelanden med utbildningsstatistik som finns tillgängliga på webbplatsen. Där finns det också statistik över de tre ämnesområdena i form av Excel- och PC-Axistabeller. Under temaområdet ”Utbildningsbehov” finns ytterligare en större mängd utbildningsrelaterade fakta. Ansvarig för utbildnings- och kulturstatistiken på ÅSUB är Kenth Häggblom, [email protected] och för statistiken om rättsväsendet Iris Åkerberg, [email protected].
Education, culture and justice The statistics in this chapter include data on all levels of the educational system of Åland, students in schools outside Åland, the educational qualification of the population, libraries, book production, the mass media, museums and parishes as well as criminality and the activities of the court of law. More statistics on these subject areas are available at the website of Statistics Åland, www.asub.ax, in Excel-tables and PC-Axis-databases in English. Contact persons are Kenth Häggblom,[email protected] (education and culture) and Iris Åkerberg, [email protected] (justice).

Utbildning, kultur och rättsväsende
Statistisk årsbok för Åland – Statistical Yearbook of Åland 2012 199
13.1. Grundskolorna höstterminerna 1990-2011 13.1. Comprehensive schools autumn term 1990-2011
13.2. Elevantalet i grundskolornas högstadium, höstterminerna 1990-2011 13.2. Comprehensive schools, upper level schools and pupils autumn term 1990-2011
Figur 13.1. Antal grundskolelever efter stadium 1975-2011 Figure 13.1. Number of pupils in comprehensive school by level 1975-2011
1990 2000 2008 2009 2010 2011
Elever/Pupils 2 579 2 993 2 919 2 887 2 841 2 840
Antal skolor/Schools 28 28 25 25 23 23
Antal elever i årsklass/Pupils in formI - VI 1 734 2 081 1 871 1 865 1 840 1 842VII - IX 845 912 1 048 1 022 1 001 998
Not/Note : Inkluderar även elever med hemkommun utanför Åland/Pupils with residence outside Åland included.
Källa/Source : ÅSUB Utbildningsstatistik/Statistics Åland, Education Statistics
Skola/School 1990 2000 2008 2009 2010 2011
Totalt 845 912 1 048 1 022 1 001 998Brändö 11 18 13 10 14 15
Föglö 24 21 14 14 17 17
Kumlinge 6 16 11 7 5 9
Kökar 7 12 12 14 11 8
Sottunga - 5 5 3 5 4
Norra Ålands högstadiedistrikt 1)
Godby 230 213 253 247 227 208
Södra Ålands högstadiedistrikt 2)
Kyrkby 238 294 359 344 321 339
därav träningsundervisning/
training school 1 12 13 16 20 17
Mariehamn
Strandnäs 146 134 137 139 157 159Övernäs 183 199 244 244 244 239
Note: Upper level comprehensive school of 1) Northern Åland District, 2) Southern Åland District.
Källa/Source : ÅSUB Utbildningsstatistik/Statistics Åland, Education Statistics
0
500
1 000
1 500
2 000
2 500
1975 1980 1985 1990 1995 2000 2005 2010
Antal
Lågstadiet/Comp. Jnrlvl
Högstadiet/Senior lvl

Utbildning, kultur och rättsväsende
200 Statistisk årsbok för Åland – Statistical Yearbook of Åland 2012
13.3. Elever efter kommun i grundskolan höstterminerna 1990-2011 13.3. Number of pupils in comprehensive schools autumn term 1990-2011
13.4. Antal grundskolor och elever fördelade efter skolornas elevantal hösten 2011 13.4. Number of comprehensive schools and pupils autumn 2011
Kommun 1990 1995 2000 2005 2007 2008 2009 2010 2011
Brändö 31 43 68 58 47 42 38 45 43Eckerö 79 93 114 110 93 90 96 91 83Finström 268 264 279 299 289 294 287 280 282Föglö 68 63 58 59 55 60 60 54 61Geta 46 63 64 46 41 41 43 40 41Hammarland 143 140 163 169 160 151 151 150 150Jomala 384 408 462 501 469 475 457 465 503Kumlinge 35 49 52 33 29 26 26 27 28Kökar 13 24 31 33 33 33 29 28 27Lemland 168 216 229 226 247 257 260 264 244Lumparland 43 45 45 45 52 47 52 46 48Saltvik 193 187 203 201 193 185 194 192 195Sottunga 10 17 16 14 12 12 10 13 9Sund 89 88 118 140 128 127 114 102 88Vårdö 35 44 50 42 39 45 49 46 45
Mariehamn 971 1 005 1 045 1 083 1 063 1 036 1 026 1 003 1 006
Landskomm. 1 605 1 744 1 952 1 976 1 887 1 885 1 866 1 843 1 847-Landsbygden 1 413 1 504 1 677 1 737 1 672 1 667 1 654 1 630 1 634-Skärgården 192 240 275 239 215 218 212 213 213
Åland 2 576 2 749 2 997 3 059 2 950 2 921 2 892 2 846 2 853
Not/Note : Inkluderar åländska elever som går i skola utanför Åland/Pupils in schools outside Åland are included.
Källa/Source : ÅSUB Utbildningsstatistik/Statistics Åland, Education Statistics
Skoltyp/Type of school Antal elever i skolan/Pupils in the school
Stadium/Level Totalt -29 30-49 50-99 100-199 200+
Antal skolor/Number of schools 23 7 1 6 3 6
Med bara lågstadium/ 14 4 - 5 3 2
Compreh. Junior level
Med bara högstadium/ - - - - - -
Compreh. Senior level
Med både låg- och högst./ 9 3 1 1 - 4
Compreh. both levels
Elever/Pupils 2 840 144 42 391 432 1 831
Lågstadiet/Comp. Jnr lvl 1 842 123 27 374 432 886
Högstadiet/Senior lvl 998 21 15 17 - 945
Procent 100,0 5,1 1,5 13,8 15,2 64,5
Lågstadiet/Comp. Jnr lvl 100,0 6,7 1,5 20,3 23,5 48,1Högstadiet/Senior lvl 100,0 2,1 1,5 1,7 - 94,7
Källa/Source : ÅSUB Utbildningsstatistik/Statistics Åland, Education Statistics

Utbildning, kultur och rättsväsende
Statistisk årsbok för Åland – Statistical Yearbook of Åland 2012 201
13.5. Studerande på gymnasienivå och i övrig utbildning efter kön och hemort hösten 2011 13.5. Students at the upper second level and in other education by sex and Residence autumn 2011
13.6. Studerande vid Högskolan på Åland efter kön hösten 2011 13.6. Students at the Åland University of Applied Sciences by sex autumn 2011
Figur 13.2. Studerande på Åland med hemort utanför Åland 2003-2011 Figure 13.2. Students in Åland resident out of Åland 2003-2011
Skola/School TotaltNivå/Level Antal Procent Antal Procent Åland Övr/OthUtbildningsområde/Field of education
Totalt 1 314 687 52,3 627 47,7 1 208 106
Skola/SchoolGymn.nivå/Upper secondary level
Ålands lyceum 457 277 60,6 180 39,4 455 2Ålands yrkesgymnasium 812 386 47,5 426 52,5 718 94Profil/ Ekonomi och media/Business, media 179 106 59,2 73 40,8 176 3Profile Hotell och restaurang/Hotel, rest. 152 109 71,7 43 28,3 128 24
Livsstil och hälsa/Lifestyle, health 188 160 85,1 28 14,9 186 2Sjöfart och teknik/Shipping, eng. 293 11 3,8 282 96,2 228 65
Övrigt/OtherÅlands folkhögskola 37 21 56,8 16 43,2 27 10Ålands yrkesgymnasium 8 3 37,5 5 62,5 8 -
Nivå/LevelGymn.nivå/Upper secondary level 1 269 663 52,2 606 47,8 1 173 96
Allmänbildande gymn.utbildn./General progr. 457 277 60,6 180 39,4 455 2Grundläggande yrkesutb./Vocational progr. 812 386 47,5 426 52,5 718 94
Övrigt/Other 45 24 53,3 21 46,7 35 10
Utbildningsområde/Field of educationAllmänbildande/General 457 277 60,6 180 39,4 455 2Humanistisk/Humanities 33 20 60,6 13 39,4 32 1Handel- och samhällsvetenskap/Business and politics 203 133 65,5 70 34,5 201 2Teknisk/Technology 206 20 9,7 186 90,3 196 10Hälso- och socialvård/Health and welfare 105 94 89,5 11 10,5 103 2Servicebranscher/Services 256 114 44,5 142 55,5 177 79Annat/Other 54 29 53,7 25 46,3 44 10
Källa/Source : ÅSUB Utbildningsstatistik/Statistics Åland, Education Statistics
Kvinnor Män Hemort/Residence
Utbildningsområde/Field of education TotaltAntal Procent Antal Procent Åland Övr/Oth
Totalt 508 172 33,9 336 66,1 283 225Handel- och samhällsvetenskap/Business and politics 85 55 64,7 30 35,3 78 7
Teknisk/Technology 202 23 11,4 179 88,6 117 85
Hälso- och socialvård/Health and welfare 41 38 92,7 3 7,3 36 5Servicebranscher/Services 180 56 31,1 124 68,9 52 128
Källa/Source : ÅSUB Utbildningsstatistik/Statistics Åland, Education Statistics
Kvinnor Män Hemort/Residence
0
50
100
150
200
250
2003 2004 2005 2006 2007 2008 2009 2010 2011
Personer/Persons
Högskolan påÅland/The ÅlandUniv. of AppliedSciences
Gym.nivå o. öv.utb./Upper sec.leveland other educ.

Utbildning, kultur och rättsväsende
202 Statistisk årsbok för Åland – Statistical Yearbook of Åland 2012
13.7. Studerande efter grundskolan samt vid Högskolan på Åland efter skola höstterminerna 1985-2011 13.7. Students after comprehensive school and at the Åland University of Applied Sciences by school autumn term 1985-2011
13.8. Antal utexaminerade från gymnasienivån efter läroinrättning och kön 2010-2011 13.8. Graduated students at the upper second level by school and sex 2010-2011
Skola/School 1985 1990 1995 2000 2005 2007 2008 2009 2010 2011
Totalt 1 139 1 112 1 291 1 530 1 613 1 666 1 612 1 766 1 849 1 822Ålands lyceum 314 329 367 389 450 431 414 418 431 457
Ålands handelsläroverk1) 128 140 117 137 96 124 101 126 120 .
Ålands yrkesskola 240 231 257 267 279 288 296 291 307 .
Ålands sjömansskola 137 142 140 119 136 153 155 155 168 .
Ålands sjöfartsläroverk1) 67 48 53 89 . . . . . .
Ålands tekniska läroverk1) 69 53 105 139 . . . . . .
Ålands hotell- och rest.skola1) 78 101 123 127 103 93 90 114 105 .
Ålands vårdinstitut1) . . . 123 95 109 101 106 131 .
Ålands naturbruksskola2) 28 10 24 44 40 44 48 37 30 .
Ålands yrkesgymnasium3) . . . . . . . . . 820
Ålands husmodersskola 18 12 23 20 . . . . . .
Ålands folkhögskola 60 37 71 63 57 48 56 53 51 37
Ålands hantverksskola . 9 11 13 11 . . . . .
Högskolan på Åland4) . . . . 346 376 351 466 506 5081)Tekniska läroverket samt Sjöfartsläroverket har upphört. Programmen från dessa skolor ingår fr.o.m. 1.1.2003 i Högskolan på
Åland, liksom vissa program från Handelsläroverket, Hotell- och restaurangskolan samt Vårdinstitutet/Tekniska läroverket and
Sjöfartsläroverket have closed. Since 1.1.2003, the programs from these schools are included in the Åland University of Applied
Sciences, as well as some of the programs of Handelsläroverket, Hotell- och restaurangskolan and Vårdinstitutet. 2) Tidigare
Ålands lantmannaskola/Previously Ålands Lantmannaskola. 3) Handelsläroverket, Yrkesskolan, Sjömansskolan, Hotell- och
restaurangskolan samt Vårdinstitutet sammanslogs den 1.8.2011 till Ålands yrkesgymnasium. Naturbruksskolan stängdes 31.7.2011./
Handelsläroverket, Yrkesskolan, Sjömansskolan, Hotell- och restaurangskolan and Vårdinstitutet were merged into Ålands yrkes-
gymnasium on 1.8.2011. Naturbruksskolan was closed on 31.7.2011. 4) The Åland University of Applied Sciences.
Källa/Source : ÅSUB Utbildningsstatistik/Statistics Åland, Education Statistics
Skola/SchoolNivå/Level Totalt Kvinnor MänUtbildningsområde/Field of education 2010 2011 2010 2011 2010 2011
Totalt 356 427 202 232 154 195
Skola/SchoolÅlands lyceum 130 124 84 67 46 57Ålands handelsläroverk 30 27 17 18 13 9Ålands yrkesskola 66 98 17 30 49 68Ålands sjömansskola 21 39 1 7 20 32Ålands hotell- och rest. skola 76 56 53 36 23 20Ålands vårdinstitut 22 60 22 56 - 4Ålands naturbruksskola 11 10 8 6 3 4Ålands yrkesgymnasium . 13 . 12 . 1
Nivå/Level
Allmänbildande gymnasieutbildning/General progr. 1) 130 124 84 67 46 57Grundläggande yrkesutbildning/Vocational program 1) 226 303 118 165 108 138
Utbildningsområde/Field of educationAllmänbildande/General 130 124 84 67 46 57Humanistisk/Humanities - 14 - 10 - 4Handel- o. samhällsv./Business, politics 49 35 30 25 19 10Teknisk/Technology 55 90 4 15 51 75Lant- och skogsbruk/Agriculture 11 10 8 6 3 4Hälso- och socialvård/Health and welfare 22 60 22 56 - 4Servicebranscher/Services 89 94 54 53 35 41Annat/Other - - - - - -1) Ny nivåindelning togs i bruk 2011. Programmen i den studieförberedande utbildningen med yrkesprofil hör därefter till
Grundläggande yrkesutbildning. 2010 års siffror är omräknade enligt detta./From 2011, Vocational preparatory studies are
included in Vocational program. The numbers for 2010 are adjusted accordingly.
Källa/Source : ÅSUB Utbildningsstatistik/Statistics Åland, Education Statistics

Utbildning, kultur och rättsväsende
Statistisk årsbok för Åland – Statistical Yearbook of Åland 2012 203
13.9. Antal utexaminerade från Högskolan på Åland efter kön 2010-2011 13.9. Graduated students from the Åland University of Applied Sciences by sex 2010-2011
13.10. Antal utexaminerade från åländska skolor 2000-2011 13.10. Graduated students from schools in Åland 2000-2011
Studieprogram/Study programme Totalt Kvinnor Män
Utbildningsområde/Field of education 2010 2011 2010 2011 2010 2011
Totalt 57 47 30 14 27 33
Studieprogram/Study programmes
Elektroteknik/Electrical engineering 6 1 - - 6 1
Företagsekonomi/Business administration 7 6 7 3 - 3
Hospitality management 10 13 7 10 3 3
Informationsteknik/Information technology 1 6 1 - - 6
Maskinteknik/Marine engineering 7 4 - - 7 4
Sjöfart/Navigation 10 17 1 1 9 16
Vård/Health and caring sciences 16 - 14 - 2 -
Utbildningsområde/Field of educationHandel- o. samhällsv./Business, politics 7 6 7 3 - 3
Teknisk/Technology 14 11 1 - 13 11
Hälso- och socialvård/Health and welfare 16 - 14 - 2 -
Servicebranscher/Services 20 30 8 11 12 19
Källa/Source : ÅSUB Utbildningsstatistik/Statistics Åland, Education Statistics
Skola/School 2000 2004 2005 2006 2007 2008 2009 2010 2011
Totalt 361 394 375 386 410 458 441 413 474
Ålands lyceum 101 134 116 122 153 140 135 130 124
Ålands handelsläroverk 39 19 24 14 35 25 32 30 27
Ålands yrkesskola 52 57 79 57 57 96 71 66 98
Ålands sjömansskola 27 12 34 33 20 25 32 21 39
Ålands sjöfartsläroverk 22 . . . . . . . .
Ålands tekniska läroverk 14 . . . . . . . .
Ålands hotell- och rest. skola 61 65 58 62 63 86 68 76 56
Ålands vårdinstitut 35 34 20 35 25 40 38 22 60
Ålands naturbruksskola 10 4 6 7 15 7 20 11 10
Ålands yrkesgymnasium . . . . . . . . 13
Högskolan på Åland . 69 38 56 42 39 45 57 47
Not/Note : Se not för tabell 13.7/See note of table 13.7
Källa/Source : ÅSUB Utbildningsstatistik/Statistics Åland, Education Statistics
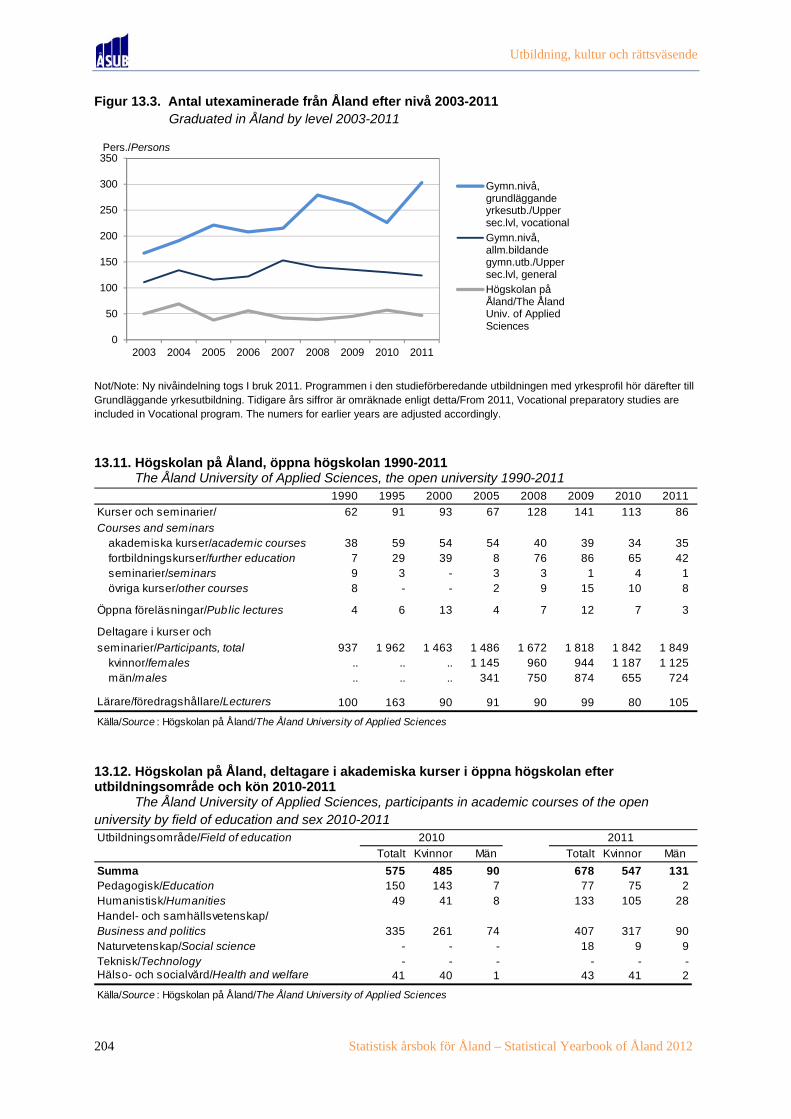
Utbildning, kultur och rättsväsende
204 Statistisk årsbok för Åland – Statistical Yearbook of Åland 2012
Figur 13.3. Antal utexaminerade från Åland efter nivå 2003-2011 Figure 13.3. Graduated in Åland by level 2003-2011
Not/Note: Ny nivåindelning togs I bruk 2011. Programmen i den studieförberedande utbildningen med yrkesprofil hör därefter till Grundläggande yrkesutbildning. Tidigare års siffror är omräknade enligt detta/From 2011, Vocational preparatory studies are included in Vocational program. The numers for earlier years are adjusted accordingly.
13.11. Högskolan på Åland, öppna högskolan 1990-2011 13.11. The Åland University of Applied Sciences, the open university 1990-2011
13.12. Högskolan på Åland, deltagare i akademiska kurser i öppna högskolan efter utbildningsområde och kön 2010-2011 13.12. The Åland University of Applied Sciences, participants in academic courses of the open university by field of education and sex 2010-2011
0
50
100
150
200
250
300
350
2003 2004 2005 2006 2007 2008 2009 2010 2011
Pers./Persons
Gymn.nivå,grundläggandeyrkesutb./Uppersec.lvl, vocational
Gymn.nivå,allm.bildandegymn.utb./Uppersec.lvl, general
Högskolan påÅland/The ÅlandUniv. of AppliedSciences
1990 1995 2000 2005 2008 2009 2010 2011
Kurser och seminarier/ 62 91 93 67 128 141 113 86
Courses and seminarsakademiska kurser/academic courses 38 59 54 54 40 39 34 35fortbildningskurser/further education 7 29 39 8 76 86 65 42seminarier/seminars 9 3 - 3 3 1 4 1övriga kurser/other courses 8 - - 2 9 15 10 8
Öppna föreläsningar/Public lectures 4 6 13 4 7 12 7 3
Deltagare i kurser och
seminarier/Participants, total 937 1 962 1 463 1 486 1 672 1 818 1 842 1 849kvinnor/females .. .. .. 1 145 960 944 1 187 1 125män/males .. .. .. 341 750 874 655 724
Lärare/föredragshållare/Lecturers 100 163 90 91 90 99 80 105
Källa/Source : Högskolan på Åland/The Åland University of Applied Sciences
Utbildningsområde/Field of education
Totalt Kvinnor Män Totalt Kvinnor Män
Summa 575 485 90 678 547 131Pedagogisk/Education 150 143 7 77 75 2Humanistisk/Humanities 49 41 8 133 105 28Handel- och samhällsvetenskap/Business and politics 335 261 74 407 317 90Naturvetenskap/Social science - - - 18 9 9Teknisk/Technology - - - - - -Hälso- och socialvård/Health and welfare 41 40 1 43 41 2
Källa/Source : Högskolan på Åland/The Åland University of Applied Sciences
2010 2011

Utbildning, kultur och rättsväsende
Statistisk årsbok för Åland – Statistical Yearbook of Åland 2012 205
13.13. Studerande vid Ålands musikinstitut efter kön 1995-2011 13.13. Students at Music school by sex 1995-2011
13.14. Medborgarinstitutet 1990-2011 13.14. Adult Education Center 1990-2011
13.15. Studerande i läroavtalsutbildning efter kön och utbildningsområde 2011 13.15. Students at apprenticeship training by sex and field of education 2011
Kön/Sex 1995 2000 2004 2005 2006 2007 2008 2009 2010 2011
Totalt 129 290 233 220 259 243 260 263 275 275
Kvinnor .. 226 181 167 182 176 192 192 210 205
Män .. 64 52 53 77 67 68 71 65 70
Källa/Source : Ålands musikinstitut/Music school
1990 1995 2000 2005 2006 2007 2008 2009 2010 2011
Deltagare totalt/
Participants, total 5 270 4 286 10 627 10 044 9 660 5 502 5 556 6 538 6 130 6 264
Elever/Students 3 605 3 165 7 542 5 983 5 582 4 187 4 375 4 871 4 758 3 082kvinnor .. .. 5 496 4 543 4 211 3 110 3 291 3 678 3 689 2 400män .. .. 2 046 1 440 1 371 1 077 1 084 1 193 1 069 682
Källa/Source : Medborgarinstitutet/Adult Education Center
Utbildningsområde/ TotaltField of education Grundut- Fort- Yrkes- Spec. yrk.Kön/Sex bildning/ bildning/ examen/ examen/
Elementary Further Vocational Spec.training vocational
Totalt 186 40 37 65 44Pedagogisk/Education - - - - -Humanistisk/Humanities 1 1 - - -Handel/Business 23 - - 3 20Naturvet./Natural scien. - - - - -Teknisk/Engineering 80 8 8 49 15Lant- och skogsbruk/Agriculture 4 1 - 3 -Hälso- och sjukvård/Health care 38 28 3 7 -Service/Services 40 2 26 3 9
Kvinnor 86 26 12 17 31Pedagogisk/Education - - - - -Humanistisk/Humanities 1 1 - - -Handel/Business 20 - - 3 17Naturvet./Natural scien. - - - - -Teknisk/Engineering 8 - - 2 6Lant- och skogsbruk/Agriculture 2 - - 2 -Hälso- och sjukvård/Health care 34 24 3 7 -Service/Services 21 1 9 3 8
Män 100 14 25 48 13Pedagogisk/Education - - - - -Humanistisk/Humanities - - - - -Handel/Business 3 - - - 3Naturvet./Natural scien. - - - - -Teknisk/Engineering 72 8 8 47 9Lant- och skogsbruk/Agriculture 2 1 - 1 -Hälso- och sjukvård/Health care 4 4 - - -Service/Services 19 1 17 - 1
Källa/Source : LR Utbildningsavdelningen/The Government of Åland, Department of Education
Utbildningstyp/Type of education

Utbildning, kultur och rättsväsende
206 Statistisk årsbok för Åland – Statistical Yearbook of Åland 2012
13.16. Åländska studerande utanför Åland efter studieland och utbildningsnivå 2011 13.16. Students from Åland in schools outside Åland by country of school and level of education 2011
13.17. Studiestöd 2007-2011 13.17. Financial support to students 2007-2011
Figur 13.4. Studiepenning efter studieland 1985-2011 Figure 13.4. Financial support to students by country of school 1985-2011
Studieland/Country of school Totalt Utbildningsnivå/Level of educationFolkhög- Gymnasie- Hög- Yrkes-
skoleutb./ nivåutb./ skole- högskole-Folk high Upper utbildn./ utbildn./ Övrigt/
schools sec. level Univer- Poly- Othereducation sities technics
Totalt 1 306 68 177 908 127 26
Finland 335 19 62 130 117 7
Sverige/Sweden 890 47 106 711 10 16
Övr. Norden/Other Nordic country 23 2 3 17 - 1
Övr. Europa/Other Europ. country 41 - 3 36 - 2
Utom Europa/Outside Europe 17 - 3 14 - -
Källa/Source : LR Utbildningsavdelningen/The Government of Åland, Department of Education
Studieland/Country of school Studielån/Loans Studiepenning/Grants
Studienivå/Level of education 2007 2008 2009 2010 2011 2007 2008 2009 2010 2011
Beviljade studiestöd för studier/
Granted support for studies 862 780 867 909 944 2 524 2 386 2 528 2 631 2 941- Åland 238 182 234 284 273 1 193 1 122 1 207 1 309 1 399
- Finland 88 94 95 119 146 237 230 255 301 399
Högskolor/Universities 71 75 81 106 125 171 178 202 256 308
Övrig utb./Other education 17 19 14 13 21 66 52 53 53 91
- Sverige/Sweden 488 458 482 465 473 1 021 967 972 952 1 036
Högskolor/Universities 421 396 403 410 416 839 793 817 803 867
Övrig utb./Other education 67 62 79 55 57 182 174 155 149 169
- Övriga länder/Other countries 48 46 56 41 52 73 67 94 69 107
Högskolor/Universities 40 42 53 41 46 56 52 73 57 97Övrig utb./Other education 8 4 3 - 6 17 15 21 12 10
Källa/Source : LR Utbildningsavdelningen/The Government of Åland, Department of Education
0
200
400
600
800
1 000
1 200
1 400
1 600
1985 1990 1997 2005 2006 2007 2008 2009 2010 2011
Åland FinlandSverige/Sweden Övriga länder/Other

Utbildning, kultur och rättsväsende
Statistisk årsbok för Åland – Statistical Yearbook of Åland 2012 207
13.18. Antal lärare efter skolnivå, uppgift, kön och medelålder vårterminen 2011 13.18. Number of teachers by level of school, position, sex and average age spring term 2011
Figur 13.5. Lärare efter skolnivå och kön 2011 Figure 13.5. Teachers by level of school and sex 2011
Uppgift/Position Totalt Grundskol./ Gymn.nivå/ Högskolan/ Övrig utb./ Könsfördeln., procent/
Kön/Sex Compre- Upper The Ål. Univ. Other Sex, per cent
Medelålder/Average age hensive sec. level 1) of Appl.Sc. education 3) K MTotalt 650 412 170 39 29 68,0 32,0
Uppgift/PositionRektor, vicerektor,förest./Headmaster 33 22 8 1 2 51,5 48,5Klasslärare/Class teacher 121 121 - - - 90,1 9,9Speciallärare/Remedial teachers 43 40 3 - - 90,7 9,3Överlärare, prefekt/Senior master, dept. head 12 - - 12 - 33,3 66,7Lektor/Senior subjectteacher 215 89 93 16 17 52,6 47,4Timlärare/Unattached
teacher 114 52 46 6 2) 10 58,8 41,2Studie-,elevhandled./Study counsellor 12 4 5 3 - 91,7 8,3Assistent, ass.lärare/Assistant teacher 100 84 15 1 - 82,0 18,0
Kön/SexKvinnor/Females 442 328 83 14 17Män/Males 208 84 87 25 12Medelålder/Average age 46,4 44,9 48,1 50,7 51,3 46,5 46,21) Inklusive Ålands folkhögskola/Including Ålands folkhögskola. 2) Omfattar endast timlärare i huvudsyssla/Only full-time fee-paid
teachers are included. 3) Omfattar endast rektorer och lärare som undervisar minst 14 timmar per vecka vid Ålands musikinstitut
och Medborgarinstitutet/Only headmasters and teachers teaching more than 14 hours pro week at the Music School and the
Adult Education Center are included.
Källa/Source : ÅSUB Utbildningsstatistik/Statistics Åland, Education Statistics
0
50
100
150
200
250
300
350
Grundskolan Gymnasienivå Högskolan Övrig utbildning
Antal
Kvinnor Män
Not/Note : Grundskolan = Comprehensive , Gymnasialstadiet = Upper sec. level ,
Högskolan = Åland University of Applied Sciences , Övrig utbildning = Other education.

Utbildning, kultur och rättsväsende
208 Statistisk årsbok för Åland – Statistical Yearbook of Åland 2012
13.19. Andel av befolkningen som avlagt examen utöver grundnivå efter åldersgrupp och kön 2007-2010, procent 13.19. Population with secondary and tertiary educational qualification by age and sex 2007-2010, per cent
13.20. Befolkningens utbildningsstruktur 2008-2010 13.20. Population by field of education 2008-2010
Åldersgrupp/ Totalt Kvinnor MänAge 2007 2008 2009 2010 2007 2008 2009 2010 2007 2008 2009 2010Totalt (15+ år) 58,2 58,7 59,4 59,8 58,4 59,1 59,9 60,6 58,0 58,3 58,9 58,915-19 11,1 12,6 11,5 11,4 10,6 12,3 10,5 12,2 11,6 12,9 12,5 10,720-24 69,9 71,0 71,6 70,8 71,7 71,6 72,7 71,4 68,2 70,5 70,7 70,425-29 74,6 74,1 74,8 73,8 77,1 77,3 79,3 79,0 72,3 71,1 70,5 68,730-34 79,7 78,1 78,2 78,3 83,4 81,1 80,6 81,8 76,1 75,3 75,9 75,035-39 78,2 78,5 78,1 77,2 81,7 82,6 82,9 81,9 74,7 74,3 73,4 72,940-44 74,8 75,6 74,9 76,2 81,0 81,4 81,3 81,7 68,4 69,5 68,4 70,545-49 68,1 69,4 72,0 71,9 75,2 76,5 78,8 79,0 61,1 62,3 65,3 65,050-54 67,4 67,6 67,4 68,3 70,9 72,5 73,2 75,0 63,6 62,3 61,0 61,055-59 64,8 65,6 67,3 68,1 65,3 65,7 67,9 69,5 64,2 65,5 66,6 66,760-64 52,7 54,7 56,0 57,6 49,3 52,1 54,2 56,6 56,0 57,2 57,6 58,665+ 35,9 36,8 38,4 39,8 29,6 30,5 32,0 33,7 43,7 44,4 45,9 46,9
Not/Note : Uppgifterna om utländska examina är ofullständiga. Detta innebär att tabellen visar utbildningsnivåer som är lägre än
de verkliga/The information about foreign exams is incomplete, which means that the educational levels shown in the table are
lower than they are in reality.
Källa/Source : Statistikcentralen, Utbildning/Statistics Finland, Education
Utbildningsområde/ TotaltField of education
2008 2009 2010 2008 2009 2010 2008 2009 2010 2008 2009 2010
Examen efter grundnivå/ 13 408 13 715 14 000 8 301 8 520 8 737 5 107 5 195 5 263 62 59 59Pop. w. educational qual.
Allmänbild./General 1 357 1 414 1 453 1 357 1 414 1 453 - - - - - -
Pedagog./Education 426 423 423 3 3 3 423 420 420 2 2 2
Hum., konst/Hum., arts 458 479 494 132 144 145 326 335 349 15 14 12
Samhällsvet, handel/
Social scienc., business 2 673 2 729 2 773 983 1 011 1 047 1 690 1 718 1 726 17 17 19
Naturvet./Natural scien. 185 189 193 41 44 44 144 145 149 17 15 15
Teknik/Engineering 2 807 2 866 2 925 1 858 1 908 1 963 949 958 962 5 5 5
Lant-, skogsbruk/Agricult. 636 643 648 500 505 509 136 138 139 - - -
Hälso-, soc./Health care 1 977 2 060 2 119 1 100 1 153 1 173 877 907 946 6 5 5
Service/Services 2 881 2 905 2 962 2 325 2 336 2 396 556 569 566 - 1 1
Annat, okänt/Other 8 7 10 2 2 4 6 5 6 - - -
Not/Note : Uppgifterna om utländska examina är ofullständiga. Detta innebär att tabellen visar utbildningsnivåer som är lägre än de
verkliga/The information about foreign exams is incomplete, which means that the educational levels shown in the table are lower
than they are in reality.
Källa/Source : Statistikcentralen, Utbildning/Statistics Finland, Education
Mellannivå/Mid level Högre nivå/Upper levelDärav forskarutb./
Of which grad. stud.Totalt

Utbildning, kultur och rättsväsende
Statistisk årsbok för Åland – Statistical Yearbook of Åland 2012 209
13.21. Biblioteksverksamheten 1985-2011 13.21. Public libraries 1985-2011
Figur 13.6. Biblioteksverksamheten 1975-2011 Figure 13.6. Public libraries 1975-2011
13.22. Biblioteksverksamheten efter kommun 2011 13.22. Public libraries by municipality 2011
Mediabestånd/Holdings of media
Utlåning/Home loans
Låntagare/Borrowers 1985 1990 1995 2000 2010 2011Mediabestånd vid årets slut/ 218 850 275 735 307 238 332 564 326 210 325 946Holdings of media
Mariehamns stadsbibliotek1) 95 305 119 091 126 881 141 962 120 008 117 829
Landskommunernas bibliotek2) 123 545 156 644 180 357 190 602 206 202 208 117
Utlåning/Home loans 329 578 332 958 462 828 486 139 476 376 468 644
Mariehamns stadsbibliotek1) 186 496 201 930 310 061 312 112 276 930 262 631
Landskommunernas bibliotek2) 143 082 131 028 152 767 174 027 199 446 206 0131) Mariehamn library. 2) Other municipalities. Källa/Source : ÅSUB, LR Utbildningsavd/Statistics Åland, The Government of Åland, Department of Education
0
100 000
200 000
300 000
400 000
500 000
600 000
1975 1980 1985 1990 1995 2000 2005 2010
Antal
Utlåning/Homeloans
Bestånd/Holdingsof media
Kommun Mediabestånd/ Utlåning/ Bestånd/ Lån/inv./ Lån/ Personal, Öppet, Besök/Holdings Home inv./ Borrow./ bestånd/ årsverken/ tim/vecka/ Visitsof media loans Holdings/ inh. Borrow./ Personnel, Open,
31.12 inh. holdings staff-years hours/weekBrändö 16 779 4 973 35,0 10,4 0,3 0,6 18 4 700Eckerö 11 440 8 892 11,7 9,1 0,8 0,4 7 5 200Finström 20 249 41 896 8,0 16,6 2,1 2,1 32 25 700Föglö 10 689 6 510 18,5 11,3 0,6 0,5 12 2 900Geta 8 577 2 629 17,4 5,3 0,3 0,4 8 ..Hammarland 22 345 12 771 14,6 8,4 0,6 0,7 14 6 300Jomala 29 820 50 273 7,0 11,8 1,7 3,2 49 13 000Kumlinge 13 718 6 537 38,0 18,1 0,5 0,4 9 2 000Kökar 7 785 12 939 31,3 52,0 1,7 0,6 10 3 000Lemland 17 625 27 378 9,5 14,7 1,6 1,0 47 9 700Lumparland 8 925 6 205 22,4 15,6 0,7 0,5 9 2 600Saltvik 12 753 9 249 7,0 5,1 0,7 0,7 15 3 600Sottunga 5 544 1 257 53,8 12,2 0,2 0,3 4 400Sund 13 930 10 590 13,5 10,3 0,8 0,6 12 3 500Vårdö 7 938 3 914 17,7 8,7 0,5 0,4 11 2 900
Mariehamn 117 829 262 631 10,5 23,3 2,2 13,2 60 243 400
Landskomm. 208 117 206 013 12,2 12,1 1,0 11,7 .. 85 500 1)
-Landsbygden 145 664 169 883 9,8 11,4 1,2 9,6 .. 69 600 1)
-Skärgården 62 453 36 130 28,1 16,3 0,6 2,1 .. 15 900
Åland 325 946 468 644 11,5 16,5 1,4 24,9 .. 328 900 1)
Not/Note: Geta ingår inte i uppgifterna/Geta is not included in the figures
Källa/Source : ÅSUB, LR Utbildningsavd/Statistics Åland, The Government of Åland, Department of Education

Utbildning, kultur och rättsväsende
210 Statistisk årsbok för Åland – Statistical Yearbook of Åland 2012
13.23. Bokproduktion på Åland efter ämne 2006-2011 13.23. Book production in Åland by subject area 2006-2011
Figur 13.7. Bokproduktion på Åland efter område 2000-2011 Figure 13.7. Book production in Åland 2000-2011
Ämnesområde/Subject area 2006 2007 2008 2009 2010 2011
Totalt antal tryck/Total number of publications 78 68 58 60 54 62
A. Bok- och biblioteksväsen/Books and libraries - - - - - -
B. Skrifter av allmänt och blandat innehåll/General and miscellaneous publications 1 4 - 4 - 3
C. Religion/Religion 1 - - - - 1
D. Filosofi och psykologi/Philosophy and psychology - - - - 1 1
E. Uppfostran och undervisning/Upbringing and education 5 5 2 2 - 3
F. Språkvetenskap/Linguistics 1 - 3 1 - -
G. Litteraturvetenskap/Literary history 1 - 1 2 1 -
H. Skönlitteratur/Fiction 18 9 6 11 13 9
I. Konst, musik, teater, film/Art, music, theatre, film 4 5 3 1 6 4
J. Arkeologi/Archeology - 1 1 - - 1
K. Historia/History 2 - 5 1 1 1
L. Biografi med genealogi/Biography, genealogy 3 3 1 1 3 1
M. Etnografi, socialantropologi och etnologi/Ethnography, anthropology and ethnology - 1 - - - 1
N. Geografi/Geography 8 10 7 6 5 7
O. Samhälls- och rättsvetenskap/Social- and legal science 14 15 15 12 11 12
P. Teknik, industri, kommunikationer/Technology, industry communications 7 5 - 2 2 3
Q. Ekonomi och näringsväsen/Economics and business 13 6 12 13 8 14
R. Idrott, lek och spel/Sport and games - 2 1 2 - -
S. Militärväsen/Military affairs - - - - - -
T. Matematik/Mathematics - - - - - -
U. Naturvetenskap/Natural sciences - 2 1 2 3 1
V. Medicin/Medicine - - - - - -
Not/Note : Bokproduktionen på Åland innefattar böcker utgivna av åländskt förlag eller av åländsk författare. Exkl. lösa kartor och publikationer under 16 s./The book production in Åland includes books by authors from Åland or published by publishing housesin Åland. Maps and publications with less than 16 pages are excluded.
Källa/Source : Mariehamns stad, stadsbiblioteket/The Mariehamn Library
0
10
20
30
40
50
60
70
80
90
2000 2001 2002 2003 2004 2005 2006 2007 2008 2009 2010 2011
Antal
Barn- o ungd.litt/Children and youth lit. Skönlitt./Fiction Facklitt/Spec. literat.

Utbildning, kultur och rättsväsende
Statistisk årsbok för Åland – Statistical Yearbook of Åland 2012 211
13.24. Kommunernas driftskostnader för undervisning och kultur 2010, 1 000 EUR 13.24. Current expenditure on education and culture of municipalities 2010, 1 000 EUR
13.25. Landskapsandelar för grundskolutgifter 2007-2011, 1 000 EUR 13.25. Government of Åland subsidies for comprehensive school expenditure 2007-2011, 1 000 EUR
Kommun Utb. o. kulturförv./ Grundskola/ Övr undervisn./ Bibliotek/ Övrig verks./
Totalt Administration Comprehens. sch. Other education Public libraries Other services
Brändö 986 35 778 16 82 75
Eckerö 1 400 2 1 282 12 37 67
Finström 4 312 9 3 482 33 173 615
Föglö 1 138 18 973 8 60 79
Geta 901 1 853 5 38 4
Hammarland 2 214 3 1 926 19 63 203
Jomala 5 980 5 5 171 45 239 520
Kumlinge 670 47 569 5 39 10
Kökar 601 21 523 4 44 9
Lemland 3 278 5 2 911 23 113 226
Lumparland 772 3 688 5 44 32
Saltvik 2 891 177 2 503 28 45 138
Sottunga 353 39 297 1 15 1
Sund 1 788 22 1 545 14 65 142
Vårdö 763 3 657 40 44 19
Mariehamn 18 268 229 9 910 2 092 1 477 4 560
Landskomm. 28 047 390 24 158 258 1 101 2 140
-Landsbygden 23 536 227 20 361 184 817 1 947
-Skärgården 4 511 163 3 797 74 284 193
Åland 46 315 619 34 068 2 350 2 578 6 700
Procent 100,0 1,3 73,6 5,1 5,6 14,5
Källa/Source : ÅSUB Offentlig ekonomi/Statistics Åland, Public Finance
Kommun 2007 2008 2009 2010 2011 2011EUR/elev/pupil
Brändö 361 367 372 337 337 7 836
Eckerö 380 634 599 609 596 7 182
Finström 866 1 221 1 306 1 335 1 381 4 896
Föglö 350 441 451 473 440 7 205
Geta 197 354 380 399 401 9 770
Hammarland 434 955 959 948 959 6 391
Jomala 1 303 1 677 1 778 1 693 1 710 3 399
Kumlinge 203 204 222 208 234 8 372
Kökar 237 265 272 251 220 8 139
Lemland 614 1 081 1 191 1 202 1 184 4 852
Lumparland 162 255 274 274 308 6 410
Saltvik 492 830 863 869 930 4 768
Sottunga 79 95 86 93 103 11 395
Sund 431 739 720 714 665 7 554
Vårdö 195 312 344 358 388 8 628
Mariehamn 2 091 2 222 2 332 2 315 2 295 2 281
Landskomm. 6 305 9 431 9 816 9 760 9 853 5 335
-Landsbygden 4 879 7 746 8 069 8 042 8 132 4 977
-Skärgården 1 426 1 684 1 747 1 718 1 721 8 082
Åland 8 396 11 653 12 148 12 075 12 148 4 258
Källa/Source : LR Utbildningsavdelningen, ÅSUB/The Government of Åland, Department of Education, Statistics Åland
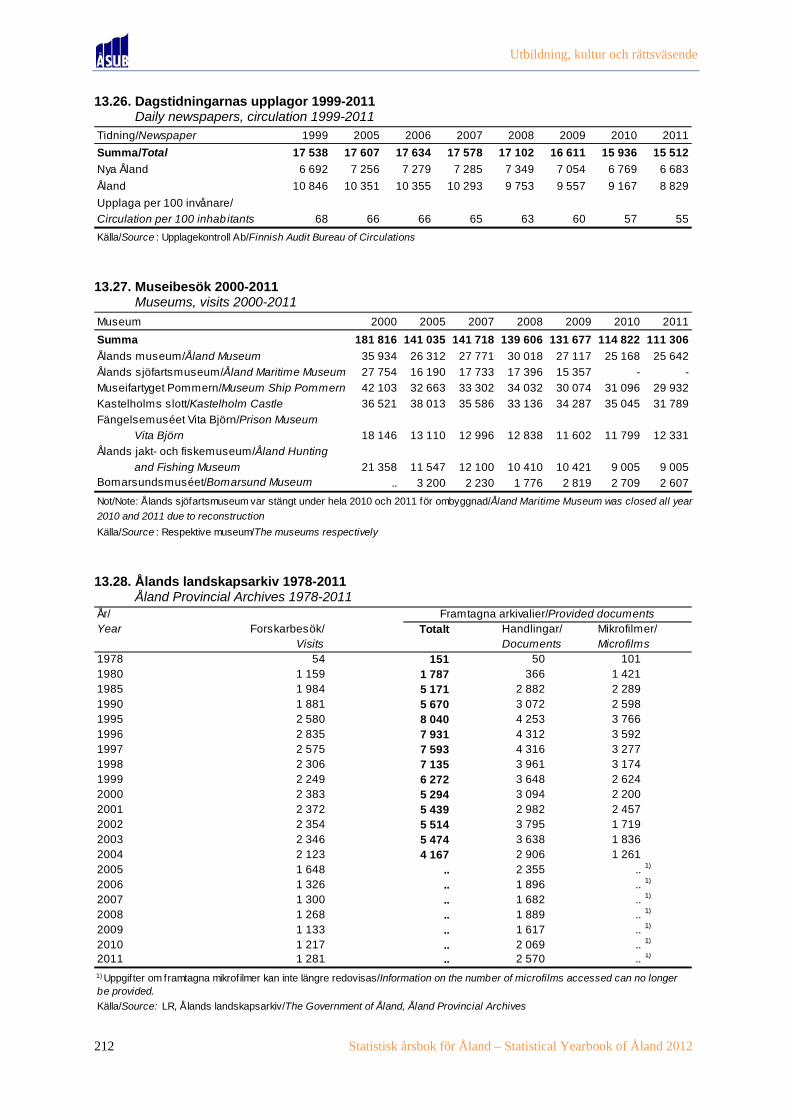
Utbildning, kultur och rättsväsende
212 Statistisk årsbok för Åland – Statistical Yearbook of Åland 2012
13.26. Dagstidningarnas upplagor 1999-2011 13.26. Daily newspapers, circulation 1999-2011
13.27. Museibesök 2000-2011 13.27. Museums, visits 2000-2011
13.28. Ålands landskapsarkiv 1978-2011 13.28. Åland Provincial Archives 1978-2011
Tidning/Newspaper 1999 2005 2006 2007 2008 2009 2010 2011
Summa/Total 17 538 17 607 17 634 17 578 17 102 16 611 15 936 15 512
Nya Åland 6 692 7 256 7 279 7 285 7 349 7 054 6 769 6 683
Åland 10 846 10 351 10 355 10 293 9 753 9 557 9 167 8 829
Upplaga per 100 invånare/
Circulation per 100 inhabitants 68 66 66 65 63 60 57 55
Källa/Source : Upplagekontroll Ab/Finnish Audit Bureau of Circulations
Museum 2000 2005 2007 2008 2009 2010 2011
Summa 181 816 141 035 141 718 139 606 131 677 114 822 111 306
Ålands museum/Åland Museum 35 934 26 312 27 771 30 018 27 117 25 168 25 642
Ålands sjöfartsmuseum/Åland Maritime Museum 27 754 16 190 17 733 17 396 15 357 - -
Museifartyget Pommern/Museum Ship Pommern 42 103 32 663 33 302 34 032 30 074 31 096 29 932
Kastelholms slott/Kastelholm Castle 36 521 38 013 35 586 33 136 34 287 35 045 31 789
Fängelsemuséet Vita Björn/Prison Museum
Vita Björn 18 146 13 110 12 996 12 838 11 602 11 799 12 331
Ålands jakt- och fiskemuseum/Åland Hunting
and Fishing Museum 21 358 11 547 12 100 10 410 10 421 9 005 9 005Bomarsundsmuséet/Bomarsund Museum .. 3 200 2 230 1 776 2 819 2 709 2 607
Not/Note: Ålands sjöfartsmuseum var stängt under hela 2010 och 2011 för ombyggnad/Åland Maritime Museum was closed all year
2010 and 2011 due to reconstruction
Källa/Source : Respektive museum/The museums respectively
År/ Framtagna arkivalier/Provided documentsYear Forskarbesök/ Totalt Handlingar/ Mikrofilmer/
Visits Documents Microfilms1978 54 151 50 1011980 1 159 1 787 366 1 4211985 1 984 5 171 2 882 2 2891990 1 881 5 670 3 072 2 5981995 2 580 8 040 4 253 3 7661996 2 835 7 931 4 312 3 5921997 2 575 7 593 4 316 3 2771998 2 306 7 135 3 961 3 1741999 2 249 6 272 3 648 2 6242000 2 383 5 294 3 094 2 2002001 2 372 5 439 2 982 2 4572002 2 354 5 514 3 795 1 7192003 2 346 5 474 3 638 1 8362004 2 123 4 167 2 906 1 2612005 1 648 .. 2 355 .. 1)
2006 1 326 .. 1 896 .. 1)
2007 1 300 .. 1 682 .. 1)
2008 1 268 .. 1 889 .. 1)
2009 1 133 .. 1 617 .. 1)
2010 1 217 .. 2 069 .. 1)
2011 1 281 .. 2 570 .. 1)
1) Uppgifter om framtagna mikrofilmer kan inte längre redovisas/Information on the number of microfilms accessed can no longerbe provided.
Källa/Source: LR, Ålands landskapsarkiv/The Government of Åland, Åland Provincial Archives

Utbildning, kultur och rättsväsende
Statistisk årsbok för Åland – Statistical Yearbook of Åland 2012 213
13.29. Församlingarnas folkmängd och verksamhet 2000-2010 13.29. Members and activities of parishes 2000-2010
13.30. Församlingarnas folkmängd och ekonomi 2010 13.30. Members and economy of parishes 2010
2000 2005 2009 2010
Församlingarnas invånare/Members of parishes 23 801 23 828 23 546 23 341Procent av Ålands invånare/per cent of Åland's inhabitants 92,3 89,0 84,9 83,3Döpta/Baptisms 239 234 206 218Procent av antalet födda under året/ 92,6 83,3 77,2 76,2per cent of children born during the yearAvlidna/Deaths 235 250 237 222Inträtt i kyrkan/Enrollments 28 70 69 72Utträtt ur kyrkan/Resignations 44 79 150 209Deltagare i allmänt församlingsarbete/Attendants in parish activities :
Gudstjänster/Services 62 080 55 454 45 940 44 345-procent av inv. per vecka/per cent of members pro week 5,0 4,5 3,7 3,6
Förrättningar/Ministrations 27 896 25 924 22 833 22 125Församlingssammankomster/Parish gatherings 1) 29 193 24 355 7 609 7 767
Antal barn som deltagit i barngrupper/ 769 363 236 316Children in children groupsAntal personer som deltagit i konfirmandundervisning/ 267 341 306 321People in preparation for confirmationDiakoniklienter i procent av befolkningen/ 2,2 3,0 1,9 1,7Deacon's clients, per cent of inhab itants
Not/Note: Tabellen omfattar församlingarna i den Evangelisk-lutherska kyrkan/Only Evangelic-Lutheran parishes included. 1)Från2009 ingår inte längre musikevenemang i Församlingssammankomster/From 2009 on, music events in parish gatherings are nolonger included
Källa/Source : Kyrkostyrelsen, Statistisk årsbok för kyrkan/The Church Board, Statistical Yearbook of the Church
Församling/Parish Närvaran- Procent av Förändring Skatte- Verksam- Årsbidrag Investeringarde befolk- kommu- från procent/ hetskostn./ per invånare/ i anläggn.tillg/ning/En- nens bef./ 31.12.2009/ Tax Activity Annual Investmentsrolled in- Per cent of Change per- costs contribution in fixedhabitants inhabitants in from centage per member assets
31.12.2010 municipality 31.12.2009 1 000 EUR EUR 1 000 EUR
Eckerö 794 84,2 3 2,00 222 16 7
Finström-Geta 2 584 86,8 -25 1,95 678 42 16
Hammarland 1 329 88,1 15 1,80 495 79 27
Jomala 3 577 87,3 33 1,50 881 20 100
Lemland-Lumparland 1 885 85,4 20 1,70 472 27 72
Saltvik 1 613 89,5 -8 1,75 391 32 64
Sund-Vårdö 1 268 86,2 -20 2,00 405 -5 59
Brändö-Kumlinge 731 85,8 -20 2,00 327 31 14
Södra skärg.förs.1) 799 83,4 -2 2,00 301 -18 105
Mariehamn 8 761 78,3 -161 1,45 2 480 71 565
Åland 23 341 83,3 -165 1,62 6 652 44 1 029
Not/Note : Tabellen omfattar församlingarna i den Evangelisk-lutherska kyrkan/Only Evangelic-Lutheran parishes included.1)Bildades efter sammanslagning av Föglö, Kökar och Sottunga församlingar/Was formed by a union of the parishesof Föglö, Kökar and Sottunga.
Källa/Source : Kyrkostyrelsen, Statistisk årsbok för kyrkan/The Church Board, Statistical Yearbook of the Church

Utbildning, kultur och rättsväsende
214 Statistisk årsbok för Åland – Statistical Yearbook of Åland 2012
13.31. Brott som kommit till polisens kännedom efter kön och ålder 2011 13.31. Offences known to the police by sex and age 2011
13.32. Ålands tingsrätt 2000-2011 13.32. Åland General Court of first instance 2000-2011
Allabrott/ Totalt
Off. total K M -14 15-20 21-
Alla brott/All offences 2 086 1 121 16,1 83,9 3,3 26,9 69,8
Egendomsbrott/Property offences 1 052 299 18,1 81,9 4,7 44,1 51,2
Brott mot liv och hälsa/Offences ag. life and health 185 142 21,1 78,9 3,5 14,8 81,7
Sexualbrott/Sexual crimes 13 15 - 100,0 - 26,7 73,3
Brott mot samhället/Off. ag. public auth. 82 67 11,9 88,1 3,0 19,4 77,6
Trafikbrott/Traffic offences 230 210 11,0 89,0 2,9 28,6 68,6
Övriga brott/Other offences 524 388 17,0 83,0 2,6 18,6 78,9
Not/Note : Uppgifterna för trafikbrott och övriga brott är inte jämförbara med tidigare år/The figures for traffic offences andother offences are not comparable with previous year.Källa/Source : Statistikcentralen, Rättsväsen/Statistics Finland, Justice
Ålder/Age, %Personer misstänkta för brott/Suspected persons
Kön/Sex, %
Typ av ärende/Type of case 2000 2005 2006 2007 2008 2009 2010 2011
Slutbehandlade ärenden, totalt/Cases settled 5 659 4 501 4 628 3 861 3 783 .. .. ..
Brottmål/Criminal cases 258 341 367 467 473 385 355 332
Omfattande tvistemål/Regular proceedings 537 688 716 809 662 884 913 820
Konkursmål/Bankruptcies 18 5 5 - 1 4 2 6
Ansöknings- och anmäln.ärenden/Petitions and registrations 4 846 3 467 3 540 2 585 2 647 .. .. ..
äktenskapsskillnader/Divorces 60 58 80 69 56 63 66 67
lagfarter/Confirmations of real estate 1 099 1 168 1 088 1 002 1 146 .. .. ..
fastigh. inteckn./Real estate mortgages 3 360 2 098 2 225 1 379 1 261 .. .. ..
övriga/Others 327 143 147 135 184 .. .. ..
Not/Note : Uppgifterna fr o m 2009 är inte jämförbara med tidigare år/Figures from 2009 are not comparable with previous year
Källa/Source : Statistikcentralen, Rättsväsen/Statistics Finland, Justice

14
14. Val 14. Elections
0
20
40
60
80
100
1975 1979 1983 1987 1991 1995 1999 2003 2007 2011
Valdeltagande i lagtingsval efter region 1975-2011Election for the legislative assembly, participation by region 1975-
2011
Skärgården
Landsbygden
Mariehamn

Val Statistiken över allmänna val omfattar val till Ålands lagting och till kommunernas fullmäktige. Dessutom innehåller statistiken uppgifter om resultatet på Åland när det gäller val till Finlands riksdag och val av Finlands president samt val till EU-parlamentet. Också över folkomröstningar görs valstatistik. Objekt för statistiken är de röstberättigade och röstande, de uppställda kandidaterna och de invalda samt politiska grupperingar och listor. Statistiken i detta kapitel redovisas för hela Åland och regionerna samt, främst gällande kommunalvalet, för kommunerna. En utförligare beskrivning av valstatistiken inklusive definitioner av variabler finns på ÅSUBs webbplats www.asub.ax under Statistik efter ämne/Val. Där finns också information om valsystemet. Källorna anges under varje tabell. Tillförlitligheten är hög i och med att statistiken baseras på ett totalt material och uppgifter som är framtagna och kontrollräknade av valmyndigheterna. Jämförbarheten mellan olika val och över tiden begränsas i viss mån av att de politiska grupperingarna skiljer sig mellan de olika typerna av val och också förändras från val till val. Jämförbarheten med befolkningsstatistiken är god eftersom vallängderna över de röstberättigade baseras direkt på befolkningsregistret. Detaljerad statistik om de enskilda valen publiceras i separata publikationer som kan beställas från ÅSUB. Publikationerna finns även tillgängliga på ÅSUBs webbplats, där det också finns valstatistik i form av Excel- och PC-Axis-tabeller. Ansvarig för valstatistiken på ÅSUB är Kenth Häggblom, [email protected].
Elections The statistics in this chapter include elections for the Legislative Assembly of Åland and municipal elections. In addition, the statistics include data on the outcome of the votes of the Åland population in elections for the Parliament and the President of Finland as well as for the European Parliament. Moreover, there are statistics on referendums. More statistics on this subject area are available at the website of Statistics Åland, www.asub.ax, in Excel-tables and PC-Axis-databases in English. Contact person is Kenth Häggblom, [email protected]
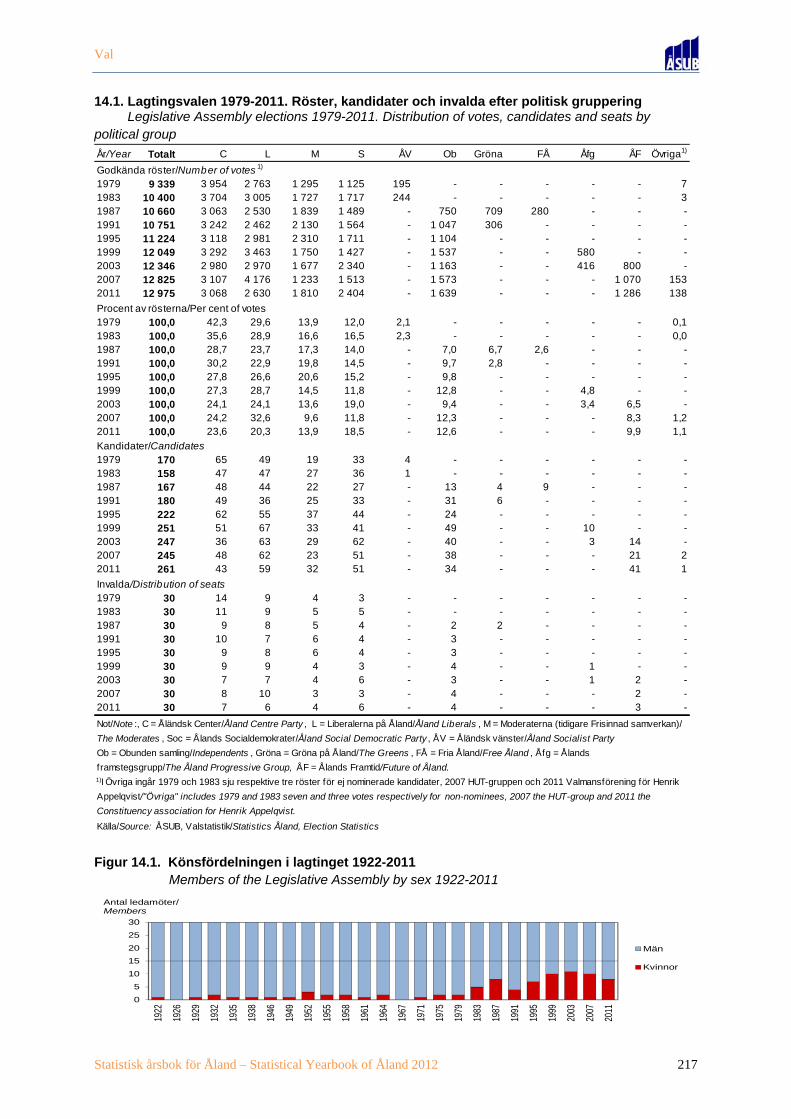
Val
Statistisk årsbok för Åland – Statistical Yearbook of Åland 2012 217
14.1. Lagtingsvalen 1979-2011. Röster, kandidater och invalda efter politisk gruppering 14.1. Legislative Assembly elections 1979-2011. Distribution of votes, candidates and seats by political group
Figur 14.1. Könsfördelningen i lagtinget 1922-2011 Figure 14.1. Members of the Legislative Assembly by sex 1922-2011
År/Year Totalt C L M S ÅV Ob Gröna FÅ Åfg ÅF Övriga1)
Godkända röster/Number of votes 1)
1979 9 339 3 954 2 763 1 295 1 125 195 - - - - - 71983 10 400 3 704 3 005 1 727 1 717 244 - - - - - 31987 10 660 3 063 2 530 1 839 1 489 - 750 709 280 - - -1991 10 751 3 242 2 462 2 130 1 564 - 1 047 306 - - - -1995 11 224 3 118 2 981 2 310 1 711 - 1 104 - - - - -1999 12 049 3 292 3 463 1 750 1 427 - 1 537 - - 580 - -2003 12 346 2 980 2 970 1 677 2 340 - 1 163 - - 416 800 -2007 12 825 3 107 4 176 1 233 1 513 - 1 573 - - - 1 070 1532011 12 975 3 068 2 630 1 810 2 404 - 1 639 - - - 1 286 138
Procent av rösterna/Per cent of votes1979 100,0 42,3 29,6 13,9 12,0 2,1 - - - - - 0,11983 100,0 35,6 28,9 16,6 16,5 2,3 - - - - - 0,01987 100,0 28,7 23,7 17,3 14,0 - 7,0 6,7 2,6 - - -1991 100,0 30,2 22,9 19,8 14,5 - 9,7 2,8 - - - -1995 100,0 27,8 26,6 20,6 15,2 - 9,8 - - - - -1999 100,0 27,3 28,7 14,5 11,8 - 12,8 - - 4,8 - -2003 100,0 24,1 24,1 13,6 19,0 - 9,4 - - 3,4 6,5 -2007 100,0 24,2 32,6 9,6 11,8 - 12,3 - - - 8,3 1,22011 100,0 23,6 20,3 13,9 18,5 - 12,6 - - - 9,9 1,1
Kandidater/Candidates1979 170 65 49 19 33 4 - - - - - -1983 158 47 47 27 36 1 - - - - - -1987 167 48 44 22 27 - 13 4 9 - - -1991 180 49 36 25 33 - 31 6 - - - -1995 222 62 55 37 44 - 24 - - - - -1999 251 51 67 33 41 - 49 - - 10 - -2003 247 36 63 29 62 - 40 - - 3 14 -2007 245 48 62 23 51 - 38 - - - 21 22011 261 43 59 32 51 - 34 - - - 41 1
Invalda/Distribution of seats1979 30 14 9 4 3 - - - - - - -1983 30 11 9 5 5 - - - - - - -1987 30 9 8 5 4 - 2 2 - - - -1991 30 10 7 6 4 - 3 - - - - -1995 30 9 8 6 4 - 3 - - - - -1999 30 9 9 4 3 - 4 - - 1 - -2003 30 7 7 4 6 - 3 - - 1 2 -2007 30 8 10 3 3 - 4 - - - 2 -2011 30 7 6 4 6 - 4 - - - 3 -
Not/Note :, C = Åländsk Center/Åland Centre Party , L = Liberalerna på Åland/Åland Liberals , M = Moderaterna (tidigare Frisinnad samverkan)/
The Moderates , Soc = Ålands Socialdemokrater/Åland Social Democratic Party , ÅV = Åländsk vänster/Åland Socialist Party
Ob = Obunden samling/Independents , Gröna = Gröna på Åland/The Greens , FÅ = Fria Åland/Free Åland , Åfg = Ålands
framstegsgrupp/The Åland Progressive Group, ÅF = Ålands Framtid/Future of Åland.1)I Övriga ingår 1979 och 1983 sju respektive tre röster för ej nominerade kandidater, 2007 HUT-gruppen och 2011 Valmansförening för Henrik
Appelqvist/"Övriga" includes 1979 and 1983 seven and three votes respectively for non-nominees, 2007 the HUT-group and 2011 the
Constituency association for Henrik Appelqvist.
Källa/Source: ÅSUB, Valstatistik/Statistics Åland, Election Statistics
0
5
10
15
20
25
30
1922
1926
1929
1932
1935
1938
1946
1949
1952
1955
1958
1961
1964
1967
1971
1975
1979
1983
1987
1991
1995
1999
2003
2007
2011
Antal ledamöter/Members
Män
Kvinnor

Val
218 Statistisk årsbok för Åland – Statistical Yearbook of Åland 2012
14.2. Lagtingsvalet 2011. Röster, kandidater och invalda efter kön och politisk gruppering 14.2. Legislative Assembly election 2011. Votes, candidates and seats by sex and political group
Figur 14.2. Kvinnornas och männens andel i lagtingsvalen 1995-2011 Figure 14.2. Share of men and women in Legislative Assembly elections 1995-2011
Totalt C L M Ob S ÅF Övriga
Antal röster/Votes 12 975 3 068 2 630 1 810 1 639 2 404 1 286 138Kvinnor 4 499 776 1 137 346 536 1 573 131 -Män 8 476 2 292 1 493 1 464 1 103 831 1 155 138
Könsfördelning, procentKvinnor 34,7 25,3 43,2 19,1 32,7 65,4 10,2 -Män 65,3 74,7 56,8 80,9 67,3 34,6 89,8 100,0
Antal kandidater/Cand. 261 43 59 32 34 51 41 1Kvinnor 98 11 19 14 15 29 10 -Män 163 32 40 18 19 22 31 1
Könsfördelning, procentKvinnor 37,5 25,6 32,2 43,8 44,1 56,9 24,4 -Män 62,5 74,4 67,8 56,3 55,9 43,1 75,6 100,0
Antal invalda/Seats 30 7 6 4 4 6 3 -Kvinnor 8 2 2 - 1 3 - -Män 22 5 4 4 3 3 3 -
Könsfördelning, procentKvinnor 26,7 28,6 33,3 - 25,0 50,0 - -Män 73,3 71,4 66,7 100,0 75,0 50,0 100,0 -
Not/Note: Politiska grupper, se not till tabell 14.1/Political groups, see note in table 14.1.
Källa/Source: ÅSUB, Valstatistik/Statistics Åland, Election Statistics
0 %
10 %
20 %
30 %
40 %
50 %
60 %
70 %
80 %
90 %
100 %
Rös
tand
e
Ka
ndid
ater
Rös
ter
Inva
lda
Rös
tand
e
Ka
ndid
ater
Rös
ter
Inva
lda
Rös
tand
e
Ka
ndid
ater
Rös
ter
Inva
lda
Rös
tand
e
Ka
ndid
ater
Rös
ter
Inva
lda
Rös
tand
e
Ka
ndid
ater
Rös
ter
Inva
lda
1995 1999 2003 2007 2011
Män
Kvinnor
Not/Note : Röstande = Number of voters , Kandidater = Candidates , Röster = Votes , Invalda = Elected.

Val
Statistisk årsbok för Åland – Statistical Yearbook of Åland 2012 219
14.3. Lagtingsvalet 2011. Röstberättigade och röstande efter kommun och kön 14.3. Legislative Assembly election 2011. Entitled to vote and number of voters by municipality and sex
14.4. Ogiltiga röster efter orsak vid lagtings- och kommunalvalet 2011 14.4. Rejected votes by cause, Legislative Assembly election and the municipal elections 2011
KommunFöre valdag/ På valdagen/
Totalt K M Totalt K M In advance Election day Totalt K M
Brändö 370 174 196 271 135 136 189 82 73,2 77,6 69,4Eckerö 669 313 356 492 241 251 171 321 73,5 77,0 70,5Finström 1 803 921 882 1 163 621 542 307 856 64,5 67,4 61,5Föglö 412 197 215 297 146 151 158 139 72,1 74,1 70,2Geta 356 170 186 249 123 126 33 216 69,9 72,4 67,7Hammarland 1 066 528 538 722 363 359 141 581 67,7 68,8 66,7Jomala 2 874 1 408 1 466 1 910 966 944 542 1 368 66,5 68,6 64,4Kumlinge 283 132 151 217 104 113 123 94 76,7 78,8 74,8Kökar 181 82 99 126 66 60 87 39 69,6 80,5 60,6Lemland 1 286 628 658 867 434 433 248 619 67,4 69,1 65,8Lumparland 301 143 158 228 114 114 66 162 75,7 79,7 72,2Saltvik 1 313 659 654 918 480 438 229 689 69,9 72,8 67,0Sottunga 93 46 47 68 36 32 31 37 73,1 78,3 68,1Sund 749 367 382 510 262 248 141 369 68,1 71,4 64,9Vårdö 323 149 174 243 118 125 112 131 75,2 79,2 71,8
Mariehamn 7 894 4 206 3 688 5 077 2 776 2 301 2 041 3 036 64,3 66,0 62,4
Landskomm. 12 079 5 917 6 162 8 281 4 209 4 072 2 578 5 703 68,6 71,1 66,1
-Landsbygden 10 417 5 137 5 280 7 059 3 604 3 455 1 878 5 181 67,8 70,2 65,4
-Skärgården 1 662 780 882 1 222 605 617 700 522 73,5 77,6 70,0
Åland 19 973 10 123 9 850 13 358 6 985 6 373 4 619 8 739 66,9 69,0 64,7
Källa/Source : ÅSUB, Valstatistik/Statistics Åland, Election Statistics
Valdeltagande, %/Participation, %
Röstberättigade/Entitled to vote
Röstande/Number of voters
Orsak/Cause
Antal/ % av alla röster/ Antal/ % av alla röster/Number % of all votes Number % of all votes
Totalt 385 2,9 822 5,8Blank röstsedel/Blank vote 264 2,0 377 2,6
Felaktigt nummer/Incorrect number 104 0,8 367 2,6
Otydligt nummer/Unclear number 2 0,0 9 0,1
Obehörig anteckning/Illegitimate note 4 0,0 58 0,4
Ostämplad röstsedel/Unmarked vote 6 0,0 4 0,0Annan orsak/Other 5 0,0 7 0,0
Källa/Source: ÅSUB, Valstatistik/Statistics Åland, Election Statistics
Legislative Assembly election
Kommunalvalet/Municipalelections
Lagtingsvalet/

Val
220 Statistisk årsbok för Åland – Statistical Yearbook of Åland 2012
Figur 14.3. Valdeltagandet i lagtingsvalet efter ålder och kön 2011 Figure 14.3. Participation in Legislative Assembly election by age and sex 2011
14.5. Valdeltagande i lagtings- och kommunalvalen efter ålder och kön 1999-2011, procent 14.5. Participation in Legislative Assembly and municipal elections by age and sex 1999-2011, per cent
0
20
40
60
80
100
18-21 22-25 26-29 30-39 40-49 50-59 60-69 70-79 80+
Procent
Ålder/Age
Kvinnor
Män
Val/Election
Ålder/Age 1999 2003 2007 2011 1999 2003 2007 2011 1999 2003 2007 2011
Lagtingsvalet/Legislative assembly
Totalt 66,0 67,6 67,8 66,9 67,3 69,1 69,8 69,0 64,6 66,0 65,8 64,7
18-21 44,7 48,8 45,2 44,1 48,4 48,6 46,1 45,4 41,5 49,0 44,4 42,9
22-25 43,5 41,9 40,4 37,7 48,3 42,5 40,8 38,6 39,0 41,4 40,1 36,9
26-29 49,5 52,3 49,7 51,7 54,0 56,5 51,9 54,9 45,7 48,5 47,9 48,8
30-39 64,6 68,0 64,8 63,2 69,6 73,2 70,4 68,5 59,7 63,0 59,6 58,5
40-49 73,6 74,6 74,3 73,5 75,2 77,6 79,1 78,0 72,0 71,6 69,4 69,0
50-59 76,3 76,2 77,2 75,4 76,9 78,3 80,0 77,7 75,8 74,2 74,2 72,9
60-69 77,6 77,7 79,4 78,2 79,8 78,6 80,4 79,7 75,3 76,9 78,4 76,8
70-79 71,6 73,0 75,6 74,2 69,0 72,3 74,4 74,0 75,1 73,8 77,1 74,3
80+ 46,8 47,8 52,1 54,6 40,9 44,0 47,2 50,6 59,5 55,8 61,6 61,4
Kommunalvalet/Municipal elections
Totalt 66,2 68,4 66,4 64,3 67,5 70,1 68,3 66,7 64,8 66,7 64,4 61,8
18-21 46,0 51,2 46,6 44,4 49,3 52,7 46,9 45,1 43,1 49,9 46,4 43,8
22-25 44,8 47,5 43,2 38,7 50,8 49,9 44,4 41,0 39,8 45,6 42,0 36,9
26-29 53,7 59,0 51,0 49,1 58,3 64,6 53,6 53,4 49,6 54,0 48,7 45,0
30-39 66,1 69,2 62,1 58,3 71,3 74,1 66,6 62,7 60,8 64,3 57,6 54,0
40-49 73,1 74,3 71,3 69,1 74,7 77,4 76,5 74,4 71,4 71,0 66,1 63,9
50-59 75,0 75,6 74,6 71,8 75,6 77,9 77,5 74,4 74,4 73,2 71,6 69,0
60-69 76,0 76,5 77,4 75,6 78,4 77,7 78,2 77,4 73,5 75,4 76,6 73,8
70-79 69,1 71,0 74,0 72,6 66,3 69,9 73,0 72,2 72,9 72,4 75,1 72,9
80+ 45,3 45,9 50,0 52,8 40,1 42,4 45,8 48,8 56,1 53,4 58,4 59,9
Källa/Source: ÅSUB, Valstatistik/Statistics Åland, Election Statistics
Totalt Kvinnor Män

Val
Statistisk årsbok för Åland – Statistical Yearbook of Åland 2012 221
14.6. Kommunalvalen 1995-2011. Röster, kandidater och invalda efter politisk gruppering 14.6. Municipal elections 1995-2011. Distribution of votes, candidates and seats by political group
Figur 14.4. Könsfördelningen i kommunernas fullmäktige efter region 1999-2011 Figure 14.4. Sex distribution in municipal assemblies by region 1999-2011
År/Year Totalt Utan
C L M Ob S Åfg ÅF Övriga grupp
Antal röster/Number of votes
1995 11 397 2 561 2 677 2 215 904 1 491 - - 337 1 212
1999 12 214 2 866 3 034 1 963 1 298 1 332 370 - 147 1 204
2003 12 554 2 692 2 871 1 732 1 090 1 967 261 229 561 1 151
2007 13 328 2 527 3 535 1 951 1 272 1 703 - 349 453 1 538
2011 13 465 2 659 2 531 1 756 1 638 2 245 - 577 865 1 194
Procentuell fördelning/Distribution in per cent
1995 100,0 22,5 23,5 19,4 7,9 13,1 - - 3,0 10,6
1999 100,0 23,5 24,8 16,1 10,6 10,9 3,0 - 1,2 9,9
2003 100,0 21,4 22,9 13,8 8,7 15,7 2,1 1,8 4,5 9,2
2007 100,0 19,0 26,5 14,6 9,5 12,8 - 2,6 3,4 11,5
2011 100,0 19,7 18,8 13,0 12,2 16,7 - 4,3 6,4 8,9
Kandidater/Candidates
1995 662 165 138 78 81 55 - - 24 121
1999 629 166 140 70 73 56 8 - 8 108
2003 588 122 133 43 84 74 4 7 24 97
2007 603 100 119 47 73 93 - 11 27 133
2011 553 83 121 37 70 73 - 25 53 91
Invalda/Distribution of seats
1995 210 52 43 20 17 13 - - 9 56
1999 210 58 45 14 22 10 2 - 3 56
2003 210 49 42 11 17 18 1 1 15 56
2007 210 39 41 14 18 14 - 2 13 692011 208 39 34 12 24 17 - 3 23 56
Not/Note: Politiska grupper, se not till tabell 14.1/Political groups, see note in table 14.1.
Övriga = Others, Utan grupp = Candidates and representatives who do not belong to any political group.
Källa/Source: ÅSUB, Valstatistik/Statistics Åland, Election Statistics
Politisk gruppering/Political group
0
25
50
75
100
Mar
ieha
mn
Land
sbyg
den
Skä
rgår
den
Mar
ieha
mn
Land
sbyg
den
Skä
rgår
den
Mar
ieha
mn
Land
sbyg
den
Skä
rgår
den
Mar
ieha
mn
Land
sbyg
den
Skä
rgår
den
1999 2003 2007 2011
Procent
Män
Kvinnor

Val
222 Statistisk årsbok för Åland – Statistical Yearbook of Åland 2012
14.7. Kommunalvalet 2011. Röstberättigade och röstande efter kommun och kön 14.7. Municipal elections 2011. Entitled to vote and number of voters by municipality and sex
Figur 14.5. Valdeltagande i kommunalvalen efter innehav av hembygdsrätt 1999-2011 Figure 14.5. Participation in municipal elections 1999-2011. Holders and non-holders of regional citizenship
Kommun
Före valdag./ På valdagen/
Totalt K M Totalt K M In advance Election day Totalt K M
Brändö 403 190 213 286 144 142 193 93 71,0 75,8 66,7
Eckerö 763 365 398 546 272 274 182 364 71,6 74,5 68,8
Finström 1 926 988 938 1 204 639 565 308 896 62,5 64,7 60,2
Föglö 470 225 245 334 166 168 177 157 71,1 73,8 68,6
Geta 384 185 199 262 131 131 34 228 68,2 70,8 65,8
Hammarland 1 182 580 602 761 385 376 150 611 64,4 66,4 62,5
Jomala 3 128 1 528 1 600 2 006 1 023 983 555 1 451 64,1 67,0 61,4
Kumlinge 305 143 162 229 114 115 128 101 75,1 79,7 71,0
Kökar 205 92 113 143 74 69 95 48 69,8 80,4 61,1
Lemland 1 367 661 706 905 451 454 251 654 66,2 68,2 64,3
Lumparland 315 154 161 233 115 118 65 168 74,0 74,7 73,3
Saltvik 1 419 707 712 958 505 453 237 721 67,5 71,4 63,6
Sottunga 96 48 48 75 41 34 36 39 78,1 85,4 70,8
Sund 797 392 405 530 272 258 146 384 66,5 69,4 63,7
Vårdö 362 171 191 261 127 134 119 142 72,1 74,3 70,2
Mariehamn 9 092 4 815 4 277 5 550 3 044 2 506 2 136 3 414 61,0 63,2 58,6
Landskomm. 13 122 6 429 6 693 8 733 4 459 4 274 2 676 6 057 66,6 69,4 63,9
-Landsbygden 11 281 5 560 5 721 7 405 3 793 3 612 1 928 5 477 65,6 68,2 63,1
-Skärgården 1 841 869 972 1 328 666 662 748 580 72,1 76,6 68,1
Åland 22 214 11 244 10 970 14 283 7 503 6 780 4 812 9 471 64,3 66,7 61,8
Källa/Source: ÅSUB, Valstatistik/Statistics Åland, Election Statistics
Röstberättigade/ Röstande/Number of voters Valdeltagande, %/
Entitled to vote Participation, %
0 5 000 10 000 15 000 20 000
Utan hembygdsrätt
Hembygdsrätt
Utan hembygdsrätt
Hembygdsrätt
Utan hembygdsrätt
Hembygdsrätt
Utan hembygdsrätt
Hembygdsrätt
1999
2003
2007
2011
Personer/PersonsRöstade/Voters Röstade ej/Non-voters
Hembygdsrätt = Holders of regional citizenship
Utan hembygdsrätt = Non-holders of regional citizenship

Val
Statistisk årsbok för Åland – Statistical Yearbook of Åland 2012 223
14.8. Kommunalvalet 2011. Godkända röster efter politisk gruppering, kön och kommun 14.8. Municipal elections 2011. Valid votes by political group, sex and municipality
Kommun Totalt
Utan
C L M Ob S ÅF Övriga grupp K M
AntalBrändö 281 - - - - - - - 281 119 162Eckerö 521 - - - 202 38 - 281 - 165 356Finström 1 137 530 316 121 44 126 - - - 410 727Föglö 328 - 180 - - - - 148 - 142 186Geta 256 - 70 - - - - 186 - 112 144Hammarland 707 388 202 - 43 74 - - - 276 431Jomala 1 899 455 254 271 364 378 177 - - 551 1 348Kumlinge 219 - - - - - - - 219 116 103Kökar 136 - - - - - - - 136 54 82Lemland 857 159 260 79 319 40 - - - 478 379Lumparland 230 - - - - - - - 230 85 145Saltvik 918 444 - - 157 47 20 250 - 317 601Sottunga 73 - - - - - - - 73 27 46Sund 502 148 150 - 70 134 - - - 174 328Vårdö 255 - - - - - - - 255 88 167
Mariehamn 5 146 535 1 099 1 285 439 1 408 380 - - 1 828 3 318Landskomm. 8 319 2 124 1 432 471 1 199 837 197 865 1 194 3 114 5 205-Landsbygden 7 027 2 124 1 252 471 1 199 837 197 717 230 2 568 4 459-Skärgården 1 292 - 180 - - - - 148 964 546 746
Åland 13 465 2 659 2 531 1 756 1 638 2 245 577 865 1 194 4 942 8 523Kvinnor 4 942 673 1 135 235 529 1 289 170 422 489Män 8 523 1 986 1 396 1 521 1 109 956 407 443 705
ProcentBrändö 100,0 - - - - - - - 100,0 42,3 57,7Eckerö 100,0 - - - 38,8 7,3 - 53,9 - 31,7 68,3Finström 100,0 46,6 27,8 10,6 3,9 11,1 - - - 36,1 63,9Föglö 100,0 - 54,9 - - - - 45,1 - 43,3 56,7Geta 100,0 - 27,3 - - - - 72,7 - 43,8 56,3Hammarland 100,0 54,9 28,6 - 6,1 10,5 - - - 39,0 61,0Jomala 100,0 24,0 13,4 14,3 19,2 19,9 9,3 - - 29,0 71,0Kumlinge 100,0 - - - - - - - 100,0 53,0 47,0Kökar 100,0 - - - - - - - 100,0 39,7 60,3Lemland 100,0 18,6 30,3 9,2 37,2 4,7 - - - 55,8 44,2Lumparland 100,0 - - - - - - - 100,0 37,0 63,0Saltvik 100,0 48,4 - - 17,1 5,1 2,2 27,2 - 34,5 65,5Sottunga 100,0 - - - - - - - 100,0 37,0 63,0Sund 100,0 29,5 29,9 - 13,9 26,7 - - - 34,7 65,3Vårdö 100,0 - - - - - - - 100,0 34,5 65,5
Mariehamn 100,0 10,4 21,4 25,0 8,5 27,4 7,4 - - 35,5 64,5
Landskomm. 100,0 25,5 17,2 5,7 14,4 10,1 2,4 10,4 14,4 37,4 62,6-Landsbygden 100,0 30,2 17,8 6,7 17,1 11,9 2,8 10,2 3,3 36,5 63,5
-Skärgården 100,0 - 13,9 - - - - 11,5 74,6 42,3 57,7
Åland 100,0 19,7 18,8 13,0 12,2 16,7 4,3 6,4 8,9 36,7 63,3
Procentuell fördelning efter kön/By sex, per cent
Kvinnor 36,7 25,3 44,8 13,4 32,3 57,4 29,5 48,8 41,0
Män 63,3 74,7 55,2 86,6 67,7 42,6 70,5 51,2 59,0
Not/Note: Politiska grupper, se not till tabell 14.1/Political groups, see note in table 14.1.
Övriga = Others, Utan grupp = Candidates and representatives who do not belong to any political group.
Källa/Source : ÅSUB, Valstatistik/Statistics Åland, Election Statistics
Politisk gruppering/Political group Cand. sexKand. kön/

Val
224 Statistisk årsbok för Åland – Statistical Yearbook of Åland 2012
14.9. Kommunalvalet 2011. Kandidater efter politisk gruppering, kön och kommun 14.9. Municipal elections 2011. Candidates by political group, sex and municipality
14.10. Kommunalvalet 2011. Mandatfördelningen i kommunernas fullmäktige efter politisk gruppering och kön 14.10. Municipal elections 2011. Distribution of seats in the municipality councils by political group and sex
Kommun TotaltUtan
C L M Ob S ÅF Övriga grupp K M K MBrändö 22 - - - - - - - 22 10 12 45,5 54,5Eckerö 26 - - - 9 4 - 13 - 8 18 30,8 69,2Finström 31 13 10 2 1 5 - - - 11 20 35,5 64,5Föglö 32 - 18 - - - - 14 - 17 15 53,1 46,9Geta 22 - 9 - - - - 13 - 11 11 50,0 50,0Hammarland 47 16 22 - 2 7 - - - 21 26 44,7 55,3Jomala 63 12 11 5 11 16 8 - - 22 41 34,9 65,1Kumlinge 15 - - - - - - - 15 7 8 46,7 53,3Kökar 12 - - - - - - - 12 5 7 41,7 58,3Lemland 40 8 13 4 13 2 - - - 21 19 52,5 47,5Lumparland 15 - - - - - - - 15 8 7 53,3 46,7Saltvik 48 16 - - 15 2 2 13 - 22 26 45,8 54,2Sottunga 12 - - - - - - - 12 3 9 25,0 75,0Sund 26 6 10 - 3 7 - - - 12 14 46,2 53,8Vårdö 15 - - - - - - - 15 7 8 46,7 53,3
Mariehamn 127 12 28 26 16 30 15 - - 49 78 38,6 61,4
Landskomm. 426 71 93 11 54 43 10 53 91 185 241 43,4 56,6-Landsbygden 318 71 75 11 54 43 10 39 15 136 182 42,8 57,2-Skärgården 108 - 18 - - - - 14 76 49 59 45,4 54,6
Åland 553 83 121 37 70 73 25 53 91 234 319 42,3 57,7- Kvinnor, % 42,3 33,7 45,5 37,8 37,1 47,9 36,0 50,9 44,0- Män, % 57,7 66,3 54,5 62,2 62,9 52,1 64,0 49,1 56,0
Not/Note: Politiska grupper, se not till tabell 14.1/Political groups, see note in table 14.1.
Övriga = Others, Utan grupp = Candidates and representatives who do not belong to any political group.
Källa/Source: ÅSUB, Valstatistik/Statistics Åland, Election Statistics
Gruppering/Political group ProcentKön/Sex
Kommun TotaltUtan
C L M Ob S ÅF Övriga grupp K M K MBrändö 11 - - - - - - - 11 5 6 45,5 54,5Eckerö 13 - - - 5 1 - 7 - 5 8 38,5 61,5Finström 17 8 5 1 1 2 - - - 5 12 29,4 70,6Föglö 11 - 6 - - - - 5 - 5 6 45,5 54,5Geta 9 - 2 - - - - 7 - 4 5 44,4 55,6Hammarland 15 9 4 - 1 1 - - - 5 10 33,3 66,7Jomala 17 4 2 3 4 3 1 - - 3 14 17,6 82,4Kumlinge 9 - - - - - - - 9 5 4 55,6 44,4Kökar 9 - - - - - - - 9 4 5 44,4 55,6Lemland 15 3 5 1 6 - - - - 7 8 46,7 53,3Lumparland 9 - - - - - - - 9 3 6 33,3 66,7Saltvik 15 8 - - 3 - - 4 - 5 10 33,3 66,7Sottunga 9 - - - - - - - 9 2 7 22,2 77,8Sund 13 4 4 - 2 3 - - - 4 9 30,8 69,2Vårdö 9 - - - - - - - 9 4 5 44,4 55,6
Mariehamn 27 3 6 7 2 7 2 - - 7 20 25,9 74,1
Landskomm. 181 36 28 5 22 10 1 23 56 66 115 36,5 63,5-Landsbygden 123 36 22 5 22 10 1 18 9 41 82 33,3 66,7-Skärgården 58 - 6 - - - - 5 47 25 33 43,1 56,9
Åland 208 39 34 12 24 17 3 23 56 73 135 35,1 64,9- Kvinnor, % 35,1 23,1 44,1 8,3 37,5 35,3 - 43,5 41,1- Män, % 64,9 76,9 55,9 91,7 62,5 64,7 100,0 56,5 58,9
Not/Note: Politiska grupper, se not till tabell 14.1/Political groups, see note table 14.1.
Övriga = Others, Utan grupp = Candidates and representatives who do not belong to any political group.
Källa/Source : ÅSUB, Valstatistik/Statistics Åland, Election Statistics
Gruppering/Political group ProcentKön/Sex

Val
Statistisk årsbok för Åland – Statistical Yearbook of Åland 2012 225
14.11. Presidentvalet 2012. Godkända röster samt valdeltagande efter kön 14.11. Finnish Presidential election 2012. Valid votes and participation by sex
Figur 14.6. Presidentvalen 1994-2012. Rösternas fördelning i andra omgången Figure 14.6. Presidential elections 1994-2012. Distribution of votes in the 2nd round
Omgång/Round Antal Procent Valdeltagande/Participation 1: a omg./ 2:a omg./Kandidat/Candidate Ogiltiga röster/Rejected votes 1st round 2nd round
Godkända röster i 1:a omgången/ Valdeltagande/ParticipationValid votes, 1st round 11 957 100,0 Röstberättigade/
Eva Biaudet 4 527 37,9 Entitled to vote 20 511 20 511
Paavo Lipponen 2 953 24,7 Kvinnor 10 468 10 468
Sauli Niinistö 2 597 21,7 Män 10 043 10 043
Pekka Haavisto 934 7,8
Paavo Väyrynen 578 4,8 Röstande/
Paavo Arhinmäki 179 1,5 Number of voters 11 570 11 454
Timo Soini 101 0,8 Kvinnor 6 305 6 321
Sari Essayah 88 0,7 Män 5 265 5 133
Före valdagen/In advance 3 815 4 585
Godkända röster i 2:a omgången På valdagen/Election day 7 755 6 869
Valid votes, 2nd round 11 803 100,0
Pekka Haavisto 7 076 60,0 Valdeltagande/Participation, % 56,4 55,8
Sauli Niinistö 4 727 40,0 Kvinnor 60,2 60,4
Män 52,4 51,1
Ogiltiga röster/Rejected votes 59 122
% av avgivna/ % of all votes 0,5 1,0
Därav blanka/Blank votes 24 54
% av avgivna/ % of all votes 0,2 0,5
Not/Note: I valdeltagandet ingår endast personer bosatta på Åland, medan de godkända och ogiltiga rösterna också innefattar röster avgivnai utlandet. Det totala valresultatet i Finland innebar att Sauli Niinistö valdes till president/Participation only includes people living on Åland,whereas valid and rejected votes also include votes cast abroad. The final result of the election in Finland was that Sauli Niinistö waselected for President.
Källa/Source: ÅSUB, Valstatistik/Statistics Åland, Election Statistics
0 2 000 4 000 6 000 8 000 10 000 12 000
Elisabeth Rehn
Martti Ahtisaari
Esko Aho
Tarja Halonen
Sauli Niinistö
Tarja Halonen
Pekka Haavisto
Sauli Niinistö
1994
2000
2006
2012
Röster/Votes
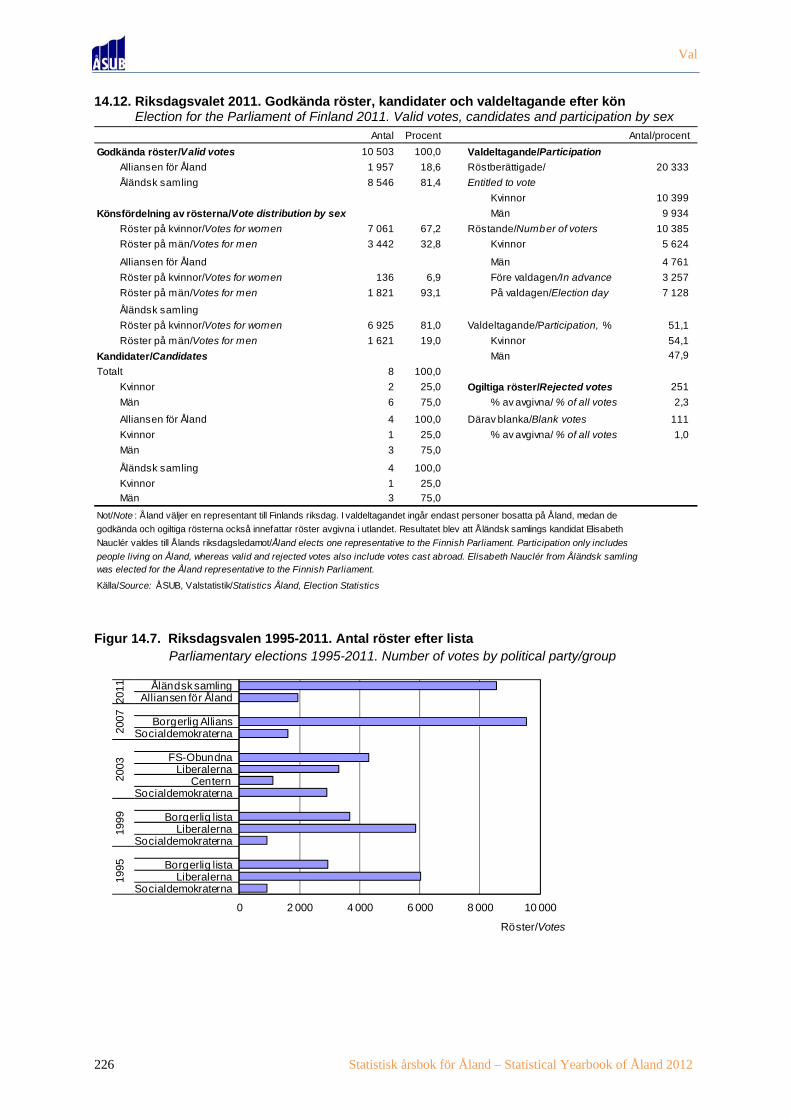
Val
226 Statistisk årsbok för Åland – Statistical Yearbook of Åland 2012
14.12. Riksdagsvalet 2011. Godkända röster, kandidater och valdeltagande efter kön 14.12. Election for the Parliament of Finland 2011. Valid votes, candidates and participation by sex
Figur 14.7. Riksdagsvalen 1995-2011. Antal röster efter lista Figure 14.7. Parliamentary elections 1995-2011. Number of votes by political party/group
Antal Procent Antal/procent
Godkända röster/Valid votes 10 503 100,0 Valdeltagande/Participation
Alliansen för Åland 1 957 18,6 Röstberättigade/ 20 333
Åländsk samling 8 546 81,4 Entitled to vote
Kvinnor 10 399
Könsfördelning av rösterna/Vote distribution by sex Män 9 934
Röster på kvinnor/Votes for women 7 061 67,2 Röstande/Number of voters 10 385
Röster på män/Votes for men 3 442 32,8 Kvinnor 5 624
Alliansen för Åland Män 4 761
Röster på kvinnor/Votes for women 136 6,9 Före valdagen/In advance 3 257
Röster på män/Votes for men 1 821 93,1 På valdagen/Election day 7 128
Åländsk samling
Röster på kvinnor/Votes for women 6 925 81,0 Valdeltagande/Participation, % 51,1
Röster på män/Votes for men 1 621 19,0 Kvinnor 54,1
Kandidater/Candidates Män 47,9
Totalt 8 100,0
Kvinnor 2 25,0 Ogiltiga röster/Rejected votes 251
Män 6 75,0 % av avgivna/ % of all votes 2,3
Alliansen för Åland 4 100,0 Därav blanka/Blank votes 111
Kvinnor 1 25,0 % av avgivna/ % of all votes 1,0
Män 3 75,0
Åländsk samling 4 100,0
Kvinnor 1 25,0
Män 3 75,0
Not/Note : Åland väljer en representant till Finlands riksdag. I valdeltagandet ingår endast personer bosatta på Åland, medan de
godkända och ogiltiga rösterna också innefattar röster avgivna i utlandet. Resultatet blev att Åländsk samlings kandidat Elisabeth
Nauclér valdes till Ålands riksdagsledamot/Åland elects one representative to the Finnish Parliament. Participation only includes
people living on Åland, whereas valid and rejected votes also include votes cast abroad. Elisabeth Nauclér from Åländsk samlingwas elected for the Åland representative to the Finnish Parliament.
Källa/Source: ÅSUB, Valstatistik/Statistics Åland, Election Statistics
0 2 000 4 000 6 000 8 000 10 000
SocialdemokraternaLiberalerna
Borgerlig lista
SocialdemokraternaLiberalerna
Borgerlig lista
SocialdemokraternaCentern
LiberalernaFS-Obundna
SocialdemokraternaBorgerlig Allians
Alliansen för ÅlandÅländsk samling
1995
1999
2003
2007
2011
Röster/Votes

Val
Statistisk årsbok för Åland – Statistical Yearbook of Åland 2012 227
14.13. Valet till EU-parlamentet 2009. Godkända röster samt valdeltagande efter kön 14.13. European Parliament election 2009. Valid votes and participation by sex
14.14. EU-folkomröstningarna 1994 efter region och kön 14.14. EU referendums 1994 by region and sex of voters
Antal Procent Antal/procent
Godkända röster/Valid votes 9 755 100,0 Valdeltagande/Participation
SFP/Swedish Party 8 564 87,8 Röstberättigade/
Socialdemokr./Social Democrats 573 5,9 Entitled to vote 20 205
Samlingspartiet/National Coalition 90 0,9 Kvinnor 10 322
Gröna förbundet/Green Leag 175 1,8 Män 9 883
Centern/Centre Party 102 1,0 Röstande/Number of voters 9 734
Vänsterförbundet/Left Alliance 46 0,5 Kvinnor 5 318
Självständ.part./Independence Party 93 1,0 Män 4 416
Övriga/Other 112 1,1 Före valdagen/In advance 3 462
På valdagen/Election day 6 272
Ogiltiga röster/Rejected votes 210 2,1 1) Valdeltagande/Participation, % 48,2
Därav blanka/Thereof empty 92 0,9 1) Kvinnor 51,5Män 44,7
Not/Note : I valdeltagandet ingår endast personer bosatta på Åland, medan de godkända och ogiltiga rösterna också innefattar
röster avgivna i utlandet/Participitation only includes people living on Åland, whereas valid and rejected votes also includevotes cast abroad.
1) Procent av avgivna röster/Per cent of all votes.
Källa/Source : ÅSUB, Valstatistik/Statistics Åland, Election Statistics
Region Röstber./ Röstande/VotersEntitled Procent Totalt
Antal Totalt K M Antal % Antal %
Finlands omröstning/referendumMariehamn 7 931 60,7 61,3 60,0 4 755 3 034 63,8 1 721 36,2Landsbygden 8 957 61,6 61,0 62,2 5 439 2 401 44,1 3 038 55,9Skärgården 1 864 61,6 61,0 62,1 1 135 450 39,6 685 60,4
Åland 18 752 61,2 61,1 61,3 11 329 5 885 51,9 5 444 48,1
Ålands omröstning/referendumMariehamn 7 472 49,7 50,0 49,4 3 674 2 935 79,9 739 20,1Landsbygden 8 832 49,5 49,7 49,3 4 314 2 957 68,5 1 357 31,5Skärgården 1 786 44,5 43,8 45,1 779 564 72,4 215 27,6
Åland 18 090 49,1 49,3 48,9 8 767 6 456 73,6 2 311 26,4
Källa/Source : ÅSUB, Valstatistik/Statistics Åland, Election Statistics
Godkända röster/Valid votesJa/Yes Nej/No

Val
228 Statistisk årsbok för Åland – Statistical Yearbook of Åland 2012
14.15. Valdeltagandet vid allmänna val 1991-2012, procent 14.15. Participation rate in public elections 1991-2012, per cent
14.16. Andel av rösterna som avgivits före valdagen vid allmänna val 1991-2011, procent 14.16. Share of votes cast in advance at public elections 1991-2011, per cent
År/Year
Lagting/ Kommun/ Riksdag/ EU-parlament/Leg. assembly Municipal Parliament European
(Finnish) 1:a omg/ 2:a omg/ Parliament1st round 2nd round
1991 62,4 62,6 50,81994 70,3 74,31995 62,5 62,2 52,11996 44,41999 66,0 66,2 54,8 21,82000 59,1 61,62003 67,6 68,4 60,32004 35,62006 57,7 61,92007 67,8 66,4 57,02009 48,22011 66,9 64,3 51,12012 56,4 55,8
Källa/Source : ÅSUB, Valstatistik/Statistics Åland, Election Statistics
President/Presidential
Val/Elections
År/Year
Lagting/ Kommun/ Riksdag/ President/ EU-parlament/
Leg. assembly Municipal Parliament Presidential European(Finnish) 1:a omg/ 2:a omg/ Parliament
1st round 2nd round
1991 16,6 16,1 21,41994 24,3 30,71995 23,4 23,2 29,81996 24,91999 27,7 27,1 26,6 36,22000 32,3 37,42003 27,2 26,8 25,92004 30,82006 33,7 36,72007 32,3 31,6 35,32009 35,62011 34,6 33,7 31,42012 33,0 40,0
Källa/Source : ÅSUB, Valstatistik/Statistics Åland, Election Statistics
Val/Elections

15
15. Nordisk och internationell jämförande statistik
15. Nordic and international comparative statistics
0
2
4
6
8
10
12
14
16
18
DK FO GL FI AX IS NO SE
Procent
Sysselsatta inom industrin i de nordiska länderna 1.1.2010Employed persons within industry in the Nordic countries 1.1.2010

Nordisk och internationell jämförande statistik Detta kapitel innehåller uppgifter om de nordiska länderna och autonomierna samt en tabell som omfattar alla världens länder. I tabellerna och diagrammen används följande landskoder för de nordiska länderna: DK = Danmark FO = Färöarna GL = Grönland FI = Finland (exkl. Åland) AX = Åland IS = Island NO = Norge SE = Sverige Källorna anges under varje tabell och är för uppgifterna om de nordiska länderna Nordisk statistisk årsbok med tillhörande databas. Tillförlitligheten är hög i och med att uppgifterna som har sammanställts av Danmarks statistik har tagits fram av de nationella nordiska statistikbyråerna som ytterligare har granskat det färdiga materialet. Det finns olika problem med att göra statistiska jämförelser mellan länder, men i den nordiska statistiken läggs speciell vikt vid att de uppgifter som tas med skall vara så jämförbara som möjligt. Utförlig statistik om de nordiska länderna publiceras i Nordisk statistisk årsbok och finns också tillgänglig i en databas: www.dst.dk/pxwebnordic/Dialog/statfile1.asp. Från ÅSUBs hemsida www.asub.ax hittar man enkelt till internationell statistik via länkar till såväl statistiska organisationer som till nationella statistikbyråer över hela världen. Ansvarig för det nordiska statistiksamarbetet på ÅSUB är Iris Åkerberg, [email protected]
Nordic and international comparative statistics This chapter includes data on the Nordic countries and autonomies as well as a table on all the countries of the world. Country codes: DK = Denmark FO = Faroe Islands GL = Greenland FI = Finland (excl. Åland) AX = Åland IS = Iceland NO = Norway SE = Sweden More detailed statistics on the Nordic countries are published in the Nordic Statistical Yearbook and are also available in the following database: www.dst.dk/pxwebnordic/Dialog/statfile1.asp. At the website of Statistics Åland, www.asub.ax , international statistics are easily accessible through links to statistical organisations and national statistical institutes from all over the world. Contact person is Iris Åkerberg, [email protected]

Nordisk och internationell jämförande statistik
Statistisk årsbok för Åland – Statistical Yearbook of Åland 2012 231
15.1. Markanvändning 2010, 1 000 ha 15.1. Land use 2010, 1 000 ha
15.2. Befolkning efter kön 1.1.1990-2012, 1 000 personer 15.2. Population by sex and age 1.1.1990-2012, 1 000 inhabitants
Figur 15.1. Befolkning efter ålder 1.1.2011 Figure 15.1. Inhabitants by age 1.1.2011
Markanvändn./Land use DK1) FO GL FI AX IS NO SETotalt 4 356 140 216 609 33 682 161 10 344 32 763 45 030Åker och trädgård/Arable land 2 533 .. .. 2 273 14 129 831 2 633Bete och äng/Permanent meadows 357 .. 1 13 6 .. 176 452Skogsmark/Forests 529 .. 0 .. 94 121 12 384 ..Övrig landareal/Other land area 870 139 41 044 .. 45 .. 17 227 ..Sjöar, glaciärer/Lakes, glaciers 67 1 175 564 3 449 3 1 336 2 145 4 0241)Uppgifterna gäller för 2006/Figures from 2006
Källa/Source : Nordisk statistisk årsbok, ÅSUB/Nordic Statistical Yearbook, Statistics Åland
Kön/SexÅlder/Age DK FO GL FI AX IS NO SETotalt 1990 5 135 48 56 4 950 24 253 4 233 8 527
2000 5 330 45 56 5 146 26 279 4 478 8 8612010 5 535 49 56 5 324 28 318 4 858 9 3412012 5 581 48 57 5 373 28 320 4 986 9 483
Kvinnor 1990 2 605 23 26 2 549 12 126 2 140 4 3152000 2 696 22 26 2 635 13 139 2 261 4 4812010 2 791 23 27 2 712 14 158 2 431 4 692
2012 2 814 23 27 2 735 14 159 2 487 4 756
Män 1990 2 531 25 30 2 401 12 127 2 093 4 2122000 2 634 23 30 2 510 13 140 2 217 4 3802010 2 743 25 30 2 611 14 160 2 427 4 649
2012 2 767 25 30 2 638 14 160 2 499 4 727
Källa/Source : Nordisk statistisk årsbok, ÅSUB/Nordic Statistical Yearbook, Statistics Åland
0 %
10 %
20 %
30 %
40 %
50 %
60 %
70 %
80 %
90 %
100 %
DK FO GL FI AX IS NO SE
65+ år/year
15-64 år/year
0-14 år/year

Nordisk och internationell jämförande statistik
232 Statistisk årsbok för Åland – Statistical Yearbook of Åland 2012
15.3. Förväntad medellivslängd vid födseln efter kön 2000-2011 15.3. Life expectancy at birth by sex 2000-2011
15.4. Folktäthet efter km2 landareal 1.1.1990-2011 15.4. Population density 1.1.1990-2011
15.5. Befolkningsrörelsen 2010-2011 per 1 000 personer av medelfolkmängden 15.5. Population changes 2010-2011 per 1 000 of the mean population
Kön/Sex År/Year DK FO 1)3) GL 1) FI AX4) IS 2) NO SE
Kvinnor 2000 79,0 81,6 68,0 81,0 81,5 81,4 81,4 82,0
2005 80,2 82,2 70,9 82,3 83,6 83,1 82,5 82,8
2010 81,2 84,4 72,9 83,2 83,8 83,5 83,2 83,5
2011 81,6 84,9 73,0 83,5 .. 83,6 83,5 83,7
Män 2000 74,3 76,2 62,8 74,1 78,5 77,6 76,0 77,4
2005 75,6 77,2 65,5 75,5 77,6 79,2 77,7 78,4
2010 77,1 78,7 67,9 76,7 80,1 79,5 78,9 79,52011 77,3 79,1 68,3 77,2 .. 79,9 79,0 79,8
1)Åren avser en period som innefattar de fyra föregående åren/The years refer to a period of four years prior to the in-
dicated year. 2)Siffrorna avser respektive år och det föregående året/The figures refer to respective year and the pre-
ceeding year. 3)Reviderade siffror för 2000-2010/Revised figures for 2000-2010. 4)Uppgifterna från 2005 gäller femårs-
perioder/Figures from 2005 is shown for five-year periods.
Källa/Source : Nordisk statistisk årsbok, ÅSUB/Nordic Statistical Yearbook, Statistics Åland
År/Year DK FO GL FI AX IS NO SE1990 119,2 33,9 0,2 16,3 15,9 2,5 13,8 20,91995 121,0 31,4 0,2 16,7 16,5 2,5 14,2 21,52000 123,7 32,4 0,2 17,0 16,8 2,7 14,6 21,62005 125,6 34,6 0,1 17,2 17,4 2,9 15,1 22,02006 125,9 34,5 0,1 17,3 17,5 2,9 15,2 22,02007 126,4 34,6 0,1 17,4 17,6 3,0 15,4 22,22008 127,6 34,6 0,1 17,4 17,8 3,1 15,6 22,42009 127,9 34,9 0,1 17,5 17,7 3,1 15,7 22,62010 128,4 34,8 0,1 17,6 17,9 3,1 15,9 22,82011 129,4 34,8 0,1 17,7 18,0 3,1 16,1 22,9
Källa/Source : Nordisk statistisk årsbok, ÅSUB/Nordic Statistical Yearbook, Statistics Åland
År/Year DK FO GL FI AX IS NO SE
Födda/ 2010 11,4 13,1 15,4 11,4 10,3 15,4 12,6 12,3
Births 2011 10,6 .. .. 11,1 10,1 14,1 12,2 11,8
Döda/ 2010 9,8 7,2 8,9 9,5 8,4 6,3 8,5 9,6
Deaths 2011 9,4 .. .. 9,4 9,8 6,2 8,4 9,5
Föd.netto/ 2010 1,6 5,9 6,4 1,9 1,9 9,1 4,1 2,7
Excess of b irths 2011 1,2 .. .. 1,7 0,3 7,9 3,8 2,3
Nettoflyttn./ 2010 4,0 -5,8 -2,8 2,5 7,9 -6,7 8,7 5,3
Net immigr. 2011 4,1 .. .. 3,1 11,8 -4,4 9,5 4,8
Folkökning/ 2010 5,7 0,1 3,6 4,4 9,8 2,4 12,7 8,0Increase in pop. 2011 5,2 .. .. 4,8 12,1 3,5 13,2 7,1
Källa/Source : Nordisk statistisk årsbok, ÅSUB/Nordic Statistical Yearbook, Statistics Åland

Nordisk och internationell jämförande statistik
Statistisk årsbok för Åland – Statistical Yearbook of Åland 2012 233
Figur 15.2. Befolkningsprognos 2010-2050, Index 2010 = 100 Figure 15.2. Population projections 2010-2050, Index 2010 = 100
15.6. Användning av åkermarken 2010, 1 000 ha 15.6. Use of arable land 2010, 1 000 hectares
Figur 15.3. Ekologisk odling 2009, andel av åkermarken, % Figure 15.3. Use of arable land, organic farming 2009, per cent
0
20
40
60
80
100
120
140
160
DK GL FI AX IS NO SE
2010
2020
2030
2040
2050
Gröda/Crop DK FO GL FI AX IS NO SE
Totalt 2 418 .. 1 2 239 14 143 831 2 633Vete/Wheat 758 .. .. 212 2 - 72 400
Råg/Rye 51 .. .. 25 0 - 7 24
Korn/Barley 568 .. .. 447 1 4 147 319
Havre/Oats 42 .. .. 294 2 - 76 164
Blandsäd/Mixed grain 41 .. .. 26 0 - .. 55
Potatis/Potatoes 38 .. .. 24 1 2 13 27
Sockerbetor/Sugar beet 39 .. .. 15 0 - .. 38
Foderbetor/Fodder beets 4 .. .. .. - 2 .. ..
Vall och annat foder/
Ley and other fodder 562 .. 1 653 6 135 488 1 178
Oljeväxter/Oil plants 166 .. .. 158 0 - 6 129
Övr. växter o. träda/Other crops and fallow 149 .. .. 385 2 - 22 281
Källa/Source : Nordisk statistisk årsbok, ÅSUB/Nordic Statistical Yearbook, Statistics Åland
0
2
4
6
8
10
12
14
16
18
20
DK FI AX IS NO SE

Nordisk och internationell jämförande statistik
234 Statistisk årsbok för Åland – Statistical Yearbook of Åland 2012
15.7. Fiske, årlig fångst 2010, ton 15.7. Fishing, annual catches 2010, tonnes
15.8. Bostäder efter lägenhets- och hustyp 2010, 1 000 st 15.8. Number of dwellings by type of building 2010, 1 000 pcs
15.9. Nybyggda lägenheter 1990-2010 15.9. Dwellings completed 1990-2010
Fisk/Fish DK FO GL1) FI AX IS NO SE
Totalt 828 008 393 875 102 376 118 663 3 415 1 063 453 2 677 609 211 970
Sötvattenfisk/
Freshwater fish 676 .. 19 3 821 187 0 303 2 026
Flunderfisk/Flounder 25 072 3 178 20 621 17 15 24 198 13 515 766
Torskfisk/Cod 111 802 178 965 8 064 509 526 410 598 934 556 14 482
Övr. saltvattenfisk/
Other sea-water fishes 646 579 200 731 7 994 114 316 2 686 618 030 1 573 799 191 452
Skaldjur/Shellfish 43 881 11 001 65 677 .. .. 10 627 155 435 3 243
1)Uppgifterna gäller för 2009/Figures from 2009
Källa/Source : Nordisk statistisk årsbok, ÅSUB/Nordic Statistical Yearbook, Statistics Åland
Hus- och lägenhetstyp/
Type of building DK FO GL FI AX IS2) NO1) SE2)
Summa 2 559 .. 23 2 793 15 130 1 962 4 527
En- och tvåfamiljshus/One- and two-family houses 1 517 .. 13 1 508 10 65 1 120 2 050
Flerfamiljshus/
Apartment b locks 971 .. 10 1 230 4 64 776 2 476
Övriga/Other 71 .. 0 54 0 1 66 ..
1 rum och kök/
1 room with kitchen 95 .. 2 409 1 3 99 654
2 rum och kök/
2 rooms with kitchen 465 .. 5 835 3 19 258 989
3 rum och kök/
3 rooms with kitchen 580 .. 6 620 3 31 384 1 077
4 rum och kök/
4 rooms with kitchen 619 .. 5 508 3 31 442 861
5+ rum och kök/5+ rooms with kitchen 744 .. 2 388 4 45 779 9461)Siffrorna gäller 2001/Figures from 2001. 2)Siffrorna gäller 2009/Figures from 2009.
Källa/Source : Nordisk statistisk årsbok, ÅSUB/Nordic Statistical Yearbook, Statistics Åland
År/Year DK FO GL FI AX IS NO SE
1990 27 237 .. 331 65 133 264 .. 27 120 58 4261995 13 503 .. 260 24 979 52 .. 19 214 12 6782000 15 564 .. .. 32 609 131 .. 19 534 12 9842005 26 557 .. 189 34 012 165 .. 29 544 23 0682006 28 775 161 1 035 33 681 204 .. 28 554 29 8322007 30 680 357 289 35 281 262 .. 30 970 30 5272008 25 684 225 .. 30 338 204 .. 28 617 32 0212009 16 719 .. .. 21 972 229 .. 21 783 22 8212010 .. .. .. 25 653 241 .. 17 832 ..
Källa/Source : Nordisk statistisk årsbok, ÅSUB/Nordic Statistical Yearbook, Statistics Åland

Nordisk och internationell jämförande statistik
Statistisk årsbok för Åland – Statistical Yearbook of Åland 2012 235
15.10. Gästnätter på hotell efter gästernas hemland 2010, 1 000 st 15.10. Number of nights spent at hotels by home country of the guests 2010, 1 000 pcs
15.11. Personbilar 1.1.1990-2011 15.11. Private cars 1.1.1990-2011
15.12. Arbetslöshet efter kön 1.1.2007-2009, procent 15.12. Unemployed by sex 1.1.2007-2009, per cent
Gästernas hemland/ DK FO GL1) FI AX IS NO SEHome country of the guests
Totalt 14 627 .. 237 15 113 170 2 025 18 393 33 576Danmark/Denmark 8 730 .. 54 78 1 103 519 882
Färöarna/Faroe Isl. 122 .. .. .. 0 .. .. ..
Grönland/Greenland 40 .. 119 .. 0 .. .. ..
Finland 25 .. .. 10 990 90 30 75 414
Island/Iceland 29 .. 3 8 0 404 16 17
Norge/Norway 470 .. 2 116 2 87 13 595 1 273
Sverige/Sweden 1 107 .. 4 319 67 79 602 25 795
Tyskland/Germany 1 262 .. 5 415 1 294 709 1 057
Storbritannien/
Great Britain 627 .. 4 359 1 231 439 547
USA 371 .. 9 170 1 142 302 408
Japan 88 .. 0 131 0 17 101 96
Övriga länder/Other 1 757 .. 16 2 527 6 637 2 035 3 086
Källa/Source : Nordisk statistisk årsbok, ÅSUB/Nordic Statistical Yearbook, Statistics Åland
År/Year DK FO GL FI AX IS NO SE
Antal personbilar, 1 000 st/Number of private cars, 1 000 pcs1990 1 598 14 .. 1 885 12 124 .. 3 6011995 1 611 11 .. 1 847 13 116 1 654 3 6312000 1 843 14 2 2 056 14 151 1 814 3 8902005 1 916 18 4 2 316 16 175 1 978 4 1132010 2 120 20 5 2 740 18 205 2 244 4 3012011 2 164 .. .. 2 839 19 205 2 309 4 335
Personbilar per 1 000 invånare/Private cars per 1 000 inhabitants1990 311 298 .. 381 498 490 .. 4221995 309 259 .. 364 501 435 380 4122000 346 313 36 399 526 543 405 4392005 354 362 77 444 586 598 429 4562010 383 411 96 515 662 646 462 4602011 389 .. .. 531 687 .. .. 460
Källa/Source : Nordisk statistisk årsbok, ÅSUB/Nordic Statistical Yearbook, Statistics Åland
År/Year Kön/Sex DK FO GL FI AX IS NO SE
2008 Totalt 3,4 0,3 .. 6,4 2,3 3,0 2,6 6,2- kvinnor 3,5 .. .. 6,7 2,0 2,6 2,4 6,4- män 2,9 0,6 .. 6,2 2,5 3,4 2,8 5,9
2009 Totalt 6,1 5,1 .. 8,4 2,0 7,4 3,2 8,4- kvinnor 5,4 3,8 .. 7,6 1,6 5,8 2,7 8,0- män 6,7 6,2 .. 9,0 2,4 8,9 3,7 8,8
2010 Totalt 7,6 7,1 .. 8,5 3,3 7,7 3,7 8,4- kvinnor 6,7 7,8 .. 7,7 3,0 6,8 3,1 8,3- män 8,4 6,6 .. 9,3 3,6 8,6 4,2 8,6
Källa/Source : Nordisk statistisk årsbok, ÅSUB/Nordic Statistical Yearbook, Statistics Åland
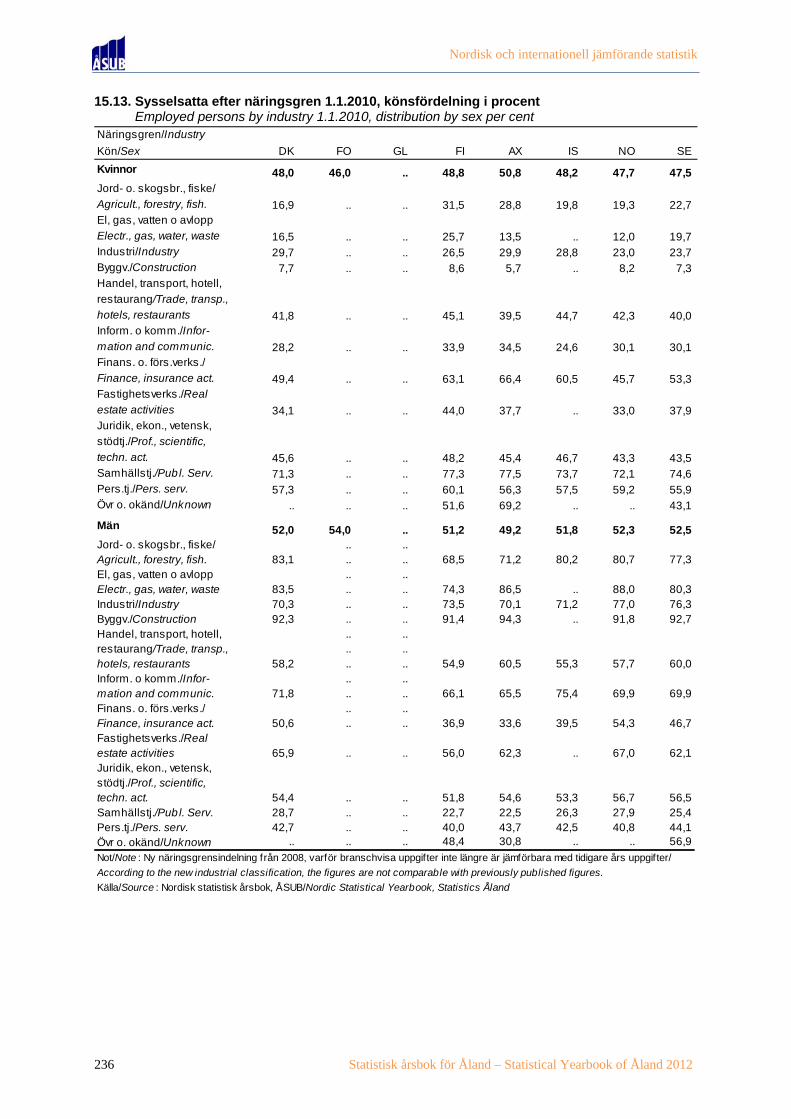
Nordisk och internationell jämförande statistik
236 Statistisk årsbok för Åland – Statistical Yearbook of Åland 2012
15.13. Sysselsatta efter näringsgren 1.1.2010, könsfördelning i procent 15.13. Employed persons by industry 1.1.2010, distribution by sex per cent
Näringsgren/Industry
Kön/Sex DK FO GL FI AX IS NO SE
Kvinnor 48,0 46,0 .. 48,8 50,8 48,2 47,7 47,5Jord- o. skogsbr., fiske/
Agricult., forestry, fish. 16,9 .. .. 31,5 28,8 19,8 19,3 22,7El, gas, vatten o avlopp
Electr., gas, water, waste 16,5 .. .. 25,7 13,5 .. 12,0 19,7Industri/Industry 29,7 .. .. 26,5 29,9 28,8 23,0 23,7Byggv./Construction 7,7 .. .. 8,6 5,7 .. 8,2 7,3Handel, transport, hotell,
restaurang/Trade, transp.,
hotels, restaurants 41,8 .. .. 45,1 39,5 44,7 42,3 40,0Inform. o komm./Infor-
mation and communic. 28,2 .. .. 33,9 34,5 24,6 30,1 30,1Finans. o. förs.verks./
Finance, insurance act. 49,4 .. .. 63,1 66,4 60,5 45,7 53,3Fastighetsverks./Real
estate activities 34,1 .. .. 44,0 37,7 .. 33,0 37,9Juridik, ekon., vetensk,
stödtj./Prof., scientific,
techn. act. 45,6 .. .. 48,2 45,4 46,7 43,3 43,5Samhällstj./Pub l. Serv. 71,3 .. .. 77,3 77,5 73,7 72,1 74,6Pers.tj./Pers. serv. 57,3 .. .. 60,1 56,3 57,5 59,2 55,9Övr o. okänd/Unknown .. .. .. 51,6 69,2 .. .. 43,1
Män 52,0 54,0 .. 51,2 49,2 51,8 52,3 52,5Jord- o. skogsbr., fiske/ .. ..Agricult., forestry, fish. 83,1 .. .. 68,5 71,2 80,2 80,7 77,3El, gas, vatten o avlopp .. ..Electr., gas, water, waste 83,5 .. .. 74,3 86,5 .. 88,0 80,3Industri/Industry 70,3 .. .. 73,5 70,1 71,2 77,0 76,3Byggv./Construction 92,3 .. .. 91,4 94,3 .. 91,8 92,7Handel, transport, hotell, .. ..restaurang/Trade, transp., .. ..hotels, restaurants 58,2 .. .. 54,9 60,5 55,3 57,7 60,0Inform. o komm./Infor- .. ..mation and communic. 71,8 .. .. 66,1 65,5 75,4 69,9 69,9Finans. o. förs.verks./ .. ..Finance, insurance act. 50,6 .. .. 36,9 33,6 39,5 54,3 46,7Fastighetsverks./Realestate activities 65,9 .. .. 56,0 62,3 .. 67,0 62,1Juridik, ekon., vetensk,stödtj./Prof., scientific,techn. act. 54,4 .. .. 51,8 54,6 53,3 56,7 56,5Samhällstj./Pub l. Serv. 28,7 .. .. 22,7 22,5 26,3 27,9 25,4Pers.tj./Pers. serv. 42,7 .. .. 40,0 43,7 42,5 40,8 44,1Övr o. okänd/Unknown .. .. .. 48,4 30,8 .. .. 56,9
Not/Note : Ny näringsgrensindelning från 2008, varför branschvisa uppgifter inte längre är jämförbara med tidigare års uppgifter/
According to the new industrial classification, the figures are not comparable with previously published figures.
Källa/Source : Nordisk statistisk årsbok, ÅSUB/Nordic Statistical Yearbook, Statistics Åland

Nordisk och internationell jämförande statistik
Statistisk årsbok för Åland – Statistical Yearbook of Åland 2012 237
Figur 15.4. Sysselsättningsgrad efter kön 1.1.2010 Figure 15.4. Employment rate by sex 1.1.2010
Figur 15.5. Bruttonationalprodukten per capita 2000 och 2010, EUR PPP Figure 15.5. Gross domestic product per capita 2000 and 2010 EUR PPP
Figur 15.6. Barn i dagvård 2005 och 2010, procent av 0-6 åringar Figure 15.6. Children in day-care 2005 and 2010, per cent of 0-6 years
Not/Note: Gäller åldersgrupp 0-10 för DK, FO och SE, 0-7 år för FI och AX, 0-6 år för IS och NO/The age group is 0-10 years for DK, FO and SE, 0-7 years for FI and AX, 0-6 years for IS and NO.
0
10
20
30
40
50
60
DK FO FI AX IS NO SE
Procent
Kvinnor/Women
Män/Men
0
5 000
10 000
15 000
20 000
25 000
30 000
35 000
40 000
45 000
50 000
DK FI AX IS NO SE
EUR PPP
2000 2010
0
10
20
30
40
50
60
70
80
90
DK FO FI AX IS NO SE
Procent
2005 2010

Nordisk och internationell jämförande statistik
238 Statistisk årsbok för Åland – Statistical Yearbook of Åland 2012
15.14. Konsumentprisindex 2000-2010, 2005=100 15.14. Consumer price index 2000-2010, 2005=100
15.15. Folkbiblioteksverksamhet 2000-2010 15.15. Public libraries 2000-2010
Figur 15.7. Dagstidningar, genomsnittlig nettoupplaga per 100 personer 2009-2010 Figure 15.7. Newspapers, average daily net circulation per 100 persons 2009-2010
År/Year DK FO GL FI AX IS NO SE
2000 90,8 .. 88,4 94,0 94,2 81,6 91,7 93,0
2005 100,0 100,0 100,0 100,0 100,0 100,0 100,0 100,0
2006 101,9 101,5 102,4 101,6 101,7 106,8 102,3 101,4
2007 103,6 105,1 105,6 104,1 103,4 112,1 103,0 103,6
2008 107,2 111,7 112,4 108,3 107,8 126,1 107,0 107,2
2009 108,6 110,5 .. 108,3 108,0 141,2 109,2 106,62010 111,1 111,0 .. 109,7 110,1 148,8 111,9 107,9
Källa/Source : Nordisk statistisk årsbok, ÅSUB/Nordic Statistical Yearbook, Statistics Åland
År/Year DK FO GL FI AX IS NO SEBokbestånd/Books (1 000-tal)
2000 30 761 212 .. 40 565 333 2 166 20 917 44 0122005 28 249 226 .. 40 880 321 .. 20 060 41 3592006 28 066 257 .. 40 653 332 .. 21 859 40 6332007 25 993 261 .. 40 478 319 .. 21 788 40 1042008 24 756 263 .. 40 508 334 .. 21 734 39 5202009 24 070 265 .. 40 056 323 .. 21 584 39 0602010 .. .. .. .. 326 .. .. 36 302
Bokutlån./Home loans (1 000-tal)2000 72 465 123 .. 101 711 486 2 159 18 387 70 1402005 73 743 150 .. 105 570 474 .. 17 898 60 1812006 72 843 133 .. 102 555 466 .. 24 113 58 5552007 71 640 142 .. 100 840 457 .. 23 977 57 2452008 74 577 132 .. 99 777 473 .. 24 546 58 2632009 76 857 148 .. 98 827 474 .. 25 171 70 4312010 .. .. .. .. 476 .. .. 68 710
Källa/Source : Nordisk statistisk årsbok, ÅSUB/Nordic Statistical Yearbook, Statistics Åland
0
10
20
30
40
50
60
70
DK FO GL FI AX IS NO SE
Nettoupplaga
2009 2010

Nordisk och internationell jämförande statistik
Statistisk årsbok för Åland – Statistical Yearbook of Åland 2012 239
15.16. Valdeltagande vid parlamentsvalen 1990-2011, procent 15.16. Voting percentage in parliamentary elections 1990-2011, per cent
År/Year DK FO GL FI AX IS NO SE
1990 82,8 87,5
1991 67,5 68,4 62,4 87,6 86,7
1992
1993 75,8
1994 84,3 82,5 86,8
1995 69,6 68,6 62,5 87,4
1996
1997 78,3
1998 86,0 88,2 81,4
1999 76,9 65,3 66,0 84,1
2000
2001 87,2 75,5
2002 91,6 75,4 80,1
2003 66,7 67,6 87,7
2004 92,3
2005 84,5 74,9 77,4
2006 82,0
2007 86,6 65,0 67,8 83,6
2008 89,5
2009 71,3 85,1 76,4
2010 84,6
2011 87,7 67,4 66,9
Källa/Source : Nordisk statistisk årsbok, ÅSUB/Nordic Statistical Yearbook, Statistics Åland

Nordisk och internationell jämförande statistik
240 Statistisk årsbok för Åland – Statistical Yearbook of Åland 2012
15.17. Världens länder. Areal, medelfolkmängd och folktäthet 2010 15.17. Countries of the world. Area, mean population and population density 2010
Land/ Areal km2/ Medel- Invånare Land/ Areal km2/ Medel- Invånare
Country Area km 2 folkmängd/ per km2/ Country Area km 2 folkmängd/ per km2/
Mean popu- Inhabi- Mean popu- Inhabi-
lation tants per lation tants per
x 1 000 km 2 x 1 000 km 2
Europa Icke suveräna områden/Non-sovereign areasSuveräna stater/Sovereign states DanmarkDanmark 43 094 5 545 129 Färöarna 1 393 49 35Finland 336 861 5 335 16 FinlandIsland 103 000 318 3 Åland 1 580 28 18Norge 323 782 4 889 15 NorgeSverige 450 295 9 378 21 Svalbard och
Jan Mayen 62 422 2 0Albanien 28 748 3 194 111 StorbritannienAndorra 468 85 181 Gibraltar 6 29 4 833Belgien 30 528 10 879 356 Isle of Man 572 82 143Bosnien-Herce- Kanalöarna 194 158 814 govina 51 209 3 844 75Bulgarien 110 879 7 534 68 AsienEstland 45 227 1 340 30 Suveräna stater/Sovereign statesFrankrike 551 500 62 968 114 Afghanistan 652 864 24 486 38Grekland 131 957 11 283 86 Armenien 29 743 3 256 109Irland 70 273 4 474 64 Azerbajdjan 86 600 9 047 104Italien 301 336 60 483 201 Bahrain 758 1 178 1 554Kroatien 56 594 4 426 78 Bangladesh 143 998 146 600 1 018Lettland 64 559 2 239 35 Bhutan 38 394 696 18Liechtenstein 160 36 225 Brunei 5 765 406 70Litauen 65 300 3 287 50 Cypern 9 251 804 87Luxemburg 2 586 507 196 Demokr. folkrep. Makedonien 25 713 2 053 85 Korea 120 538 23 612 196Malta 316 416 1 316 Filippinerna 300 000 94 013 313Moldavien 33 846 3 562 105 Förenade arab-Monaco 2 33 17 368 emiraten 83 600 4 765 57Montenegro 13 812 633 46 Georgien 69 700 4 411 63Nederländerna 37 354 16 615 445 Indien 3 287 263 1 182 105 360Polen 312 679 38 184 122 Indonesien 1 910 931 236 954 124Portugal 92 207 10 637 115 Irak 435 244 33 402 77Rumänien 238 391 21 438 90 Iran 1 628 750 74 340 46Ryska federa- Israel 22 072 7 625 345 tionen 17 098 242 142 938 8 Japan 377 930 127 450 337San Marino 61 33 544 Jordanien 89 342 6 113 68Schweiz 41 285 7 826 190 Kambodja 181 035 14 303 79Serbien 1) 88 361 7 428 84 Kazakstan 2 724 900 15 900 6Slovakien 49 037 5 430 111 Kina (exkl. Slovenien 20 273 2 049 101 Taiwan) 9 596 961 1 334 740 139Spanien 505 992 46 071 91 Kirgisistan 199 951 5 193 26Storbritannien 242 900 62 222 256 Kuwait 17 818 2 583 145Tjeckien 78 865 10 520 133 Laos 236 800 6 310 27Turkiet, se Asien Libanon 10 452 3 972 380Tyskland 357 114 81 776 229 Malaysia 330 803 28 250 85Ukraina 603 500 45 963 76 Maldiverna 300 320 1 066Ungern 93 027 10 000 107 Mongoliet 1 564 100 2 670 2Vatikanstaten 0,4 0,8 1 864 Burma 676 577 47 758 71Vitryssland 207 600 9 491 46 Nepal 147 181 27 504 187Österrike 83 871 8 390 100 Oman 309 500 3 174 101) Serbien inklusive Kosovo/Including Kosovo.

Nordisk och internationell jämförande statistik
Statistisk årsbok för Åland – Statistical Yearbook of Åland 2012 241
Land/ Areal km2/ Medel- Invånare Land/ Areal km2/ Medel- Invånare
Country Area km 2 folkmängd/ per km2/ Country Area km 2 folkmängd/ per km2/
Mean popu- Inhabi- Mean popu- Inhabi-
lation tants per lation tants per
x 1 000 km 2 x 1 000 km 2
Pakistan 796 095 165 150 207 Madagaskar 587 041 18 865 32Qatar 11 607 1 714 148 Malawi 118 484 13 630 115
Republiken Korea 99 897 48 875 489 Mali 1 240 192 12 706 10
Saudiarabien 2 149 690 24 807 12 Marocko 446 550 31 851 71
Singapore 712 5 077 7 130 Mauretanien 1 030 700 3 162 3
Sri Lanka 65 610 20 653 315 Mauritius 1 969 1 281 651
Syrien 185 180 20 125 109 Moçambique 801 590 21 854 27
Tadzjikistan 143 100 7 295 51 Namibia 824 268 2 143 3
Taiwan 36 188 22 921 633 Niger 1 267 000 15 204 12
Thailand 513 120 67 312 131 Nigeria 923 768 140 004 152
Turkiet 783 562 72 698 93 Republiken
Turkmenistan 488 100 5 124 10 Centralafrika 622 984 3 151 5
Uzbekistan 447 400 28 268 63 Rwanda 26 338 10 413 395Vietnam 349 340 86 928 249 São Tomé och Yemen 527 968 23 154 44 Príncipe 964 164 170Östra Timor 14 919 1 115 75 Senegal 196 712 12 509 64
Seychellerna 452 87 192Icke suveräna områden/Non-sovereign areas Sierra Leone 72 300 5 747 79Kina Somalia 637 657 9 559 15 Hongkong 1 104 7 068 6 402 Sudan 2 505 813 38 193 15 Macao 30 545 18 153 Swaziland 17 364 1 146 66Palestina 6 020 4 048 672 Sydafrika 1 221 037 49 991 41 Västbanken 5 655 2 612 462 Tanzania 945 087 41 900 44 Gazaområdet 365 1 537 4 211 Tchad 1 284 000 10 111 8
Togo 56 785 5 731 101Afrika Tunisien 163 610 10 549 64Suveräna stater/Sovereign states Uganda 241 550 30 661 127Algeriet 2 381 741 35 978 15 Zambia 752 612 12 897 17Angola 1 246 700 12 531 10 Zimbabwe 390 757 12 260 31
Benin 114 763 8 779 76
Botswana 582 000 1 823 3 Icke suveräna områden/Non-sovereign areas
Burkina Faso 272 967 15 731 58 Frankrike
Burundi 27 834 7 384 265 Mayotte 374 216 578
Djibouti 23 200 632 27 Réunion 2 513 817 325
Egypten 1 002 000 78 728 79 Storbritannien:
Ekvatorialguinea 28 051 616 22 Brittiska Indiska
Elfenbenskusten 322 463 21 395 66 Oceanöarna 78 - -
Eritrea 117 600 5 028 42 S:t Helena 411 8 19
Etiopien 1 104 300 79 221 72 Västsahara 266 000 394 2
Gabon 267 668 1 313 5
Gambia 11 295 1 510 134 AmerikaGhana 238 533 23 417 98 N o r d - o c h M e l l a n a m e r i k a
Guinea 245 857 10 537 43 Suveräna stater/Sovereign states
Guinea-Bissau 36 125 1 389 38 Antigua och
Kamerun 475 650 19 406 41 Barbuda 442 86 195
Kap Verde 4 033 518 128 Bahamas 13 943 347 25
Kenya 581 313 40 400 69 Barbados 430 276 643
Komorerna 2 235 732 393 Belize 22 966 333 14
Kongo-Brazzaville 342 000 3 752 11 Kanada 9 984 670 34 109 3
Kongo-Kinshasa 2 344 858 66 515 28 Costa Rica 51 100 4 562 89
Lesotho 30 355 1 892 62 Kuba 109 886 11 242 102
Liberia 111 369 3 335 34 Dominica 751 72 96Libyen 1 759 540 5 484 3 Dominikanska rep. 48 671 9 884 203

Nordisk och internationell jämförande statistik
242 Statistisk årsbok för Åland – Statistical Yearbook of Åland 2012
Land/ Areal km2/ Medel- Invånare Land/ Areal km2/ Medel- Invånare
Country Area km 2 folkmängd/ per km2/ Country Area km 2 folkmängd/ per km2/
Mean popu- Inhabi- Mean popu- Inhabi-
lation tants per lation tants per
x 1 000 km 2 x 1 000 km 2
El Salvador 21 041 6 183 294 Peru 1 285 216 29 462 23Förenta Staterna Surinam 163 820 531 3 (USA) 9 629 091 309 051 32 Uruguay 176 215 3 357 19Grenada 344 109 317 Venezuela 912 050 28 834 32Guatemala 108 889 14 362 132Haiti 27 750 10 085 363 Icke suveräna områden/Non-sovereign areasHonduras 112 492 8 046 72 FrankrikeJamaica 10 991 2 702 246 Franska Guyana 83 534 232 3Mexico 1 964 375 107 551 55 StorbritannienNicaragua 130 373 5 816 45 Falklandsöarna 12 173 3 0Panama 75 417 3 504 46Saint Kitts och Oceanien Nevis 261 39 149 Suveräna stater/Sovereign statesSaint Lucia 539 168 312 Australien 7 692 024 40 519 15Saint Vincent och Fijiöarna 18 272 882 48 Grenadinerna 389 99 254 Kiribati 726 110 136Trinidad och Marshallöarna 181 54 300 Tobago 5 130 1 318 257 Mikronesien 702 108 154
Nauru 21 14 660Icke suveräna områden/Non-sovereign areas Nya Zeeland 270 467 4 368 16Danmark Palau 459 21 46 Grönland 2 166 086 57 0 Papua Nya Guinea 462 840 5 462 12Frankrike Salomonöarna 28 896 542 19 Guadeloupe 1 705 404 237 Samoa 2 842 184 65 Martinique 1 128 400 354 Tonga 747 103 138 Saint-Pierre och Tuvalu 26 11 430 Miquelon 242 7 29 Vanuatu 12 189 221 18Förenta Staterna Jungfruöarna 347 110 317 Icke suveräna områden/Non-sovereign areas Puerto Rico 8 870 3 979 449 AustralienNederländerna: Cocosöarna 14 1 42 Aruba 180 108 598 Julön 135 1 10 Nederländska Norfolkön 36 2 58 Västindien 800 198 247 FrankrikeStorbritannien Franska Polynesien 4 000 264 66 Anguilla 91 16 176 Nya Caledonien 18 575 246 13 Bermuda 53 65 1 218 Wallis och Futuna 142 16 58 Brittiska Förenta Staterna Jungfruöarna 151 22 146 Amerikanska Caymanöarna 264 55 208 Samoa 199 66 332 Montserrat 102 5 49 Guam 549 181 329 Turks- och Nordmarianerna 457 48 106 Caicosöarna 948 40 43 USA, de mindre
avsidesliggande S y d a m e r i k a Stillahavsöarna 45 - -Suveräna stater/Sovereign states Nya ZeelandArgentina 2 780 400 40 519 15 Cooköarna 236 23 98Bolivia 1 098 581 10 426 9 Niue 260 1 6Brasilien 8 514 877 193 253 23 Tokelau 12 1 139Chile 756 102 17 094 23 StorbritannienColombia 1 141 748 45 508 40 Pitcairn 5 0 1Ecuador 256 369 14 205 55Guyana 214 969 778 4 Antarktis 13 177 000 - -Paraguay 406 752 6 451 16
Not/Note : För vissa länder f inns inte uppgifter för 2010. I dessa fall visas senast tillgängliga siffror med kursiv stil/Figures for 2010 are not available for all countries. For these countries, the latest available figures are given in italics.
Källa/Source : Statistikcentralen, Förenta Nationerna/Statistics Finland, United Nations

Subject index
Statistisk årsbok för Åland – Statistical Yearbook of Åland 2012 243
Subject index
page
Abortions 190 -number 121
Accidents caused by wild animals 126 -road traffic accidents 125
Accommodation establishments 118 Causes of death 65
Adult education centres 205 Change of population 58
Age pyramids 43 Child care 183
Agricultural tractors 121 Citizenship 50
Agriculture 85-89 Citizenship, regional 50
-arable land 85 -applications 50
-income 89 Commuting 138
-production 89 Comprehensive schools 199-200
-production subsidies 89 Construction 75-77, 79
-type of production 86 Consumer price index 162
-use of arable land 88 -Nordic comparisons 238
Apprenticeship training 205 Cottages 80
Archipelago ferry service 127 Cultivated area 85
-by type of vehicle 127
-passengers and vehicles 127 Daily newspapers 212
Archives, provincial 212 Deaths 59
Area -by age and sex 64
-international comparisons 240 -causes 65
-of arable land 85 Degreedays 26
-of forest 90 Dental care 188
-of municipalities 23 Divorces 59
-of water 23 Driving licenses
Average life expectancy 66 -issued 124
-registered 124
Bike routes 126 Dwellings 73
Bird protection areas 27 -by floor area 73
Book production 210 -by tenure status 73
Building completions 79 -number of 73
Buildings 77
-by year of completion 77 Ecological production 88
Education 199-208
Camping sites 118 -expenditure 211
Care-days 188 -field of education 208
Care for elderly 184 Elderly center 184
Cars Elections 217-228
-buses 121 -EU referendum 227
-Nordic comparisons 235 -European Parliament elections 227

Subject index
244 Statistisk årsbok för Åland – Statistical Yearbook of Åland 2012
-legislative assembly (Lagtinget) 217 -regeneration 91
-municipal elections 221 -seedling 91
-parliamentary 226 Free-time residential buildings 80
-participation 220 -density of cottages 80
-presidential 225 Funds statement 174
General Court of first instance 214
Elk-hunting 95 General elections 217
Emigration 66 Geographical data 23
Employed Graduations 202
-by age 133 Gross domestic product 157
-by employer sector 139 Gross output value, manufacturing industry 100
-by sex 139 Guest harbours 118
-by status in employment 139
Employed persons 134 Harbours 115, 118
Employment office 144 Hazardous waste 30
Employment ratio 133 Health and medical care
Enterprises 164 -dental care 188
-financial statements 160-161 -expenditure 190
-number 164 -primary care 187
Expenditure -special care 188
-of Government of Åland 169 Health insurance 195
-of municipalities 173 Heating fuel 78
Exports 104 Home-help 184
Hospital beds 189
Families 53 Hotels 117
Families with children 53 Hours worked in the manufacturing industry 101
Family allowances 191 Households 52-53, 73
Farms 85 -crowded living space 73
Fertilizers 31 Houshold dwelling units 52
Finances Housing 73
-of Government of Åland 169 Housing production
-of municipalities 173 -dwellings by type 77
Fish culture 92 -dwellings completed 75
Fishing -living space 76
-income 92 -Nordic comparisons 234
-Nordic comparisons 234 -type of building 76
Forests Hunt on roe deers 93
-area 90 Hunting
-growing stock 90 -on deers 93

Subject index
Statistisk årsbok för Åland – Statistical Yearbook of Åland 2012 245
-for seal 94 -household-dwelling units 53
Hunting licences 94 -libraries 209
-number of 23
Ice, break up 27 -population 37
Immigration 66, 67 -population changes 59
Imports 104 -population density 39
Income -social services 185
-agriculture 89 Museums, visits 212
-the Government of Åland 169 Music school 205
-municipalities 176 Names 69
-persons 150 National accounts 157-159
-subject to taxation 147-151 Natural monuments 27
Industry 99-102 Nature reserves 27
Inflation 163 Newspapers 212
Judicial system 214 Nordic comparisons
-cars 235
Labour force 133 -construction 234
-Nordic comparisons 236 -consumer price index 238
Land use 24, 88 -economy 237
Length of life 66 -elections 239
Live births 63 -employment 236
-according to age of mother 63 -fishing 234
Livestock farms 87 -labour force 236
-land use 231
Manufacturing industry 99-102 -library 238
Marinas 118 -life expectancy 232
Marriages 61 -migration 232
Mean temperature 25 -newspapers 238
Merchant fleet 111 -organic farming 233
Migration 66 -population 231
Milk production 89 -population density 232
Mortality 59 -turism 235
Motor vehicles 121 Number of pupils 199
-by first year of use 122
-development of stock 123 Occupation 142
Municipalities Offences
-construction 75 -known to the police 214
-elections 221 Office of Landsurvey 81
-finances 173-179 Oil products 32

Subject index
246 Statistisk årsbok för Åland – Statistical Yearbook of Åland 2012
Parishes -mortality 64
-activities 213 -Nordic comparisons 231
-economy 213 -population growth 59
-members 213 Population density 39
Parliamentary elections 226 -Nordic comparisons 232
Passenger vessels 112 Population of the districts 40
Pensioners 192 Population projection 68
Pensions 192-194 Population pyramids 43
-pension beneficiaries 192 Postal consignments 129
-expenditure 193 Precipitation 25
-invalidity pensions 192 Primary production 85-95
-old-age pensions 192 Professional education institutions 202
-social security pensions 194 Profit and loss account
Places of work 99, 165 -enterprises 160
Population 35-57 -the Government of Åland 171
-age distribution 43 -municipalities 173
-by country of birth 35 Provincial Archives 212
-by field of education 208 Psychiatric care 187
-by language 35 Public libraries 209
-by main activity 55, 56 -Nordic comparisons 238
-by marital status and sex 51
-by religion 51 Real estate taxes 179
-citizenship 50 Referred care 188
-density 39 Rents 82
-employed 55 Roads 126
-households 52, 53 Road traffic accidents 125
-international comparisons 240
-in urban areas 39 Seal-hunting 94
-Nordic comparisons 231 Seamen 114
-of working age 45 Shipping 111
-resident 36 Social services 183
Population change 58-67 -child allowances 191
-death 59, 64 -expenditure 185
-divorces 59 Somatic specialized care 188
-emigration 66 Students in higher education 201
-excess of births 60 Subsidies
-live births 63 -agricultural 89
-marriages 59 -for damage caused by deers 95
-migration 59 Supply of electricity 32

Subject index
Statistisk årsbok för Åland – Statistical Yearbook of Åland 2012 247
Surnames 69 Water supply 28
Taxes -consumption 28
-by size of income 148 -price 28
-church tax 149 Watercourse 29
-individuals 147 Waterways 115
-municipal 149 Weather conditions 25
-real estate tax 179 Work places 165
-State 149
The Åland health and medical care organisation 187 Ålands lyceum 201
-expenditure 190
-primary care 187
-revenues 190
-special care 188
The Åland University of Applied Sciences 201
Trade 103
-turnover 103
-value added 103
-work places 103
Traffic accidents 125
Unemployment 133, 143
Unemployment benefits 144
Value added, manufacturing industry 100
Vehicles
-arrived 116
Vessels 111
-by age 113
-employees on ships 114
Veterinary care 190
Villages
-inhabitants 40
Vocational schools 202
Wages and salaries 152-154
Waste
-for recycling 30
-hazardous 30
Waste water treatment 28

Sakregister
248 Statistisk årsbok för Åland – Statistical Yearbook of Åland 2012
Sakregister
sida
Aborter 190 -nordiska jämförelser 231
Aktielägenheter 82 -religionssamfund 51
Allmänna val 228 -språk 35
Arbetade timmar inom tillverkningsindustrin 101 -sysselsatt 55
Arbetande -utbildningsnivå 208
-efter kön 139 -verksamhet 55, 56
-efter yrkesställning 139 -ålder 44
-efter arbetsgivarsektor 139 -ålder och kön 42
-efter ålder 133 Befolkningsprognos 68
Arbetsförmedling 144 Befolkningspyramider 43
Arbetskraft 133 Befolkningsrörelse 58-67
-nordiska jämförelser 236 -döda 59, 64
Arbetslöshet 133, 143 -dödlighet 64
Arbetslöshetsersättningar 144 -emigration 66
Arbetsplatser 137 -flyttningsrörelse 59
Arbetsställen 99, 165 -folkökning 59
Areal -födda 59
-internationella jämförelser 240 -giftermål 59
-kommunernas 23 -kön och region 58
-odlad 85 -nativitetsöverskott 60
-skogs- 90 -nordiska jämförelser 228
-vatten- 23 -skilsmässor 59
Arkiv 212 Beskattning
Avfall - kommunal 177
-omhändertaget problemavfall 30 Biblioteksverksamhet 209
-omhändertaget återvinningsbart avfall 30 -nordiska jämförelser 238
-bransch 31 Bilar
-destination 31 -antal 121
Avloppsvattenrening 28 -bussar 121
-nordiska jämförelser 235
Bankväsende 106 -vägtrafikolyckor 125
Barnbidrag 191 Bokproduktion 210
Barnfamiljer 54, 55 Bostadshushåll 52
Barnomsorg 183 Bostadslägenheter
Befolkning 35-57 -antal 73
-bosatt 37 -boendetäthet 73
-civilstånd och kön 51 -golvyta 73
-folktäthet 39 -upplåtelseform 73
-födelseort 35, 47 Bostadsproduktion
-hushåll 52, 53 -färdigställda lägenheter 75
-internationella jämförelser 240 -hustyp 76
-i tätorter 39 -lägenhetstyp 74, 77
-kön och kommun 38 -nordiska jämförelser 234
-medborgarskap 50 -yta 76

Sakregister
Statistisk årsbok för Åland – Statistical Yearbook of Åland 2012 249
-ägare 77 -avkastning 92
Brott 214 -nordiska jämförelser 234
Bruttonationalprodukt 157 Fiskodling 92
Bruttoproduktionsvärde för industrin 100 Flygtrafik 128
Bränsle 78 Flyttning 66, 67
Busstrafik 129 Flyttningsrörelse 59
Byar Folkhögskolan 202
-invånarantal 40 Folkmängd 35
Byggnader 77 Folkmängdsförändring 59
- byggnadsår 77 Folkpensioner
Byggnadsverksamhet 75-77, 79 -pensionstagare 192
-utgifter 193
Campingplatser 118 Folktäthet 39
Civilstånd 54 -nordiska jämförelser 232
Cykelleder 126 Fordon
-anlända 116
Dagstidningar 212 Fordonsbestånd 123
Döda 59 -enligt första bruksår 122
-efter ålder och kön 64 -utveckling 123
Dödsorsaker 65 Fritidsbebyggelse 80
Fågelskyddsområden 27
Efternamn 69 Färdigställda byggnader 79
Ekologisk odling 88 Födelseort 47, 48
Ekonomi Födda 59, 61
-kommunal 173 Företag
-landskapet Ålands 169 -antal 164
Elevantal 199 -bokslutsuppgifter 160-161
Elförsörjning 32 Församlingar
-anskaffning 32 - ekonomi 213
-försäljning 32 - folkmängd 213
Emigration 66, 67 - verksamhet 213
Examen 202 Förädlingsvärde för industrin 100
Export 105
Geografiska uppgifter 23
Fackskolor 202 Gifta 59
Familjer 53 Graddagar 26
Farleder 115 Grundskolor 199-200
Farligt avfall 30 -högstadiet 199
Fartyg 111 -låg- och mellanstadiet 200
-fartygsanställda 114 Gymnasiet 201
-åldersfördelning 113 Gårdsbruk 86
Fastighetsskatt 179 Gästhamnar 118
Finansieringskalkyler 174
Fiske Hamnar 115, 118

Sakregister
250 Statistisk årsbok för Åland – Statistical Yearbook of Åland 2012
Handeln 103 -bruttointäkter 89
-arbetsställen 103 -produktion 89
-omsättning 103 -produktionsinriktning 86
-förädlingsvärde 103 -stöd 89
Handelsflottan 111 -åkerareal 83
Hembygdsrätt 50 Jordförvärvsansökningar 81
-ansökningar 50
Hjortdjursskadebidrag 95 Kommuner
Hotell 118 -befolkning 37
Husdjurshållning 87 -befolkningsrörelsen 59
Hushåll 52-53, 73 -bibliotek 209
-trångbodda 73 -bostadshushåll 52
Hyra 82 -byggnadsverksamhet 75
Hälso- och sjukvård -ekonomi 173-179
-kostnader 190 -folktäthet 39
-primärvård 187 -nyckeltal 178
-specialsjukvård 188 -socialväsende 185
-tandvård 188 -val 221
Högskolan på Åland 201 Konsumentprisindex 163
Högskolestuderande 202, 206 -nordiska jämförelser 238
Kreditgivning 106, 107
Immigration 66, 67 Körkort
Import 105 -registrerade 124
Industri 99-102 -utfärdade 124
Inflation 163
Inkomster Lagtingsval 217-220
-anställda 152 Landareal 23
-jordbruket 89 Landskapsarkivet 212
-kommuner 176 Landskapstrafiken 127
-landskapet Åland 169 Landskapet Åland
-medellön 152 -resultaträkning 171
-skattepliktiga 147-151 -balansräkning 172
Inkvarteringsanläggningar 118 -inkomster 169
Inresande 116 -utgifter 169, 170
Invandring 66, 67 Lantmäteriet 81
Investeringar 102 Levande födda 63
Islossning 27 -efter moderns ålder 63
Livslängd 66
Jakt Lägenheter 74
-på hjortdjur 93 Lärare 207
-på säl 94 Läroavtal 205
Jaktkort 94 Löner 152-154
Jordbruk 85-89
-brukningsenheter 86 Markanvändning 24, 88

Sakregister
Statistisk årsbok för Åland – Statistical Yearbook of Åland 2012 251
Medborgarinstitutet 205 Pensionärer 192
Medellivslängd 66 Postförsändelser 129
Medeltemperatur 25 Primärproduktion 85-95
Medelvårdtid 188 Psykiatrisk vård 188
Mjölkproduktion 89
Museibesök 212 Remitterad vård 189
Musikinstitut 205 Resultaträkning
-företag 160
Namn 69 -kommuner 173
Nationalräkenskaper 157-159 -landskapet 171
Naturminnen 27 Riksdagsmannaval 226
Naturreservat 27 Rådjursjakt 93
Nederbörd 25 Rättsväsen 214
Nordiska jämförelser Röstberättigade och röstande 219, 222
-arbetskraft 236
-befolkning 231 Sjukförsäkring 195
-befolkningsrörelsen 232 Sjöfart 111
-biblioteksverksamhet 238 Sjömän 114
-bilar 235 Skatter
-bostadsproduktion 234 -efter inkomstklass 148
-bruttonationalprodukt 237 -fastighetsskatt 179
-dagstidningar 238 -fysiska personer 147
-ekologisk odling 233 -kommunalskatt 149
-ekonomi 237 -kyrkoskatt 149
-fiske 234 -statsskatt 149
-folktäthet 232 Skilsmässor 59
-konsumentprisindex 238 Skogar
-markanvändning 231 -försäljning 91
-medellivslängd 232 -plantering 91
-sysselsättning 236 -skogsareal 90
-turism 235 -totala virkesförrådet 90
-val 239 -ägarkategori 90
Näringsgren 234 Skogsvårdsarbeten 91
Skärgårdstrafik 127
Odlad areal 85 -enligt fordonstyp 127
Oljeprodukter 32 -passagerare och fordon 127
Småbåtshamnar 118
Passagerarfartyg 112 Socialvård 183
Pendling 138 -barnbidrag 191
Pensioner 192-194 -kostnader 185
-folkpensioner 194 Somatisk specialsjukvård 188
-invaliditetspensioner 192 Sommarstugor 80
-kostnader 193 Språk 49
-ålderspensioner 192 Stadsdelarnas befolkning 40, 41

Sakregister
252 Statistisk årsbok för Åland – Statistical Yearbook of Åland 2012
Studiestöd 206 Vägar 126
Sysselsatt arbetskraft 134 Vägtrafikolyckor 125
-nordiska jämförelser 236 Världens länder 240
Sysselsättningsgrad 133 Växtnäring 31
Säljakt 94 Växtodling 85
Tandvård 188 Yrkesverksamhet 55, 56
Tillverkningsindustri 99-102 Yrkesgrupper 146
Tingsrätten 214
Trafikolyckor 125 Åkerareal 85-86
Traktorer 121 Ålands folkhögskola 201
Turistföretag 118 Ålands hälso- och sjukvård 187
-inkomster 190
Undervisning 199 -primärvård 187
-kostnader 211 -specialsjukvård 188
Utbildning 199 -utgifter 190
Utbildningsstruktur 208 Ålands lyceum 201
Utgifter Ålands musikinstitut 205
-kommuner 173 Ålderspyramider 43
-landskapet Åland 169
Utrikeshandel 104 Äktenskap 59
Utvandring 66, 67 Äldreomsorg 184
Älgjakt 93
Val, allmänna 217-228
-EU-folkomröstningar 227 Öppna högskolan 204
-kommunalval 221
-lagtingsval 217
-nordiska jämförelser 239
-presidentval 225
-riksdagsval 226
-valdeltagande 220
-val till EU-parlamentet 227
Vattenareal 23
Vattendragsbelastning 29
Vattenförsörjning 28
-konsumtion 28
-pris 28
Veterinärvård 190
Vigda par 59
Viltolyckor 126
Vindar 25
Vårddagar 188
Vårdplatser 188
Väder 25


ww
w.
as
ub
.a
xSTATISTISK Å
RSBOK FÖ
R ÅLA
ND 2012
ww
w.
as
ub
.a
xTfn +358 (0)18 25490Fax +358 (0)18 19495
Ålandsvägen 26PB 1187
AX - 22 111 MARIEHAMNÅland
ÅLANDS STATISTIK- OCH UTREDNINGSBYRÅ
STATISTICS ÅLAND
Ålänningar och turister, män och kvinnor, födda och döda, bilar och kor, jobb och löner, böcker och älgjakt. Det och mycket mera finns det uppgifter om i Statistisk årsbok. Där hittar du det mesta om Åland - och lite om Norden och övriga världen. Läs den och se om du blir överras-kad eller om du får bekräftelse på det du redan visste!
Besök också ÅSUBs hemsida! Där finns det ännu mera intressant in-formation.
ÅLAND ISSN 0358-8629
FOTO Visitaland.com │ 1, Annica Jansson │ 2, Peter Karlsson3, Daniel Eriksson │ 4, Jacob Saurén
Statistical Yearbook
Statistisk årsbok
2012