Embed Size (px)
Citation preview
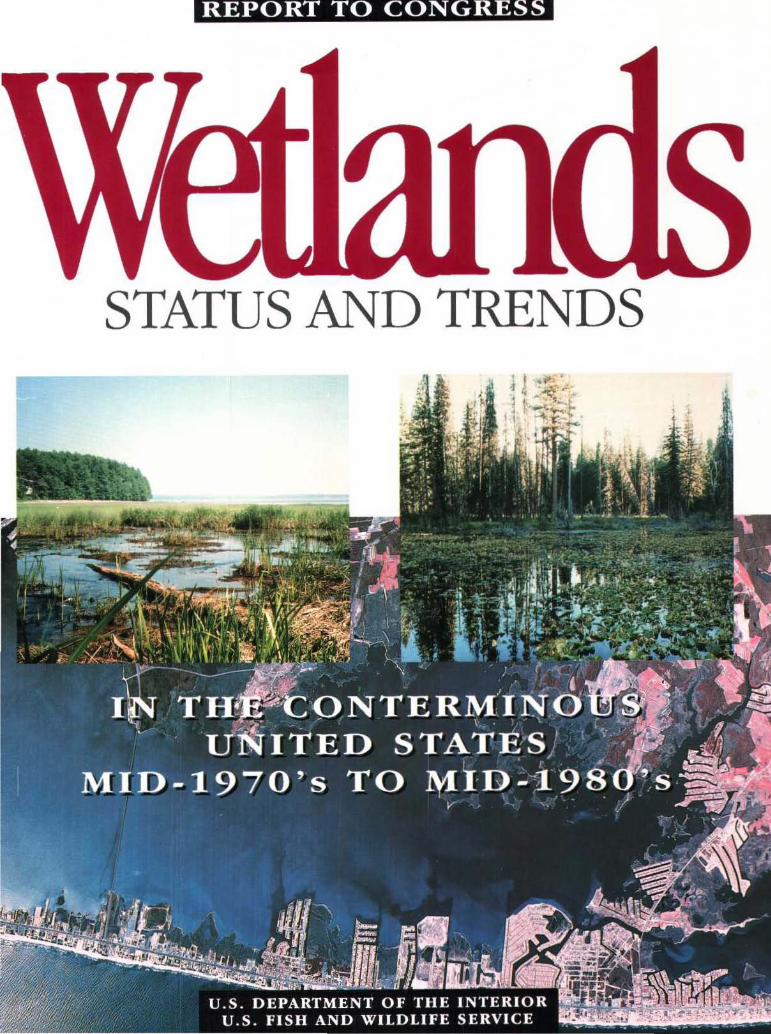
REPORT TO CONGRESS
STATUS AND TRENDS
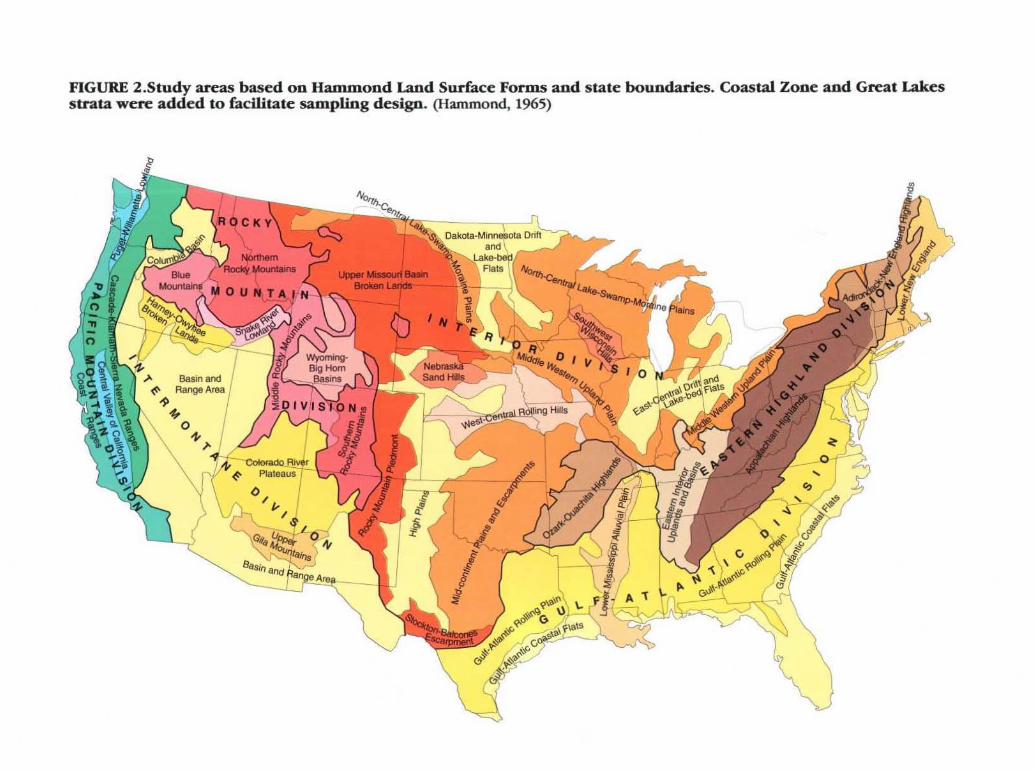
FIGURE 2.Study areas based on Hammond Land Surface Forms and state boundaries. Coastal Zone and Great Lakes strata were added to facilitate sampling design. (Hammond, 1965)
Wetlands STATUS AND TRENDS IN THE
CONTERMINOUS UNITED STATES MID-1970 's TO MID-1980's
First Update of the National Wetlands Status Report
1991
By Thomas E. Dahl
U.S. Fish and Wildlife Service National Wetlands Inventory
St. Petersburg, Florida
and
Craig E. Johnson U.s. Fish and Wildlife Service
Division of Habitat Conservation
Statistical Data Analysis by W.E. Frayer
Michigan Technological Universily Houghton, Michigan
This report should be dIed as fo llows:
Dahl, T.E. and C.r. Johnson. 1991. Staws and Trends of'iC'ellmuis in the Conterminous United Slales, Mid· /970s lo Alid·l98(j's. U.s. Department of the Interio r, Fish and Wildlife SelVire, washington, D.C. 28 pages.

For ",Ie by lhe U,S. Go'·~mmenl Pnnting Offic~ Superintendent of Docum"nt.>. Mall SlOP: SSOP. W",hing1<Jn. DC 2()402·9328
ISBN 0-16-035916-3
STATUS AND TRENDS OF WETLANDS ---------
PREFACE
T he u .s. Fish and Wildlife Service is the pri ncipal Federal agency with responsibility for protecting and managing the Nalion's fish and wildlife and their habiratS . Because of the importance of wet
lands to the Nation's fish and wildlife, the Service is parlicularly can· cerned with the fate of wetlands and associated deepwater habiratS. In 1982, the Fish and Wildlife Service's National Wetlands Invemory completed a study of the status and trends of wetlands and deepwater habirats for the contenninous Uni1.ed Stales. The 1982 report estimated the acreage of wetlands remaining in Lhe conterminous UniLed States and the changes in wetland acreage between the mid-1950's and the mid-1970'"
The Emergency Wetlands Resources Act of 1986 requires the Fish and Wildlife Service to update the initial wetlands statuS and trends information every ten years, beginning with this repon . This rcpon is the first nationalupdalc of the 1982 report and was prepared LO fu lfi ll the stat utory requirements o[ the Act.
This report does not address the causes [or changes in welland acreage or the effects those changes may have had on the Nation's flSh and wildlife resources. A subsequem report is being prepared that will provide a more comprehensive analysis of the data presel1led in this reJX>n.
Wetlands, as measured by the status and trends study, are defined by the Fish and Wildlife Selvice's wetlands classiflcation system Cowardin, el. at. 1979, that defines the biological extent of wetlands using various techniques including high altitude aerial photography. It includes both vegetated and non-vegetated wetlands. References to [his wetlands definition and terminology are found in Appendix A of this report.
n,ls repon uses one methodology (based on the Cowardin, elo at. classiflcilion system) [or identifying and classifying wetlands. We recognize that other government reports may use different methodologies.
'111e Federal Manual [or Identifying and DelineaLing Jurisdictional Wetlands delineates wetlands based o n precise o n-the-ground measure· ment techniques and focllses only on vegeu'ued wetlands.
Th is report is the result of extensive elTon by many individ uals throughout the U.S. Fish and Wtldlife Service. Special appreciation is extended lO Dr. Donald Wocxlard, Group Leader, Dr. H. Ross Pywell, Mr .
• Presem affiliation· South Hort(/a \tater Management Distn'ct, Itt-sf Il1lm /kaell, F/on'tla
iii
STA TU S AND TRENDS OF WETL ANDS ---------
Herman Robinson, Ms. Henee Whitehead, Mr. Norman Mangrum, Ms. Rebecca Stanley, Ms. Georgann Shylkofski, Ms. Gwendolyn Sanderlin, and Mr. Leslie Vilchek· of the National Wetlands Inventory Group, Sl. Petersburg, Florida; Mr. Charles Storrs of the Division o f Habitat Conservation in Atlanta, Georgia; Dr. Bill O. Wilen, Project Leader, Mr. Carlos Mendoza, and Ms. Mary Bates, National Wetlands Inventory, Washington, D.C.; Ms. Denise Henne, Office of Correspondence and Information, Washington, D.C.; Dr. W.E. Fra)'er, School of Forestry, Michigan Technological University, Houghton, Michigan; Mr. Kei th Patterson and Mr. Jim Dick, of Geonex-Martel, Inc. Special recognition is also due to Mr. William Knapp and Ms. Cathy Short, Division of Habiull Conservation, Wash ington, D.C., ancl Ms. E. laVerne Smitll, Branch of Special Projects, Washington, D.C.
iv
S TAT US AND TRE N DS OF WETLAND S ---------
TABLE OF CONTENTS PAGE
List of Tables ................................................................................................. vi
List of Figures .............................................................. ................................ vi
Executive Sumlnary ......................................................................... ...... ....... 1
Introduaion .................................................................................................. 3
Survey Procedures ............................................................................ .... ....... .4
Study I:>esign ............................................................................................ .4
Statistical Rel iabiliry .................................................................................. 4
Procedures ............. ...... ............................................................................. 4
Results-WeLland Resources Mid-1970's to Mid· 1980's ........................... 8
National Status .......................................................................................... 8
Trends in Wetlands Resources Mid-1970's to Mid·1980's ......... ...... .... 10
Estuarine WeLlands ............................................................................. 10
Palustrine WeLlands ............................................................................ 11
Decpwatcr Habitats ................................................................... ..... .. . 14
SUlnlnary ........................................................................................ ........ ..... 15
References Cited ...... ..................................................... .................. .... ........ 16
Appendices ........................................................................................... ... .... 17
v

STATUS AND TRENDS OF WETLANDS ---------
LIST OF TABLES PAGE
Table 1. Mean dales of the pholographic coverage for the sample ploLS used in this study, by Stale ...... ...... ........... ....... .5
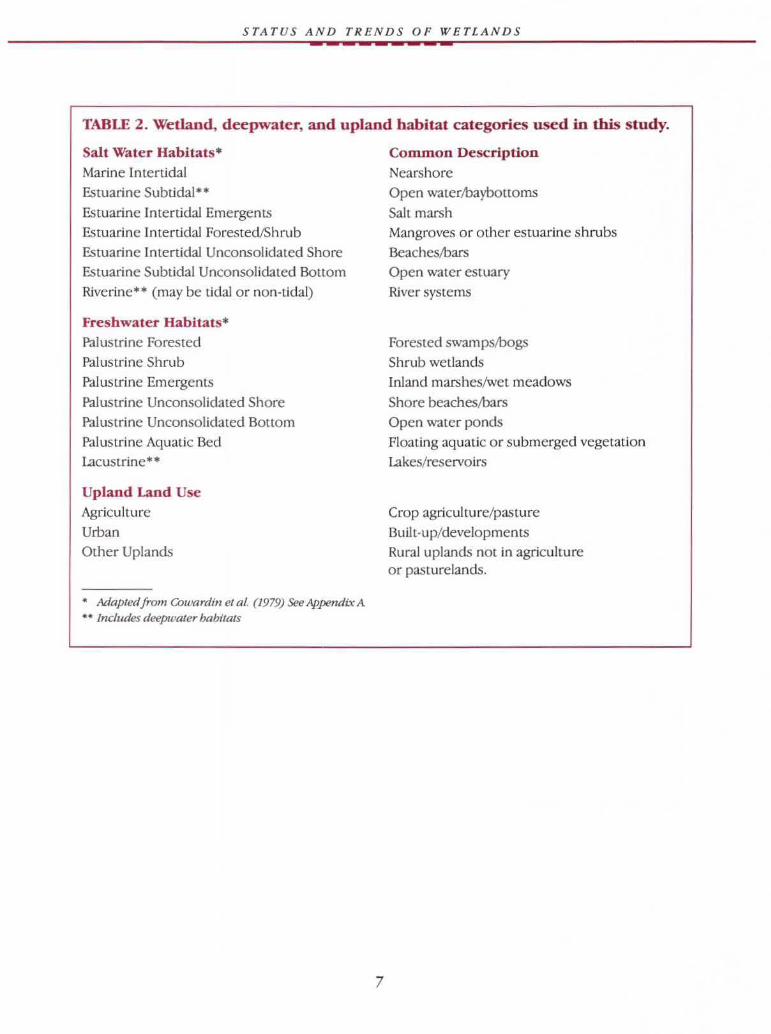
Table 2. Wetland, deepwater, and upland habitat categories used in this study. ..................................................................... 7
Thble 3. Gains and losses for selected Cltegories of wetlands and deepwater habitms, mid· 1970's to mid-1980's .............. 9
Table 4. Changes in coastal wetland acreage, mid-1970's to ITI id-1980's ........................................ ..... ........... ...... .............. .. . 10
LIST OF FIGURES PAGE
Figure 1. States that have lost more than 50 percCnl of their
Figure 2.
Figure 3.
Figure 4.
Figure 5.
Figure 6.
Figure 7.
Figure 8.
Figure 9.
Figure 10.
wetlands between the 1780's and mid-1980's ...................... 2
Study areas based on Hammo nd Land Surface Forms and state boundaries. Coastal Zone and Great Lakes strata were added to fadlitate sam pling design ........................................ .Ins ide Front Cover
Sample plot distribution fo r the State of North Carolina. Coastal areas Witl1 more habitat variability and suspected wetland density are more inlensivcly sampled than mountainous areas .......................................... 6
Make-up of estuarine (coasml) wetlands, mid-1980's .......... 8
Make-up of palustrine (freshwater) wetlands, mid-1980's ... 8
Fate of convened estuarine emergent (coast.al) wetlands, mid-1970's to mid-1980's ..................................... 11
P'JIUSlrine wetland gains and losses, mid-1970's to ITIict-1980's .......................................................................... 11
States with large (> 100,000 acres) losses of palustrine fo rested wellands, mid-1970's to mid-1980's ...................... 11
Comparison of palustrine wetland lypes lost between the mid-1950's to mid-1970's and the mid·1970·s to ITIid-1980's ......... ......... ............ ............................................ 12
A more com plete piclure of wetland conversions measured in this study ........................................................... 13
vi

STATUS A ND T R ENDS OF W E TL ANDS ---------
EXECUTIVE SUMMARY
T he Emergency Wetlands Resources Act of 1986 [16 U.S.c. 3931 (a)] requires 'he Secre· tary of the Interior, act ing through the
Director of the Fish and Wildlife Service, to produce updated reports on the statuS and trends of wel· lands and deepwater habitats in the contenninous United States, on a ten year cycle. ll1is report is the first update of an earl ier repon titled Status and Trends of Wetlands and Deepwater Habitats in the Conterminous United States, 1950's to 1970's, which was completed in 1982, It constitutes a stalls· tically valid eITort to estimate the Nation's wetland resources and provide indications of gains or losses for 14 categories of wetland and deepwater habitats.
The sampling design consisted of a stralified random sample of 3,629 plots located with in the lower 48 States, Aerial photography from (he mid· 1970's and the mid-1980's (mean cL1tes were 1974 and 1983) was acqu ired for each of the plots and analyzed to detect changes in wetland acreage , Changes in the acreage of wetland and deepW'.ller habium were recorded as either natural or man-ind uced. The overall study design was intended to produce estimates of our Nation's wetlands at twO points in time-the mid-1970's and mid-1980's.
The design recognized Ulat aerial photography is not aVJilable in each successive year for the same plot or necessarily in the same rear for all plots. r'Or these reasons, estimates of average annual rales of wetland loss have nOt been developed by tllisswdy.
One possible way of calculating an average ann ual net loss of wetlands for the study period would be to use the wetland acreage estimate for the mid-1980's (1983) minus the acreage estimate for the mid-1970's (1974) and divide by tile nineyear studr period. Using this method, the average annual loss of wetlands for this period would be approximately 290 thousand acres,
TIle make·up of wetlands by vegetated cover type differs dramatically from freshwmer to cstuar·
1
ine systems, In coastal areas, 73.1 percent o f all wetlands were estuarine emergenl whereas inland, an estimated 52.9 percent of freshwate r wetlands were forested. Freshwater emergent marshes and shrubs make up 25.1 and 15.7 percent of the total freshwater wellands, respectively.
5[Udy results indicate thal there were an esti· mmed 105,9 mill ion acres of wetlands in tile con· terminous United States in the mid· 1970's. In the mid-1980's, there were 103.3 million acres of wetlands. This translates into a net loss of over 2.6 million acres over the study period. Freshwate r wetlands experienced 98.0 percent of the losses that occurred during the study period. By the mid-1980's, an estimated 97.8 million acres of freshwater wetlands and 5.5 millio n acres of estuarine (coastal) wetlands remained.
Losses in the estuarine system were evident by the decrease in estuarine vegetated wetlands, which declined by 71.0 thousand acres. The mao jority of these losses occurred in the Gulf Coast States, and most of the loss was due to sh ifting of emergcnl wetlands to open salt water (bays). An est imated 57.0 percent of the losses of emergent salt marsh vegetation went (Q open salt water. Estuarine nonvegetated wetlands increased by an estimated 11.6 thousand acres from the mid-1970's to the mid-1980's.
Inland, palustrine (freshwater) vegetated wetlands experienced substan tial losses. An estimated 3.3 mill ion acres were lost from all palustrine (freshwater) vegetated categories from the mid-1970's to the mid·1980's. The area of palus trine nonvegetated wetla nds (p ri marily freshwater ponds) increased by an est imated 792.4 tho usand acres from the mid-1970's to the m id-1980's. Almost all oflhis increase was in palustrine unconsolidated lX>llom (primarily ponds), and most occurred on lands nOI prev iously class ified as wetlands or dcepwatcr habitats.

STATUS AND TRENDS OF WETlANDS ---------Wetland losses from the mid·1970's to the mid·
1980's were more evenly distributed between agricultural land use and "other" land use (than from the 1950's to the mid-1970's)_ Conversions tOagricultural land uses accounted for 54.0 percent of the losses while conversions to "other" land uses accounted for 41.0 percent of the losses. This is an appredable change from trends observed in the earlier s tudy in which agricultural conversion rep· resented 87.0 percent o f all wetland losses. A substantial portion o f the increased importance of lands classified as "other" is attributable to wetlands that had been cleared and drained, but not yet put to an identifiable usc . Conversions of wetlands to urban land uses accounted for about 5.0
percent of the wetlands loss. Overall , wetland acreage in the mid-1980's constituted 5.0 percent of the land area o f the conte rminous United States.
Since lhe mid-1980's, indications are that wetland losses are slowing. From 1987 to 1990, programs to restore wetlands under tlle 1985 Food Security Act have added about 90.0 tho usand acres to lhe Nation's wetlands inventory (U.S. Fish and Wildlife Service 1991) . Other programs to protect wetlands , like the Swampbuster provision of the Food Security ACt, have generated support for conserving wetlands. In addition , public education and extens ion e ffo rts have he lped heighten o ur Nation's awareness of the values of wetlands.
FIGURE 1. States that lost more than 50 percent of their wetlands between the 1780's and mid-1980 's (Usted states shaded) (after Dahl 1990) :
State Percent Lost State Percent Lost Alabama ......... ....... ... .. ... .... ..... ..... ... .. .... .. .. ... .50 Maryland ....................... .. ................... ..... ... 73 Arkansas ...................................... ................. 72 Michigan ........... .... ....... .. .... ... ....................... 50 California .................. .................. ... .. .... .. ...... 91 Mississippi ............ ........ ........ ........ ....... ..... .. .59 Colorado .......... .. ............................ ... .. ... .. .... 50 Missouri .. .............. .. .. .. .. .. .. .. ......................... 87 Connecticut .... ... ..... ............. .......... ....... .. .. ... 74 Nevada .... .... ..................................... .. .. ... ... .. 52 Delaware ...... .. .. .............. .. .......... ....... ... .... ... . 54 New York ......................................... ...... .. ... . 60 Idaho. ................ .... . . .... ............................ .56 ~~..................................................... .W Illinois ................. ... .. .. .. .. .. ........... ................. 85 Oklalloma ........................ .............. ... .... .... .. . 67 Indiana ............... .. .. .. .. .. ................................ 87 Pennsylvania ................................................ 56 Iowa ...................... .... ................. ....... ... ........ 89 Tennessee.. ...... .... ................ .... ......... .. .. 59 Kentucky ............. ... .. .................. ...... ....... .... . 81 Texas ...................... .................................... 52
2
STATUS AND TRENDS OF WETLANDS ---------
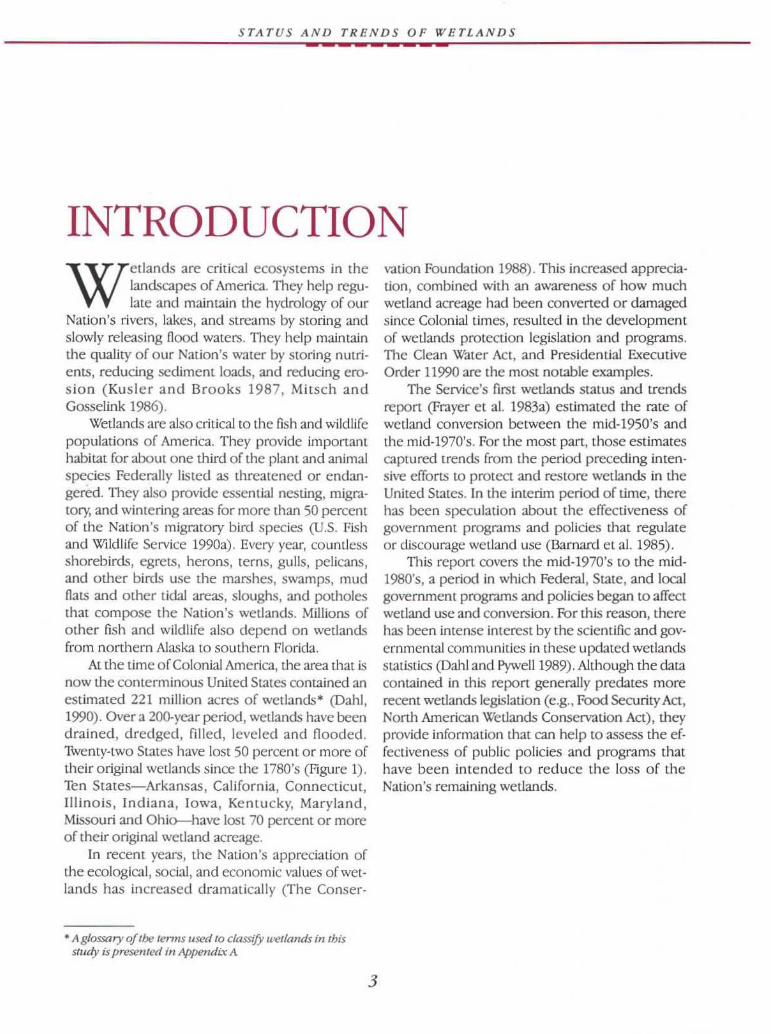
INTRODUCTION
W etlands are crilical ecosystems in the landscapes of America. They help regulate and maintain the hydrology of our
Nation's rivers, lakes, and streams by storing and slowly releasing flood waters. They help maintain the quality of our Nation's w,uer by Storing nulrients, reducing sediment loads, and reducing eros ion (Kusler and Brooks 1987, Mitsch and Gosselink 1986).
WetJands are also critical to the fish and wildlife populations of America. They provide important habitat for about one third of the plant and animal species r-ederally listed as threatened or endangered. They also provide essential nesting, migratory, and wintering areas for more than 50 percent of the Nat.ion's migratory bird species (U.S. Fish and Wildlife Service 1990a). Every year, couneless shorebirds, egrets, herons, terns, gulls, pelicans, and other birds use the marshes, swamps, mud flats and other tidal areas, sloughs, and potholes thaI compose the Nation's wetlands. Millions of other fish and wildlife also depend on wetlands from northern Alaska to southern Florida.
At the time of Colonial America, the area that is now the conterminous United States contained an estimated 221 million acres of wetlands* (Dahl, 1990). Over a 200-year period, wetlands have been drained, dredged, filled, leveled and flooded. Twenty-two Stales have lost 50 percem or more of Iheiroriginal wetlands since the 1780's (Figure 1). Ten States-Arkansas, California, Connecticut, Illinois, Indiana, Iowa, Kentucky, Maryland, Missouri and Ohio-have lost 70 percent or more of their original wetland acreage.
In recent years, the Nation's appreCiation of the ecological, SOCial, and economic values of wetlands has increased dramatically (The Conser-
• Aglossary of the ten"s used to claSSIfy wetlands i'llhis stlldy is presentcti ill Appendix A
3
vation r-oundatiOn 1988). This increased appreciation, combined with an awareness of how much welland acreage had been converted or damaged since Colonial times, resulted in the development of wetlands protection legislation and programs. TI1C Clean Water Act, and Presidential Executive Order 11990 are the most notable examples.
The Service's first wetlands status and [fends report (Frayer et al. 1983a) estimated the rate of wetland conversion between the mid-1950's and the mid-1970's. For the most part, those estimates captured trends from the period preceding intensive efforts to protect and restOre wetlands in the United States. In the interim period of time, there has been speculation about the effectiveness of government programs and poliCies that regulate or discourage wetland use (Barnard et al. 1985).
TI1is report covers the mid-1970's to the mid-1980's, a period in which Federal , State, and local goverrunem programs and pol icies began to affect wetland use and conversion. For this reason, [here has been intense interest by the SCientific and governmental communities in these updated wetlands statislics (Dahl and Py\vellI989). Although the clata contained in this report generally predates more recent wetlands legislation (e.g., Food Security Act, NOrth American Wetlands Conservation Act), they provide information that can help to assess the effectiveness of public policies and programs that have been intended 1O reduce the loss of the Nation's remaining wetlands.

STATUS AND TRENDS OF WETLANDS ---------
SURVEY PROCEDURES
T he Service's wetlands Status and trends reo pons have one primary objective: produce comprehensive, statistically valid estimates
of the Nalion 's wetlands acreage. To achieve this objective, a group of statisticians from the Fish and Wildlife Service, Forest Service, Soil Conservation Service, and the Army Corps of Engineers developed a design for a national wetlands status and trends studr This design was used for both the 1982 wetlands status and trencls study and this up· dale of that study. Several authors have also adapted the national study design to produce regional wetlands status reports (Frayer et al. 1989, 1-lalI1988, TIner 1987).
STUDY DESIGN
The design for the national wetlands status and trends studyconsisrs of a stratified random sample of 3,629 plots. Each sample plot is four square miles, or 2,560 acres in size, and is permanent (i.e., u1e 1982 and 1991 StaLUS and trends stud ies use the same sample plors).
The conterminous United Slales was stratified using state boundaries and the 35 phys ical subdivisions described by Hammond (1970). Two additional strata were added to enhance lhe study design-a coastal stratum that consists of estuarine wetlands in coastal areas and a stratum encom· passing the coastal areas of the Great Lakes (Figure 2, Inside Front Cover). Sample plots were randomly allocated to strata in proportion to the amount of wetland acreage expected in the stra· tum based on estimates developed by Shaw and Fredine (1956). As a result, the study design more intensively sampled areas where wetland habitats were more variab le and had higher density (Figure 3).
TI1is study was designed to be a quantitative measure of the areal extem of wetlands in the con-
4
terminous United States. It provides no indication of wetland quality outside of the diminishing area of wetlands, by category.
STATISTICAL RELIABILITY
National estimates were developed using the statistical procedures presented by Frayer et al. (1983a, 1983b). This study was designed LO generate national acreage estimates and be 90 percent certain that those eslimales were within 10 percent of the aoual wetland acreage to[3\s for the entire conterminous United States. The reliability of each estimate is expressed as a percent standard error for that estim:ltC. W11ere Statistical reliability permitted, regio nal or stale estimates were developed.
PROCEDURES
To collect information for ead1 of the sample plOlS, the Service acquired U.S. Geological Survey tOpographic maps and aerial photography for lhe study period. The mean years of the aerial photOgraphy used in this study were 1974 and 1983 (fable 1); this nine-year interval may be used as the basis for calculating annual average acreage estimates. Typically, the imagery used for the 1980's was color infrared photography, while the imagery used for the 1970's was black and white photography.
All aerial phoLOgraphs were interpreted and annotated using the procedures developed by the National Wetlands Inventory (U.S. Fish and Wildlife Service 1990b; 199Oc). The photo interpretation assigned wetlands and deepwater habitats observed on the aerial photographs 10 o ne of the 14 categories listed in Table 2. All changes were recorded as either natural (e.g., nalural conversions of emergent wetlands to shrub wetlands) or man-induced (e.g., conversion of wetlands to a

STATUS A ND TRENDS OF WETL A NDS ---------TABLE 1. Mean dates of the photographic coverage for the sample plots used in this study, by State.
State 1970's 1980's State 1970's 1980's Alabama 1975 1981 Nebraska 1975 1983 Arizona 1973 1982 NeV'dda 1974 1981 Arkansas 1974 1983 New Hampshire 1974 1986 Cal ifornia 1974 1983 New Jersey 1978 1984 Colorado 1976 1982 New Mexico 1975 1982 Connecticut 1972 1985 New York 1974 1985 Delaware 1977 1982 North Carolina 1973 1983 Florida 1974 1984 Norlh Dakota 1975 1983 Georgia 1975 1982 Ohio 1972 1982 Idaho 1976 1982 Oklahoma 1975 1983 Illinois 1973 1982 Oregon 1975 1982 Indiana 1973 1983 Pennsylvania 1971 1983 Iowa 1975 1983 Rhode Island 1976 1985 Kansas 1972 1982 South Carolina 1973 1983 Kentucky 1974 1982 South Dakota 1974 1983 Louisiana 1974 1983 Tennessee 1972 1981 Maine 1975 1984 Texas 1974 1983 Maryland 1972 1982 Utah 1975 1984 Massachusetts 1971 1985 Vermont 1975 1986 Michigan 1974 1982 Virginia 1974 1982 Minnesota 1975 1983 Washington 1975 1982 Mississippi 1973 1982 Wesl Virginia 1975 1984 Missouri 1973 1983 Wisconsin 1974 1981 Montana 1974 1982 Wyoming 1977 1981
5

STATUS AND TRENDS OF WETLANDS ---------nonwetJand area like agriculture or urban development). Areas in sample plots that were previously identified as wetlands but were no longer wetlands were placed into three broad land use categories: agricultural, urban, and "other."
Once the interpretation was complete, zoom transfer scopes were used to transfer the data from the aerial photographs to overlays on U.S. Geological Survey 1 :24,000 scale topographic maps. Changes in wetland area between the mid-1970's
FIGURE 3.
and the mid-1980's were determined on these maps. All photo interpretation and data compilation for this study were completed by August, 1990.
Qualiry control checks were buill into the process to prevent false changes from being recorded and to provide confirmation of the photo interpretation work. Acreage determinations and data entry provided further quality assurance to the raw pier data.
Sample plot distribution for the State of North Carolina. Coastal areas with more habitat variability and suspected wetland density are more intensively sampled than mountainous areas.
VA
, , . ' .: '
. . .. • NC· . .
• .::,',"'0 .. . , , '. ', . . . .. ' .... SC ..
6
STATUS AND T R ENDS O F WE TL ANDS ---------
TABLE 2 . Wetland, deepwater, and upland habitat categories used in this study.
Salt Water Habitats· Marine Intenjdal Estuarine Subtidal·· Estuarine Intertidal Emergenrs Estuarine Intertidal ForestedtSllrub Estuarine Intertidal Unconsol idatcd Shore Estuarine Subtidal Unconsolidatcd Bottom Riverine" (may be tidal or non-tidal)
Freshwater Habitats· Palustrine Forested Palustrine Shrub Palustrine Emergents Palustrine Unconsolidated Shore Palustrine Unconsolidated Bottom Palustrine Aquat ic Bed Lacustrine· •
Upland Land Use Agriculture Urban Other Uplands
• Adapted/rom Cowardill el al. (1979) See Appendix A •• Includes deepwall.>r habitals
7
Coaunon Description
Nearshore Open waterlbaybottoms Sail marsh Mangroves or other es tuarine shrubs Beacheslbars Open water estuary Ri ver systems
Forested swampsJbogs Shrub wetlands Inland marshes/wet meadows Shore beachesJbars Open water ponds Floating aquat ic or submerged vegetation lakes/reservoirs
Crop agricul ture/pasture Built-up/developments Rural uplands not in agriculture or paslurelands .

STA.TUS A.ND TREND S OF WETLANDS ---------
RESULTS
T his study produced estimates of wetland acreage changes from the mid-1970's to the mid-1980's for 14 wetland and deepwater
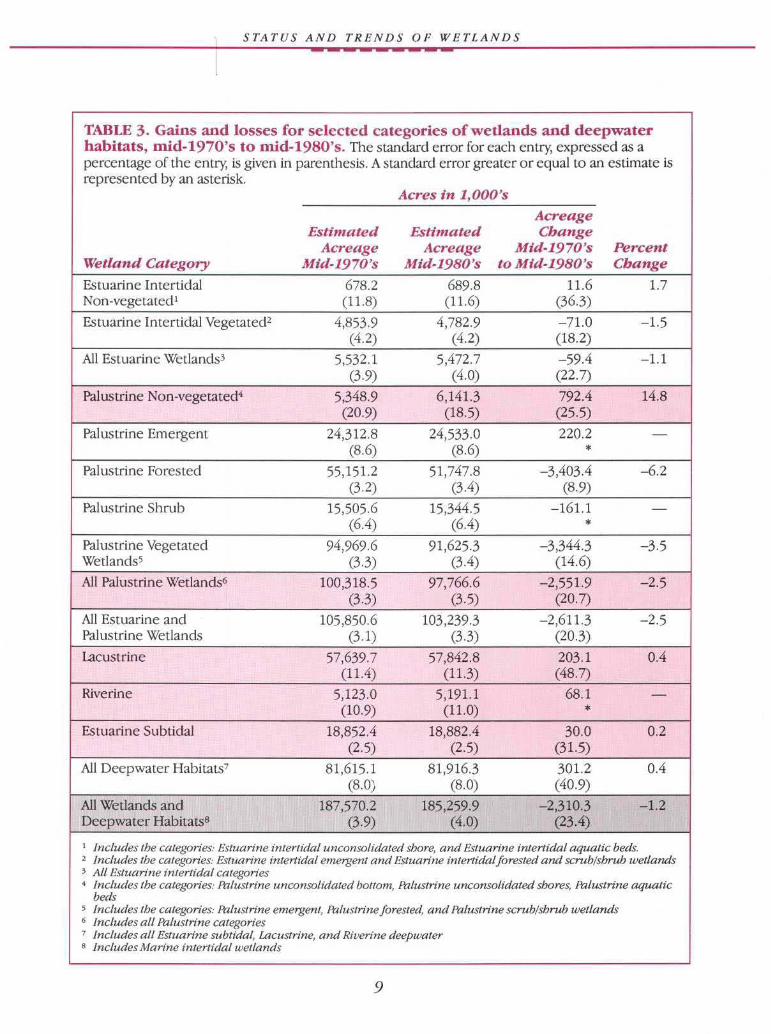
categories. These data are presented in Appendix B and are summarized in Table 3.
NATIONAL STATUS
In the mid· 1970's, there were an estimated 105.9 million acres of wetlands in the conterminous Uniled States. In the mid-1980's, an estimated 103.3 million acres o f wetlands remained.
Of the remaining wetland acreage in the conterminous United States, 97.8 million acres or 95.0 percent were freshwater (inland) wetlands. Another 5.5 million acres (5.0 percent) were estuarine (coastal) wetlands. In coastal areas, 73.1 percent of all es tuarine wetlands were emergent marshes . Another 12.7 percent were eSlUarine forestecVshrubs. Sandy o r rock shorelines represented 9.9 percent of the coastal wetland acreage, while estuarine aquatic beds represented 4.3 percent (Figure 4).
Inland, 52.9 percent of all palusLrine wetlands were fores te d . Freshwater emergent marshes made up 25 .1 percent ; 15.7 percent were wetlands dominated by shrubs. Freshwater ponds represented an estimated 5.7 percent of the total, with less than 0.6 percent of the acreage represented by other freshwater welland categories (Figure 5).
TIle acreage of deepwater habitats was also included in this study. There were an estimated 63.0 million acres of deepwater habitat in the lacustrine and riverine systems in the mid-1980's. TIl15 represents an increase of271.2 thousand acres from the mid·1970's estimate and was primarily due to the construction o f reservoirs and lakes in the southeastern States of Alabama, Flor ida, Georgia , Mississippi, and South Carolina.
8
FIGURE 4. Make-up of eslUarine (coastal) wetlands, m.id-1980's
D Unconsolidated Shon-JRocky Shore o AquatiC Bcd ~ EslUarine Fore$ledlShrub _ EsIU:uioe Inte rtidal Emergent
FIGURE 5. Make-up of palustrine (freshwater) wetlands, mid-1980's
o Foresled 0 Emergenl C Shnbs _ Ponds _ Unconsolidaled Shore'AqU.1OC Bed
STATUS AND TRENDS OF WETLANDS ---------
TABLE 3. Gains and losses for selected categories of wetlands and deepwater habitats, mid-1970's to mid-1980 's . TIle standard error for each entry, expressed as a percentage of the entry; is given in parenthesis" A st.andard error greater or equal to an estimate is represented by an asterisk.
Acres in l ,OOO's
Acreage Estimated Estimated Change
Acreage Acreage Mid·1970 's Percent Wetlalld Category Mid·1970 's Afid-1980's 10 M id -1980 's Cha"ge Estuarine Intertidal 678.2 689.8 11.6 1.7 Non-vegetared l (11.8) (11.6) (36.3)
Estuarine Intertidal Vegetated2 4,853.9 4,782.9 -71.0 -1.5 (4.2) (4.2) (18 .2)
All Estuarine Wetlands3 5,532.1 5,472.7 -59.4 - 1.1 (3.9) (4.0) (22.7)
Palustrine Non·vegetated~ 5,348.9 6,141.3 792.4 14.8 (20.9) (18.5) (25.5)
Palustrine Emergent 24,312.8 24,533.0 220.2 -(8.6) (8.6) •
Palustrine Forested 55,151.2 51,747.8 -3,403.4 -6.2 (3.2) (3.4) (8.9)
Palustrine Shrub 15,505.6 15,344.5 -161.1 -(6.4) (6.4) •
Palustrine Vegetated 94,969.6 91,625.3 -3,344.3 -3.5 Wetlands~ (3.3) (3.4) (14.6)
All Palustrine WetJands6 100,318.5 97,766.6 -2,551.9 -2.5 (3.3) (3.5) (20.7)
All Estuarine and 105,850.6 103,239.3 -2,611.3 -2.5 Palustrine Wetlands (3.1) (3.3) (20.3)
lacustrine 57,639.7 57,842.8 203.1 0.4 (11.4) (11.3) (48.7)
Riverine 5,123.0 5,191.1 68.1 -(10.9) (11.0) •
Estuarine Subtidal 18,852.4 18,882.4 30.0 0.2 (2.5) (2.5) (31.5)
All Deepwater Habitats7 81,615.1 81,916.3 301.2 0.4 (8.0) (8.0) (40.9)
All Wetlands and 187,570.2 185,259.9 -2,310.3 -1.2 Deepwa(er Habitat.s8 (3.9) (4.0) (23.4)
1 Includes the categories: Estuarine illlertidal unconso/fdated shore, and Estuarine imertidal aquatic beds" 2 Includes the catcgon"es: Estuan"ne intertidal emergent and Estuan"nc intertidal jorested and scmblshruh II/etlml(is , Ali £Stuan"ne flller/idal categon"es • Includes the categon"es: Palus/n"ne uncol/solidated OOl1om, Palustn"ne ullcoIISolidated shores, Palustn'ne aquatic
bed> } Includes the categories: Palus/n"ne emergem, Palustrine jorested, and Palustrine scrub/shrub wetlands 6 Includes all Palustrine categon'es 7 Includes all Estuarine subtidal, Lacus/rine, and Riveritle dcepwater 8 Includes Marine inrcrtidalwCI/(mds
9

STAT US A ND TRENDS OF WETLANDS ---------Wellands represent approximately 5.0 percent
of 11le land area in the lower 48 States. If wetlands and deepwater acres were combined, about 9.3 percent of the land area in the comerm inous United Stales is made up of these areas.
TRENDS IN WETIAND RESOURCES, MID-1970'S TO MID-1980'S
Estuarine wetlands 'nle acreage of estuarine wetlands declined 1.0
percem between the mid-1970's and the mid-1980's (1able 4). By far the most dramatic impact to
coastal wetlands was the loss of 70.9 thousand acres of estuarine emergem wetlands, primarily in the Gulf Coast Stmes. However, this figure does not e ncompass all of the coastal wetland losses
during the study period because some coastal areas contain extensive palustrine emergent and palustrine forested wetlands. Many of these palustrine wedands were converted to non-palustrine wetlands, open water, upland, or deepwater habitats during the study period. Therefore, the loss of coastal wetlands in states like louisiana cannot be derived solely from losses of estuarine imertidal emergent wetlands.
The fate of these conversions is shown in Figure 6. A net loss of 40.4 thousand acres (57.0 percent) of estuarine emergent marshes resulted from convers ions to open salt water. The overall net loss of estuarine wetlands for t.he study period was estimated 3159.4 thousand acres.
Acres of estuarine shrub wetlands appeared to be stable, with no statistically signifkant change detected between the mid-1970's and mid-1980's. Estuarine unconsolidated shores increased in area
TABLE 4_ Changes in coastal wetland acreage, mid·1970's to mid· 1980's (Acres are in 1,000's). The standard error for each entry, expressed as a percentage of the emry, is given in parenthesis. A standard error greater or equal to an estimate is represented by an asterisk.
Acreage Mid-1980 's Estimaled Estimalell Change Acreage As
Acreage Acreage Mid-1970's Percent of All Weiland C(ltegory Mid-1970's Mid-1980's to Alld-1980's Coasl(l/ Acreage
Marine Intertidal 104.5 104.3 -0.2 1.9 (22.0) (22.0)
Estuarine Emergent 4,144.9 4,074.0 -70.9 73 .1 (4.2) (4.2) (18.2)
Estuarine Porested/Shrub 709.0 709.0 0.0 12.7 (13.5) (13.4)
Estuarine Shore 430.3 448.1 17.8 8.0 (1 2.3) (11.9) (42.7)
Estuarine AquaUc bed 247.9 241.7 -6.2 4.3 (21.8) (22.1) •
Estuarine InterUdai 678.2 689.8 11.6 12.6 Nonvegelated L (11.8) (11.6) (36.2)
Estuarine In tertidal 4,853.9 4,782.9 -71.0 87.4 Vegetated2 (4.2) (4.2) (18.2)
Changes in coastal deepwater acreage mid-1970's to mid-1980's
Estuarine Subtidal 18,852.4 18,882.4 30.0 -(2.5) (2.5) (31.5)
I Includeslhe categories: Esillan·ue inlertidal unconsolidated shore and EslI/arine imerlidal aquatic bed , Includes the calegories: Esllltln·lle imerlidal emergent mul Esfflarine!orested and scrnb/shmb
10

STATUS AND TRENDS OF WETLANDS ---------
FIGURE 6. Fate of converted estuarine emergent (coastal) wetlands, mid-1970's to mid-1980's
D S.11t w.ne:::'-------D Freshwater wellands or ponds o Upland
Qlher coaslal vegetarian IYPCS _ Nonvegelalcd coastal wedand types
by 17.8 thousand acres from (he mid·1970's estimate.
The acreage of estuarine subtidal deepwater increased by 53.2 thousand acres as a result of conversions of what had been estuarine emergem marsh in the mid-1970's. Conversely, only 12.8 thousand acres of what had been estuarine subtidal deepwater became estuarine emergems in the mid-1980's and lOA thousand acres ultimately became other wetland categories. Overall, there was a 30.0 thousand acre increase in estuarine subtidal deepwater.
Changes in marine intertidal wetlands were not statistically significant.
Palustrine wetlands From the mid-1970's to mid-1980's , palustrine
wetlands decreased by nearly 2.5 million acres. Palustrine forested wetlands suffered the biggest loss during the study period. An estimated 3.04 mil· lion acres were converted (Figure 7) , primarily in the southern portion of the country (Figures 8 and 9). Over 2.1 million acres of these wetJands were converted to non-wetland land uses , including about 1.0 million acres that were lost to agricul· ture. Most of the remaining acreage was converted from palustrine forested wetlands to other weliand categories.
11
FIGURE 7. Palustrine wetland gains and losses, mid-1970's to mid-1980's Acres in millions
0 I I
II " " ~ 11 ~ ] 2 Ii' ~ ." ~ ~
·1 ~ Jl ~ ~ " " !l :Q
" ·2 ~ § :0
·3
Ii ·4 ~
{i
FIGURE 8. States with large (> 1 00,000 acres) losses of palustrine forested wetlands
Overall, palustrine e me rgent wetlands in creased by 220.2 thousand acres during the slUdy period (Figure 7). About 375.2 thousand acres of palustrine emergent wetJands were converted lO agricultural la nd uses, 151.2 thousand acres were converted to "olher" land uses, and 37.5 thousand acres were converted to urban land uses. An addi-
STATUS AND TREND S OF WETLANDS ---------
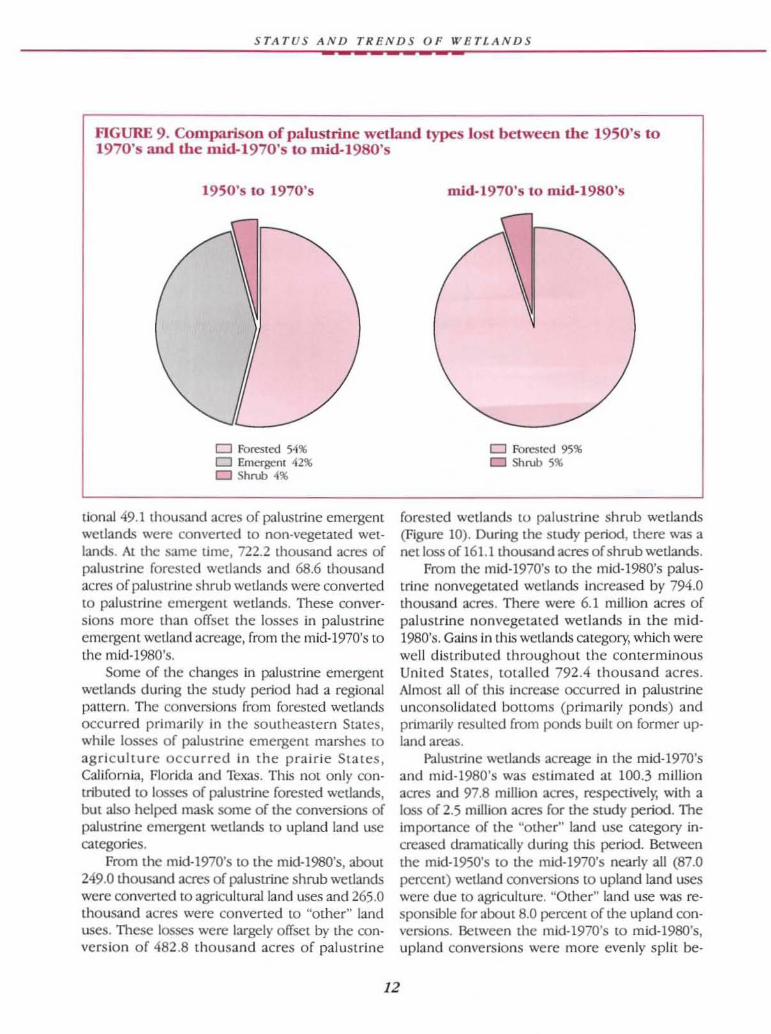
AGURE 9. Comparison of palustrine wetland types lost between the 1950's to 1970's and the mjd·1970's to mid·1980's
1950's to 1970's
o Forested 54~ Cl Emergent 42% o Shrub 4~
lional 49.1 thousand acres of palustrine emergent wetlands werc converted to non-vegetated wetlands. At the same time, 722.2 thousand acres of palustrine forestcd wetlands and 68.6 thousand acres of palustrine shrub wetlands were converted to palustrine emergent wetlands. These conversions marc than offsct the losses in palustrine emergent wCllandacreage, from the mid-1970's to the mid-1980's.
Some of the changes in palustrine emergent wetlands during the study period had a regional pattern. The conversions from forested wetlands occurred primarily in the southeastern States, while losses of palustrine emergent marshes to agriculture occu rred in th e prair ie Sta l es, Cal ifornia, Florida and Texas. This not only contributed to losses of palustrine forested wetlands, but also helped mask some of the conversions of palustrine emergent wetlands to upland land use categories.
From the mid· 1970's to the mid-1980's, aoout 249.0 thousand acres of palustrine shrub wetlands were converted to agricultural land uses and 265.0 thousand acres were converted to "other·' land uses. These losses were largely offset b}' the convers ion of 482 .S thousand acres of palustrine
mid-1970's to mid-1980's
D Forested 9S~ D Shrub 5~
forested wetlands to palustrine shrub wetlands (Figure 10). During the study period, there was a net loss of 161 .1 thousand acres of shrub wet.lands.
From the mid-1970's to the mid-1980's palustrine nonvegetated wetlands increased by 794.0 thousand acres. There were 6. 1 million acres of palustrine nonvegetated wetlands in the mid-1980's. Gains in this wetlands category, which were well d ist ribuled throughout the conterminous United States, lOt ailed 792.4 thousand acres. Almosl all of tll is increase occurred in palustrine unconsolid:1Ied bOlloms (primarily ponds) and primarily resulted from ponds built on former upland areas.
Palustrine wetlands acreage in the mid-1970's and mid-19S0's was es timated at 100.3 mill ion acres and 97.S million acres, respectively, with a loss of 2.5 million acres for the study period. The importance of the "other" land use category increased drnmatically during this pericx1. Between the mid-1950's to the mid-1970's nearl)' all (87.0 percent) wetland conversions to upland land uses were due to agriculture. "Other" land use was responsible for aOOutS.O percem of {he upland conversions. Between the mid-1970's to mid-1980's, upland conversions were more evenly spli t be-
12
STATUS AND TRE NDS OF WETLAND S ---------
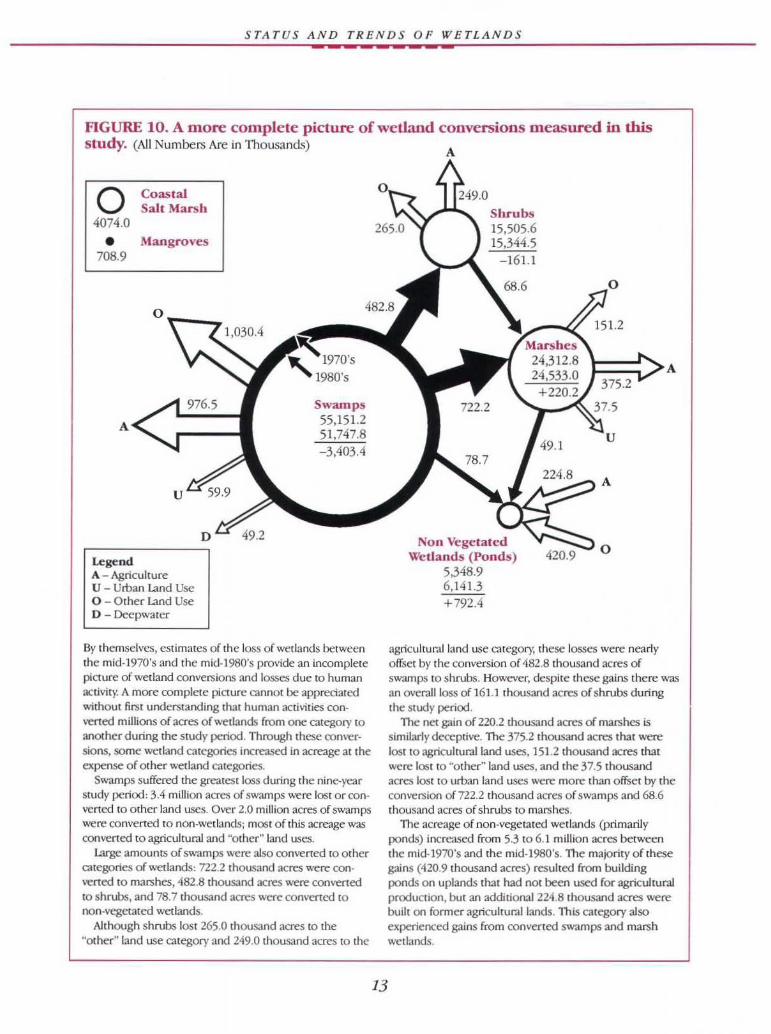
FIGURE 10. A more complete picture of wetland conversions measured in this study. (All Numbers Are in Thousands)
0 Coastal Sail Marsb
4074.0
• Mangroves 708.9
A
Legend A - Agriculture U - Urban Land Use o - Other Utnd Use o - Deepwater
1980's
Swamps 55, 151.2 51.747.8 -3.403.4
By themselves, estimates of Ihe loss of wcllands between the mid· 1970's and the mid· 1980's provide an incomplete piaure of wctland conversions and losses due to human aclivity. A morc complete piaute cannot be appreciated without first understanding thaI human activities con· verted millions of acres of wed.1nds from one category to another during the study period, Through these con\~r· sions, some wetland categories increased in acreage at the expense of other wetland categories.
Swamps suffcred the greatCSt loss during the ninc·rear Study pcrioo: 3.4 million acres of swamps YIlCrc lost or con· \'Cned to other land uses. Over 2.0 million acres of SWMIlPS were converted to non·wetlands; most of this acreage was converted to agricultural and "otherH land uses.
Large amounlS of swamps were also convened to othcr categories of wetlands: 722.2 thousand acres were convened to marshes, 482.8 thousand acres were convened to shrubs, and 78.7 ItlOUS<1nd acres were convened to non·vegctated wetlands.
Although shrubs lost 265.0 thous..1nd acres to the HOIher~ land use category and 249.0 thous..1nd acres to the
13
Shrubs 15.505.6 15.344.5
-161.1
Non Vegetated Wetlands (Ponds)
5.348.9 6, 141.3 +792.4
agricultumlland use category, these losses were ne'J.rly offset by the conversion of 482.8 thous,1nd acres of swamps to shrubs. However, despite these gains there was an O'/craliloss of 161.] thousand acres of shrubs during the study period.
The net gain of 220.2 thousand acres of marshes is similarly deceptive. The 375.2 thousand acres that were lost to agriculruralland uses, 15L2lhousand acres that were lost to Mother" land uses, and the 375 thousand acres lost to urban land uses wcre more than offset by the conversion of 722.2 thousand acres of swamps and 68.6 thousand acres of shrubs to marshes.
The acreage of non.vegetated wet lands (primarily ponds) increased from 5.3 to 6. 1 mlllion acres bet .... -een the mid· ]970's and the mid· 1980's. The majOrity of these gains (420.9 thousand acres) resulted from building ponds Ofl uplands that had nOt been used {Of' agricultural productiOn, but an additiooal224.8 thousand acres were !xlilt on former agricultural lands. This categOl1' also experienced gains from converted swamps and marsh wetlands.

STATUS AND TRENDS OF WETLANDS ---------tween agricultural land use (54.0 percent) and "other" land use (41.0 percent), A substantial portion oflands included in the "other" calegorywere lands that had been drained and cleared of vegetation, but the land had not been put (Q an identifiable use.
Urban land uses were responsible for an estimated 59.9 thousand acre net loss in palustrine forested wetlands, 37.5 (housand ao'es of palustrine emergent wetlands, and 21,0 thousand acres of palustrine shrub wetlands, from the mid-1970's to the mid-1980's.
14
Deepwater Habitats The changes observed in lacus(rine and river
ine deepwater habitat acreage between the mid-1970's and the mid-1980's were relatively small (about 0.4 percent). Most of the gains resulted from increases in the lacustrine system and primarily occurred in the southeastern States of Alabama, Florida, Georgia, Mississippi and South Carolina. Although lhese figures are an indicator of small gains in deepwater habitats, (he reliability of the estimate is not suffident to support definitive comparisons.
STATUS AND TRENDS OF WETLANDS ---------
SUMMARY
The results of this study document a continu ing loss of wetland acreage from the mid-1970's to the mid-1980's. An estimated 1.1 percent of estuarine wetlands and 2.5 percent of inland wetlands
were lost from the lower 48 States during the nine-year study period. An estimated 3.4 million acres of palustrine forested wetlands were
lost between the mid-1970's and the mid-1980's. Although gains in other palustrine categories appear to offset some of the overall losses, many of the gains are simply conversions between welland types. The subsequent report, wh ich is currently in preparation, will more fully analy-lC and d iscuss the relationships between wetland losses and gains and sh ifts between welland cover type categories.
Agriculluralland uses accounted for 54.0 percent of1l1e conversions from welland to upland. "Other" land uses were responsible for41.0 percent of these losses. A significant portion of the lands classified as "other" were lands that had been drained and cleared of vegetation, but the land had nOt been pul to an identifiable lISC. Urban expansion made up the balance of the m nversions.
Trends in the eSlUarine system indicate that estuarine wetlands declined by 1.1 percent over Ihe study period. Most of these losses occurred to estuarine emergent sai t marshes along the Gulf Coast States. Estuarine subtidal deepwater increased substantially at the expense of these coastal salt marsh sYSlems.
15
STATUS AND TRENDS OF WETLANDS ---------
REFERENCES CITED Anderson.J.R.. E.E. HardY,J .T. Rooch, and R.E. Witner. 1976.A lalld use mulland cover classification system/or use witb reo mote sensor data. U.S. Geological SUl"\Iey Professional Paper 964. U.S. Geological Survey, washington, D.C. 28 pp.
R'U"nard, WO., C.K. Ansell,). 1·larn and D. Kevin. 1985. The use and regulation o/wctlmuls in tbe u.s. In: Wetland PfO{cction: Strengthening the role of the States,JA Kusler (ed). Assoc. of State Wetland Managers. pp. 27·39.
Cowardin. LM., V Carter, F.C. Golet. and E. T. laRoe. 1979. Classijicalion oJ wellands and deepwater habitats oJ lhe Un iled States. U.S. Fish and Wildlife Service, washingtOll, D.C. 131 pp.
Dahl, T.E. 1990. W'el/tmds losses ill lbe Uniled Slates 1780's to 1980's. U.s. Department of the Inte rior. Fish and Wildlife Service, Wolshington, D.C. 21 pp.
Dahl. T.E. and H.R. P)M'ell. 1989, National status and trends study: Estimating weiland resources irj the 1980's. In: wetlands: Concerns and Successes. American W.1ter Resources Association Symposium. T.'lmp..1. FL. pp. 25-31 .
Frayer, WE., T.J. Monahan, D.e. Bowden, and FA Graybill. 1983a. Slatus and lrendso/wet/(mdsmld deepwater /:JabitUls in tbeeolllerminous United States, 1950's10 1970's. Colorado State University, Fo rt Collins, CO. 31 pp.
Frayer, WE., TJ. Monahan, D.e. Bowden, and FA Graybill. 1983b. Procedures/or using exislfng statistical wetland dala 10 determine sample sites needed to produce weiland acreage estimates Jar selected geographic areas. Colorado State University, Fort Collins, Co. 8 pp. + Appendix.
Frayer, WE., D.D. Peters and H.R. Pywell. 1989. \f?etlandsoJtbe Califomia Cenlral Valley; Slatus and trends 1939 10 mid-1980's. U.S. Fish and Wildlife Service, Portland. OR. 27 pp.
Hall, J.V 1988. Alaska cooslalwetlands slln~y. U.S. Fish and Wildlife Service and National Oceanic and Atmospheric AdministrntiOil Cooperative Repor!, WashingtOn, D.C. 36 pp.
Hammond. E.H. 1970. Physical subdivisions 0/ the Uniled Stales 0/ America. In: National atlas of the United States of America. U.S. Geological Survey, Wolshington. D.e. Page 61.
Kusler,).A and G. Brooks (eds.) 1987. Prrxeedingsoftbe flaIfonal wellmld symposiul1~' W'etland Hydrology. AssOCiation of State Wetl and Managers. Berne, NY 339 pp.
Inngbein, w.n. and K.T. lseri. 1960. General inlroduclfon and hydrologic definitions manual of hydrology. furl 1. General sur/ace waler leebniques, U.S. Geological Survey, Water Supply Paper 1541-A 29 pp.
Mitsch, W). andJ.G. Gosselink. 1986. l'Vetlands, Van Nostrand Reinhold Co. , l'.'Y. 539 pp.
Reed, P.B. 1988. Narionallisl oJ plant species Ibal occur in wetlands: 1988 NaJional Summary. BioI. Rept. 88 (24). U.S. Fish and Wildlife Service, Washington, D.C. 244 pp.
Shaw, S.P. and e.G . Fredine. 1956. Wetlands o/tbe Uniled States. U.S, Department of the Interior, Fis h and Wildlife Service, Cin:ular 39. Washington. D.e. 67 pp.
The Conservation Foundation. 1988. Proteeling America's Wellmlds.· An action agenda. The final report of [he National Wetlands Policy Forum. Wolshington. D.C. 69 pp.
Tiner, R.WJr. 1984. WellandsoJlhe United States: clln-em stams and recent trends. U.S. Department of the Interior. Fish and Wildlife Service. Wolshington, D.C. 59 pp.
Tiner, R.W. Jr. 1987. Mid·Allalllic Wetlands---A disappean'ng natural treasure. U.s. Fish and Wildlife Service and U.S. Environmenta! Protection Agency cooperative publication. Newton Corner, MA 28 pp.
U.s.DA SoU Conservation Service. 1987. Hydric Soilso/the United States. U.S. Department of Agriculture, washington, D.e.
U.S.DA Soil Conservation Service, Soil Survey Staff. 1975. Soil taxonomy, A basic system 0/ soil classijicoli07l/or making and interpreting soil surveys. Agricultural Handlxx>k 436, U.S. Department of Agriculture, WashingtOn. D.C. 754 pp.
U.S. Fish and Wildlife Service. 19903. Wetlands action plan. w..shington, D.e. 31 pp + Appendices.
U.S. Fish and Wildlife Service. 199(b. cartographiC conventions/or the National Ir'etlands InVer/tory. St. Petersburg, FL. 73 pp.
U.S. Fish and Wildlife Service. 199Oc. Pholo inJerpretatioll am· venliom/or the Nalional \'i'etlands Inventory. 51. Petersburg, FL 45 pp. + Appendices,
U.s, Fish and Wildlife Service. 1991 . Uni(ed 5(a(es Depa.n:ment of the Interior Budget Justificatio ns, F.Y 1992. WJ.Shington, D.e. p.121.
16
STATUS AND TRENDS OF WETLAND S ---------
APPENDIXA GLOSSARY OF CLASSIFICATION TERMINOLOGY (ADAPTED FROM COWARDIN ETAL 1979)
Wetland In general terms, weLiands are lands where sat
uration with water is the dominate factor determining the nature of soil developmem and the types of plant and animal communities living in the soil and in its surface_ The single feature that most weLlands share is soil or substrate that is at least periodically saturated with or covered by water. The wJter creates severe physiological problems for all plants and animals except those that are adapted fo r life in water or in saturated soil.
Wetlands are lands transitional between terrestrial and aqualic systems where the water table is usually at or near the surface or the land is covered by shallow water. For purposes of this classificat io n wetlands must have o ne or more of the following three attributes: (1) at least periodically, the land supports predominantly hydrophytes,* (2) the substrate is predominan tly undrained hydric soil,*'" and (3) the substrate is nonsoil and is satur:lled with water or covered by shallow water at some time during Llle growing season of each year.
The term wetland includes a variety of areas that fall into one of five categOlies: (1) areas with hydrophytes and hydric soils, such as LllOse commonly known as marshes, swamps, and bogs; (2) areas withom hydrophytes but with hydric soilsfo r example, flats where draslic fluctuation in wJter level, wave action, turbidity, or high concentration of salts may prevent the growth ofhydrophytcs; (3) are-JS with hydroph>'tes but nonhydric soils, such as margins of impoundments or excavations \vhere hydropbytes have become established but hydric soils have not yet developed; (4) areas without soils but with hydrophytes such as the seaweed-covered
IXlrtions of rocky shores; and (5) wetlands witholll so il and without hydrophytes, such as gravel beaches or rocky shores without veget.ation.
Drained hydric soils that are now incapable of supporting hydrophytes because of a change in water regime are not considered wetlands by our definition.lllese drained hydric soils furnish a valuable record of histOriC wetlands, as well as an indicalion of areas that may be suitable for restoration.
Marine System TIle Marine System consists of the open ocean
overlying the conlinental shelf and its associated high-energy coastline. Marine habitats are exposed to the waves and currents of the open ocean and the water regimes are determined primarily by the ebb and flow of oceanic lides. Salinilies exceed 30 parts per thousand, with little or no dilution except outside the mouths of estuaries. Shallow coastal indentations or bays without appreciable freshwa· ter inflow, and coasts with exposed rocky islands that provide the mainland with lin"!e or no shelter from wind and waves, are also considered part of the Marine System because they generally support typical marine biota.
Estuarine System The Estuarine System consists of deepwater
tidal habitats and adjacent tidal wetlands that are usually semienclosed by land but have open, partly obstructed, or sporJdic access to the open ocean , and in which ocean water is at least occasionally diluted by freshwater runoff from tile land. The salin· ity may be periodically increased above that of the open ocean by evaporJtion. Along some low-en·
.. 7be us. Fish and \'(fildlife Service bas published the lis! of plants tbaJ occur in wellands of the United States (Reed 1988).
.. ~ US.D.A , Soil Conservation Service bas developed Ibe list of hydric soils/orlbe United States (U.SD.A , Soil Comerva/ion Senliee, 1987).
17

STATUS AND TRENDS OF WETLANDS ---------ergy coastlines there is appreciable dilution of sea water. Offshore areas with typical estuarine planLS and animals, such as red mangroves (Rhizophora mangle) and eastern oysters (Crassostre a virginica), are also included in the Estuarine System.
Marine and Estuarine Subsystems Subtidal: The substrate is continuously sub
merged by marine or estuarine waters. Intertidal: The substrate is exposed and
flooded by tides. Imertidal includes the splash zone of coastal waters.
Palustrine System 111e P-J1ustrine System includes all nontidal wet
lands dominated by trees, shrubs, persistent emergents, emergem mosses or lichens, and all such wetlands that occur in tidal areas where salinity due to ocean derived salts is below 0.5 pans per thousand. It also includes wetlands lacking such vegetation, but with all of the (ollowing four characteristics: (1) area less than 8 ha (20 acres); (2) active wave formed or bedrock shoreline features lacking; (3) water depth in the deepest part of basin less than 2 meters at low water; and (4) salinity due to ocean derived salts less than 0.5 parts per thousand.
Classes Unconsolidated Boltom: Unconsol idated
[30l1om includes all wetlands with at least 25 percent cover of particles smaller than stones, and a vegetative cover less than 30 percent. Examples of unconsolidmcd substrates are: sand, mud, organic material , cobble-gravel.
Aqualic Bed: Aquatic Beds are dominated by plants that grow principally on or below the surface of the water for most of the growing season in most years. Examples include: seagrass beds,· pondweeds (Polamogelon spp.) wild celery (Vallisneria ame1'icalla) waterweed (Elodea spp.), and duckweed (Lenma spp.)
Rocky Sho1'e: Rocky Shore includes wetland environments characterized by bedrock, stones, or boulders which singly or in combination have an areal cover of75 percent or more and an areal vegetative coverage of less than 30 percent .
Unconsolidated Shore: Unconsolidated Shore includes all wetland habitats having two characteristics: (1) unconsolidated substrates with less than 75 percent areal cover of stones, boulders or bedrock ancl; (2) less than 30 percent areal cover of vegetation other than pioneering plants.
Emergent Wetland Emergent Wetlands are characterized by erect,
rooted, herbaceous hydrophytes, excluding mosses and lichens. This vegetation is present for most of the growing season in most years. These wetlands are usually dominated by perennial plants.
Shrub Wetland Shrub Wetlands include areas dominated by
woody vegetation less than 6 meters (20 feet) tall. The species include true shrubs, young trees, and trees or shrubs 1113t are small or stunted because of environmental conditions.
Forested Wetland Forested Wetlands are characterized by woody
vegetation that is 6 meters tall or taller.
Deepwater Habitats Deepwater Habitats are permanently flooded
land lying below the deepwater of wetlands. Deepwater habitats include environments where surface water is permanent and often deep, so that water, rather than air, is the principal medium within wh ich the dominant organisms live, whether or not they are attached 1O 111e substrate. As in wetlands, the dominant plants arc hydrophytes; however, the substrates are considered nonsoi! because the water is tOO deep to support emergent vegewtion (V.S.DA Soil Conversation Service, Soil Survey Staff 1975).
Riverine System The Riverine System includes deepwater habi
tats contained wi111in a channel, with the exceptions habitats with water containing ocean derived SalLS in excess ofO.s parts pCI' thousand. A cl1annel is "an open conduit e ither naturally or artifiCially
.. Altbough some seagrass beds may be evident on aerial pholography, water and climatiC condilfons often preveTlf their detection The data presen/ed in tbls report should not be Interpreted as a reliable indicator of the e.xtent of seagrass acreage in coastal wafers.
18

STA T US AND TRENDS OF WETLANDS ---------created whicl1 periodically or continuously contains moving water, or which forms a connecting link between two bodies of standing waler" (Langbein and Iseri 1960).
Lacustrine System The Lacustrine System includes deepwater
habitats with all of the following characteristics: (1) situated in a topographic depression or a dammed river channel; (2) lacking trees, shrubs, persistent emergents, emergent mosses or lichens with greater than 30 percent coverage; (3) total area exceeds 8 ha (20 acres). Similar wctland and deepwater habitats totaling less than 8 ha are also included in thc Lacustrine System if an active , wave-formed or bedrock shoreline feature makes up all or part of the boundary, or if the water depth in the deepest part of the basin exceeds 2 m (6.6 feet) at low water.
Agriculture · Agricultural Land may be defined broadly as
land used primarily for production of food and fiber. Agricultural activity is evidenced by distinctive geometric field and road patterns on the landscape and the traces produced by livestock or mechanized equipment. Examples of agricultural land use include: cropland and paslllre; orcl1ards, groves , vineyards, nurseries, and ornamental horlicultural areas; confined feeding oper<ltionsj and other agricultural land.
Urban Urban or Built-up Land is comprised of areas of
intensive use with much of the land covered by structures. Included in this category are Cities, towns, villages, strip developments along highways, transportation, power, and communications facililies, and areas such as those occupied by mills, shopping centers, industrial and commercial complexes.
Other Land Use Other Land Use is composed of uplands not fit
ting into the first two upland categories. It includes Anderson 's Level I classes of forest land, range
• Adapted/rom Anderson, et al. 1976.
19
land, and barren land. Typically these lands would include range land or nalive prairie; upland forests and scrub lands; strip mines and qlJarries; and barrcn land.
In addition to the preceding defi nitions, several of the individual wetland categories were grouped in lhis document for discussion pur
poses. 111ese terms, whicl1 appear in some or tllC
tables and figures in this document, are defmed as follows;
\Vetlcmds and deepwtuer habitats include all marine, estuarine, palustrine, riverine, and lacustrine classifications.
Wetlands include estuarine, marine and palustrine wetlands.
Deepwater habitats include estuarine subtidal, riverine, and lacustrine habitats.
Estumine wetlands include all estuarine intertidal categories.
Estuarine nonvegetated wetlands include estuarine intertidal unconsolidated shore and aquatic beds.
Estuarine vegetated wetlands include estuarine intertidal emergent, forested, and scrub/shrub habitats.
f'aIUsI1-ine wel/ands include all palusu·ine categories.
Itllusn"ine nonvegetaled wetlands include unconsolidatcd bouom, shores, aqualic beds.
ItllusMne vegetated wetlands incl ude palustrine emergent, forested, and scrub/shrub wetlands.

STATUS AND TRENDS OF WETLAND S ---------
APPENDIX B
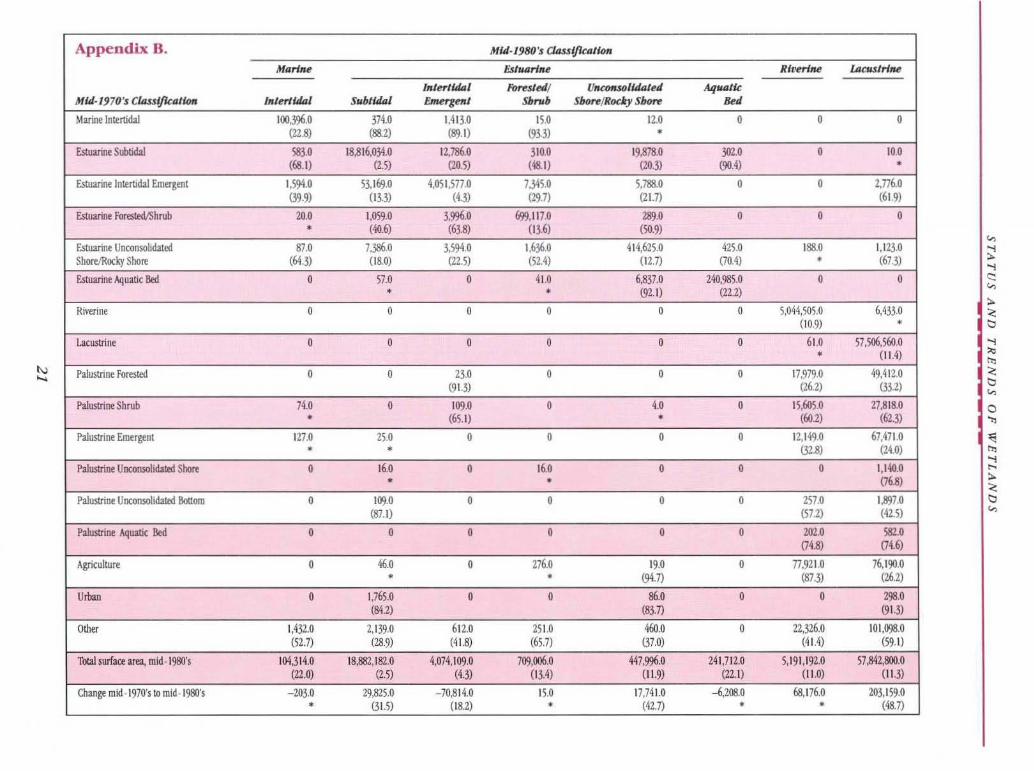
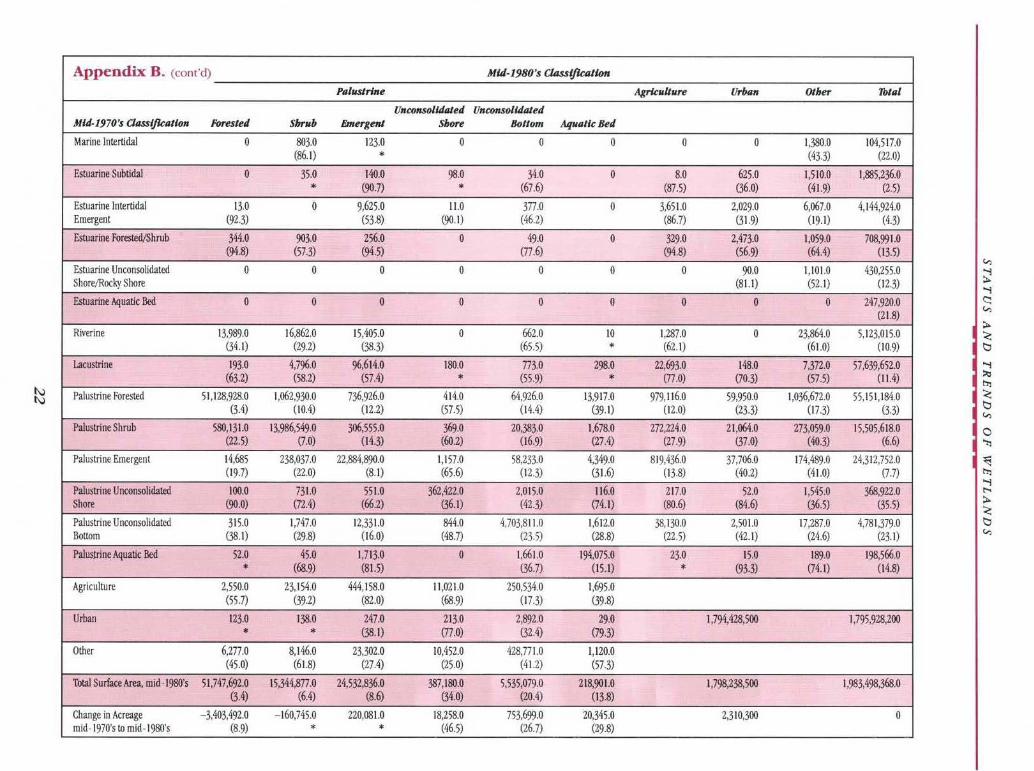
A Ppendix B presenlS acreage, in thousands of acres, and the estimated number of acres that changed their wet land classification berween the mid· 1970's and the mid-1980's. Column 1 (far left
s ide) identifi es the mid· 1970's claSS ifi cat ion while the remaining columns identify the mid-1980's classification. AcrC""Jge totals for the mid-1970's are in Column 18 (the last column) while acreage totals for the mid-1980's are in the row labeled Total Surfacce Area, mid-1980's (it is the second to the last row). The numbers found in parentheses below the acreage estimates are the standard errors of the estimated acreage expressed as a percentage; asterisks indicate a percent standard error greater than 95 percent.
In the example below, 100,396.0 acres that had been classified as Marine intertidal wetlands in the mid-1970's had the same classification in the mid-1980's. An estimated 583.0 acres that had been classified as Estuarine subtidal wellands in the mid-1970's werc claSSified as Marine intertidal wetlands in the mid-1980's. An estimatcd 1,594.0 acres that had been classified as Estuarine intertidal emergent wetlands in the mid-1970's were classified as Marine intertidal wetlands in the mid-1980's. The percent standard errors for these estimates were, respectively, 22.8, 68.1, and 39.9.
Marine
Mid·1970 's Classificatioll I"te,.t/,Ial
Marine Intertidal 100,396.0 (22.8)
Estuarine Subtidal 583.0 (68.1)
Estuarine Intertidal Emergent 1,594.0 (39.9)
20
'" ....
Appendix B.
MUi, ' 970'J Classljkllllotf.
MJrine Inttrtidal
Ewarint Smtidal
F.stuannf: Intertidal Emergent
Eslllarint Fore:sIedI3hrub
Est1winf: UnconsoHda!ed ShortIRocl>.)' Shore
Estuarinl: Aquatic Bcd
Riverine
LacuMrine
PaluSIIIne Forested
Palustrine Shrub
Palustrine Emergent
Palustrine Unconsolidartd Shore
Palustrine UlIC011SOIidated Bouom
Palustrine AoqIW!c Bed
Agriculture
u""" 00_
~ surface area. mid-1980's
Change mid-1970's 10 mid · 1900's
MlIrl,.~
Intertidal
100,396.0 (22))
583.0 (60.1)
1,59'to 09.9)
20.0 •
87.0 (64.3)
0
0
0
0
74.0 •
127.0 • 0
0
0
0
0
1,432.0 (521)
IMJ 14.0 (22.0)
20} 0 •
/If/t!f"11da1
Subtidal Emet'fnll
374.0 lAtH (88.2) (89.1)
18,816,0}4.0 12,786.0 a5) (205)
S}, I/i9.0 4.051,SnO (133) (4.3)
1,059·0 3.996.0 (".~ (63)!
7.386.0 3.594.0 (18.0) (22.5)
57.0 0 • 0 0
0 0
0 23.0 (91.3)
0 109.0 (65. 1)
25.0 0 •
," 0 •
ID;I.O 0 (87.1)
0 0
46.0 0 •
1,765.0 0 (84.2)
2, 139·0 612.0 (289) (4 1.8)
18,882,182.0 4,074, 109.0 (2.5) ('-3)
29,825.0 70,814.0 GI.s) (18.2)
MW-1980'$ CllwIjkGllDII
E.siN4ri11e
~Jledl UJIaWISOlldotell AiI,",lk Sh",b Shore/Rod] SlHwe .. d
15.0 12.0 0 ~B) • 310.0 19,878.0 J<l!.0
(48. ' ) (203) (90.4)
7.345.0 5,788.0 0 (29.7) (21.1)
699,117.0 289·0 0 (l3~ (10.9)
\,636.0 414,625.0 425.0 (52.4) 02.n (70.4)
41.0 6,837.0 240,98S.0 • (92.1) (Ull
0 0 0
0 0 0
0 0 0
0 to 0 •
0 0 0
16.0 0 0 • 0 0 0
0 0 0
z76.G 19.0 0 • (94.7)
0 86.0 0 (837)
25 1.0 460.0 0 (65.7) <37.0)
709,006.0 40\7.996.0 241 ,7 12.0 (1 3.4) (1 1.9) (22.1)
1S.0 17,74 1.0 -fi,208.0 • (42.7) •
RI.,.,.,..
0
0
0
0
188,0 • 0
5,044,505.0 (10.9)
61.0 •
17.979·0 (26.2)
15,605.0 (60.2)
12,149·0 (32))
0
257.0 (571)
202.0 aU)
77,921.0 (873)
0
22,326.0 (4 1.4)
5,191,192.0 (1 1.0)
68, 176.0 •
i.lu:WJriM
0
10.0 •
2,176.0 (61.9)
0
l.I23.0 (67.3)
0
6.433.0 •
57,506,560.0 (11.4)
<\9,4 12.0 03.2)
27,818.0 (623)
67,471.0 (24.0)
1,140.0 (76.8)
1,897.0 (425)
582.0 a .. ~
76,190.0 (26.2)
298.0 ~' .3)
101.098·G (59. 1)
57.842,800.0 (11.3)
203, 159.0 (48.7)
i
'" ~ .., " '" ~ '" " .., '" '" '" " '" C ."
<i '" .., ~
~
'" " '"
Appendix B. (cont'd)
I'IIJlUlriM
MU· /j70's Cl4ssijlcfltlon Foresled ''"'" Em",,,,,
Mari!l~ Intertidal 0 ~J3.0 123.1) (861) •
Estuarine Subtidal 0 35.0 140.0 • (9O.n
Estuarine Intertidal 13.0 0 9,625.0 Emergent (92.) (,3.8)
F.stliarine Foreste<llSbrub 344.0 903.0 256.0 (90]) (57.3) (90.5)
Estuarine Unconsolidated 0 0 0 Shore/Roclrj Shore
Estuarine Aquatic Bed 0 0 0
Riverine 13.989.0 16,862.0 15,405.0 (34. 1) (292) (38.3)
Lacustrine 193.0 4,796.0 96,614.0 (63.2) (58.2) (57.4)
~ PalusUine Forested 51,128.928,1) 1.062.930.0 736.926.1) GA) (lOA) (12.2)
PalUSlfineShrub SBO,131.0 13,986,S49.0 306,555.0 (22.5) 0.0) (10)
Palustrine Emergent 14,685 238,037.0 22.884.890·0 (19.7) (22.0) (S.I)
Palustrine Unconwlidated 100.0 73 1.0 55 1.0 Shore (90.0) (72.4) (661)
Palustrine Unconsolidated 315.0 1,747.0 12331.0 _m (38. 1) (29.8) (16.0)
Palustri ne Aquatic Bed 52,0 45.0 1,713.0 • (68.9) (81.5)
Agriculture 2,550,0 23, 154.0 444, 158.0 (55.7) (92) ("'.0)
"row 123.0 138.0 247.0 • • (38.1)
Other 6,2n.0 8, 146.0 23,302.0 (45.0) (61.8) (27 A)
1blaJ Surfau Area, mid· 1980's 51,747.692.0 IS,344.sn.0 24,S32,836.0 G.4) (6.4) (' ~
Change in Acreage 3.4<13,492.0 160,745.0 220,081.0 mid·1970·s to mid-198O's ('.9) • •
MUI-I980'$ CkmljluUknI
Arrk~II"n
U"ctm.folldaltd lltu:tmSoIldllltd ,_ Bot/om Nfutlltc Bed
0 0 0 0
98·0 \40 0 8.0 • (67 .~ (87.5)
I i.() 377.0 0 3,65 1.0 (90 1) (46.2) (86.7)
0 49.0 0 329.0 In.~ (90))
0 0 0 0
0 0 0 0
0 662, 10 1.287.0 (65.5) • (62.1)
180.0 m.O 2911.0 22,693.0 • (559) • In.O)
414.0 64,926.0 13,917.0 979,116.0 (57.5) (14.4) 09.0 (12.0)
3690 20,383.0 1,678.0 272,224.0 (60.2) (16.9) (21.4) (27.9)
1,157.0 58,233.0 4.349.0 SI9,436.0 (65~ (12.3) (J1.~ (]3.S)
362,422.0 2,015.0 116.0 217.0 (36. 1) (42.3) (74. 1) ("'~ 844.0 4,703,SI1.0 1,612.0 38,130.0 (4S.7) (23.5) (28.') (22.5)
0 1,661.0 194,075.0 23.0 (36.7) (IS.!) •
11,021.0 250,534.0 1,6I}S.0 (689) (17.3) 09])
213.0 2,892.0 29.0 In.O) (32A) 09.3)
10,452.0 428,m.0 1,120.0 (25.0) (4 1.2) (57.3)
387,180.0 5535,0]9.0 218,901.0 134.0) (20.4) (1 3.8)
18,258,0 753,699.0 20,3'i5.0 (46.5) (26.7) (29.')
OriM.
0
625.0 (36.0)
2,029.0 0 1.9)
2,0\73.1) (56.9)
90.0 (81.1)
0
0
148.0 0 0.3)
59,950.0 (23.3)
21,064.0 (37.0)
37,706.0 (40.2)
52.0 (84~
2.501.0 (42.1)
15.0 ~3.3)
1,]94,428,500
1,798,238,500
2,310,300
0"" ",,'
1,380.0 104,517.0 (H.) (22.0)
1,5 10.0 1,885,236.0 (~1.9) (2.5)
6,067.0 4, 1 4~,924.0 09.1) (4.3)
I,OS9.0 708,9')1.0 (64~ OJS)
1,101.0 430,255.0 (511) (12 .3)
0 247,920.0 (21.8)
23.860\.0 5.123,0 15.0 (61.0) (10.9)
7,3n.o 57,639,652.0 (57.5) (1 1.4)
1,036,6n.o 55,151,184.0 (l7.3) 13.3)
273,059.0 15,505,618.0 ("3) (6.6)
174A89.0 24.312,752.0 (4 1.0) O.J)
1.545.0 368,922.0 (36.5) 05.5)
17,287.0 4,781,379·0 (24.6) (23. J)
189·0 II}8,566.0 0(1) (14.8)
1,19S,928.200
1.983.'i98,368.0
0
----- _ ._ -
~
~ .., " ~ ~
" " .., " '" " " ~ Q ."
" '" .., ~
~
" " ~

CORRECTION TO THE MID-1970'S WETlAND ACREAGE
In 1982, analysis of the first status and trends data indicated that there were 99.0 million acres of wetlands remaining in the contermj
nous United StaleS as of the mid·1970's.111cse reo suIts were reponed by Frayer Cl aI. (1983) and by Tiner (1984). 111is estimate, which was based on the results of photo interpretation of mid-1970's aerial phOtography, was inaccurate because of limitations in the imagery that was used.
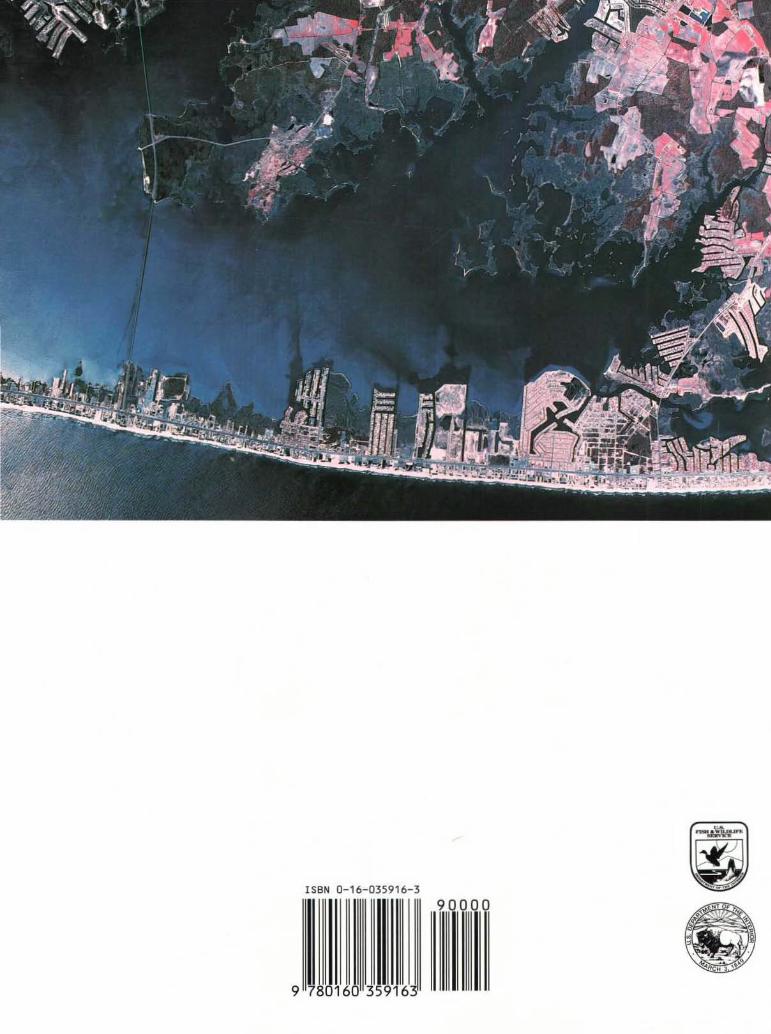
At the lime of that initial study, an effol1 was made to identify wetland habitats using the best 1976 aerial photography available. Much of the imagery available for the earlier status and trends study was black and white photography, which oflcn does not adequately show some categories of forested wetlands (see aerial photographs). Since forested wetlands make-up a large percentage of the national tolal (SO percent in the mid-1970's), the earlier study underestimated the amount of wetlands remaining in the mid-1970's.
111is problem has been corrected in this updated report by using superior quality (Le., superior quality and color infrared) 1980's imagery to determine an accurate wetland acreage total for the mid-1970's. In the cases where wetlands were identified on the mid-1980's photographs but nOl on the mid-1970's phOlographs and where there was no obvious land use change, the mid-1970's 1981 wetland acreage was adjusted to reflect the omis-sion. As a result of Lhis re-analysis, the new wet-lands estimate for Lhe mid-1970's is 105.9 million acres of wedands. This correction factor docs not invalidate dle estimated losses for Lhe mid-1950's to mid-1970's. In fact, it is likely that the losses were even greater than previously estimated be-cause of wetlands that may have been undetected.
ISBN 0-16-035916-3 (I •' ",
- , " '
9