Embed Size (px)
Citation preview
Status, Growth, and Perceptions of School Quality
States and districts are increasingly incorporating measures of achievement growth into their school accountability systems, but there is little research on how these changes affect the public’s perceptions of school quality. We conduct a nationally representative online survey experiment to identify the effects of providing participants with information about their local school districts’ average achievement status and/or average achievement growth. In the control group, participants who live in higher status districts tend to grade their local schools more favorably. The provision of status information does not fundamentally alter this relationship. The provision of growth information, however, reshapes Americans’ views about educational performance. Once informed, participants’ evaluations of their local public schools better reflect the variation in district growth.
Suggested citation: Houston, David M., Michael B. Henderson, Paul E. Peterson, and Martin R. West. (2020). Status, Growth, and Perceptions of School Quality. (EdWorkingPaper: 20-238). Retrieved from Annenberg Institute at Brown University: https://doi.org/10.26300/v94e-5p22
VERSION: June 2020
EdWorkingPaper No. 20-238
David M. HoustonGeorge Mason University
Michael B. HendersonLouisiana State University
Paul E. PetersonHarvard University
Martin R. WestHarvard University
Status, Growth, and Perceptions of School Quality
David M. Houston, George Mason University Michael B. Henderson, Louisiana State University
Paul E. Peterson, Harvard University Martin R. West, Harvard University
Abstract
States and districts are increasingly incorporating measures of achievement growth into their school accountability systems, but there is little research on how these changes affect the public’s perceptions of school quality. We conduct a nationally representative online survey experiment to identify the effects of providing participants with information about their local school districts’ average achievement status and/or average achievement growth. In the control group, participants who live in higher status districts tend to grade their local schools more favorably. The provision of status information does not fundamentally alter this relationship. The provision of growth information, however, reshapes Americans’ views about educational performance. Once informed, participants’ evaluations of their local public schools better reflect the variation in district growth.
Pre-Registration
This experiment has been pre-registered on the American Economic Association’s registry for randomized controlled trials: https://www.socialscienceregistry.org/trials/4252.
1
Prior to the passage of the Every Student Succeeds Act (ESSA) in 2015, states’ public K-
12 school accountability systems focused almost exclusively on measures of student
achievement status (i.e., the level of students’ academic performance at a single point in time).
ESSA’s predecessor, the No Child Left Behind Act of 2002, required states to conduct annual
assessments in math and reading in grades 3-8 and once in high school. The results of these
assessments factored heavily in schools’ accountability ratings, shaping states’ efforts to improve
educational outcomes as well as public perceptions of school quality. Critics argued that
achievement status was a misleading indicator of school quality (Chingos & West, 2015;
Rothstein, Jacobsen, & Wilder, 2008). Schools that served a larger proportion of disadvantaged
students tended to perform poorly in terms of achievement status because of their students’ lower
initial achievement and additional out-of-school obstacles. Conversely, schools that served a
larger proportion of more privileged students tended to perform well by this standard, regardless
of the schools’ actual contributions to student learning.
ESSA now requires states to use multiple measures to evaluate students and schools
(Barone, 2017). The most significant change has been the widespread inclusion of student
achievement growth (i.e., the rate of improvement in students’ academic performance over time),
which many education policy researchers consider a better—albeit still imperfect—indicator of
school quality than achievement status (Stiefel, Schwartz, & Rotenberg, 2011). Forty-eight states
and the District of Columbia now include or plan to include growth in their school accountability
systems (Data Quality Campaign, 2019). There is considerable variation among states with
respect to how they measure growth and how much emphasis they place on it. Among states that
include growth in their accountability systems, the relative weight varies from 20 to 60 percent
(Achieve, 2019).
2
The 2017 Senate confirmation hearing of US Secretary of Education Betsy DeVos
brought national attention to the debate over these different measures of educational
performance. During the hearing, Senator Al Franken asked, “I would like your views on the
relative advantage of assessments and using them to measure proficiency and growth”
(proficiency, or the proportion of students whose scores exceed a pre-determined threshold, is a
common way to measure achievement status) (Wong, 2017). DeVos’ initial response, which
appeared to conflate the two concepts, became the subject of articles in both mainstream
publications like The Atlantic, Time, and Vox as well as education-centric outlets like Chalkbeat,
EducationNext, EdWeek, and The 74 Million. Although this episode was the source of
controversy in education circles, it is not clear whether the American public has a strong sense of
the distinction between status and growth. There is a growing empirical literature on how the
collection and dissemination of academic performance information—specifically about
achievement status—affects the public’s attitudes towards the public schools (e.g., Barrows,
Henderson, Peterson, & West, 2016; Chingos, Henderson, & West, 2012; Clinton & Grissom,
2015; Jacobsen, Snyder, & Saultz, 2014). However, there is relatively little research on how the
public responds to information about growth.
The answer to this question has important implications for our understanding of the
social, economic, and political consequences of the recent changes in states’ school
accountability systems. We conducted an experiment embedded in a nationally representative
online survey of attitudes on education issues. We first asked participants to estimate their local
school districts’ performance in terms of both status and growth. Unsurprisingly, we find that
Americans are more familiar with status (which states have used for many years to evaluate
schools) than growth (which states have only recently begun to incorporate into their school
3
accountability systems). Next, we randomly assigned participants to receive one or more
elements of academic performance information about their local school district: either the
district’s national percentile in terms of status, the district’s national percentile in terms of
growth, both, or neither (to serve as a control group). We then asked participants to evaluate the
quality of their local public schools. This research design allows us to identify the effects of
providing status and/or growth information on participants’ perceptions of local school quality.
Regardless of their experimental condition, individuals living in higher status districts
tend to grade their local schools more favorably. On average, we observe a small negative effect
of giving participants information about local achievement status. However, the slope of the
relationship between district status and perceptions of school quality is unaffected by the
provision of status information. In other words, Americans already have a rough comprehension
of average achievement status in their community. Confronting this information directly may
have a minor depressing effect, but it does not fundamentally change the public’s understanding
of the distribution of school quality.
By contrast, the provision of information about local achievement growth reshapes the
public’s perceptions of school quality. Among participants who receive only information about
growth, the relationship between district status and perceptions of school quality becomes
weaker, while the analogous relationship between district growth and perceptions of school
quality becomes stronger. When we provide both types of academic performance information,
the relationship between district status and perceptions of school quality is generally unaffected,
while the relationship between district growth and perceptions of school quality is enhanced. In
short, providing information about growth reorients the public’s perceptions of school quality to
be more in line with a measure that many scholars consider a more accurate indicator of schools’
4
contributions to student learning. Because district growth bears a weaker relationship to the
economic composition of the student body than district status, the provision of growth
information also reorients the public’s perceptions of school quality to be less tightly aligned
with student demographics.
Our results also suggest that the collection and dissemination of status and growth
information may affect more than just perceptions of school quality. It may also influence the
public’s attitudes about the importance of academic performance itself. Among those in lower
growth districts, the provision of academic performance information of any kind—status,
growth, or both—causes participants to indicate that they think schools should focus a little less
on academics relative to other educational objectives. The reverse is true in higher growth
districts. With respect to growth information, it may be the case that many participants in lower
growth districts do not appreciate or accept this new negative depiction of their local schools,
and they respond by deemphasizing the importance of academics. Similarly, many participants in
higher growth districts may be surprised to receive such a positive portrayal, and they respond
with additional enthusiasm for academics. It could also be the case that many participants living
in lower growth districts are more skeptical of the measures of academic performance featured in
our experiment than their peers in higher growth districts. Their response to the academic
performance information may reflect this wariness.
To summarize, the public’s current perceptions of school quality are largely consistent
with the predominant indicator of academic performance over the last few decades: average
achievement status as measured by state standardized tests. The provision of district-level
information about average growth can shift the public’s perceptions of school quality to be more
in line with schools’ contributions to student learning. However, portions of the public may be
5
disinclined to embrace growth as a valuable metric. Especially among those living in lower
growth districts, the provision of this information may reduce support for schools’ academic
objectives and/or this particular method of measuring success towards those objectives.
The Effects of Public Service Performance Information
In the last decade, there has been a surge of empirical research on the attitudinal effects
of public service performance information in policy domains such as healthcare, policing, mail
delivery, recycling/waste removal, and education (e.g., Baekgaard & Serritzlew, 2015; James,
2011; Marvel, 2016; Walker & Archibold, 2014). Three major findings are particularly relevant
to our inquiry. First, recipients of public service performance information display a significant
negativity bias. The public’s satisfaction with local services declines with the provision of
information about low performance, but the public is generally unmoved by the provision of
information about high performance (James & Moseley, 2014). Second, information from an
independent source (rather than the service provider itself) and information about performance
relative to similar institutions (rather than an absolute level of performance) appear to be
particularly influential (Barrow, Henderson, Peterson, & West, 2016; James & Moseley, 2014;
James & Van Ryzin, 2017). Finally, individuals’ prior beliefs about the quality of local public
services shape their interpretation of the information they receive. When new information is
inconsistent with these prior beliefs, recipients are more likely to misinterpret or discard it
(Baekgaard & Serritzlew, 2015).
A handful of studies focus explicitly on information regarding the effectiveness of public
schools. Many Americans already possess a nontrivial understanding of achievement status in
their communities. Chingos, Henderson, and West (2012) asked a nationally representative
sample of US adults to evaluate the quality of their local public schools. They find that these
6
ratings are positively related to the percentage of students who scored above proficient on the
state standardized test. This relationship is two to three times stronger among parents of school-
age children, who might be expected to be more familiar with local schools. The provision of
new information about achievement status can also shift attitudes towards the local public
schools. Researchers have examined the effects of status information on perceptions of school
quality in the context of online surveys (Barrows, Henderson, Peterson, & West, 2016; Clinton &
Grissom, 2015; Jacobsen, Snyder, & Saultz, 2014), official school letter grades released by the
state (Chingos, Henderson, & West, 2012), and shifts in performance outcomes following the
introduction of new state tests (Jacobsen, Saultz, & Snyder, 2013). In most cases, when
individuals encounter new information about achievement status, they tend to revise their
appraisals of local education institutions downwards.
While there is substantial evidence regarding the effects of status information on
perceptions of school quality, we are unaware of research that explicitly investigates the
analogous effects of growth information. Three studies examine closely related issues. When
exploring the relationship between perceptions of school quality and achievement status,
Chingos, Henderson, and West (2012) also establish that individuals’ ratings of local schools are
weakly related to differences in growth. However, this relationship is largely explained by the
fact that school-level average status and school-level average growth are moderately correlated;
after controlling for achievement status, the relationship between growth and ratings is not
statistically significant. In the second study, Schneider, Jacobsen, White, and Gehlbach (2018)
reveal that individuals who are given access to more extensive measures of school quality than
those typically offered by states—including a measure of academic performance that places
greater emphasis on growth—tend to express greater confidence in their local schools. Lastly, in
7
the context of an online survey experiment, Houston and Henig (2019) demonstrate that
individuals who receive information about achievement growth tend to prefer higher growth
school districts from a set of available options when asked to choose a district for their child. In
sum, the available evidence suggests that Americans possess little prior knowledge about school
performance in terms of growth, and the provision of this information may have considerable
influence on their attitudes towards those educational institutions.
A related literature documents the effects of academic performance information on the
local housing market. Multiple researchers have demonstrated that housing values reflect
differences in student achievement status in nearby schools (Bayer, Ferreira, & McMillan, 2007;
Black, 1999; Kane, Riegg, & Staiger, 2006). The release of new information about achievement
status also appears to influence housing prices (Figlio & Lucas, 2014; Fiva & Kirkebøen, 2011).
On the other hand, the release of Los Angeles Unified School District teacher and school value-
added data (a type of growth metric) in the Los Angeles Times did not systematically affect the
prices of homes in the following year (Imberman & Lovenheim, 2016). However, this situation
may have been atypical given the controversial nature of the data release.
A consistent challenge with respect to measuring educational performance is the
multiplicity of objectives that schools are expected to pursue (Jacobsen, 2009; Ladd & Loeb,
2013; Rothstein, Jacobsen, & Wilder, 2008). Previous work by Jacobsen, Snyder, and Saultz
(2015) indicates that individuals with different normative expectations for schools—either a
heavy emphasis on academics or a more equal balance between academics and other educational
objectives—react differently to academic performance information. Those who place greater
emphasis on academics tend to respond more negatively to indications of lackluster academic
performance. By contrast, those who prefer more balance appear to be less critical of schools that
8
underperform academically if they are strong in other departments. We are unaware of research
that examines the converse relationship: how the provision of performance information can
influence attitudes about the optimal balance between various educational objectives.
When studying the effects of public service performance information, it is important to
consider whether the results we observe are due to participants learning something new or if they
are merely the consequences of priming. Priming refers to the process through which individuals
become temporarily attuned to different considerations when answering questions, making
decisions, or performing actions (Sherman, Mackie, & Driscoll, 1990). Priming occurs when a
stimulus (like a survey question) briefly increases the salience of one consideration (such as the
importance of academic performance when evaluating school quality) at the expense of other
relevant considerations (such as the importance of students’ social and emotional well-being).
The effects of priming disappear quickly as the newly salient consideration wanes in
prominence. To differentiate between learning and priming, previous studies examined whether
the effects of information were larger for individuals who under-estimated or over-estimated the
value in question—a pattern that would be more consistent with learning than with priming
(Clinton & Grissom, 2015; Schueler & West, 2016). We employ the same approach in our
analysis. We also test the priming hypothesis directly by identifying the effects of academic
performance information on the importance of academics relative to other educational objectives.
Methods
Pre-Registration
This experiment has been pre-registered on the American Economic Association’s
registry for randomized controlled trials. The research questions and the accompanying analyses
presented here are consistent with the pre-analysis plan posted on the registry.
9
Research Questions
We divide our research questions into two categories: primary and secondary. As the
number of statistical tests necessary to answer these questions increases, so does the likelihood
of false positives. The reader should place more confidence in the results of the analyses
associated with the primary research questions. The results of the analyses associated with the
secondary research questions should be viewed as exploratory.
Primary Research Questions
1. To what extent are individuals able to estimate average achievement status and average
achievement growth in their school districts?
2. Does the provision of status and/or growth information affect the grades that participants
assign to their local public schools?
3. Does the provision of this information affect the importance of academic performance
relative to other educational objectives?
4. Do these effects vary by the academic performance of participants' districts?
Secondary Research Questions
5. Do these effects vary by the racial/ethnic and economic compositions of participants'
districts?
6. Could these effects be the result of participants updating their prior beliefs about
academic performance in their districts?
Data
We embedded an experiment in the 2019 EducationNext Poll, an annual survey of
Americans’ attitudes towards education issues. The survey was conducted from May 14 to May
25, 2019, by the polling firm Ipsos Public Affairs via its KnowledgePanel®. In the

10
KnowledgePanel®, Ipsos Public Affairs maintains a nationally representative panel of more than
50,000 adults (obtained via address-based sampling techniques) who agree to participate in a
limited number of online surveys, providing non-internet households with internet access and a
device with which to participate. Ipsos then samples from this panel to obtain participants for
particular surveys, such as the EducationNext Poll. This survey features a sample of 3,046
respondents, including a nationally representative, stratified sample of adults (age 18 and older)
in the United States as well as representative oversamples of the following subgroups: teachers
(667), African-Americans (597), and Hispanics (648). Survey weights are employed to account
for non-response and the oversampling of specific groups. Respondents could elect to complete
the survey in English or Spanish.
Ipsos Public Affairs provided us with extensive demographic information for each
participant: race/ethnicity, teacher status, parent status, Spanish language status, political party
identification, political ideology, household income, US Census region, age, educational
attainment, gender, head of household status, housing type, marital status, and employment
status. Based on participants’ locations, we link them to their local school district. For
participants living in areas with separate elementary and secondary districts, we link them to
their elementary district.
For measures of district-level average status, average growth, free and reduced-price
lunch (FRPL) eligibility, and racial/ethnic composition, we use the Stanford Education Data
Archive v2.1 (SEDA). SEDA contains data from state standardized tests in reading and math in
grades 3-8 administered from 2009-2015 for almost every school district in the US (Fahle et al.,
2018). SEDA defines school districts in geographic terms: The dataset contains student
performance data for all public schools located in the geographic boundaries of the district,

11
including charter schools. For each district, SEDA contains average status and growth in reading
and math as well as the average across both subjects (we employ these combined values in our
experiment). The student test score data have been converted to a common scale that allows
district-to-district comparisons across the country. We use the empirical Bayes grade cohort
scale estimates for the measures of status and growth. To aid in the interpretability of these
values for participants, we provide status and growth scores in terms of national percentiles. For
example, we present growth information in the survey as follows: “The rate of growth in student
academic performance in your school district is better than in [growth percentile] percent of
districts and worse than in [100 – growth percentile] percent of districts” (see the following
section for more details about the survey text).
Experimental Design
Participants are randomly assigned with equal probability to one of four experimental
groups:
1. Participants in the status group receive their district’s national percentile in terms of
average achievement status.
2. Participants in the growth group receive their district’s national percentile in terms of
average achievement growth.
3. Participants in the both group receive both their district’s national percentile in terms of
average achievement status and their district’s national percentile in terms of average
achievement growth.
4. Participants in the control group do not receive academic performance information for
their district.
At the beginning of the survey, all participants are asked to estimate how their local
12
school district performs in terms of average achievement status. They receive the following
prompt:
The next few questions are about the current level of student academic performance and the rate of growth or improvement in student academic performance in your school district from one year to the next. Enter any number from 0 to 100. I think the current level of student academic performance in my school district is better than [number box, range 0-100] percent of other districts in the United States.
Next, they estimate how their district performs in terms of average achievement growth:
Enter any number from 0 to 100. I think the rate of growth in student academic performance in my school district is better than [number box, range 0-100] percent of other districts in the United States.
Depending on their experimental assignment, some participants receive information
about their district’s academic performance. Those assigned to the status group receive:
According to the most recent information available, the current level of student academic performance in your school district is better than in [achievement percentile] percent of districts and worse than in [100 – achievement percentile] percent of districts.
Those assigned to the growth group receive:
According to the most recent information available, the rate of growth in student academic performance in your school district is better than in [growth percentile] percent of districts and worse than in [100 – growth percentile] percent of districts.
Those assigned to the both group receive both pieces of information displayed above, while
those assigned to the control group receive neither.
All participants then receive the following question about the quality of their local public
schools:
13
Students are often given the grades A, B, C, D, and Fail to denote the quality of their work. Suppose the public schools themselves were graded in the same way. What grade would you give the public schools in your community? (Answer options: A, B, C, D, or Fail)
This question employs the standard wording for measuring confidence in the public schools as
tracked by Loveless (1997) and Bali (2016).
Lastly, all participants receive the following question about the relative importance of
academic performance versus social and emotional well-being (the sequence of “student
academic performance” and “student social and emotional well-being” is randomized to
eliminate ordering effects):
How much should schools focus on student academic performance versus student social and emotional well-being? Please give a percentage for each. Your answers should add to 100%. 1. Student academic performance [number box, 0-100] % 2. Student social and emotional well-being [number box, 0-100] % Total [show sum of boxes]
Analytic Approach
To check for balance between experimental groups, we compare the demographic
composition of the control group with the demographic compositions of each of the other
randomly assigned groups. To accomplish this, we use a series of weighted least squares (WLS)
regressions:
𝑋! = 𝑎 + 𝑏𝑆! + 𝑐𝐺! + 𝑑𝐵! + 𝑢!,
where 𝑋! is one of the available demographic covariates (from the set of individual-level
demographic characteristics provided by Ipsos Public Affairs); 𝑆!, 𝐺!, and 𝐵! are indicators of
experimental group status (the status group, the growth group, and the both group); and 𝑢! is the
error term for individual 𝑖. Ipsos Public Affairs computed post-stratification statistical weights by
14
age, gender, race/ethnicity, US Census region, metropolitan status, education, and household
income. We incorporate these weights into all regression models to improve generalizability to
the American public as a whole. The results are substantively similar with or without the use of
weights.
To answer Research Question 1, we calculate a range of descriptive statistics for
participants’ estimates of status and growth as well as actual status and growth in their districts.
When calculating average treatment effects (Research Questions 2-3), we rely on the
following general model:
𝑌! = 𝑎 + 𝑏𝑆! + 𝑐𝐺! + 𝑑𝐵! + 𝒆𝑿𝒊 + 𝑢!,
where 𝑌! is the outcome (local school grades or the relative importance of academic
performance) and 𝑿𝒊 is a vector of demographic characteristics. The default comparison is to the
control group, but we also calculate average treatment effects with the status group as the
comparison group.
When calculating heterogeneous treatment effects by individual-level and district-level
characteristics (Research Questions 4-6), we rely on the following general model:
𝑌! = 𝑎 + 𝑏𝑆! + 𝑐𝐺! + 𝑑𝐵! + 𝒆𝑿𝒊 + 𝑓𝑍!# + 𝑔(𝑆!𝑍!#) + ℎ(𝐺!𝑍!#) + 𝑗(𝐵!𝑍!#) + 𝑢!,
where 𝑍!# is the value of the heterogeneous dimension for individual 𝑖 in district 𝑑.
The treatment effect heterogeneity analyses associated with Research Question 5 are
based on the premise that average status and average growth have different underlying
relationships with districts’ racial/ethnic and economic compositions: The relationships between
student demographics and average growth are much weaker than the analogous relationships
between student demographics and average status (Reardon, 2016). To corroborate this finding
within our sample, we calculate a series of bivariate relationships between district-level
15
demographic characteristics and academic performance.
Findings
Balance and Missing Data
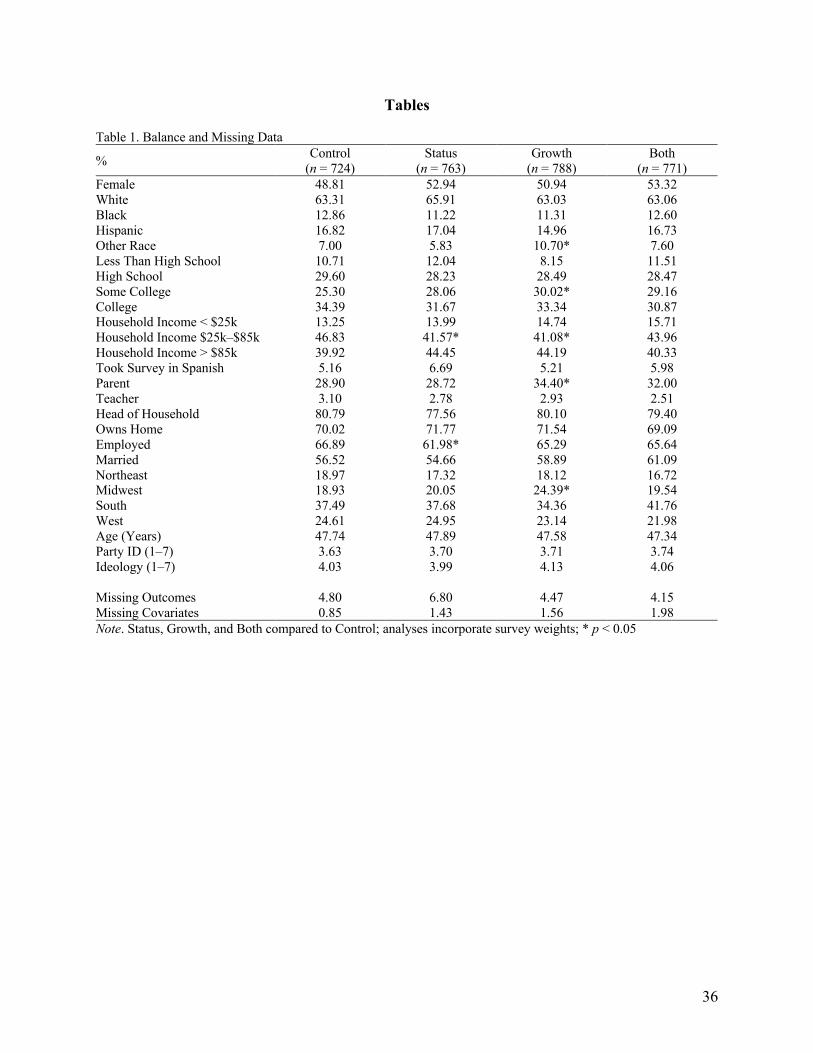
Table 1 displays the frequencies of participants’ demographic characteristics by
experimental condition. Our use of random assignment establishes groups with similar
demographic compositions. There are seven instances (out of 78 total comparisons) in which the
demographic profile of an experimental group is statistically different from the control group.
This rate is marginally higher than we would expect by chance alone. To adjust for these
observable differences between groups, we include all individual-level covariates in subsequent
analyses.
[Table 1 about here]
Roughly 4-7 percent of each group is missing answers to one or more of the survey
questions that serve as outcomes in our study. If participants do not answer the district status
estimation question, the district growth estimation question, the local public school grades
question, or the relative importance of academic performance question, they are dropped from
the analyses that rely on those values. About 1-2 percent of each group is missing one or more of
the demographic covariates. If participants are missing demographic information, we recode the
missing data with an arbitrary value and control for an indicator of missingness in subsequent
analyses. Thirty-one participants (approximately one percent of the sample) live in areas where
we do not have data on district status or growth. Depending on their experimental assignment,
these participants receive the median academic performance value(s).
Estimating Status and Growth
Our first research question asks about the extent to which participants are able to estimate
16
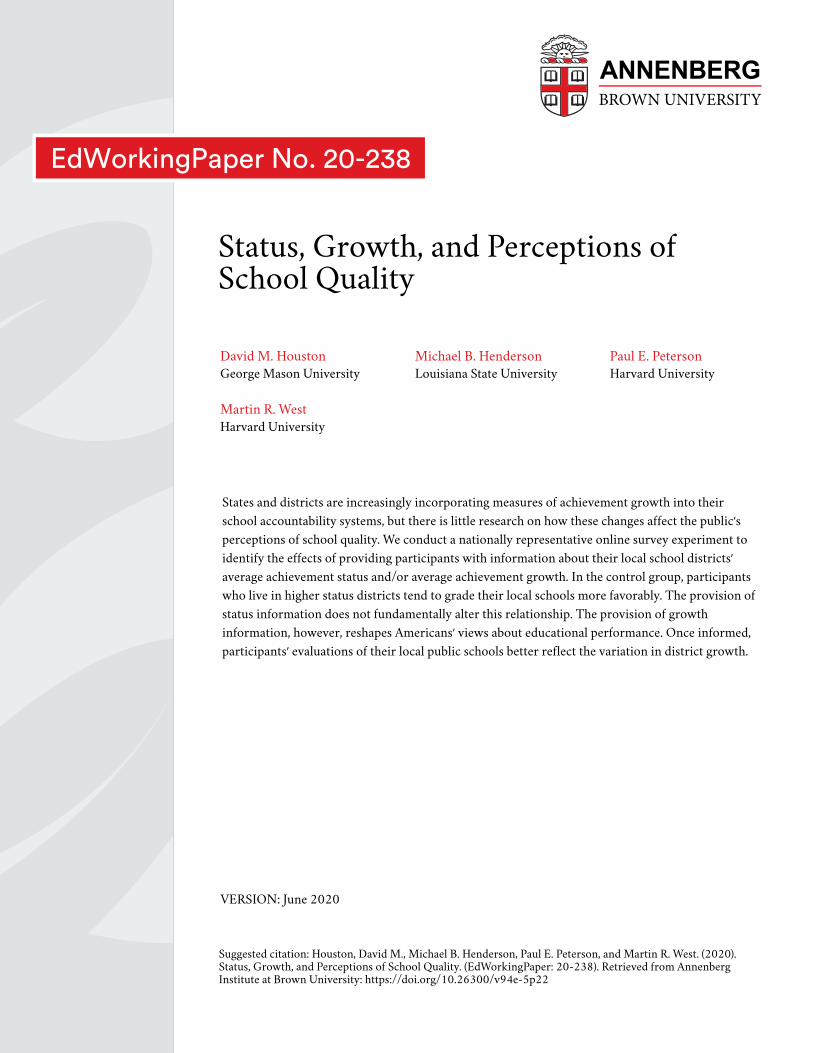
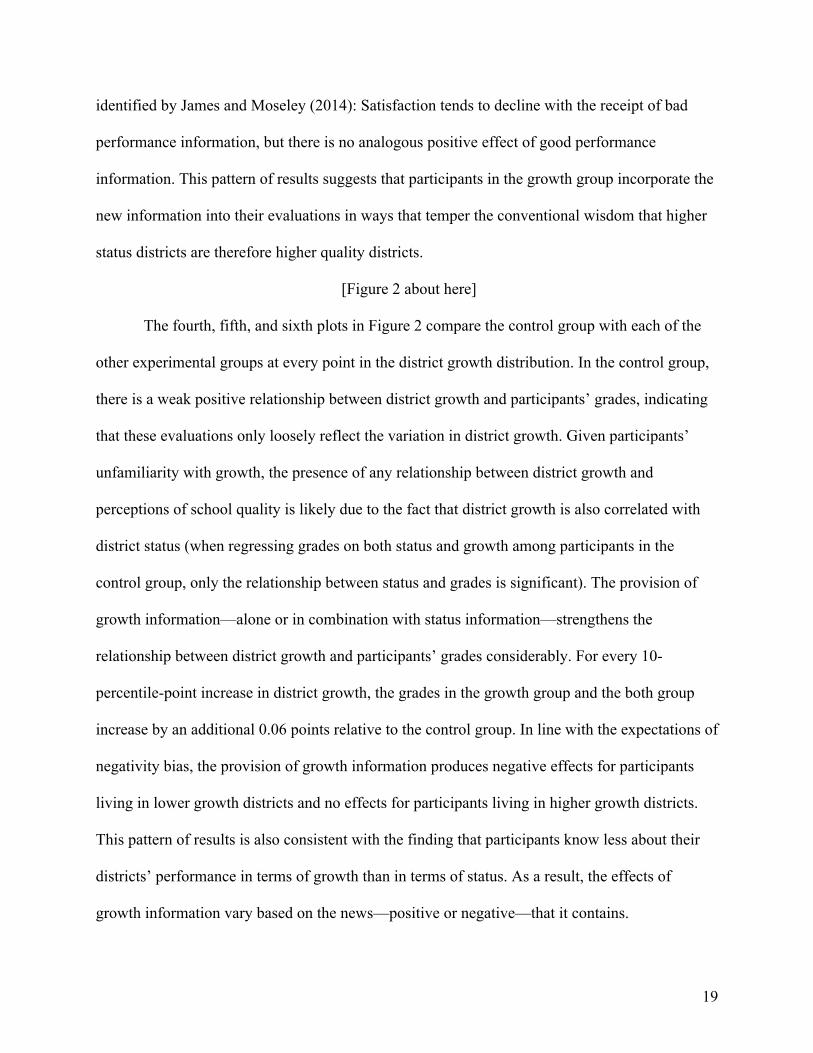
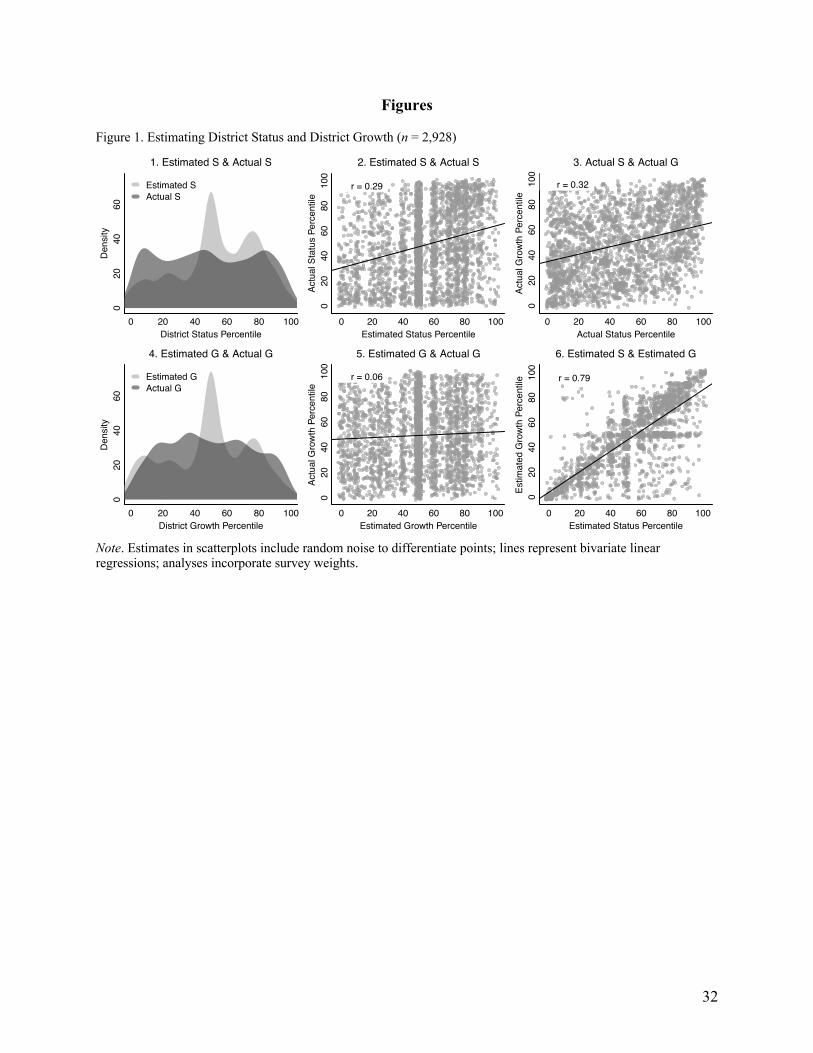
status and growth in their districts. The first and fourth plots in Figure 1 display the distributions
of participants’ estimates of their district status and district growth percentiles versus the actual
district status and district growth percentiles. Participants’ estimates of status and growth
percentiles range from 0 to 100. The modal estimate for both status and growth is the 50th
percentile. For both forms of academic performance, there is also a second, smaller spike at the
75th percentile. Because the survey features a nationally representative sample, the distributions
of actual status and growth percentiles are roughly uniform.
[Figure 1 about here]
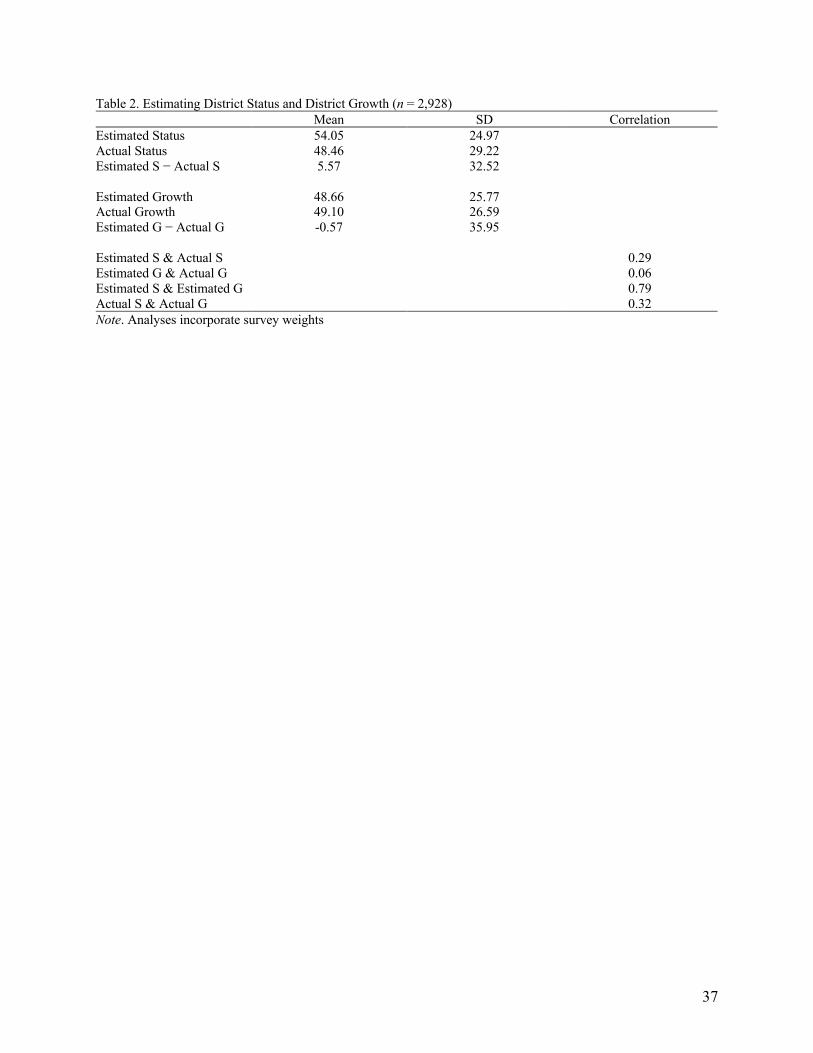
Table 2 describes the distributions of estimated and actual academic performance in
greater detail. The average estimated achievement percentile is 54.05 while the average actual
achievement status percentile is 48.46, suggesting that participants are somewhat over-optimistic
about their districts’ performance with respect to status. There is considerable variation in
participants’ responses. Their status estimates have a standard deviation of 24.97 percentile
points (similar to the 29.22 percentile point standard deviation in actual achievement). Overall,
participants’ estimates of district status are related to and slightly predictive of actual district
status. The correlation between the two is 0.29. This relationship is displayed visually in the
second plot in Figure 1. In short, participants’ estimates of achievement status reveal a modest
understanding of how their districts perform in this regard.
[Table 2 about here]
The pattern with respect to growth is quite different. On average, participants accurately
estimate their districts’ growth percentiles. The average estimated growth percentile and the
average actual growth percentile are 48.66 and 49.10 (with standard deviations of 25.77 and
26.59 percentile points). However, despite their accuracy on average, participants’ estimates of
17
district growth are essentially unrelated to their districts’ actual growth. Estimated and actual
growth are correlated at 0.06. This relationship is displayed visually in the fifth plot in Figure 1.
While participants demonstrate some understanding of their districts’ performance in terms of
achievement status, they are largely unaware of how their districts perform in terms of
achievement growth.
We also explore the extent to which district status and growth—both actual and
estimated—are related (see the third and sixth plots in Figure 1). Among the participants in our
sample, actual status and actual growth are correlated at 0.32. On average, higher status districts
are also higher growth districts, but the relationship is modest. Estimated status and estimated
growth, on the other hand, are correlated at a much stronger 0.79. This mismatch lends itself to
two different interpretations. Perhaps participants understand the distinction between status and
growth, but they incorrectly believe that a district that is strong on one dimension of academic
performance is also overwhelmingly likely to be strong on the other. Alternatively, it is possible
that participants simply do not distinguish between the two concepts. They may incorrectly view
status and growth as different ways of measuring the same underlying construct. Our analysis is
unable to adjudicate between these two possibilities.
The Effects of Academic Performance Information
Table 3 displays the results of the analyses associated with Research Questions 2-4, in
which we estimate the effects of providing academic performance information on 1) the grades
that participants assign to their local public schools and 2) participants’ preferences about how
much schools should focus on academic performance. Model 1 displays the average effects of
providing information about status, growth, or both on participants’ local school grades.
Participants in the control group give an average grade of 3.64 on a 5-point scale (roughly a B-)
18
with a standard deviation of 0.91 points. For every experimental group, the receipt of academic
performance information is a sobering experience. Compared to the grades in the control group,
the grades in the status and growth groups decline on average by 0.28 points and 0.29 points,
respectively. The grades in the both group decline by 0.18 points on average. When considering
the sample as a whole, the provision of academic performance information of any kind reduces
the grades that participants give to their local public schools.
[Table 3 about here]
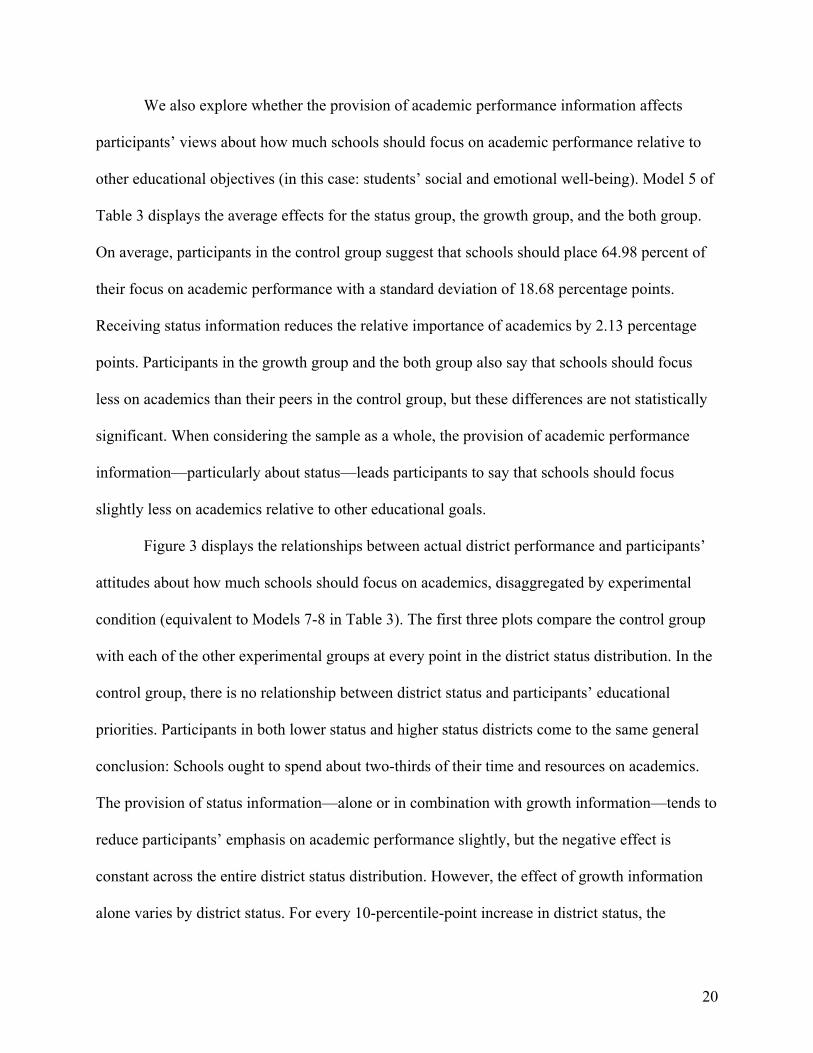
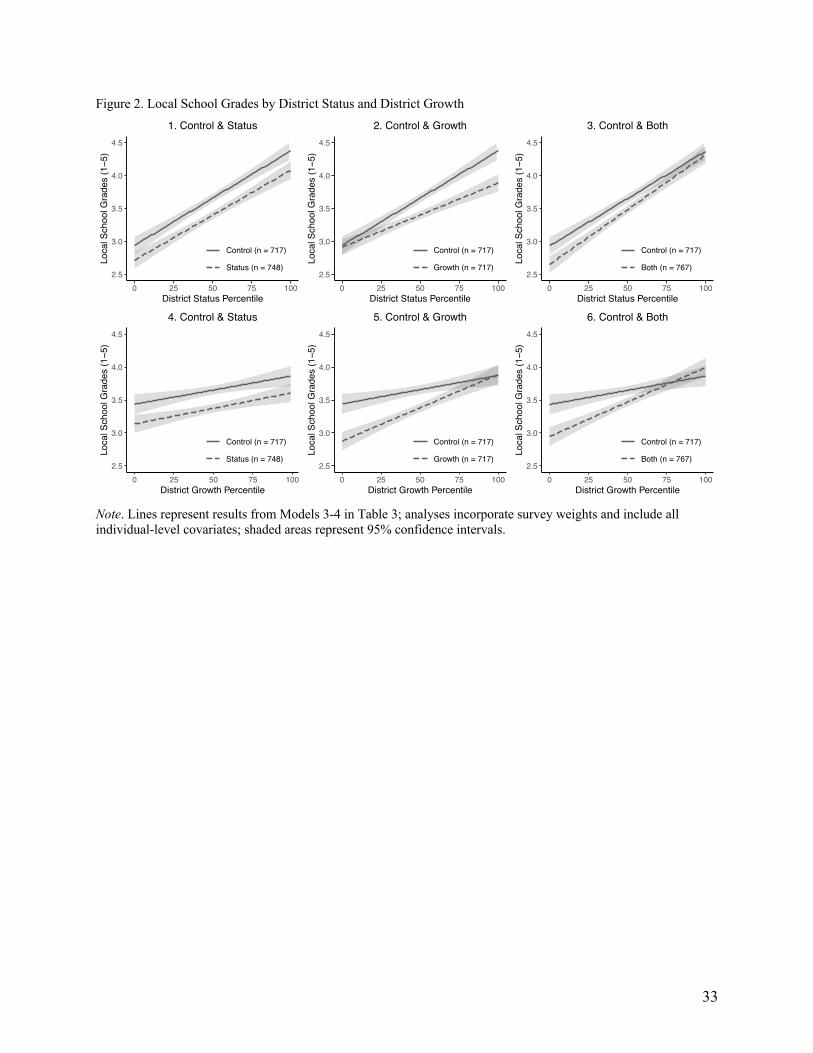
A more complex story emerges when we consider how the effects of academic
performance information vary by participants’ local context. Figure 2 displays the relationships
between actual district performance and participants’ evaluations of their local public schools,
disaggregated by experimental condition (equivalent to Models 3-4 in Table 3). The first three
plots compare the control group with each of the other experimental groups at every point in the
district status distribution. Participants in higher status districts tend to give higher grades,
regardless of their experimental assignment. The provision of status information tends to reduce
these grades at all points in the district status distribution, but the relationship between district
status and participants’ perceptions of school quality is generally unaffected. The provision of
both status and growth information generates similar results. By contrast, the provision of growth
information alone weakens the relationship between district status and perceptions of school
quality. For every 10-percentile-point increase in district status, the grades in the growth group
decrease by an additional 0.05 points relative to the control group. In higher status districts (not
all of which are also higher growth districts), the negative effect of receiving growth information
is large: about half a letter grade on average. In lower status districts (some of which are
relatively higher growth districts), there is no effect. This is consistent with the negativity bias
19
identified by James and Moseley (2014): Satisfaction tends to decline with the receipt of bad
performance information, but there is no analogous positive effect of good performance
information. This pattern of results suggests that participants in the growth group incorporate the
new information into their evaluations in ways that temper the conventional wisdom that higher
status districts are therefore higher quality districts.
[Figure 2 about here]
The fourth, fifth, and sixth plots in Figure 2 compare the control group with each of the
other experimental groups at every point in the district growth distribution. In the control group,
there is a weak positive relationship between district growth and participants’ grades, indicating
that these evaluations only loosely reflect the variation in district growth. Given participants’
unfamiliarity with growth, the presence of any relationship between district growth and
perceptions of school quality is likely due to the fact that district growth is also correlated with
district status (when regressing grades on both status and growth among participants in the
control group, only the relationship between status and grades is significant). The provision of
growth information—alone or in combination with status information—strengthens the
relationship between district growth and participants’ grades considerably. For every 10-
percentile-point increase in district growth, the grades in the growth group and the both group
increase by an additional 0.06 points relative to the control group. In line with the expectations of
negativity bias, the provision of growth information produces negative effects for participants
living in lower growth districts and no effects for participants living in higher growth districts.
This pattern of results is also consistent with the finding that participants know less about their
districts’ performance in terms of growth than in terms of status. As a result, the effects of
growth information vary based on the news—positive or negative—that it contains.
20
We also explore whether the provision of academic performance information affects
participants’ views about how much schools should focus on academic performance relative to
other educational objectives (in this case: students’ social and emotional well-being). Model 5 of
Table 3 displays the average effects for the status group, the growth group, and the both group.
On average, participants in the control group suggest that schools should place 64.98 percent of
their focus on academic performance with a standard deviation of 18.68 percentage points.
Receiving status information reduces the relative importance of academics by 2.13 percentage
points. Participants in the growth group and the both group also say that schools should focus
less on academics than their peers in the control group, but these differences are not statistically
significant. When considering the sample as a whole, the provision of academic performance
information—particularly about status—leads participants to say that schools should focus
slightly less on academics relative to other educational goals.
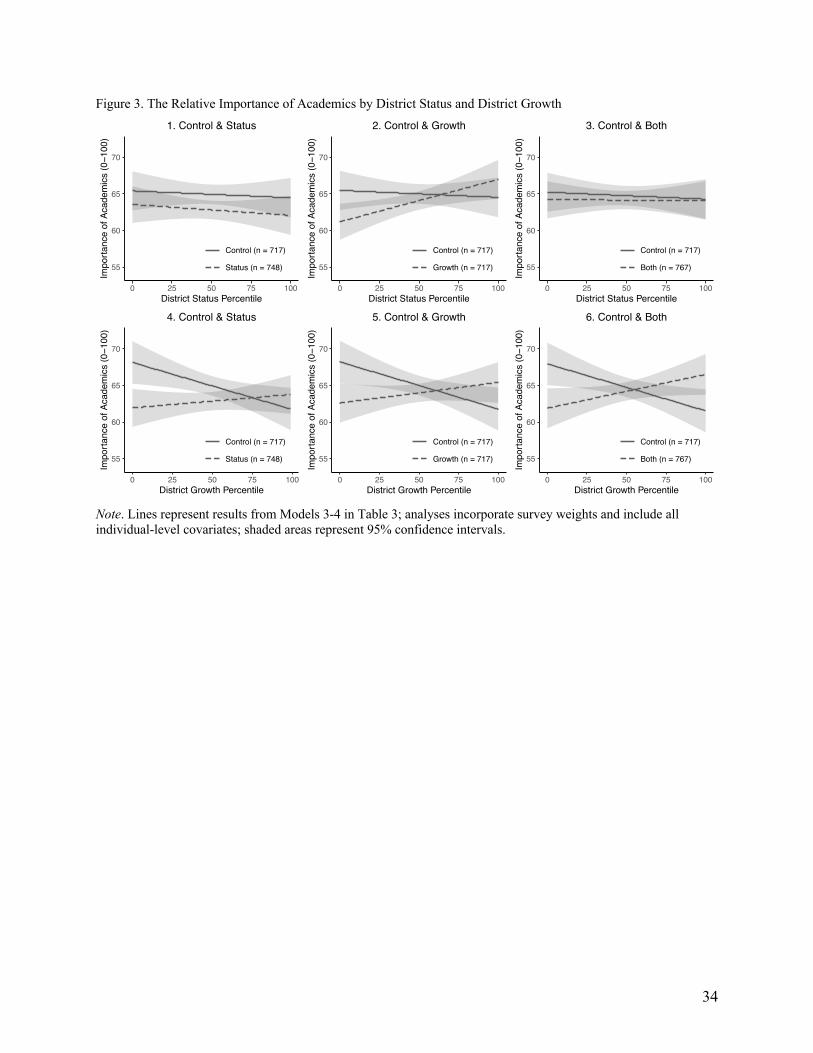
Figure 3 displays the relationships between actual district performance and participants’
attitudes about how much schools should focus on academics, disaggregated by experimental
condition (equivalent to Models 7-8 in Table 3). The first three plots compare the control group
with each of the other experimental groups at every point in the district status distribution. In the
control group, there is no relationship between district status and participants’ educational
priorities. Participants in both lower status and higher status districts come to the same general
conclusion: Schools ought to spend about two-thirds of their time and resources on academics.
The provision of status information—alone or in combination with growth information—tends to
reduce participants’ emphasis on academic performance slightly, but the negative effect is
constant across the entire district status distribution. However, the effect of growth information
alone varies by district status. For every 10-percentile-point increase in district status, the
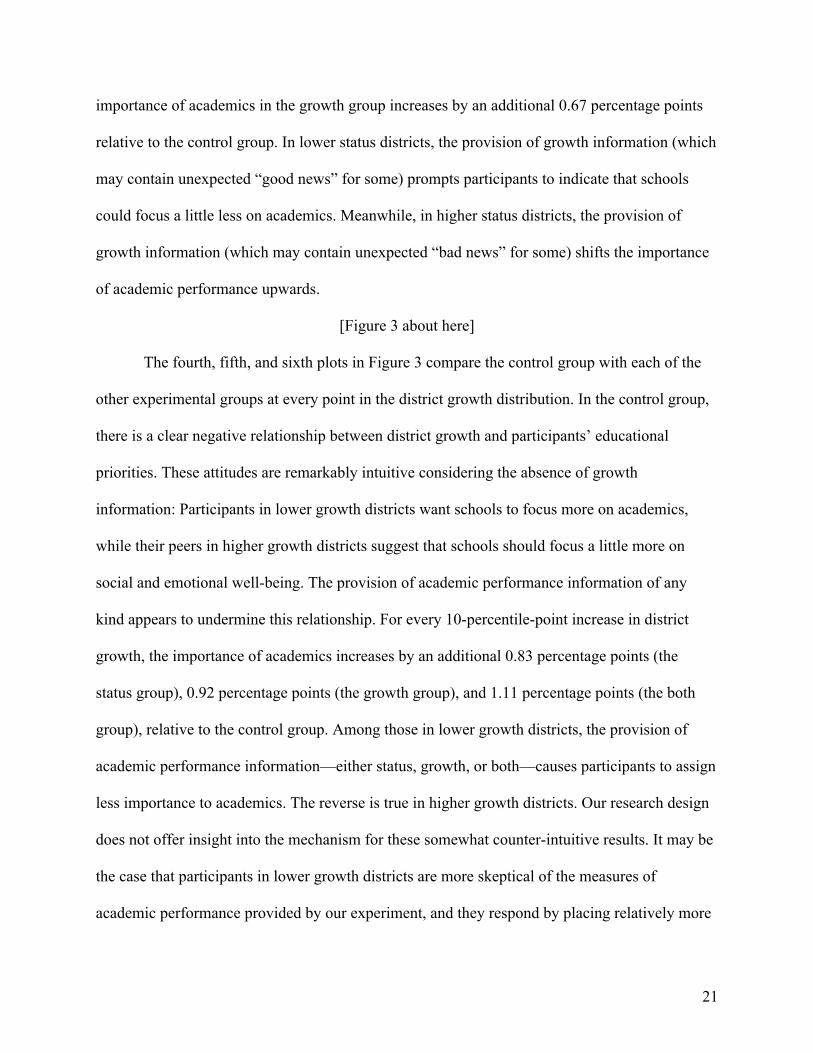
21
importance of academics in the growth group increases by an additional 0.67 percentage points
relative to the control group. In lower status districts, the provision of growth information (which
may contain unexpected “good news” for some) prompts participants to indicate that schools
could focus a little less on academics. Meanwhile, in higher status districts, the provision of
growth information (which may contain unexpected “bad news” for some) shifts the importance
of academic performance upwards.
[Figure 3 about here]
The fourth, fifth, and sixth plots in Figure 3 compare the control group with each of the
other experimental groups at every point in the district growth distribution. In the control group,
there is a clear negative relationship between district growth and participants’ educational
priorities. These attitudes are remarkably intuitive considering the absence of growth
information: Participants in lower growth districts want schools to focus more on academics,
while their peers in higher growth districts suggest that schools should focus a little more on
social and emotional well-being. The provision of academic performance information of any
kind appears to undermine this relationship. For every 10-percentile-point increase in district
growth, the importance of academics increases by an additional 0.83 percentage points (the
status group), 0.92 percentage points (the growth group), and 1.11 percentage points (the both
group), relative to the control group. Among those in lower growth districts, the provision of
academic performance information—either status, growth, or both—causes participants to assign
less importance to academics. The reverse is true in higher growth districts. Our research design
does not offer insight into the mechanism for these somewhat counter-intuitive results. It may be
the case that participants in lower growth districts are more skeptical of the measures of
academic performance provided by our experiment, and they respond by placing relatively more

22
emphasis on students’ social and emotional well-being.
Heterogeneous Effects by District Racial/Ethnic and Economic Composition
Next, we present the results of the analyses associated with our secondary research
questions. Given the increasing number of statistical tests that accompany each additional
research question, the reader should view the following results as exploratory.
The first of our two secondary research questions asks whether the effects described
above vary by the racial/ethnic and economic composition of participants' districts. This question
is based on the premise that district-level student racial/ethnic composition and district-level
student economic composition have different underlying relationships with average status and
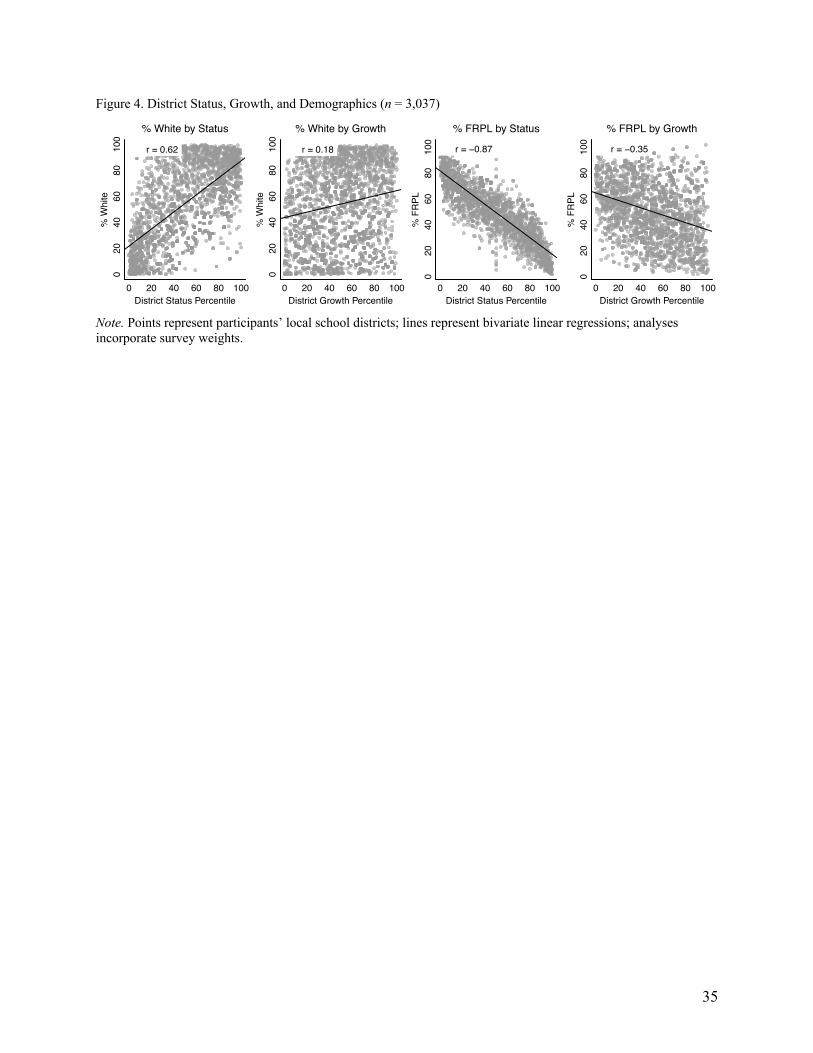
average growth. Figure 4 displays these relationships for the participants in our sample. There is
a strong, positive relationship between the percentage of white students and the district status
percentile (r = 0.62). The analogous relationship is much weaker with respect to the district
growth percentile (r = 0.18). Similarly, the relationship between the percentage of FRPL-eligible
students and the district status percentile (r = -0.87) is much stronger than the analogous
relationship with the district growth percentile (r = -0.35). Based on the differences in these
underlying relationships, we speculated that the effects of the provision of academic performance
information might vary for participants living in districts with different racial/ethnic and
economic compositions.
[Figure 4 about here]
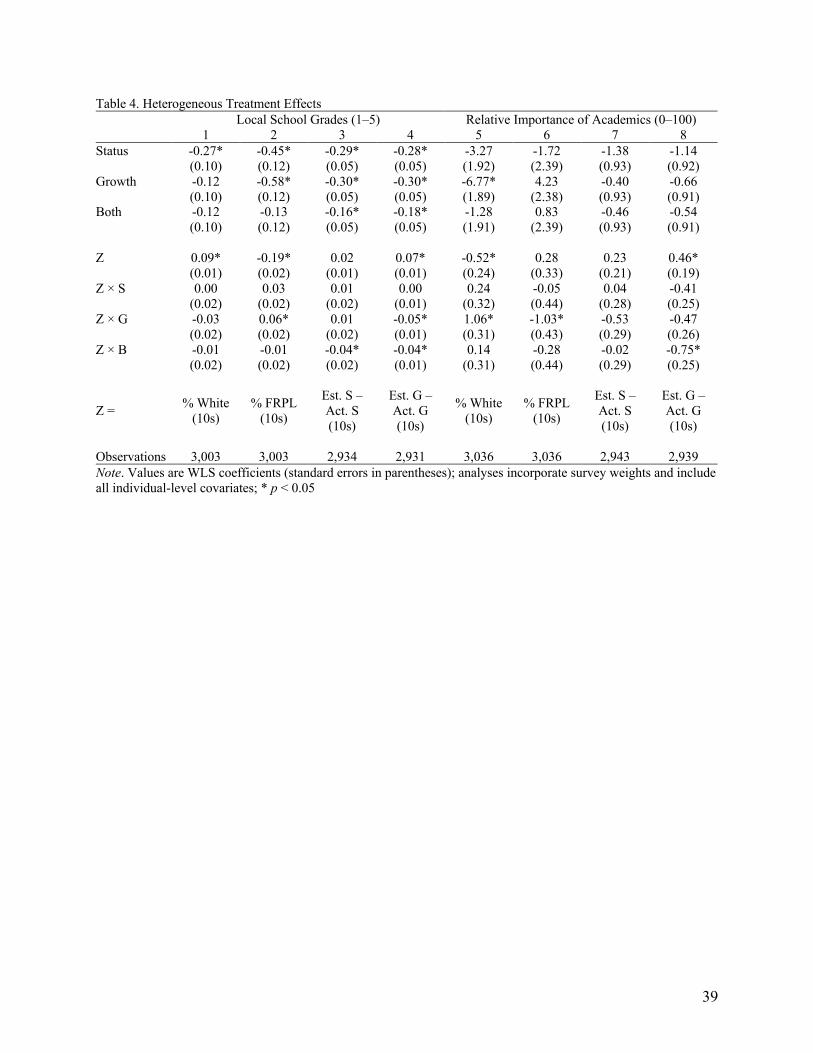
Models 1-2 of Table 4 display the effects of academic performance information on local
school grades as they vary by the percentage of white students and the percentage of FRPL-
eligible students in participants’ districts. We do not observe evidence of treatment effect
heterogeneity by the percentage of white students. However, the effects of growth information
23
vary by the percentage of FRPL-eligible students. In the control group, the relationship between
the percentage of FRPL-eligible students and perceptions of school quality is sharply negative:
Participants in less affluent district tend to give lower grades to their local schools. In the growth
group, this relationship is weakened. For every 10-percentage-point increase in FRPL-eligible
students, the grades in the growth group increased by an additional 0.06 points relative to the
control group. In short, upon receiving growth information, participants’ perceptions of school
quality are less likely to be a simple function of the affluence of a community.
[Table 4 about here]
Models 5-6 of Table 4 display the effects of academic performance information on the
relative importance of academics as they vary by the percentage of white students and the
percentage of FRPL-eligible students in participants’ districts. In the control group, the
relationship between the percentage of white students and the relative importance of academics
is negative, and the analogous relationship with the percentage of FRPL-eligible students is
positive. In other words, participants in whiter and more affluent districts tend to say that schools
should focus a little less on academics and a little more on students’ social and emotional well-
being than their peers in districts that serve more low-income students and students of color. The
provision of growth information reverses these relationships. For every 10-percentage-point
increase in the percentage of white students, the importance of academics in the growth group
increases by an additional 1.06 percentage points relative to the control group. For every 10-
percentage-point increase in FRPL-eligible students, the importance of academics in the growth
group decreases by an additional 1.03 percentage points relative to the control group. The
provision of growth information tends to prompt participants in richer, whiter districts to place
more emphasis on academics. At the same time, the provision of growth information prompts
24
participants in less affluent, more diverse districts to place more emphasis on students’ social and
emotional well-being.
Updating Prior Beliefs About Academic Performance
The final research question asks whether these effects could be the result of participants
updating their prior beliefs about academic performance in their districts. To answer this
question, we test whether the effects vary by the extent to which participants incorrectly estimate
academic performance in their districts. Model 3 of Table 4 displays the effects of academic
performance information on local school grades as they vary by the amount that participants
overestimate their districts’ status percentiles. The only evidence for differential updating with
respect to status appears among participants in the both group. For every 10-percentile-point
overestimation of district status, the grades in the both group decrease by an additional 0.04
points relative to the control group. The evidence for differential updating with respect to
growth—about which participants’ prior beliefs are less well informed—is more robust. Model 4
displays the effects of academic performance information on local school grades as they vary by
the amount that participants over-estimate their districts’ growth percentiles. For every 10-
percentile-point overestimation of district growth, the grades in the growth group and the both
group decrease by an additional 0.05 points and 0.04 points relative to the control group,
respectively. In short, as the overestimation of district growth increases, so does the negative
effect of growth information on local school grades.
Model 7 of Table 4 displays the effects of academic performance information on the
relative importance of academics as they vary by the amount that participants over-estimate their
districts’ status percentiles. We do not observe evidence of treatment effect heterogeneity along
this dimension. Alternatively, Model 8 indicates that, for every 10 percentile point
25
overestimation of district growth, the importance of academics in the both group decreases by an
additional 0.75 percentage points relative to the control group. In other words, as the over-
estimation of district growth increases, so does the negative effect of receiving both forms of
academic performance information on the importance that they assign to academics.
Conclusion
States increasingly include measures of both achievement status and achievement growth
in their school accountability systems. States and school districts use this information to guide
their efforts to support struggling students, redirect resources where they are most needed, and
even shut down chronically under-performing schools. Families also use this information—either
via states’ official school report cards or via secondary sources, such as GreatSchools.org or
Niche.com, that draw on state data—as they make school and housing decisions.
Previous scholarship suggests that the American public already possesses a modest
understanding of how their local schools perform in terms of achievement status. We observe the
same pattern in our own analysis. However, we also find that Americans are largely unfamiliar
with how their local schools perform in terms of growth. This should not be altogether
surprising, given the fact that many states have only recently incorporated growth data into their
school accountability systems. To understand how the public responds to these new measures of
educational performance, we conducted an online survey experiment with a nationally
representative sample that identifies the effects of disseminating status and/or growth
information on participants’ perceptions of school quality.
Because of Americans’ existing familiarity with achievement status in their local schools,
the provision of status information does not fundamentally alter the underlying relationship
between district status and the public’s perceptions of school quality. The provision of growth
26
information, however, reshapes Americans’ views about educational performance. The effects of
growth information are quite different for participants living in lower growth districts
(significantly reducing the grades that participants assign to their local schools) and higher
growth districts (no effect). Consequently, the provision of growth information strengthens the
underlying relationship between district growth and the public’s perceptions of school quality. In
short, when participants learn about student growth, their personal evaluations of their local
schools become more in line with a measure that many researchers consider a better measure of
schools’ contributions to student learning. Moreover, because district growth bears a weaker
relationship to the economic composition of the student body than district status, the provision of
growth information reorients Americans’ perceptions of school quality away from the
conventional wisdom that more affluent school districts are almost always higher quality
districts.
However, the increasing prevalence of student growth information may have some
unanticipated consequences. We also asked participants to opine on how much schools should
focus on academic performance relative to other educational objectives (in this case: students’
social and emotional well-being). We find that the provision of growth information to
participants living in lower growth districts not only lowers their perceptions of school quality, it
also causes them to say that their schools should focus less on academics. It may be the case that
distributing information about lackluster student growth will not, as one might expect, induce a
call-to-arms regarding academics. Rather, it may end up reducing support for schools’ academic
objectives and/or this particular method of measuring success towards those objectives.
These results have important implications for our understanding of the social, economic,
and political consequences of how we measure educational performance. As states assign

27
relatively less weight to traditional indicators of achievement status when evaluating school
quality, we might expect to see heightened demand for higher growth schools and nearby
housing. Because average growth bears a weaker relationship to student demographics than
average status, this shift could alternatively benefit many low-income communities and
communities of color (by increasing housing values for existing homeowners) or further
disadvantage them (by attracting relatively affluent newcomers who can afford higher housing
costs).
We see two important avenues for future research stemming from this work. First,
additional survey research is necessary to understand the extent to which individuals comprehend
and trust new measures of academic performance such as growth. Second, recent revisions to
school accountability systems offer an opportunity to study how such decisions about
measurement may affect families’ school enrollment decisions, housing prices, and political
outcomes in school board elections and local school funding referenda. Our analysis suggests
that these changes can alter the public’s attitudes towards the public schools, but much work
remains to be done to understand whether these revised attitudes translate into different
behaviors.
28
References
Achieve, Inc. (2019). Accountability in state ESSA plans. Tracking tool. Retrieved
from https://states.achieve.org/essa-tracker
Bali, V. (2016). Evolving trends in public opinion on the quality of local schools. Educational
Policy, 30(5), 688-720.
Barone, C. (2017). What ESSA says: Continuities and departures. In F. M. Hess & M. Eden
(Eds.), The Every Student Succeeds Act: What it means for schools, systems, and states.
Cambridge, MA: Harvard Education Press.
Barrows, S., Henderson, M., Peterson, P. E., & West, M. R. (2016). Relative performance
information and perceptions of public service quality: Evidence from American school
districts. Journal of Public Administration Research and Theory, 26(3), 571-583.
Bayer, P., Ferreira, F., & McMillan, R. (2007). A unified framework for measuring preferences
for schools and neighborhoods. Journal of Political Economy, 115(4), 588-638.
Black, S. E. (1999). Do better schools matter? Parental valuation of elementary education.
Quarterly Journal of Economics, 114(2), 577-599.
Chingos, M. M., Henderson, M., & West, M. R. (2012). Citizen perceptions of government
service quality: Evidence from public schools. Quarterly Journal of Political Science,
7(4), 411-445.
Chingos, M. M., & West, M. R. (2015) Why annual statewide testing is critical to judging school
quality. Brookings Institution. Retrieved from https://www.brookings.edu/research/why-
annual-statewide-testing-is-critical-to-judging-school-quality/
Clinton, J. D., & Grissom, J. A. (2015). Public information, public learning, and public opinion:
Democratic accountability in education policy. Journal of Public Policy, 35(3), 355-385.
29
Data Quality Campaign. (2019). Growth data: It matters, and it’s complicated. Retrieved from
https://dataqualitycampaign.org/resource/growth-data-it-matters-and-its-complicated/
Fahle, E. M., Shear B. R., Kalogrides, D., Reardon, S. R., DiSalvo, R., & Ho, A. D. (2018).
Stanford education data archive: Technical documentation, version 2.1. Stanford
University Center for Education Policy Analysis.
Figlio, D. N., & Lucas, M. E. (2004). What’s in a grade? School report cards and the housing
market. American Economic Review, 94(3), 591-604.
Fiva, J. H., & Kirkebøen, L. J. (2011). Information shocks and the dynamics of the housing
market. Scandinavian Journal of Economics, 113(3), 525-552.
Houston, D. M., & Henig, J. R. (2019). The effects of student growth data on school district
choice: Evidence from a survey experiment (EdWorkingPaper: 19-87). Retrieved from
Annenberg Institute at Brown University: https://www.edworkingpapers.com/ai19-87
Imberman, S. A., & Lovenheim, M. F. (2016). Does the market value value-added? Evidence
from housing prices after the public release of school and teacher value-added. Journal of
Urban Economics, 91(1), 104-121.
Jacobsen, R. (2009). The voice of the people in education. In G. Sykes, B. Schneider, & D. N.
Plank (Eds.), Handbook of education policy research. New York, NY: Routledge.
Jacobsen, R. Saultz, A., & Snyder, J. W. (2013). When accountability strategies collide: Do
policy changes that raise accountability standards also erode public satisfaction?
Educational Policy, 27(2), 360-389.
Jacobsen, R., Snyder, J. W., & Saultz, A. (2014). Informing or shaping public opinion? The
influence of school accountability data format on public perceptions of school quality.
American Journal of Education, 121(1), 1-27.
30
Jacobsen, R., Snyder, J. W., & Saultz, A. (2015). Understanding satisfaction with schools: The
role of expectations. Journal of Public Administration Research and Theory, 25(3), 831-
848.
James, O. (2011). Performance measures and democracy: Information effects on citizens in field
and laboratory experiments. Journal of Public Administration Research and Theory,
21(3), 399-418.
James, O., & Moseley, A. (2014). Does performance information about public services affect
citizens’ perceptions, satisfactions, and voice behavior? Field experiments with absolute
and relative performance information. Public Administration, 92(2), 493-511.
James, O., & Van Ryzin, G. G. (2017). Incredibly good performance: An experimental study of
source and level effects on the credibility of government. American Review of Public
Administration, 47(1), 23-35.
Ladd, H., & Loeb, S. (2013). The challenges of measuring school quality: Implications for
educational equity. In R. Reich & D. Allen (Eds.), Education, Justice, and Democracy.
Chicago, IL: Chicago University Press.
Loveless, T. (1997). The structure of public confidence in education. American Journal of
Education, 105(2), 127-159.
Marvel, J. D. (2015). Unconscious bias in citizens’ evaluations of public sector performance.
Journal of Public Adminisration Research and Theory, 26(1), 143-158.
Reardon, S. F. (2016). School district socioeconomic status, race, and academic achievement.
Stanford University Center for Education Policy Analysis. Retrieved from
https://cepa.stanford.edu/content/school-district-socioeconomic-status-race-and-
academic-achievement

31
Rothstein, R., Jacobsen, R., & Wilder, T. (2008). Grading education: Getting accountability
right. New York, NY: Teachers College Press.
Schneider, J., Jacobsen, R., White, R. S., Gehlbach, H. (2018). The (mis)measure of schools:
How data affect stakeholder knowledge and perceptions of quality. Teachers College
Record, 120(6), 1-40.
Schueler, B., & West M. R. (2016). Sticker shock: How information affects citizen support for
public school funding. Public Opinion Quarterly, 80(1), 90-113.
Sherman, S. J., Mackie, D. M., & Driscoll, D. M. (1990). Priming and the differential use of
dimensions in evaluation. Personality and Social Pyschology Bulletin, 16(3), 405-418.
Stiefel, L., Schwartz, A. E., & Rotenberg, A. (2011). What do AEFA Members say? Summary of
results of an education finance and policy survey. Education Finance and Policy, 6(2),
267-292.
Walker, S. E., & Archbold, C. A. (2014). The new world of police accountability (2nd ed.).
Washington, DC: Sage Publications.
Wong, A. (2017). Delving into one of the questions Betsy DeVos couldn’t answer. The Atlantic.
Retrieved from https://www.theatlantic.com/education/archive/2017/01/delving-into-one-
of-the-questions-betsy-devos-couldnt-answer/513941/
32
Figures Figure 1. Estimating District Status and District Growth (n = 2,928)
Note. Estimates in scatterplots include random noise to differentiate points; lines represent bivariate linear regressions; analyses incorporate survey weights.
0 20 40 60 80 100
020
4060
1. Estimated S & Actual S
District Status Percentile
Den
sity
Estimated SActual S
0 20 40 60 80 1000
2040
6080
100
2. Estimated S & Actual S
Estimated Status Percentile
Actu
al S
tatu
s Pe
rcen
tile
r = 0.29
0 20 40 60 80 100
020
4060
8010
0
3. Actual S & Actual G
Actual Status Percentile
Actu
al G
row
th P
erce
ntile
r = 0.32
0 20 40 60 80 100
020
4060
4. Estimated G & Actual G
District Growth Percentile
Den
sity
Estimated GActual G
0 20 40 60 80 100
020
4060
8010
0
5. Estimated G & Actual G
Estimated Growth Percentile
Actu
al G
row
th P
erce
ntile
r = 0.06
0 20 40 60 80 100
020
4060
8010
0
6. Estimated S & Estimated G
Estimated Status PercentileEs
timat
ed G
row
th P
erce
ntile r = 0.79
33
Figure 2. Local School Grades by District Status and District Growth
Note. Lines represent results from Models 3-4 in Table 3; analyses incorporate survey weights and include all individual-level covariates; shaded areas represent 95% confidence intervals.
2.5
3.0
3.5
4.0
4.5
0 25 50 75 100District Status Percentile
Loca
l Sch
ool G
rade
s (1−5
)
Control (n = 717)
Status (n = 748)
1. Control & Status
2.5
3.0
3.5
4.0
4.5
0 25 50 75 100District Status Percentile
Loca
l Sch
ool G
rade
s (1−5
)
Control (n = 717)
Growth (n = 717)
2. Control & Growth
2.5
3.0
3.5
4.0
4.5
0 25 50 75 100District Status Percentile
Loca
l Sch
ool G
rade
s (1−5
)
Control (n = 717)
Both (n = 767)
3. Control & Both
2.5
3.0
3.5
4.0
4.5
0 25 50 75 100District Growth Percentile
Loca
l Sch
ool G
rade
s (1−5
)
Control (n = 717)
Status (n = 748)
4. Control & Status
2.5
3.0
3.5
4.0
4.5
0 25 50 75 100District Growth Percentile
Loca
l Sch
ool G
rade
s (1−5
)
Control (n = 717)
Growth (n = 717)
5. Control & Growth
2.5
3.0
3.5
4.0
4.5
0 25 50 75 100District Growth Percentile
Loca
l Sch
ool G
rade
s (1−5
)
Control (n = 717)
Both (n = 767)
6. Control & Both
34
Figure 3. The Relative Importance of Academics by District Status and District Growth
Note. Lines represent results from Models 3-4 in Table 3; analyses incorporate survey weights and include all individual-level covariates; shaded areas represent 95% confidence intervals.
55
60
65
70
0 25 50 75 100District Status Percentile
Impo
rtanc
e of
Aca
dem
ics
(0−1
00)
Control (n = 717)
Status (n = 748)
1. Control & Status
55
60
65
70
0 25 50 75 100District Status Percentile
Impo
rtanc
e of
Aca
dem
ics
(0−1
00)
Control (n = 717)
Growth (n = 717)
2. Control & Growth
55
60
65
70
0 25 50 75 100District Status Percentile
Impo
rtanc
e of
Aca
dem
ics
(0−1
00)
Control (n = 717)
Both (n = 767)
3. Control & Both
55
60
65
70
0 25 50 75 100District Growth Percentile
Impo
rtanc
e of
Aca
dem
ics
(0−1
00)
Control (n = 717)
Status (n = 748)
4. Control & Status
55
60
65
70
0 25 50 75 100District Growth Percentile
Impo
rtanc
e of
Aca
dem
ics
(0−1
00)
Control (n = 717)
Growth (n = 717)
5. Control & Growth
55
60
65
70
0 25 50 75 100District Growth Percentile
Impo
rtanc
e of
Aca
dem
ics
(0−1
00)
Control (n = 717)
Both (n = 767)
6. Control & Both
35
Figure 4. District Status, Growth, and Demographics (n = 3,037)
Note. Points represent participants’ local school districts; lines represent bivariate linear regressions; analyses incorporate survey weights.
0 20 40 60 80 100
020
4060
8010
0% White by Status
District Status Percentile
% W
hite
r = 0.62
0 20 40 60 80 1000
2040
6080
100
% White by Growth
District Growth Percentile
% W
hite
r = 0.18
0 20 40 60 80 100
020
4060
8010
0
% FRPL by Status
District Status Percentile
% F
RPL
r = −0.87
0 20 40 60 80 100
020
4060
8010
0
% FRPL by Growth
District Growth Percentile
% F
RPL
r = −0.35
36
Tables
Table 1. Balance and Missing Data
% Control (n = 724)
Status (n = 763)
Growth (n = 788)
Both (n = 771)
Female 48.81 52.94 50.94 53.32 White 63.31 65.91 63.03 63.06 Black 12.86 11.22 11.31 12.60 Hispanic 16.82 17.04 14.96 16.73 Other Race 7.00 5.83 10.70* 7.60 Less Than High School 10.71 12.04 8.15 11.51 High School 29.60 28.23 28.49 28.47 Some College 25.30 28.06 30.02* 29.16 College 34.39 31.67 33.34 30.87 Household Income < $25k 13.25 13.99 14.74 15.71 Household Income $25k–$85k 46.83 41.57* 41.08* 43.96 Household Income > $85k 39.92 44.45 44.19 40.33 Took Survey in Spanish 5.16 6.69 5.21 5.98 Parent 28.90 28.72 34.40* 32.00 Teacher 3.10 2.78 2.93 2.51 Head of Household 80.79 77.56 80.10 79.40 Owns Home 70.02 71.77 71.54 69.09 Employed 66.89 61.98* 65.29 65.64 Married 56.52 54.66 58.89 61.09 Northeast 18.97 17.32 18.12 16.72 Midwest 18.93 20.05 24.39* 19.54 South 37.49 37.68 34.36 41.76 West 24.61 24.95 23.14 21.98 Age (Years) 47.74 47.89 47.58 47.34 Party ID (1–7) 3.63 3.70 3.71 3.74 Ideology (1–7) 4.03 3.99 4.13 4.06 Missing Outcomes 4.80 6.80 4.47 4.15 Missing Covariates 0.85 1.43 1.56 1.98 Note. Status, Growth, and Both compared to Control; analyses incorporate survey weights; * p < 0.05
37
Table 2. Estimating District Status and District Growth (n = 2,928) Mean SD Correlation Estimated Status 54.05 24.97 Actual Status 48.46 29.22 Estimated S − Actual S 5.57 32.52 Estimated Growth 48.66 25.77 Actual Growth 49.10 26.59 Estimated G − Actual G -0.57 35.95 Estimated S & Actual S 0.29 Estimated G & Actual G 0.06 Estimated S & Estimated G 0.79 Actual S & Actual G 0.32 Note. Analyses incorporate survey weights

38
Table 3. The Effects of Status and/or Growth Information Local School Grades (1–5) Relative Importance of Academics (0–100) 1 2 3 4 5 6 7 8 Status -0.28* -0.22* -0.30* -2.13* -1.87 -6.21* (0.05) (0.09) (0.10) (0.94) (1.83) (1.97) Growth -0.29* 0.00 -0.03 -0.57* -1.06 1.06 -4.28* -5.61* (0.05) (0.05) (0.09) (0.10) (0.94) (0.91) (1.81) (1.99) Both -0.18* 0.10* -0.28* -0.49* -0.60 1.52 -1.03 -6.07* (0.05) (0.05) (0.09) (0.11) (0.94) (0.91) (1.84) (2.01) Control 0.28* 2.13* (0.05) (0.94) Z 0.14* 0.04* -0.09 -0.64* (0.01) (0.01) (0.24) (0.27) Z × S -0.01 0.00 -0.05 0.83* (0.02) (0.02) (0.32) (0.35) Z × G -0.05* 0.06* 0.67* 0.92* (0.02) (0.02) (0.32) (0.36) Z × B 0.02 0.06* 0.09 1.11* (0.02) (0.02) (0.32) (0.36)
Z = S
Percentile (10s)
G Percentile
(10s)
S Percentile
(10s)
G Percentile
(10s) Observations 3,012 3,012 3,012 3,012 3,045 3,045 3,045 3,045 Note. Values are WLS coefficients (standard errors in parentheses); analyses incorporate survey weights and include all individual-level covariates; * p < 0.05
39
Table 4. Heterogeneous Treatment Effects Local School Grades (1–5) Relative Importance of Academics (0–100) 1 2 3 4 5 6 7 8 Status -0.27* -0.45* -0.29* -0.28* -3.27 -1.72 -1.38 -1.14 (0.10) (0.12) (0.05) (0.05) (1.92) (2.39) (0.93) (0.92) Growth -0.12 -0.58* -0.30* -0.30* -6.77* 4.23 -0.40 -0.66 (0.10) (0.12) (0.05) (0.05) (1.89) (2.38) (0.93) (0.91) Both -0.12 -0.13 -0.16* -0.18* -1.28 0.83 -0.46 -0.54 (0.10) (0.12) (0.05) (0.05) (1.91) (2.39) (0.93) (0.91) Z 0.09* -0.19* 0.02 0.07* -0.52* 0.28 0.23 0.46* (0.01) (0.02) (0.01) (0.01) (0.24) (0.33) (0.21) (0.19) Z × S 0.00 0.03 0.01 0.00 0.24 -0.05 0.04 -0.41 (0.02) (0.02) (0.02) (0.01) (0.32) (0.44) (0.28) (0.25) Z × G -0.03 0.06* 0.01 -0.05* 1.06* -1.03* -0.53 -0.47 (0.02) (0.02) (0.02) (0.01) (0.31) (0.43) (0.29) (0.26) Z × B -0.01 -0.01 -0.04* -0.04* 0.14 -0.28 -0.02 -0.75* (0.02) (0.02) (0.02) (0.01) (0.31) (0.44) (0.29) (0.25)
Z = % White (10s)
% FRPL (10s)
Est. S – Act. S (10s)
Est. G – Act. G (10s)
% White (10s)
% FRPL (10s)
Est. S – Act. S (10s)
Est. G – Act. G (10s)
Observations 3,003 3,003 2,934 2,931 3,036 3,036 2,943 2,939 Note. Values are WLS coefficients (standard errors in parentheses); analyses incorporate survey weights and include all individual-level covariates; * p < 0.05


![Blooms Presentation [Read-Only] - WordPress.com · 2012. 10. 24. · EVAAS Growth School-wide Status Indicators “this year” (status of sub-groups are included) Growth Indicators](https://img.pdfslide.net/doc/110x75/6003d46a77fa8a68fe7ed4cf/blooms-presentation-read-only-2012-10-24-evaas-growth-school-wide-status.jpg)