Embed Size (px)
Citation preview
2 Status of Human Development

Tamil Nadu HumaN developmeNT RepoRTStatus of Human development
33Chapter 2
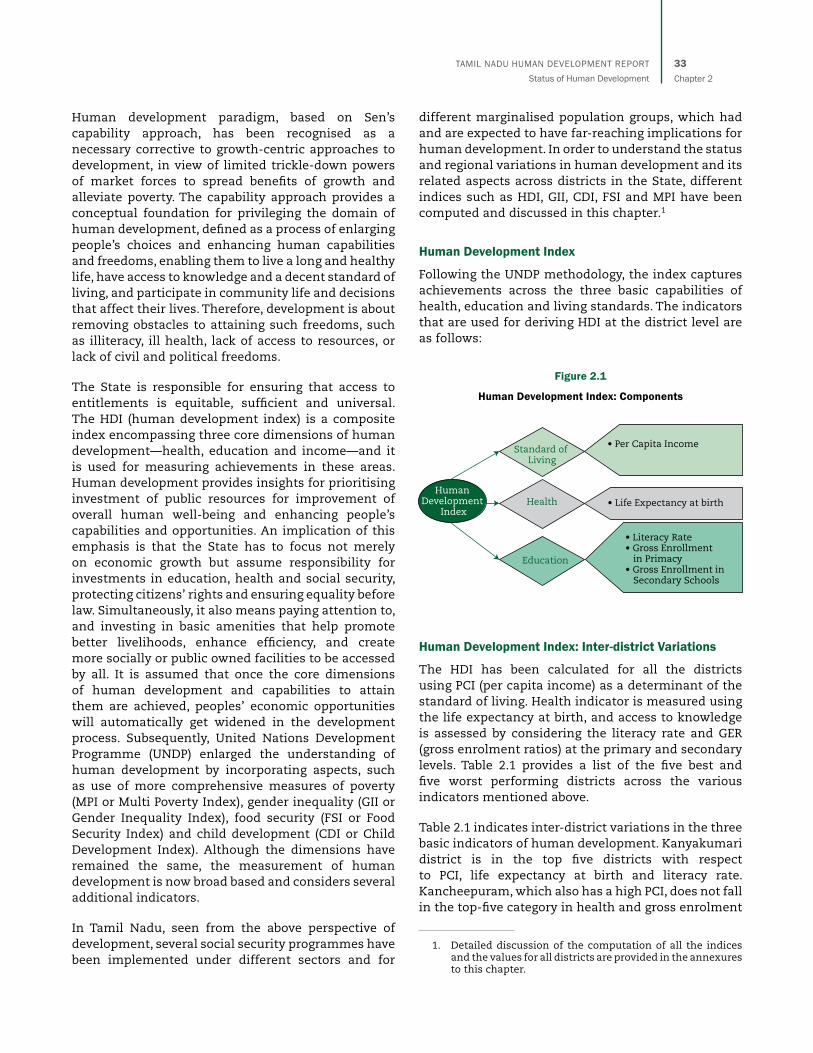
Human development paradigm, based on Sen’s capability approach, has been recognised as a necessary corrective to growth-centric approaches to development, in view of limited trickle-down powers of market forces to spread benefits of growth and alleviate poverty. The capability approach provides a conceptual foundation for privileging the domain of human development, defined as a process of enlarging people’s choices and enhancing human capabilities and freedoms, enabling them to live a long and healthy life, have access to knowledge and a decent standard of living, and participate in community life and decisions that affect their lives. Therefore, development is about removing obstacles to attaining such freedoms, such as illiteracy, ill health, lack of access to resources, or lack of civil and political freedoms.
The State is responsible for ensuring that access to entitlements is equitable, sufficient and universal. The HDI (human development index) is a composite index encompassing three core dimensions of human development—health, education and income—and it is used for measuring achievements in these areas. Human development provides insights for prioritising investment of public resources for improvement of overall human well-being and enhancing people’s capabilities and opportunities. An implication of this emphasis is that the State has to focus not merely on economic growth but assume responsibility for investments in education, health and social security, protecting citizens’ rights and ensuring equality before law. Simultaneously, it also means paying attention to, and investing in basic amenities that help promote better livelihoods, enhance efficiency, and create more socially or public owned facilities to be accessed by all. It is assumed that once the core dimensions of human development and capabilities to attain them are achieved, peoples’ economic opportunities will automatically get widened in the development process. Subsequently, United Nations Development Programme (UNDP) enlarged the understanding of human development by incorporating aspects, such as use of more comprehensive measures of poverty (MPI or Multi Poverty Index), gender inequality (GII or Gender Inequality Index), food security (FSI or Food Security Index) and child development (CDI or Child Development Index). Although the dimensions have remained the same, the measurement of human development is now broad based and considers several additional indicators.
In Tamil Nadu, seen from the above perspective of development, several social security programmes have been implemented under different sectors and for
different marginalised population groups, which had and are expected to have far-reaching implications for human development. In order to understand the status and regional variations in human development and its related aspects across districts in the State, different indices such as HDI, GII, CDI, FSI and MPI have been computed and discussed in this chapter.1
Human Development Index
Following the UNDP methodology, the index captures achievements across the three basic capabilities of health, education and living standards. The indicators that are used for deriving HDI at the district level are as follows:
Figure 2.1
Human Development Index: Components
Human Development Index: Inter-district Variations
The HDI has been calculated for all the districts using PCI (per capita income) as a determinant of the standard of living. Health indicator is measured using the life expectancy at birth, and access to knowledge is assessed by considering the literacy rate and GER (gross enrolment ratios) at the primary and secondary levels. Table 2.1 provides a list of the five best and five worst performing districts across the various indicators mentioned above.
Table 2.1 indicates inter-district variations in the three basic indicators of human development. Kanyakumari district is in the top five districts with respect to PCI, life expectancy at birth and literacy rate. Kancheepuram, which also has a high PCI, does not fall in the top-five category in health and gross enrolment
1. Detailed discussion of the computation of all the indices and the values for all districts are provided in the annexures to this chapter.
Human Development
Index
Standard of Living
Health
Education
• Per Capita Income
• Life Expectancy at birth
• Literacy Rate• Gross Enrollment in Primacy• Gross Enrollment in Secondary Schools

Tamil Nadu HumaN developmeNT RepoRTStatus of Human development
34Chapter 2
Table 2.1
Top and Bottom Five Districts in Human Development Indicators
Table Indicators Top 5 Bottom 5 (from lowest to higher)
Standard of living: Per Capita Income Kanyakumari
Kancheepuram
Tiruppur
Virudhunagar
Tiruvallur
Ariyalur
Perambalur
Thiruvarur
Villupuram
Theni
Life Expectancy at Birth Chennai
Kanyakumari
Coimbatore
Thoothukudi
Krishnagiri
Tiruppur
The Nilgiris
Theni
Nagapattinam
Madurai
Literacy Rate Kanyakumari
Chennai
Thoothukudi
The Nilgiris
Kancheepuram
Dharmapuri
Ariyalur
Villupuram
Erode
Salem
GER- Primary The Nilgiris
Ramanathapuram
Perambalur
Pudukottai
Tiruvarur
Tiruppur
Ariyalur
Chennai
Tiruvanamalai
Cuddalore
GER – Secondary Dharmapuri
Nagapattinam
Perambalur
Thanjavur
Krishnagiri
Erode
Karur
Villupuram
Chennai
Tiruvanamalai
Source: Calculated from data provided by the Departments, Government of Tamil Nadu, 2013-14.
indicators. Tiruppur district, despite ranking high in PCI, performs poorly in health and education. While such anomalies across these dimensions exist in some districts, there are districts, like Ariyalur, which ranks among the bottom five districts in most parameters, such as PCI, literacy rate and GER for primary school. Clearly, interventions in such districts need to be more broad-based, as opposed to designing sector-specific interventions in districts such as Tiruppur that have high living standards but without comparable attainments in health or education.
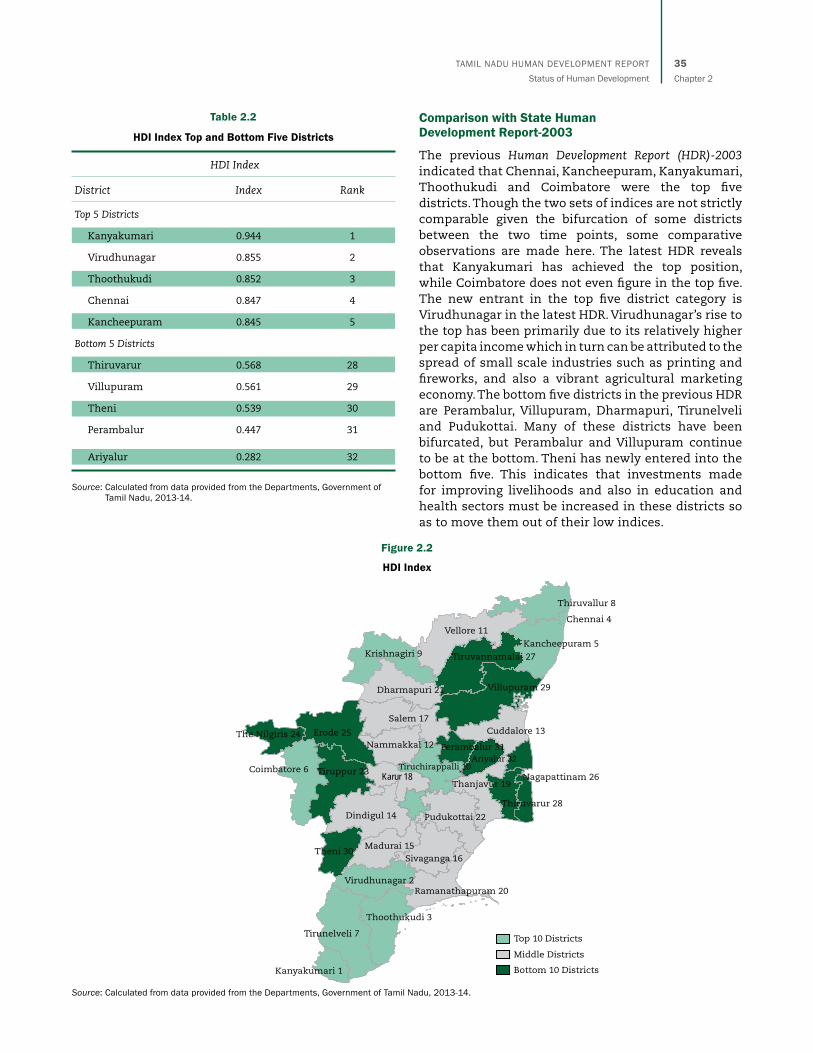
Computation of the district level human development indices reveal the following pattern of ranking presented in Table 2.2.
Kanyakumari is the district with the highest HDI and Ariyalur has the lowest HDI. Thoothukudi, with high life expectancy at birth and high literacy rate, finds itself in the top five districts. Ariyalur and Perambalur, due to its PCI being so low, are placed in the bottom five districts. Coimbatore, in spite of its high degree of industrialisation and PCI, does not figure in the top five districts with high HDI.It goes on to show that high PCI does not necessarily translate into high human development indices, unless accompanied by investments made in the education, health and other social sectors.
Tamil Nadu HumaN developmeNT RepoRTStatus of Human development
35Chapter 2
Figure 2.2
HDI Index
Source: Calculated from data provided from the Departments, Government of Tamil Nadu, 2013-14.
Table 2.2
HDI Index Top and Bottom Five Districts
HDI Index
District Index Rank
Top 5 Districts
Kanyakumari 0.944 1
Virudhunagar 0.855 2
Thoothukudi 0.852 3
Chennai 0.847 4
Kancheepuram 0.845 5
Bottom 5 Districts
Thiruvarur 0.568 28
Villupuram 0.561 29
Theni 0.539 30
Perambalur 0.447 31
Ariyalur 0.282 32
Source: Calculated from data provided from the Departments, Government of Tamil Nadu, 2013-14.
Comparison with State Human Development Report-2003
The previous Human Development Report (HDR)-2003 indicated that Chennai, Kancheepuram, Kanyakumari, Thoothukudi and Coimbatore were the top five districts. Though the two sets of indices are not strictly comparable given the bifurcation of some districts between the two time points, some comparative observations are made here. The latest HDR reveals that Kanyakumari has achieved the top position, while Coimbatore does not even figure in the top five. The new entrant in the top five district category is Virudhunagar in the latest HDR. Virudhunagar’s rise to the top has been primarily due to its relatively higher per capita income which in turn can be attributed to the spread of small scale industries such as printing and fireworks, and also a vibrant agricultural marketing economy. The bottom five districts in the previous HDR are Perambalur, Villupuram, Dharmapuri, Tirunelveli and Pudukottai. Many of these districts have been bifurcated, but Perambalur and Villupuram continue to be at the bottom. Theni has newly entered into the bottom five. This indicates that investments made for improving livelihoods and also in education and health sectors must be increased in these districts so as to move them out of their low indices.
Salem 17
Thiruvallur 8
Tiruvannamalai 27
Villupuram 29
Kancheepuram 5
Dharmapuri 21
The Nilgiris 24 Cuddalore 13
Thoothukudi 3
Top 10 Districts
Sivaganga 16Madurai 15
Karur 18Tiruppur 23
Nammakkal 12
Coimbatore 6
Theni 30
Ariyalur 32
Thiruvarur 28
Vellore 11
Tirunelveli 7
Virudhunagar 2
Dindigul 14
Perambalur 31
Erode 25
Pudukottai 22
Thanjavur 19
Krishnagiri 9
Ramanathapuram 20
Chennai 4
Tiruchirappalli 10Nagapattinam 26
Kanyakumari 1
Middle Districts
Bottom 10 Districts
Tamil Nadu HumaN developmeNT RepoRTStatus of Human development
36Chapter 2
Gender Inequality Index
Disadvantages and discrimination faced by women and girls in the domains of access to health, education and the labour market foster gender inequalities in human development achievement. Equality between men and women exists, when both sexes have equal share in the distribution of power and influence; have equal possibilities for financial resources through businesses opportunities; enjoy equal access to education and the opportunity to develop personal ambitions, interests and talents; share responsibility for the home and children; and are completely free from coercion, intimidation and gender-based violence at work and at home (Engelman, 2009). Addressing the issue of gender inequality in the above-said domains therefore, is critical to accelerate human development.
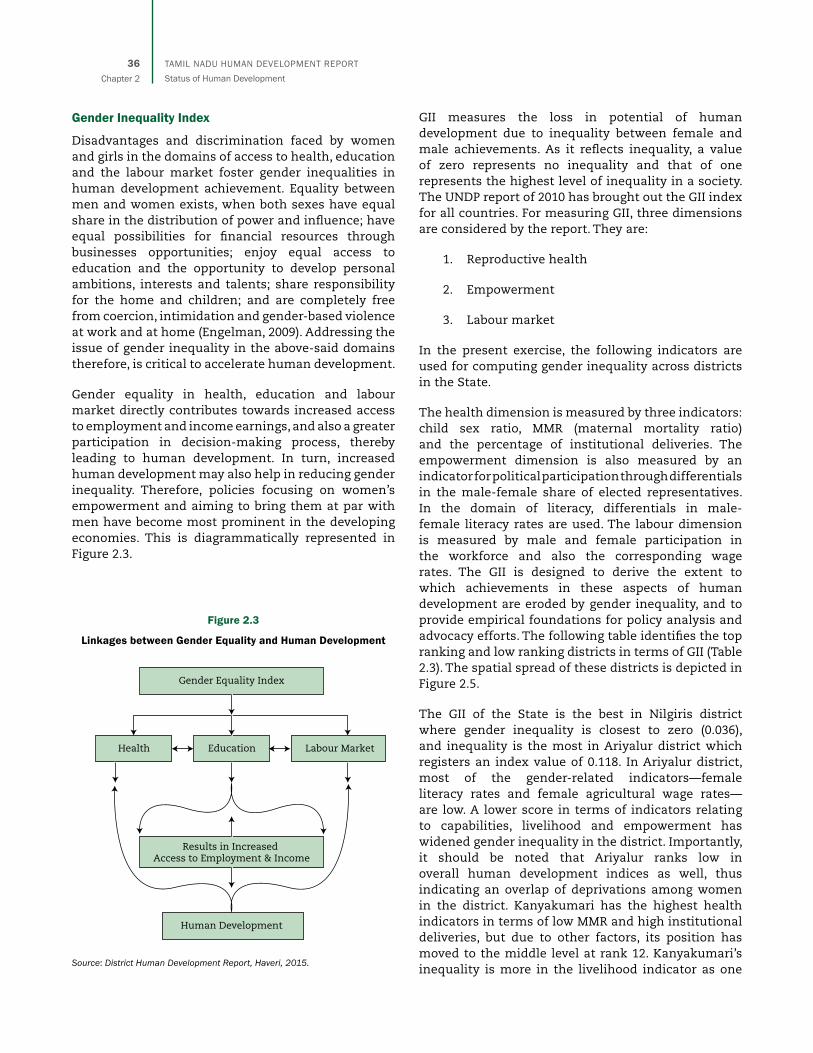
Gender equality in health, education and labour market directly contributes towards increased access to employment and income earnings, and also a greater participation in decision-making process, thereby leading to human development. In turn, increased human development may also help in reducing gender inequality. Therefore, policies focusing on women’s empowerment and aiming to bring them at par with men have become most prominent in the developing economies. This is diagrammatically represented in Figure 2.3.
GII measures the loss in potential of human development due to inequality between female and male achievements. As it reflects inequality, a value of zero represents no inequality and that of one represents the highest level of inequality in a society. The UNDP report of 2010 has brought out the GII index for all countries. For measuring GII, three dimensions are considered by the report. They are:
1. Reproductive health
2. Empowerment
3. Labour market
In the present exercise, the following indicators are used for computing gender inequality across districts in the State.
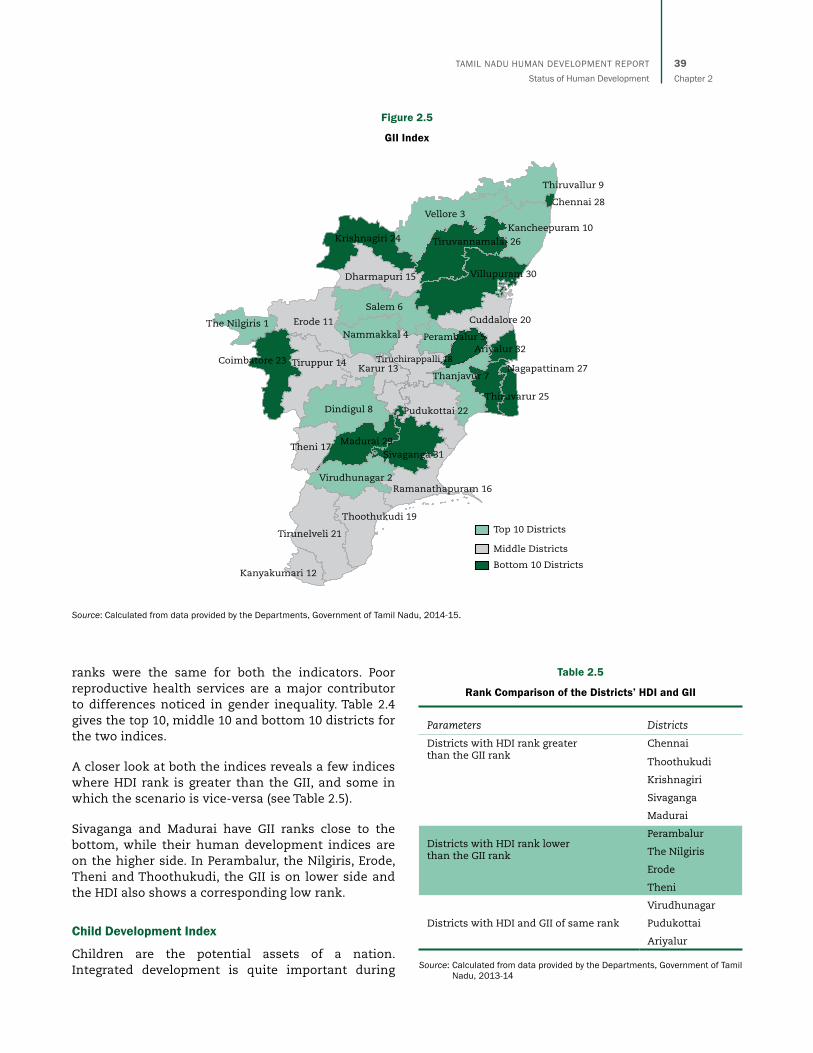
The health dimension is measured by three indicators: child sex ratio, MMR (maternal mortality ratio) and the percentage of institutional deliveries. The empowerment dimension is also measured by an indicator for political participation through differentials in the male-female share of elected representatives. In the domain of literacy, differentials in male-female literacy rates are used. The labour dimension is measured by male and female participation in the workforce and also the corresponding wage rates. The GII is designed to derive the extent to which achievements in these aspects of human development are eroded by gender inequality, and to provide empirical foundations for policy analysis and advocacy efforts. The following table identifies the top ranking and low ranking districts in terms of GII (Table 2.3). The spatial spread of these districts is depicted in Figure 2.5.
The GII of the State is the best in Nilgiris district where gender inequality is closest to zero (0.036), and inequality is the most in Ariyalur district which registers an index value of 0.118. In Ariyalur district, most of the gender-related indicators—female literacy rates and female agricultural wage rates—are low. A lower score in terms of indicators relating to capabilities, livelihood and empowerment has widened gender inequality in the district. Importantly, it should be noted that Ariyalur ranks low in overall human development indices as well, thus indicating an overlap of deprivations among women in the district. Kanyakumari has the highest health indicators in terms of low MMR and high institutional deliveries, but due to other factors, its position has moved to the middle level at rank 12. Kanyakumari’s inequality is more in the livelihood indicator as one
Gender Equality Index
Results in Increased Access to Employment & Income
Human Development
Health Education Labour Market
Figure 2.3
Linkages between Gender Equality and Human Development
Source: District Human Development Report, Haveri, 2015.

Tamil Nadu HumaN developmeNT RepoRTStatus of Human development
37Chapter 2
Figure 2.4
Components of Gender Inequality Index
Table 2.3
GII Index
District Index Rank District Index Rank District Index Rank
Top 5 Districts Middle 5 Districts Bottom 5 Districts
The Nilgiris 0.036 1 Erode 0.065 11 Chennai 0.111 28
Virudhunagar 0.048 2 Kanyakumari 0.066 12 Madurai 0.112 29
Vellore 0.051 3 Karur 0.07 13 Villupuram 0.113 30
Nammakkal 0.054 4 Tiruppur 0.07 14 Sivaganga 0.114 31
Perambalur 0.057 5 Dharmapuri 0.074 15 Ariyalur 0.118 32
Source: Calculated from data provided by the Departments, Government of Tamil Nadu, 2014-15.
finds that female wage rate is only half of the male and their workforce participation rate is also much lower. Although participation rates may not actually indicate loss of economic power as revealed by micro-level studies (Jeyaranjan 2011), it is a conventionally used indicator. Madurai is one of the districts with high MMR and so it is placed within the bottom five districts in GII. Virudhunagar has the highest female political representation, while Nilgiris registers the lowest. Female agricultural wage was the highest in Salem (`258.11) and lowest in Villupuram (`74.88). The
latter is a contributing factor for Villupuram district in order to be featured among districts with the highest levels of gender inequality. Female workforce participation rate is the highest in Perambalur and lowest in Kancheepuram (16.4).
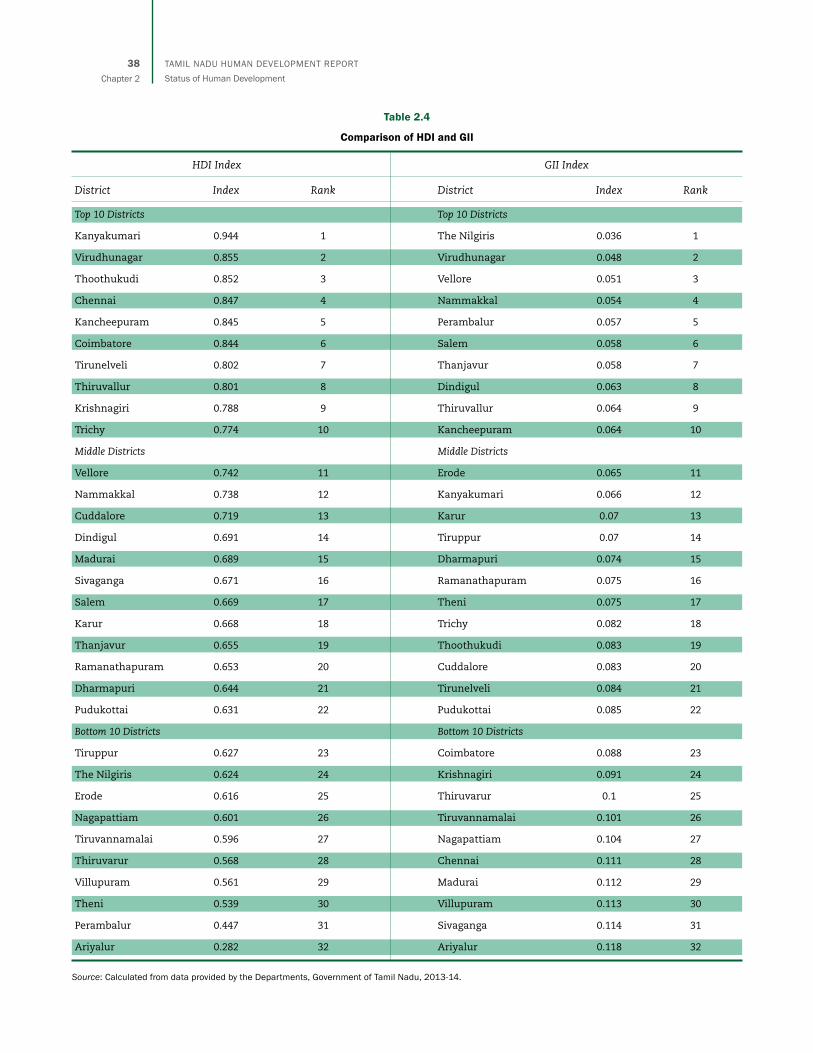
Comparison of HDI and GII
This section attempts to compare the ranks of districts in terms of HDI and GII. It was found that in three districts—Virudhunagar, Pudukottai and Ariyalur—
Gender Inequality
Index
Reproductive Health
• MMR• Percentage of Institutional Deliveries• Percentage of Male and Female children in the age group of 0-6 years
Empowerment
Labour Market
• Share of Female and Male Literacy Rate• Share of Female and Male elected representatives in RLBs and ULBs
• Female and Male work participation rate• Female and Male Agricultural Wage rate
Tamil Nadu HumaN developmeNT RepoRTStatus of Human development
38Chapter 2
Table 2.4
Comparison of HDI and GII
HDI Index GII Index
District Index Rank District Index Rank
Top 10 Districts Top 10 Districts
Kanyakumari 0.944 1 The Nilgiris 0.036 1
Virudhunagar 0.855 2 Virudhunagar 0.048 2
Thoothukudi 0.852 3 Vellore 0.051 3
Chennai 0.847 4 Nammakkal 0.054 4
Kancheepuram 0.845 5 Perambalur 0.057 5
Coimbatore 0.844 6 Salem 0.058 6
Tirunelveli 0.802 7 Thanjavur 0.058 7
Thiruvallur 0.801 8 Dindigul 0.063 8
Krishnagiri 0.788 9 Thiruvallur 0.064 9
Trichy 0.774 10 Kancheepuram 0.064 10
Middle Districts Middle Districts
Vellore 0.742 11 Erode 0.065 11
Nammakkal 0.738 12 Kanyakumari 0.066 12
Cuddalore 0.719 13 Karur 0.07 13
Dindigul 0.691 14 Tiruppur 0.07 14
Madurai 0.689 15 Dharmapuri 0.074 15
Sivaganga 0.671 16 Ramanathapuram 0.075 16
Salem 0.669 17 Theni 0.075 17
Karur 0.668 18 Trichy 0.082 18
Thanjavur 0.655 19 Thoothukudi 0.083 19
Ramanathapuram 0.653 20 Cuddalore 0.083 20
Dharmapuri 0.644 21 Tirunelveli 0.084 21
Pudukottai 0.631 22 Pudukottai 0.085 22
Bottom 10 Districts Bottom 10 Districts
Tiruppur 0.627 23 Coimbatore 0.088 23
The Nilgiris 0.624 24 Krishnagiri 0.091 24
Erode 0.616 25 Thiruvarur 0.1 25
Nagapattiam 0.601 26 Tiruvannamalai 0.101 26
Tiruvannamalai 0.596 27 Nagapattiam 0.104 27
Thiruvarur 0.568 28 Chennai 0.111 28
Villupuram 0.561 29 Madurai 0.112 29
Theni 0.539 30 Villupuram 0.113 30
Perambalur 0.447 31 Sivaganga 0.114 31
Ariyalur 0.282 32 Ariyalur 0.118 32
Source: Calculated from data provided by the Departments, Government of Tamil Nadu, 2013-14.
Tamil Nadu HumaN developmeNT RepoRTStatus of Human development
39Chapter 2
ranks were the same for both the indicators. Poor reproductive health services are a major contributor to differences noticed in gender inequality. Table 2.4 gives the top 10, middle 10 and bottom 10 districts for the two indices.
A closer look at both the indices reveals a few indices where HDI rank is greater than the GII, and some in which the scenario is vice-versa (see Table 2.5).
Sivaganga and Madurai have GII ranks close to the bottom, while their human development indices are on the higher side. In Perambalur, the Nilgiris, Erode, Theni and Thoothukudi, the GII is on lower side and the HDI also shows a corresponding low rank.
Child Development Index
Children are the potential assets of a nation. Integrated development is quite important during
Figure 2.5
GII Index
Source: Calculated from data provided by the Departments, Government of Tamil Nadu, 2014-15.
Salem 6
Thiruvallur 9
Tiruvannamalai 26
Villupuram 30
Kancheepuram 10
Dharmapuri 15
The Nilgiris 1 Cuddalore 20
Thoothukudi 19Top 10 Districts
Sivaganga 31Madurai 29
Karur 13Tiruppur 14
Nammakkal 4
Coimbatore 23
Theni 17
Ariyalur 32
Thiruvarur 25
Vellore 3
Tirunelveli 21
Virudhunagar 2
Dindigul 8
Perambalur 5
Erode 11
Pudukottai 22
Thanjavur 7
Krishnagiri 24
Ramanathapuram 16
Chennai 28
Tiruchirappalli 18Nagapattinam 27
Kanyakumari 12
Middle Districts
Bottom 10 Districts
Table 2.5
Rank Comparison of the Districts’ HDI and GII
Parameters Districts
Districts with HDI rank greater than the GII rank
Chennai
Thoothukudi
Krishnagiri
Sivaganga
Madurai
Districts with HDI rank lower than the GII rank
Perambalur
The Nilgiris
Erode
Theni
Districts with HDI and GII of same rank
Virudhunagar
Pudukottai
Ariyalur
Source: Calculated from data provided by the Departments, Government of Tamil Nadu, 2013-14
Tamil Nadu HumaN developmeNT RepoRTStatus of Human development
40Chapter 2
their childhood, the period during which most of their cognitive, emotional and social skills and physical development as individuals, takes place. Computation of CDI helps policy makers to promote and develop public policies dedicated towards development of children. The CDI was developed by the “Save the Children” campaign in the United Kingdom (UK), in 2008, with the contributions of Terry McKinley, Director of the Centre for Development Policy and Research at the School of Oriental and African Studies (SOAS), University of London, with support from Katerina Kyrili. The indicators of CDI conventionally used are related to health, nutrition and education. The selected indicators are chosen because they are easily available, commonly understood, and clearly indicative of children’s well-being. At the international level, the three indicators used for measuring CDI are:
• Health: Under-five mortality rate (the probability of dying between birth and five years of age, expressed as a percentage on a scale of 0 to 340 deaths per 1,000 live births). This means that a zero score in this component equals an under-five mortality rate of 0 deaths per 1,000 live births, and a score of 100 implies upper bound of 340 deaths per 1,000 live births.
• Nutrition: The percentage of children below five years who are moderately or severely under-weight. The common definition of moderately or severely under-weight, which has been used, is being below two standard deviations of the median weight for age of the reference population.
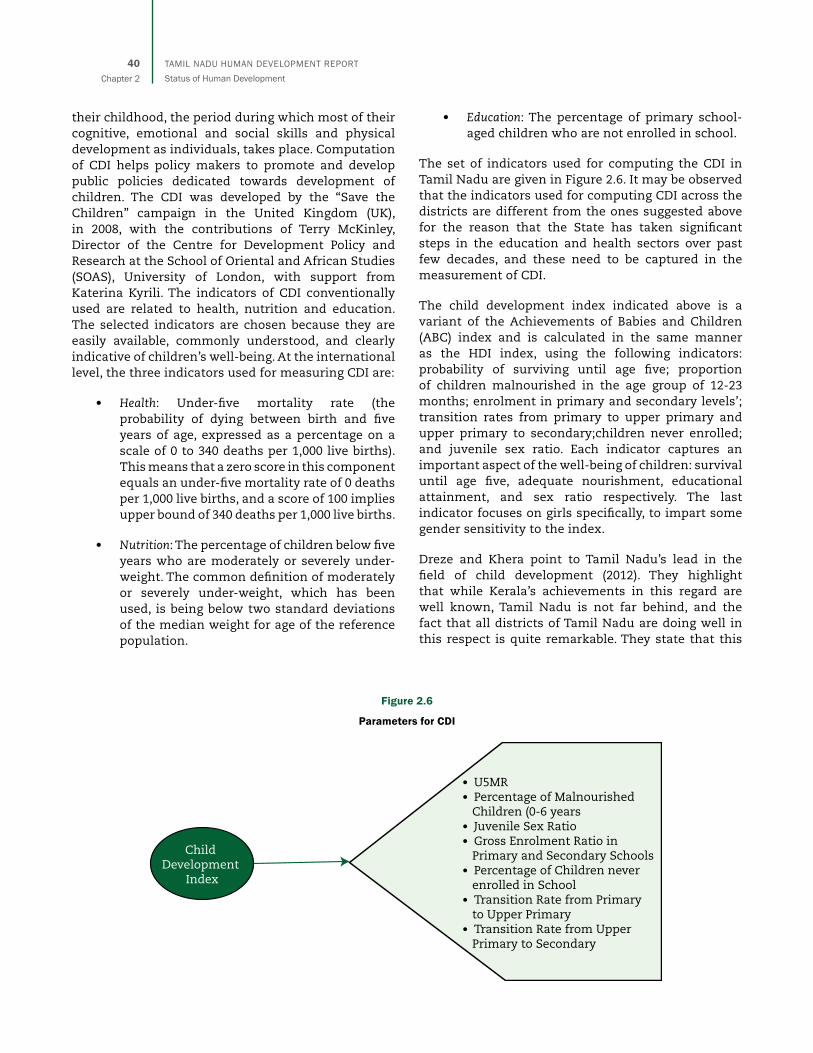
• Education: The percentage of primary school-aged children who are not enrolled in school.
The set of indicators used for computing the CDI in Tamil Nadu are given in Figure 2.6. It may be observed that the indicators used for computing CDI across the districts are different from the ones suggested above for the reason that the State has taken significant steps in the education and health sectors over past few decades, and these need to be captured in the measurement of CDI.
The child development index indicated above is a variant of the Achievements of Babies and Children (ABC) index and is calculated in the same manner as the HDI index, using the following indicators: probability of surviving until age five; proportion of children malnourished in the age group of 12-23 months; enrolment in primary and secondary levels’; transition rates from primary to upper primary and upper primary to secondary;children never enrolled; and juvenile sex ratio. Each indicator captures an important aspect of the well-being of children: survival until age five, adequate nourishment, educational attainment, and sex ratio respectively. The last indicator focuses on girls specifically, to impart some gender sensitivity to the index.
Dreze and Khera point to Tamil Nadu’s lead in the field of child development (2012). They highlight that while Kerala’s achievements in this regard are well known, Tamil Nadu is not far behind, and the fact that all districts of Tamil Nadu are doing well in this respect is quite remarkable. They state that this
Figure 2.6
Parameters for CDI
Child Development
Index
• U5MR• Percentage of Malnourished Children (0-6 years• Juvenile Sex Ratio• Gross Enrolment Ratio in Primary and Secondary Schools• Percentage of Children never enrolled in School• Transition Rate from Primary to Upper Primary• Transition Rate from Upper Primary to Secondary
Tamil Nadu HumaN developmeNT RepoRTStatus of Human development
41Chapter 2
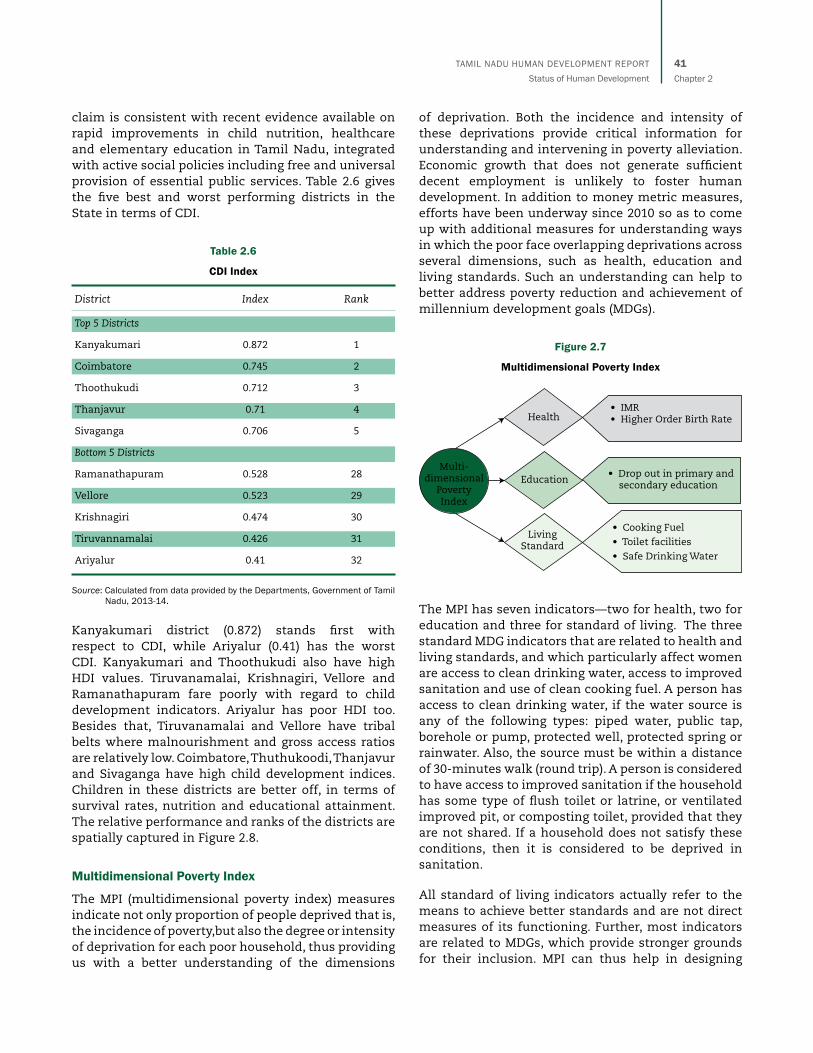
of deprivation. Both the incidence and intensity of these deprivations provide critical information for understanding and intervening in poverty alleviation. Economic growth that does not generate sufficient decent employment is unlikely to foster human development. In addition to money metric measures, efforts have been underway since 2010 so as to come up with additional measures for understanding ways in which the poor face overlapping deprivations across several dimensions, such as health, education and living standards. Such an understanding can help to better address poverty reduction and achievement of millennium development goals (MDGs).
Figure 2.7
Multidimensional Poverty Index
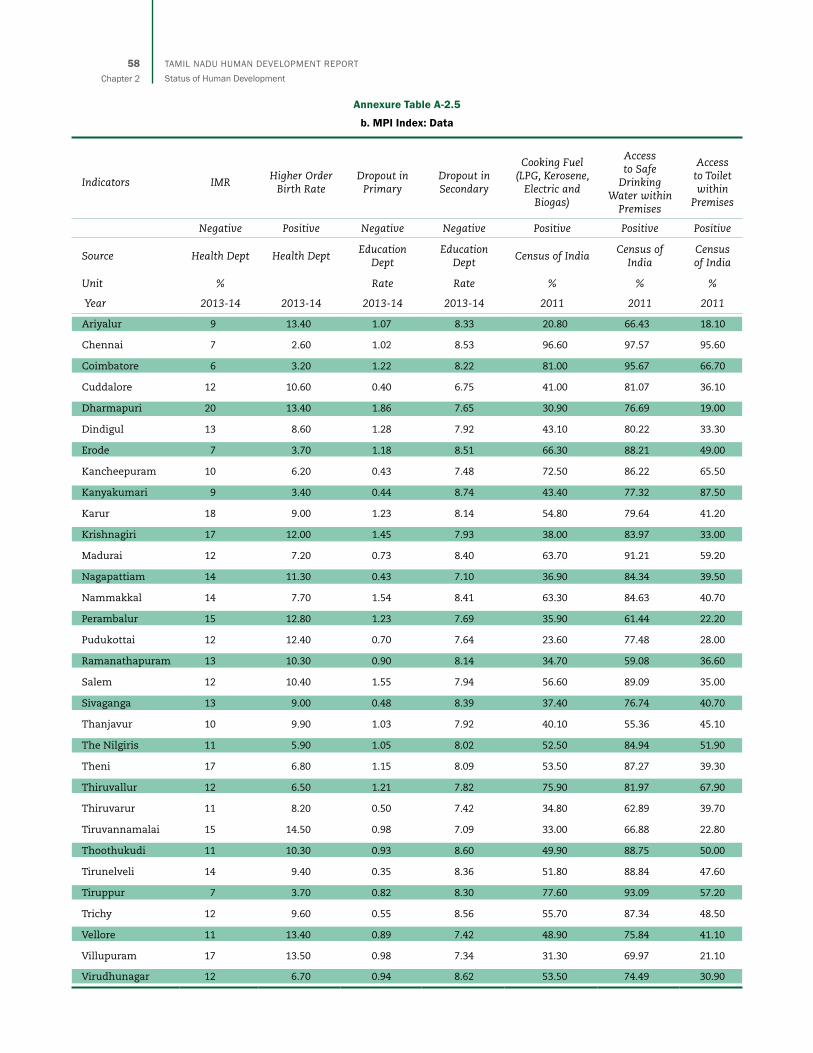
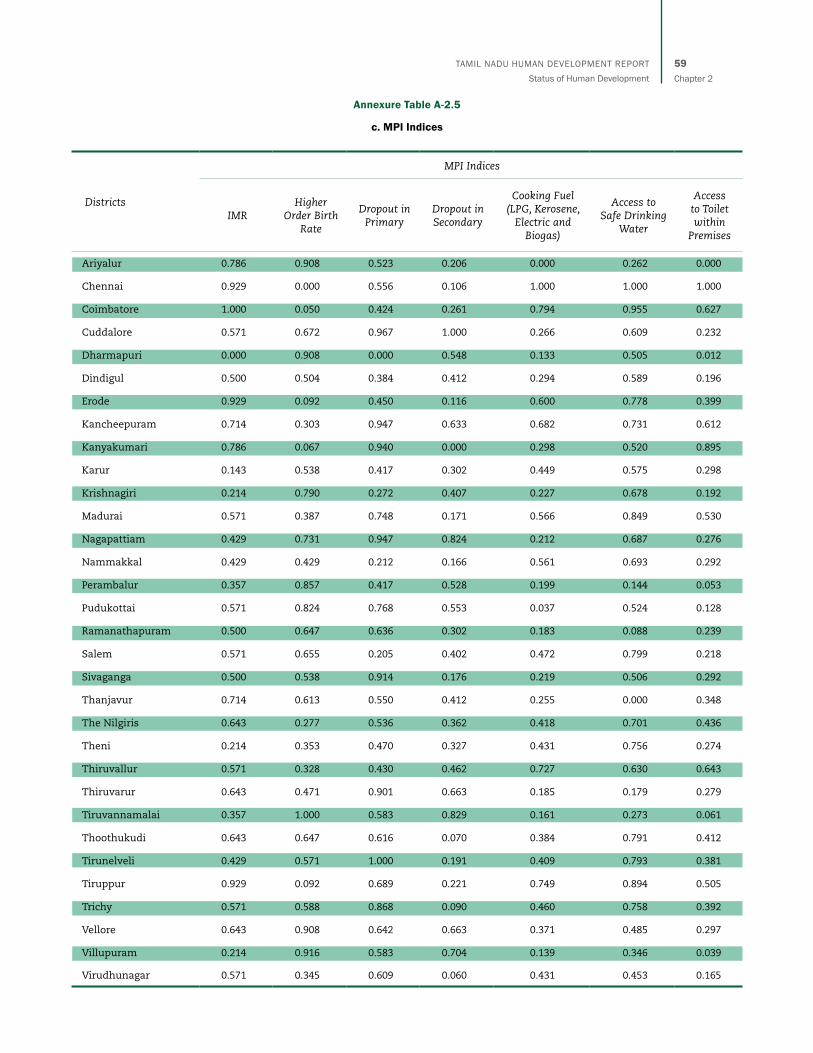
The MPI has seven indicators—two for health, two for education and three for standard of living. The three standard MDG indicators that are related to health and living standards, and which particularly affect women are access to clean drinking water, access to improved sanitation and use of clean cooking fuel. A person has access to clean drinking water, if the water source is any of the following types: piped water, public tap, borehole or pump, protected well, protected spring or rainwater. Also, the source must be within a distance of 30-minutes walk (round trip). A person is considered to have access to improved sanitation if the household has some type of flush toilet or latrine, or ventilated improved pit, or composting toilet, provided that they are not shared. If a household does not satisfy these conditions, then it is considered to be deprived in sanitation.
All standard of living indicators actually refer to the means to achieve better standards and are not direct measures of its functioning. Further, most indicators are related to MDGs, which provide stronger grounds for their inclusion. MPI can thus help in designing
claim is consistent with recent evidence available on rapid improvements in child nutrition, healthcare and elementary education in Tamil Nadu, integrated with active social policies including free and universal provision of essential public services. Table 2.6 gives the five best and worst performing districts in the State in terms of CDI.
Table 2.6
CDI Index
District Index Rank
Top 5 Districts
Kanyakumari 0.872 1
Coimbatore 0.745 2
Thoothukudi 0.712 3
Thanjavur 0.71 4
Sivaganga 0.706 5
Bottom 5 Districts
Ramanathapuram 0.528 28
Vellore 0.523 29
Krishnagiri 0.474 30
Tiruvannamalai 0.426 31
Ariyalur 0.41 32
Source: Calculated from data provided by the Departments, Government of Tamil Nadu, 2013-14.
Kanyakumari district (0.872) stands first with respect to CDI, while Ariyalur (0.41) has the worst CDI. Kanyakumari and Thoothukudi also have high HDI values. Tiruvanamalai, Krishnagiri, Vellore and Ramanathapuram fare poorly with regard to child development indicators. Ariyalur has poor HDI too. Besides that, Tiruvanamalai and Vellore have tribal belts where malnourishment and gross access ratios are relatively low. Coimbatore, Thuthukoodi, Thanjavur and Sivaganga have high child development indices. Children in these districts are better off, in terms of survival rates, nutrition and educational attainment. The relative performance and ranks of the districts are spatially captured in Figure 2.8.
Multidimensional Poverty Index
The MPI (multidimensional poverty index) measures indicate not only proportion of people deprived that is, the incidence of poverty,but also the degree or intensity of deprivation for each poor household, thus providing us with a better understanding of the dimensions
Multi-dimensional
Poverty Index
Health • IMR • Higher Order Birth Rate
• Drop out in primary and secondary education
• Cooking Fuel• Toilet facilities• Safe Drinking Water
Education
Living Standard

Tamil Nadu HumaN developmeNT RepoRTStatus of Human development
42Chapter 2
Figure 2.8
CDI Index
Source: Calculated from data provided by the Departments, Government of Tamil Nadu, 2013-14.
and formulating policies that are more effective in addressing poverty by identifying interconnections, monitoring impacts and allocations of resources effectively. The performance of districts on these parameters is given in Table 2.7 and spatially illustrated in Figure 2.9.
It is evident from the above table that Dharmapuri has the highest multidimensional poverty index and Kancheepuram ranks the lowest. The table also indicates that Dharmapuri, Perambalur, Virudhunagar and Ariyalur are the districts with the largest proportion of population in severe poverty, requiring targeted interventions. Dharmapuri has poor health,
education and also standard of living indicators, high infant mortality rate (IMR) and low sanitation coverage. Perambalur, Virudhunagar and Ariyalur are also districts which have multiple deprivations in terms of health, education and standard of living. Kancheepuram and Chennai have the least level of deprivations, and both of them appear to be highly urbanised, well connected and have greater access to education and health facilities. The table on MPI values indicates that they are not highly divergent and many of the districts’ values lie close together, indicating that even in the district with the lowest multidimensional poverty, there is scope for improving the values.
Salem 27
Thiruvallur 14
Tiruvannamalai 31
Villupuram 26
Kancheepuram 9
Dharmapuri 22
The Nilgiris 8 Cuddalore 24
Thoothukudi 3Top 10 Districts
Sivaganga 5Madurai 15
Karur 25Tiruppur 17
Nammakkal 7
Coimbatore 2
Theni 16
Ariyalur 32
Thiruvarur 10
Vellore 29
Tirunelveli 18
Virudhunagar 11
Dindigul 20
Perambalur 13
Erode 21
Pudukottai 23
Thanjavur 4
Krishnagiri 30
Ramanathapuram 28
Chennai 19
Tiruchirappalli 6Nagapattinam 12
Kanyakumari 1
Middle Districts
Bottom 10 Districts

Tamil Nadu HumaN developmeNT RepoRTStatus of Human development
43Chapter 2
Figure 2.9
MPI Index
Source: Calculated from data provided by the Departments, Government of Tami Nadu, 2013-14.
Table 2.7
MPI Index
District Index Rank
Top 5 Districts
Kancheepuram 0.34 1
Chennai 0.34 2
Cuddalore 0.38 3
Coimbatore 0.41 4
Nagapattiam 0.41 5
Bottom 5 Districts
Ariyalur 0.62 28
Virudhunagar 0.62 29
Ramanathapuram 0.63 30
Perambalur 0.63 31
Dharmapuri 0.7 32
Source: Calculated from data provided by the Departments, Government of Tamil Nadu, 2013-14.
Salem 17
Thiruvallur 9
Tiruvannamalai 19
Villupuram 21
Kancheepuram 1
Dharmapuri 32
The Nilgiris 15 Cuddalore 3
Thoothukudi 12Top 10 Districts
Sivaganga 20Madurai 8
Karur 27Tiruppur 6
Nammakkal 25
Coimbatore 4
Theni 24
Ariyalur 28
Thiruvarur 18
Vellore 7
Tirunelveli 10
Virudhunagar 29
Dindigul 23
Perambalur 31
Erode 16
Pudukottai 14
Thanjavur 22
Krishnagiri 26
Ramanathapuram 30
Chennai 2
Tiruchirappalli 11Nagapattinam 5
Kanyakumari 13
Middle Districts
Bottom 10 Districts
Tamil Nadu HumaN developmeNT RepoRTStatus of Human development
44Chapter 2
Food Security Index
In India, the dimension of food security is important despite attaining self-sufficiency in food production. Though there has been a considerable improvement in productivity and production of rice and wheat, we have not been able to eliminate chronic hunger and poverty. Understanding of the different dimensions of food security, therefore, is of critical importance. The concept of food security in the Indian context has been increasingly refined during the last 50 years. After World War II, food security meant building emergency grain reserves and ensuring the physical availability of food in the market. After the onset of green revolution in the late 1960s, it became obvious that economic access to food is equally important to ensure food security at the household level. During the 1980s, the principle of social access was emphasised, with special reference to marginalised communities and gender discrimination. After the United Nations Conference on Environment and Development (UNCED) conference in Rio de Janeiro, there has been an increasing recognition of the role of environmental factors in food security. The ecological foundations essential for sustained agricultural progress are increasingly under stress due to human activities. One of the early initiatives in assessing the food security scenario in the country was the release of a series of Atlases by M.S. Swaminathan Research Foundation (MSSRF) that looked into the food security in rural and urban areas and also the Sustainability of Food Security atlas of India.
Ensuring food security is an overall objective of development programmes in most developing economies like India. Several problems, such as hunger, malnutrition, under-nutrition and poverty,
Figure 2.10
Association between Food Insecurity and Poverty
Poverty
Low productivity
Human Development
Food insecurity, hunger &
Malnutrition
Poor physical &
Cognitivedevelopment
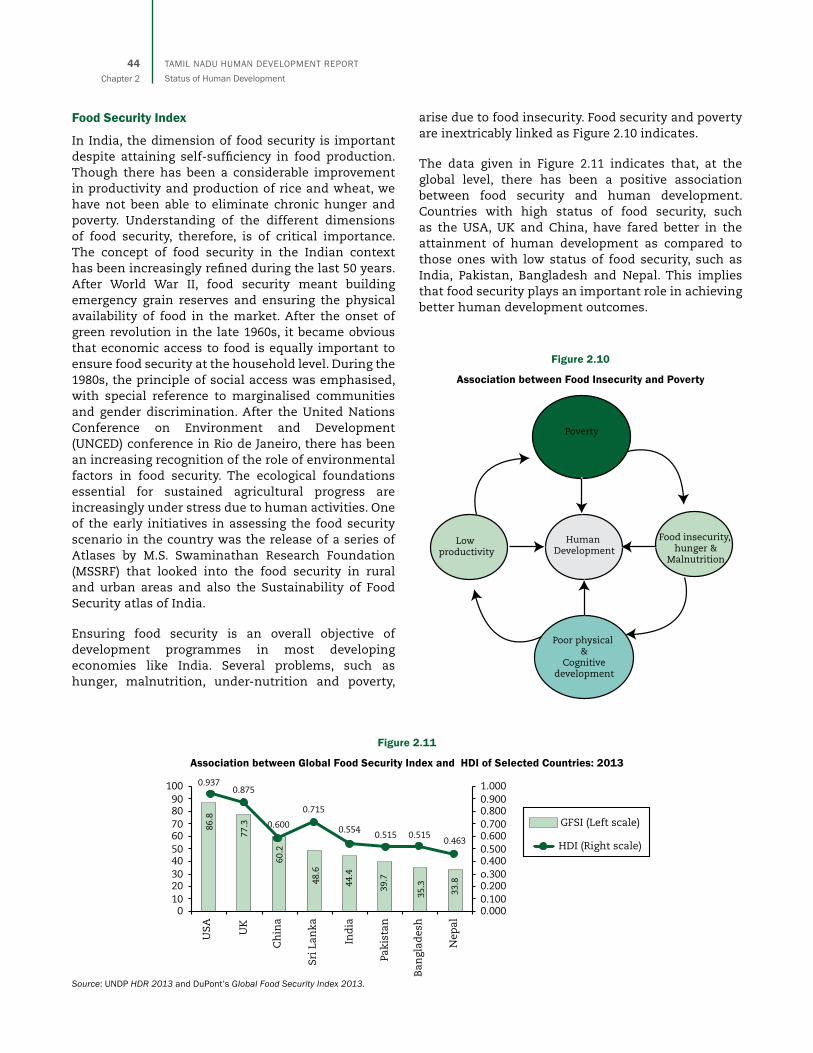
arise due to food insecurity. Food security and poverty are inextricably linked as Figure 2.10 indicates.
The data given in Figure 2.11 indicates that, at the global level, there has been a positive association between food security and human development. Countries with high status of food security, such as the USA, UK and China, have fared better in the attainment of human development as compared to those ones with low status of food security, such as India, Pakistan, Bangladesh and Nepal. This implies that food security plays an important role in achieving better human development outcomes.
Figure 2.11
Association between Global Food Security Index and HDI of Selected Countries: 2013
Source: UNDP HDR 2013 and DuPont’s Global Food Security Index 2013.
48.6
44.4
100 0.937
86.8
77.3
60.2
39.7
35.3
33.8
0.875
0.600
0.715
0.5540.515
USA
908070605040302010
0
1.0000.9000.8000.7000.6000.5000.400o.3000.2000.1000.000
GFSI (Left scale)
Ch
ina
Sri L
anka
Ind
ia
Ban
glad
esh
Nep
al
0.5150.463 HDI (Right scale)
UK
Paki
stan

Tamil Nadu HumaN developmeNT RepoRTStatus of Human development
45Chapter 2
Despite a significant reduction in the incidence of poverty, chronic food insecurity persists in a significant proportion of the population. It has been possible to resolve the problem of food security by offering universal PDS and maintaining sufficient buffer stocks. Yet, there are areas that are food insecure and undernourished. The limitation is not food supply, but food distribution. Careful consideration of food security requires moving beyond food availability and recognising low incomes of the poor. It is also important to identify the choices that households and regions face, including exploitation of natural resources when incomes fall short. Substantial human resources are wasted due to malnutrition-related diseases.
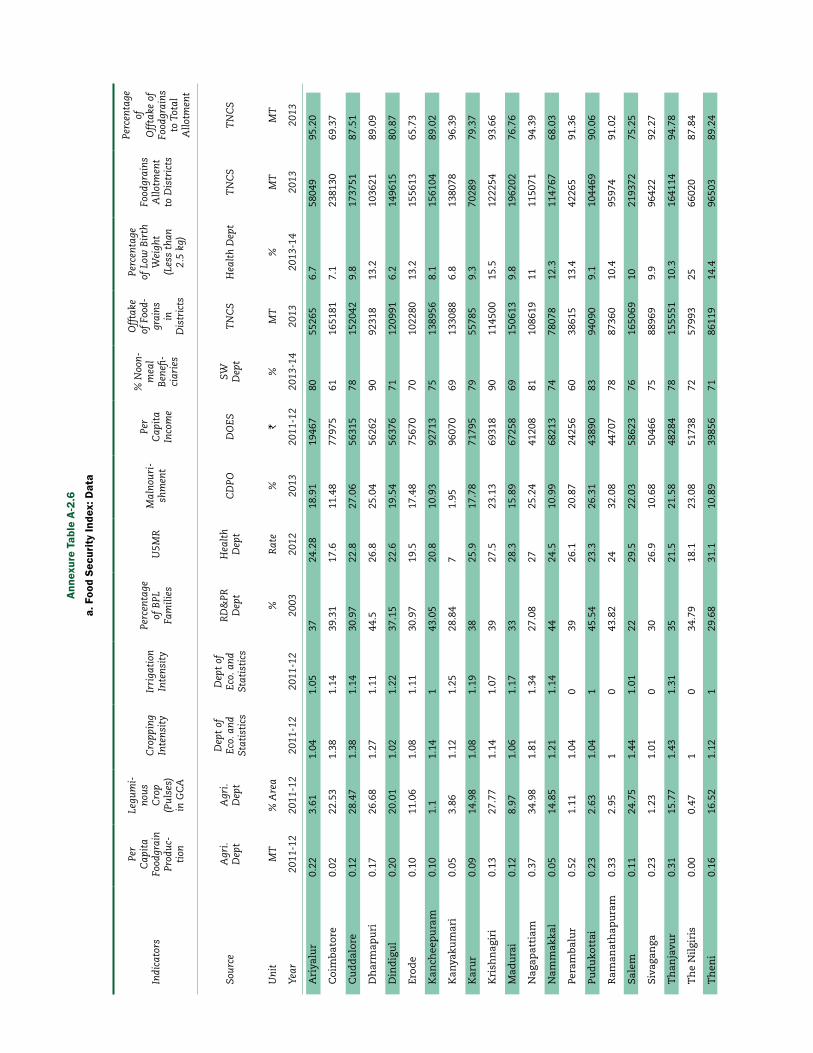
The set of indicators (Figure 2.12) used for computing the FSI are as follows:
Food Security has three components—availability, accessibility and absorption. Availability of food indicates the physical presence of food or domestic production of Foodgrain from agriculture or allied sector in a particular region or place in certain duration and with given technology inventory levels. Accessibility of food refers to acquiring adequate amounts of food through production and stocks, in
turn interlinking with the ability of people to obtain food, either through production, purchase or transfers. These components of food security are directly linked with economic ability of the population to afford the sufficient food for their survival. Last component of food security, absorption of food, is defined as a household’s ability to absorb and metabolise the nutrients and appropriate nutritional content of the food consumed; and ability of the body to use it effectively. The average per capita availability of rice, from the State’s own harvests in the 1980-81 to 1989-90 period, was 98.6 kg but has since then dropped to an average of 84.6 kg for the period 2000-01 to 2006-07.2
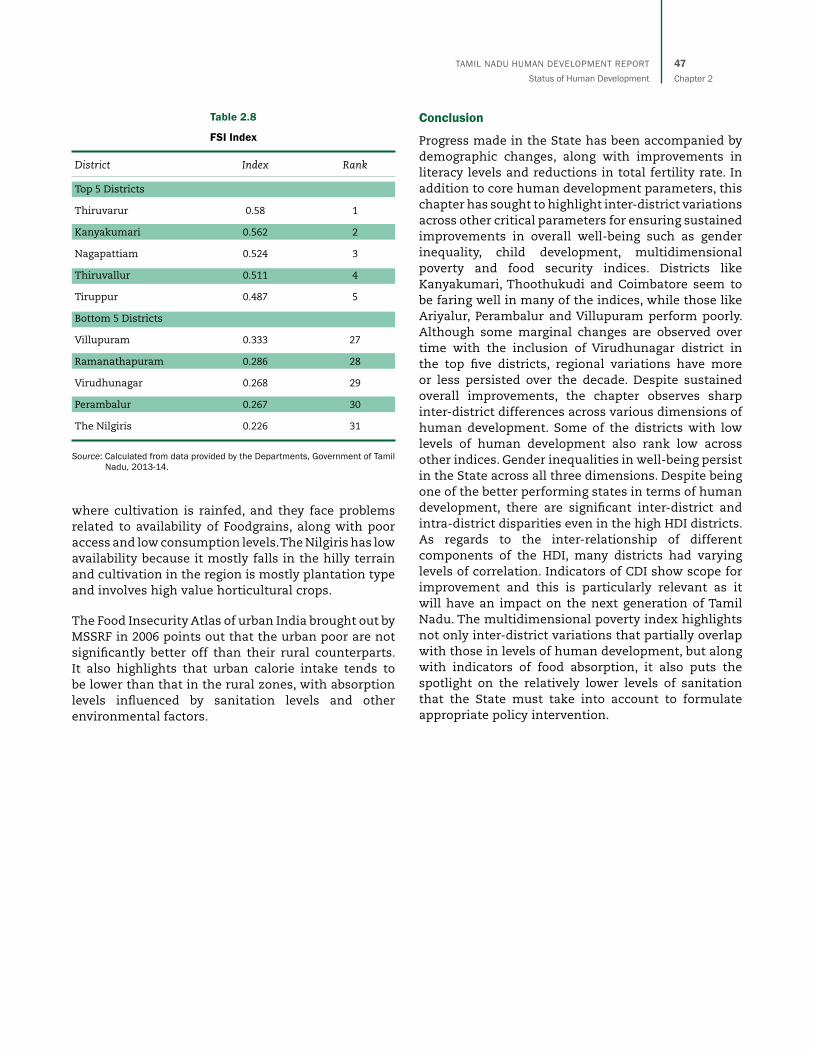
Looking at district-wise food security, there are clear differences in the levels of FSI across districts (Table 2.8).3
Table 2.8 on FSI indicates the presence of variations with reference to availability, access and absorption. The Delta districts and granaries of Tamil Nadu are
2. http://infochangeindia.org/agriculture/analysis/the-hunger-index.html downloaded on june 25, 2015.
3. This discussion on FSI does not take into account the district of Chennai, which is entirely an urban district.
Figure 2.12
Indicators Used to Compute FSI
Food Security
Index
AvailabilityIndicators
AccessibilityIndicators
AbsorptionIndicators
• Cropping Intensity• Irrigation Intensity• Per capita food grain production• Percentage of leguminous crops in the GCA
• Per capita income• Percentage of BPL HHs• Percentage of off take of food grains • Percentage of Noon Meal Beneficiaries
• Child Mortality Rate• Percentage of Malnourished Children• Percentage of Low Birth Weight Children
Tamil Nadu HumaN developmeNT RepoRTStatus of Human development
46Chapter 2
Figure 2.13
FSI Index
Source: Calculated from data provided by the Departments, Government of Tamil Nadu, 2013-14.
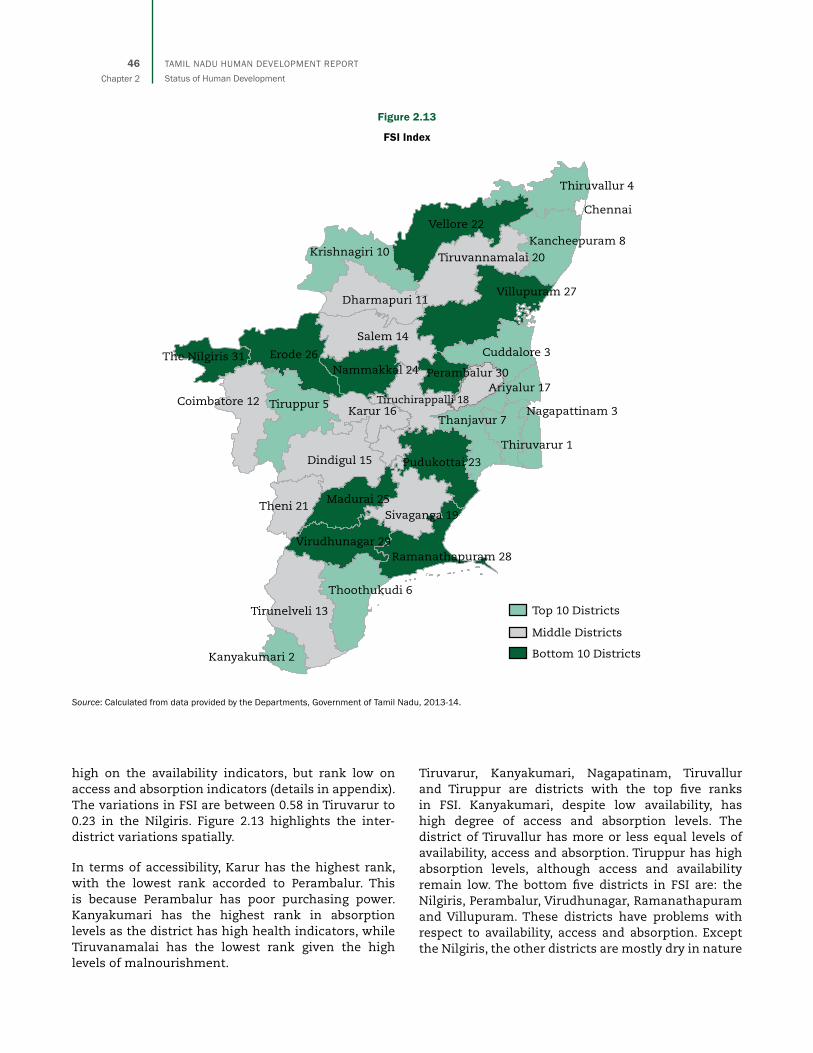
high on the availability indicators, but rank low on access and absorption indicators (details in appendix). The variations in FSI are between 0.58 in Tiruvarur to 0.23 in the Nilgiris. Figure 2.13 highlights the inter-district variations spatially.
In terms of accessibility, Karur has the highest rank, with the lowest rank accorded to Perambalur. This is because Perambalur has poor purchasing power. Kanyakumari has the highest rank in absorption levels as the district has high health indicators, while Tiruvanamalai has the lowest rank given the high levels of malnourishment.
Tiruvarur, Kanyakumari, Nagapatinam, Tiruvallur and Tiruppur are districts with the top five ranks in FSI. Kanyakumari, despite low availability, has high degree of access and absorption levels. The district of Tiruvallur has more or less equal levels of availability, access and absorption. Tiruppur has high absorption levels, although access and availability remain low. The bottom five districts in FSI are: the Nilgiris, Perambalur, Virudhunagar, Ramanathapuram and Villupuram. These districts have problems with respect to availability, access and absorption. Except the Nilgiris, the other districts are mostly dry in nature
Salem 14
Thiruvallur 4
Tiruvannamalai 20
Villupuram 27
Kancheepuram 8
Dharmapuri 11
The Nilgiris 31 Cuddalore 3
Thoothukudi 6
Top 10 Districts
Sivaganga 19Madurai 25
Karur 16Tiruppur 5
Nammakkal 24
Coimbatore 12
Theni 21
Ariyalur 17
Thiruvarur 1
Vellore 22
Tirunelveli 13
Virudhunagar 29
Dindigul 15
Perambalur 30
Erode 26
Pudukottai 23
Thanjavur 7
Krishnagiri 10
Ramanathapuram 28
Chennai
Tiruchirappalli 18Nagapattinam 3
Kanyakumari 2
Middle Districts
Bottom 10 Districts
Tamil Nadu HumaN developmeNT RepoRTStatus of Human development
47Chapter 2
Conclusion
Progress made in the State has been accompanied by demographic changes, along with improvements in literacy levels and reductions in total fertility rate. In addition to core human development parameters, this chapter has sought to highlight inter-district variations across other critical parameters for ensuring sustained improvements in overall well-being such as gender inequality, child development, multidimensional poverty and food security indices. Districts like Kanyakumari, Thoothukudi and Coimbatore seem to be faring well in many of the indices, while those like Ariyalur, Perambalur and Villupuram perform poorly. Although some marginal changes are observed over time with the inclusion of Virudhunagar district in the top five districts, regional variations have more or less persisted over the decade. Despite sustained overall improvements, the chapter observes sharp inter-district differences across various dimensions of human development. Some of the districts with low levels of human development also rank low across other indices. Gender inequalities in well-being persist in the State across all three dimensions. Despite being one of the better performing states in terms of human development, there are significant inter-district and intra-district disparities even in the high HDI districts. As regards to the inter-relationship of different components of the HDI, many districts had varying levels of correlation. Indicators of CDI show scope for improvement and this is particularly relevant as it will have an impact on the next generation of Tamil Nadu. The multidimensional poverty index highlights not only inter-district variations that partially overlap with those in levels of human development, but along with indicators of food absorption, it also puts the spotlight on the relatively lower levels of sanitation that the State must take into account to formulate appropriate policy intervention.
Table 2.8
FSI Index
District Index Rank
Top 5 Districts
Thiruvarur 0.58 1
Kanyakumari 0.562 2
Nagapattiam 0.524 3
Thiruvallur 0.511 4
Tiruppur 0.487 5
Bottom 5 Districts
Villupuram 0.333 27
Ramanathapuram 0.286 28
Virudhunagar 0.268 29
Perambalur 0.267 30
The Nilgiris 0.226 31
Source: Calculated from data provided by the Departments, Government of Tamil Nadu, 2013-14.
where cultivation is rainfed, and they face problems related to availability of Foodgrains, along with poor access and low consumption levels. The Nilgiris has low availability because it mostly falls in the hilly terrain and cultivation in the region is mostly plantation type and involves high value horticultural crops.
The Food Insecurity Atlas of urban India brought out by MSSRF in 2006 points out that the urban poor are not significantly better off than their rural counterparts. It also highlights that urban calorie intake tends to be lower than that in the rural zones, with absorption levels influenced by sanitation levels and other environmental factors.
Tamil Nadu HumaN developmeNT RepoRTStatus of Human development
48Chapter 2
Annexures
Methods for Computation of Indices: HDI
Method of Estimating HDI
For the estimation of HDI, the following steps have been followed:
• As a first step, a minimum and maximumvalue has to be set for each of the above indicators to transform them into indices lying between zero and one. For this purpose, the observed minimum and maximum figures for each of the indicators will be taken. Since the geometric mean has to be calculated, in the case of a positive indicator, the minimum value would be taken as 10 per cent less than the observed minimum value in the district. Similarly, in the case of a negative indicator, the maximum value would be taken as 10 per cent more than the observed maximum value.
• The index value (in the case of a positiveindicator) is calculated using the formula:
Index Value = (Actual Value – Min. Value) / (Max.Value – Min.Value)
Example: Calculations will be based on highest values being assigned the highest ranks
• The index value (in the case of a negativeindicator) is calculated by using the formula:
Index Value = (Max. Value – Actual Value) / (Max.Value – Min.Value)
However, for per capita income, first convert the actual per capita income, the minimum per capita income and maximum per capita income into natural log values, before converting into the index.
• For computing sectoral indices (health,education and standard of living), geometric mean is used and the method of calculation is as below. Thus, there will be three indices; one for standard of living, another for health and the last one for education.
Sectoral Index = If I1. I2….. In are the n indices for a particular sector, then the geometric mean for the sector = (I1×. I2 × ….. In)(1/n).
• TocomputeHDI,aggregatethethreesectoralindices using geometric mean with the following formula-
HDI= (SIl×SIh× SIe)(1/3); where SIl is the sectoral
index for living standard, SIh is the sectoral index for health and SIe is the sectoral index for education.
Method
GII calculation method has been presented below:
1. Aggregating across dimensions within each gender group using geometric mean.
2. Aggregating across gender group using a harmonic mean.
3. Calculating the geometric mean of the arithmetic means of the each indicator.
4. Calculating the GII by comparing the equally distributed gender index to the reference standard. The GII value ranges from zero (no gender inequality across dimensions) to one (total inequality across dimensions).
Computation of Child Development Index
• The set of indicators used are both positiveand negative in nature.
• The index value (in the case of a positiveindicator) is calculated using the formula:
Index Value = (Actual Value – Min. Value) / (Max.Value – Min.Value)
• The index values for negative indicators iscalculated using the following formula:
Index Value = (Max. Value – Actual Value) / (Max.Value – Min.Value)
• The index values for each of the indicatorswould range between 0 and 1—0 indicating the lowest ranking for the district and 1 indicating the highest.
Tamil Nadu HumaN developmeNT RepoRTStatus of Human development
49Chapter 2
In the context of CDI, higher value indicates better child development.
Computation of Food Security Index
• The indicatorsarebroadlycategorisedunderthe three parameters: availability, accessibility and absorption.
• The data collected for the above indicatorsare used for calculating the index values. This helps in making the values unit-less and would allow summation of the index values of all indicators.
• Theindexvaluesarecalculatedforeachoftheindicators, after identifying whether they are positive or negative. This is done to make the index values unidirectional.
• The index value (in the case of a positiveindicator) is calculated using the formula:
Index Value = (Actual Value – Min. Value) / (Max.Value – Min.Value)
Example: calculations are based on highest values being assigned the highest ranks.
• The index value ( in the case of a negativeindicator) is calculated by using the formula:
Index Value = (Max. Value – Actual Value) / (Max.Value – Min.Value)
• The index value for each of the indicatorsranges between 0 and 1—0 indicating the lowest and 1 implying the highest ranking of the district.
• The consolidated index for each of theparameters/sectors/dimensions is the average index value of all the indicators.
• The composite index is average of theindicators of all three parameters—availability, accessibility and absorption. This is used to assign ranks for the districts.

Anne
xure
Tab
le A
-2.1
Dat
a fo
r Ind
icat
ors
of G
II In
dex
Indi
cato
rsM
MR
Inst
itu
tion
al
Del
iver
ies
Mal
e Li
tera
cyFe
mal
e Li
tera
cyM
ale
Wor
ker
Part
icip
atio
n R
ate
Fem
ale
Wor
ker
Part
icip
atio
n R
ate
Mal
e A
gri.
Wag
e R
ate
Fem
ale
Agr
i. W
age
Rat
e
Mal
e El
ecte
d R
epre
sent
- ta
tves
Fem
ale
Elec
ted
Bod
y R
epre
sent
ativ
e
% o
f M
ale
0-6
Age
G
rou
p
% o
f Fe
mal
e 0-
6 A
ge G
rou
p
Sou
rce
Hea
lth
Dep
t.H
ealt
h D
ept.
Cen
sus
Cen
sus
Cen
sus
Cen
sus
SEA
rep
ort
of A
gri
Dep
t.
SEA
rep
ort
of A
gri
Dep
t
RD
&PR
D
ept.
RD
&PR
Dep
t.C
ensu
sC
ensu
s
Uni
tR
ate
%%
%%
%`
`%
%%
%
Year
2013
-14
2013
-14
2011
2011
2011
2011
2011
-12
2011
-12
2011
2011
2011
2011
Ari
yalu
r61
100
81.2
61.7
56.7
38.7
328.
6890
.76
7733
52.7
47.3
Ch
enn
ai33
100
93.7
86.6
58.6
19.4
64.8
135
.19
51.3
48.7
Coi
mba
tore
5899
.689
.178
.962
.628
324.
2411
6.86
64.9
535
.05
51.1
48.9
Cu
dd
alor
e89
100
85.9
70.1
57.1
32.5
238.
9310
5.26
61.5
538
.45
52.7
47.3
Dh
arm
apu
ri65
99.8
76.9
59.8
57.6
41.7
244.
5896
.17
66.7
33.3
52.3
47.7
Din
dig
ul
8110
084
.268
.361
.640
.820
4.97
115.
1763
3751
.748
.3
Erod
e64
100
80.4
64.7
64.8
41.3
283.
6512
4.24
63.3
336
.67
51.2
48.8
Kan
chee
pu
ram
7910
089
.979
58.7
16.4
188.
5487
.80
41.4
558
.55
51.1
48.9
Kan
yaku
mar
i30
100
93.6
89.9
56.6
16.4
256
2.96
215.
1763
.79
36.2
150
.949
.1
Kar
ur
9899
.984
.566
.962
.340
199.
9411
5.62
58.9
341
.07
51.6
48.4
Kri
shn
agir
i76
99.3
78.7
63.9
58.5
34.3
828
0.61
103.
7163
3751
.948
.1
Mad
ura
i12
010
089
.777
.259
.129
.924
7.33
103.
4165
.22
34.7
851
.848
.2
Nag
apat
tiam
8810
089
.877
.657
.825
.826
2.08
101.
6663
.69
36.3
151
49
Nam
mak
kal
6310
082
.666
.661
.142
.824
5.18
124.
3462
3852
.347
.7
Pera
mba
lur
7310
082
.965
.957
.648
.426
3.49
155.
9461
3952
.347
.7
Pud
uko
ttai
8210
085
.669
58.7
35.6
315.
5713
0.14
64.0
635
.94
51.5
149
Ram
anat
hap
ura
m10
099
.687
.873
.557
.531
.319
8.71
140.
9263
.82
36.1
851
49
Sale
m67
99.9
80.2
65.2
60.8
35.9
305.
0525
8.11
68.3
31.7
52.2
47.8
Siva
gan
ga80
100
87.9
71.9
58.5
34.1
446
4.86
122.
1158
.51
41.4
951
49
Th
anja
vur
4910
089
76.5
57.6
2425
1.79
114.
8563
3751
.148
.9
Th
e N
ilgi
ris
3999
.991
.779
58.9
36.7
197.
7593
.26
7030
50.4
49.6
Th
eni
7899
.885
69.5
5935
.91
307.
4413
2.43
59.1
740
.83
51.7
48.3
Th
iru
vall
ur
8010
089
.778
.358
.823
.518
9.13
93.7
562
3851
.448
.6
Th
iru
varu
r11
099
.889
.176
.759
.926
.726
0.94
117.
4260
4051
.148
.9
Tir
uva
nn
amal
ai60
99.5
83.1
65.3
59.8
40.6
267.
8585
.12
66.5
33.5
51.8
48.2
Th
ooth
uku
di
100
99.9
91.1
81.3
58.2
27.6
248.
3613
4.90
6535
50.9
49.1
Tir
un
elve
li91
100
89.2
7657
.636
340.
0614
9.47
63.1
36.9
5149
Tir
up
pu
r73
99.9
85.5
71.8
65.8
36.2
248.
3611
4.02
63.1
236
.88
51.2
48.8
Tric
hy
8999
.989
.776
.958
.431
247.
3611
3.81
6337
51.4
48.6
Vel
lore
6699
.886
.574
.957
.328
.618
7.90
95.1
661
.21
38.7
951
.448
.6
Vil
lup
ura
m56
100
80.5
63.2
58.4
39.9
230.
0774
.88
6337
51.5
48.5
Vir
ud
hu
nag
ar63
99.9
87.7
72.7
59.8
38.1
244.
2310
6.46
3466
51.1
48.9

Tamil Nadu HumaN developmeNT RepoRTStatus of Human development
51Chapter 2
Annexure Table A-2.2
a. HDI Index: Data
Indicators Per Capita IncomeLife Expectancy
at BirthLiteracy Rate
Gross Enrolment in Primary
Gross Enrolment in
Secondary
Source DOES SPC CensusEducation
DepartmentEducation
Department
Unit Rs. Age % Rate Rate
Year 2011-12 2011 2011 2013-14 2013-14
Ariyalur 19467 72.6 71.3 99.14 95.64
Chennai 66240 78.6 90.2 101.35 88.39
Coimbatore 77975 76.6 84 102.45 92.44
Cuddalore 56315 74 78 102.04 98.76
Dharmapuri 56262 72.6 68.5 102.09 107.7
Dindigul 56376 73.6 76.3 102.5 92.52
Erode 75670 73.7 72.6 102.37 70.08
Kancheepuram 92713 75.2 84.5 102.58 90.63
Kanyakumari 96070 77.7 91.7 102.52 95.53
Karur 71795 71.7 75.6 102.32 84.9
Krishnagiri 69318 76.5 74.5 102.26 99.56
Madurai 67258 70.12 83.5 102.57 97.22
Nagapattiam 41208 70 83.6 102.54 103.52
Nammakkal 68213 74.2 74.6 102.6 95.92
Perambalur 24256 72.6 74.3 102.9 102.52
Pudukottai 43890 72.5 77.2 102.84 95.75
Ramanathapuram 44707 72.7 80.7 102.93 95.54
Salem 58623 73.3 72.9 102.29 91.45
Sivaganga 50466 72.3 79.9 102.44 97.73
Thanjavur 48284 71.2 82.6 102.69 99.91
The Nilgiris 51738 68.95 85.2 103.13 99.47
Theni 39856 69 77.3 102.16 98.38
Thiruvallur 83594 74.1 84 102.66 89.83
Thiruvarur 34727 71 82.9 102.79 97.86
Tiruvannamalai 41569 73.3 74.2 101.72 88.78
Thoothukudi 74933 76.6 86.2 102.58 94.35
Tirunelveli 61899 76.2 82.5 102.55 98.39
Tiruppur 88549 68.1 78.8 98.79 95.31
Trichy 75393 72.7 83.2 102.44 99.01
Vellore 63185 74.8 79.2 102.51 89.95
Villupuram 35295 74.5 71.9 102.27 87.88
Virudhunagar 87361 76 80.2 102.53 98.92

Tamil Nadu HumaN developmeNT RepoRTStatus of Human development
52Chapter 2
Annexure Table A-2.2
b. HDI Index: Rank
District
HDI Index
RankLiving Standard
IndexHealth Index Education Index Overall Index
Ariyalur 0.062 0.653 0.552 0.282 32
Chennai 0.782 1.000 0.778 0.847 4
Coimbatore 0.877 0.884 0.775 0.844 6
Cuddalore 0.686 0.734 0.738 0.719 13
Dharmapuri 0.686 0.653 0.596 0.644 21
Dindigul 0.687 0.711 0.675 0.691 14
Erode 0.860 0.717 0.378 0.616 25
Kancheepuram 0.979 0.804 0.767 0.845 5
Kanyakumari 1.000 0.948 0.886 0.944 1
Karur 0.829 0.601 0.598 0.668 18
Krishnagiri 0.808 0.879 0.690 0.788 9
Madurai 0.790 0.510 0.812 0.689 15
Nagapattiam 0.503 0.503 0.859 0.601 26
Nammakkal 0.799 0.746 0.673 0.738 12
Perambalur 0.191 0.653 0.715 0.447 31
Pudukottai 0.540 0.648 0.719 0.631 22
Ramanathapuram 0.550 0.659 0.769 0.653 20
Salem 0.710 0.694 0.607 0.669 17
Sivaganga 0.622 0.636 0.766 0.671 16
Thanjavur 0.596 0.573 0.823 0.655 19
The Nilgiris 0.636 0.443 0.861 0.624 24
Theni 0.483 0.445 0.727 0.539 30
Thiruvallur 0.918 0.740 0.755 0.801 8
Thiruvarur 0.402 0.561 0.813 0.568 28
Tiruvannamalai 0.508 0.694 0.601 0.596 27
Thoothukudi 0.854 0.884 0.820 0.852 3
Tirunelveli 0.742 0.861 0.808 0.802 7
Tiruppur 0.952 0.393 0.659 0.627 23
Trichy 0.858 0.659 0.819 0.774 10
Vellore 0.754 0.780 0.695 0.742 11
Villupuram 0.412 0.763 0.563 0.561 29
Virudhunagar 0.944 0.850 0.780 0.855 2
Tamil Nadu HumaN developmeNT RepoRTStatus of Human development
53Chapter 2
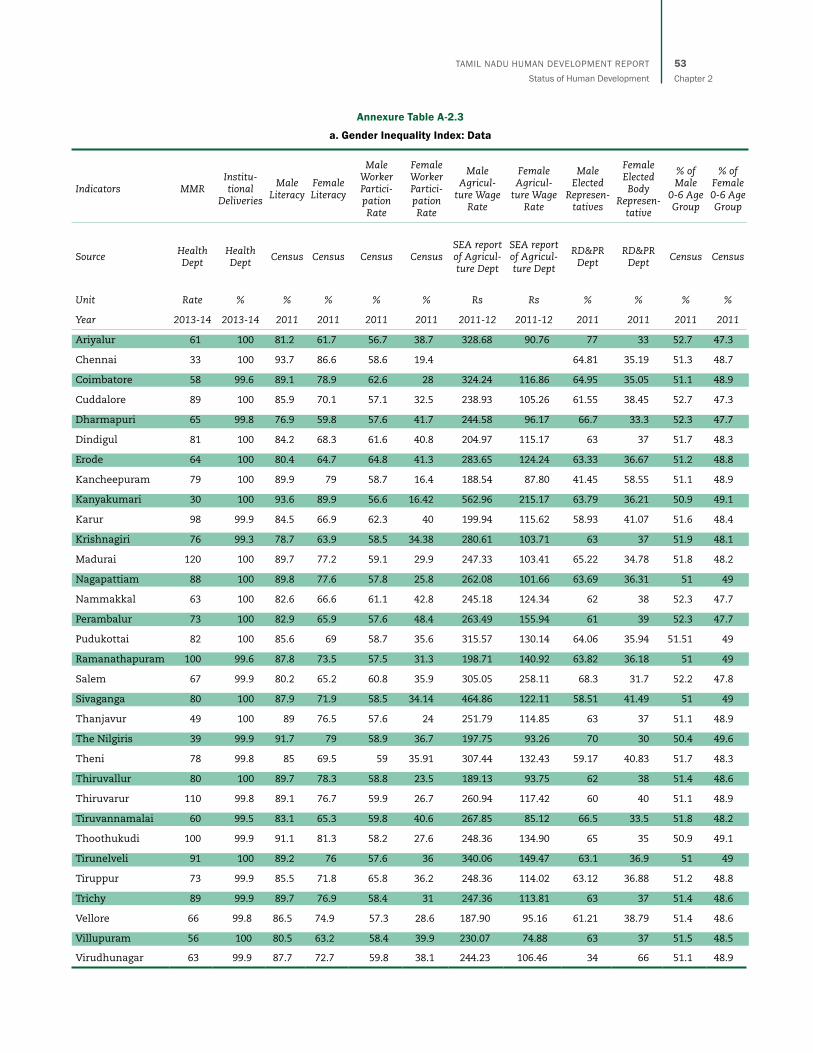
Annexure Table A-2.3
a. Gender Inequality Index: Data
Indicators MMRInstitu-tional
Deliveries
Male Literacy
Female Literacy
Male Worker Partici-pation Rate
Female Worker Partici-pation Rate
Male Agricul-
ture Wage Rate
Female Agricul-
ture Wage Rate
Male Elected
Represen-tatives
Female Elected Body
Represen-tative
% of Male
0-6 Age Group
% of Female 0-6 Age Group
SourceHealth Dept
Health Dept
Census Census Census CensusSEA report of Agricul-ture Dept
SEA report of Agricul-ture Dept
RD&PR Dept
RD&PR Dept
Census Census
Unit Rate % % % % % Rs Rs % % % %
Year 2013-14 2013-14 2011 2011 2011 2011 2011-12 2011-12 2011 2011 2011 2011
Ariyalur 61 100 81.2 61.7 56.7 38.7 328.68 90.76 77 33 52.7 47.3
Chennai 33 100 93.7 86.6 58.6 19.4 64.81 35.19 51.3 48.7
Coimbatore 58 99.6 89.1 78.9 62.6 28 324.24 116.86 64.95 35.05 51.1 48.9
Cuddalore 89 100 85.9 70.1 57.1 32.5 238.93 105.26 61.55 38.45 52.7 47.3
Dharmapuri 65 99.8 76.9 59.8 57.6 41.7 244.58 96.17 66.7 33.3 52.3 47.7
Dindigul 81 100 84.2 68.3 61.6 40.8 204.97 115.17 63 37 51.7 48.3
Erode 64 100 80.4 64.7 64.8 41.3 283.65 124.24 63.33 36.67 51.2 48.8
Kancheepuram 79 100 89.9 79 58.7 16.4 188.54 87.80 41.45 58.55 51.1 48.9
Kanyakumari 30 100 93.6 89.9 56.6 16.42 562.96 215.17 63.79 36.21 50.9 49.1
Karur 98 99.9 84.5 66.9 62.3 40 199.94 115.62 58.93 41.07 51.6 48.4
Krishnagiri 76 99.3 78.7 63.9 58.5 34.38 280.61 103.71 63 37 51.9 48.1
Madurai 120 100 89.7 77.2 59.1 29.9 247.33 103.41 65.22 34.78 51.8 48.2
Nagapattiam 88 100 89.8 77.6 57.8 25.8 262.08 101.66 63.69 36.31 51 49
Nammakkal 63 100 82.6 66.6 61.1 42.8 245.18 124.34 62 38 52.3 47.7
Perambalur 73 100 82.9 65.9 57.6 48.4 263.49 155.94 61 39 52.3 47.7
Pudukottai 82 100 85.6 69 58.7 35.6 315.57 130.14 64.06 35.94 51.51 49
Ramanathapuram 100 99.6 87.8 73.5 57.5 31.3 198.71 140.92 63.82 36.18 51 49
Salem 67 99.9 80.2 65.2 60.8 35.9 305.05 258.11 68.3 31.7 52.2 47.8
Sivaganga 80 100 87.9 71.9 58.5 34.14 464.86 122.11 58.51 41.49 51 49
Thanjavur 49 100 89 76.5 57.6 24 251.79 114.85 63 37 51.1 48.9
The Nilgiris 39 99.9 91.7 79 58.9 36.7 197.75 93.26 70 30 50.4 49.6
Theni 78 99.8 85 69.5 59 35.91 307.44 132.43 59.17 40.83 51.7 48.3
Thiruvallur 80 100 89.7 78.3 58.8 23.5 189.13 93.75 62 38 51.4 48.6
Thiruvarur 110 99.8 89.1 76.7 59.9 26.7 260.94 117.42 60 40 51.1 48.9
Tiruvannamalai 60 99.5 83.1 65.3 59.8 40.6 267.85 85.12 66.5 33.5 51.8 48.2
Thoothukudi 100 99.9 91.1 81.3 58.2 27.6 248.36 134.90 65 35 50.9 49.1
Tirunelveli 91 100 89.2 76 57.6 36 340.06 149.47 63.1 36.9 51 49
Tiruppur 73 99.9 85.5 71.8 65.8 36.2 248.36 114.02 63.12 36.88 51.2 48.8
Trichy 89 99.9 89.7 76.9 58.4 31 247.36 113.81 63 37 51.4 48.6
Vellore 66 99.8 86.5 74.9 57.3 28.6 187.90 95.16 61.21 38.79 51.4 48.6
Villupuram 56 100 80.5 63.2 58.4 39.9 230.07 74.88 63 37 51.5 48.5
Virudhunagar 63 99.9 87.7 72.7 59.8 38.1 244.23 106.46 34 66 51.1 48.9
Tamil Nadu HumaN developmeNT RepoRTStatus of Human development
54Chapter 2
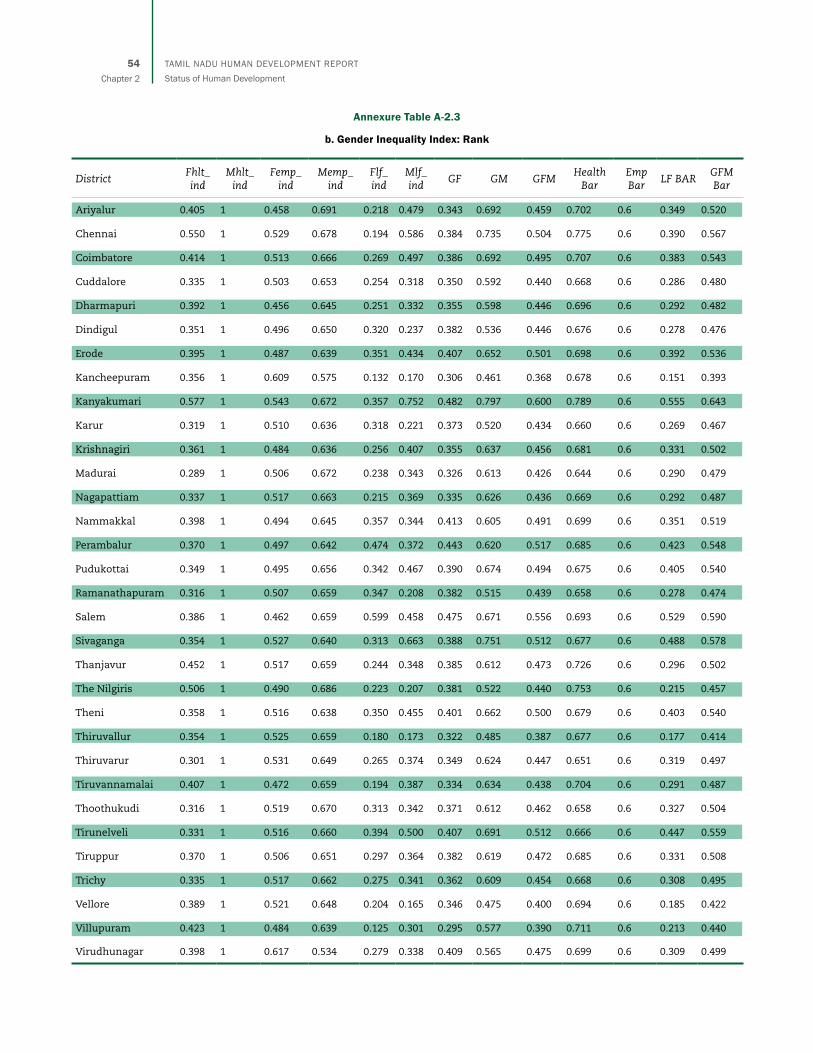
Annexure Table A-2.3
b. Gender Inequality Index: Rank
DistrictFhlt_ind
Mhlt_ind
Femp_ind
Memp_ind
Flf_ind
Mlf_ind
GF GM GFMHealth
BarEmp Bar
LF BARGFM Bar
Ariyalur 0.405 1 0.458 0.691 0.218 0.479 0.343 0.692 0.459 0.702 0.6 0.349 0.520
Chennai 0.550 1 0.529 0.678 0.194 0.586 0.384 0.735 0.504 0.775 0.6 0.390 0.567
Coimbatore 0.414 1 0.513 0.666 0.269 0.497 0.386 0.692 0.495 0.707 0.6 0.383 0.543
Cuddalore 0.335 1 0.503 0.653 0.254 0.318 0.350 0.592 0.440 0.668 0.6 0.286 0.480
Dharmapuri 0.392 1 0.456 0.645 0.251 0.332 0.355 0.598 0.446 0.696 0.6 0.292 0.482
Dindigul 0.351 1 0.496 0.650 0.320 0.237 0.382 0.536 0.446 0.676 0.6 0.278 0.476
Erode 0.395 1 0.487 0.639 0.351 0.434 0.407 0.652 0.501 0.698 0.6 0.392 0.536
Kancheepuram 0.356 1 0.609 0.575 0.132 0.170 0.306 0.461 0.368 0.678 0.6 0.151 0.393
Kanyakumari 0.577 1 0.543 0.672 0.357 0.752 0.482 0.797 0.600 0.789 0.6 0.555 0.643
Karur 0.319 1 0.510 0.636 0.318 0.221 0.373 0.520 0.434 0.660 0.6 0.269 0.467
Krishnagiri 0.361 1 0.484 0.636 0.256 0.407 0.355 0.637 0.456 0.681 0.6 0.331 0.502
Madurai 0.289 1 0.506 0.672 0.238 0.343 0.326 0.613 0.426 0.644 0.6 0.290 0.479
Nagapattiam 0.337 1 0.517 0.663 0.215 0.369 0.335 0.626 0.436 0.669 0.6 0.292 0.487
Nammakkal 0.398 1 0.494 0.645 0.357 0.344 0.413 0.605 0.491 0.699 0.6 0.351 0.519
Perambalur 0.370 1 0.497 0.642 0.474 0.372 0.443 0.620 0.517 0.685 0.6 0.423 0.548
Pudukottai 0.349 1 0.495 0.656 0.342 0.467 0.390 0.674 0.494 0.675 0.6 0.405 0.540
Ramanathapuram 0.316 1 0.507 0.659 0.347 0.208 0.382 0.515 0.439 0.658 0.6 0.278 0.474
Salem 0.386 1 0.462 0.659 0.599 0.458 0.475 0.671 0.556 0.693 0.6 0.529 0.590
Sivaganga 0.354 1 0.527 0.640 0.313 0.663 0.388 0.751 0.512 0.677 0.6 0.488 0.578
Thanjavur 0.452 1 0.517 0.659 0.244 0.348 0.385 0.612 0.473 0.726 0.6 0.296 0.502
The Nilgiris 0.506 1 0.490 0.686 0.223 0.207 0.381 0.522 0.440 0.753 0.6 0.215 0.457
Theni 0.358 1 0.516 0.638 0.350 0.455 0.401 0.662 0.500 0.679 0.6 0.403 0.540
Thiruvallur 0.354 1 0.525 0.659 0.180 0.173 0.322 0.485 0.387 0.677 0.6 0.177 0.414
Thiruvarur 0.301 1 0.531 0.649 0.265 0.374 0.349 0.624 0.447 0.651 0.6 0.319 0.497
Tiruvannamalai 0.407 1 0.472 0.659 0.194 0.387 0.334 0.634 0.438 0.704 0.6 0.291 0.487
Thoothukudi 0.316 1 0.519 0.670 0.313 0.342 0.371 0.612 0.462 0.658 0.6 0.327 0.504
Tirunelveli 0.331 1 0.516 0.660 0.394 0.500 0.407 0.691 0.512 0.666 0.6 0.447 0.559
Tiruppur 0.370 1 0.506 0.651 0.297 0.364 0.382 0.619 0.472 0.685 0.6 0.331 0.508
Trichy 0.335 1 0.517 0.662 0.275 0.341 0.362 0.609 0.454 0.668 0.6 0.308 0.495
Vellore 0.389 1 0.521 0.648 0.204 0.165 0.346 0.475 0.400 0.694 0.6 0.185 0.422
Villupuram 0.423 1 0.484 0.639 0.125 0.301 0.295 0.577 0.390 0.711 0.6 0.213 0.440
Virudhunagar 0.398 1 0.617 0.534 0.279 0.338 0.409 0.565 0.475 0.699 0.6 0.309 0.499

Tamil Nadu HumaN developmeNT RepoRTStatus of Human development
55Chapter 2
Annexure Table A-2.4
a. CDI Index: Data
IndicatorsUnder 5MR
Malnourish-ment
Enrolment in Primary
Enrolment in
Secondary
Juvenile Sex
Ratio
Percentage of Children
Never Enrolled in
Schools
Transition Rate from Primary to Upper Primary
Transition Rate from
Upper Primary to Secondary
Negative Negative Positive Positive Positive Negative Positive Positive
SourceHealth Dept
CDPOEducation
DeptEducation
DeptCensus
Education Dept
Education Dept
Education Dept
Unit Rate Rate No. No. No. % Rate Rate
Year 2012 2013 2013-14 2013-14 2011 2013-14 2013-14 2013-14
Ariyalur 24.28 18.91 99.14 95.64 897 0 97.82 98.44
Chennai 16.1 11.64 101.35 88.39 950 0 99.85 88.14
Coimbatore 17.6 11.48 102.45 92.44 956 0.04 99.83 97.3
Cuddalore 22.8 27.06 102.04 98.76 896 0.01 99.83 95.72
Dharmapuri 26.8 25.04 102.09 107.7 913 0.08 99.83 95.99
Dindigul 22.6 19.54 102.5 92.52 934 0.02 99.85 90.07
Erode 19.5 17.48 102.37 70.08 953 0.01 99.85 94.33
Kancheepuram 20.8 10.93 102.58 90.63 959 0.4 99.8 99.67
Kanyakumari 7 1.95 102.52 95.53 964 0 99.8 99.87
Karur 25.9 17.78 102.32 84.9 939 0.47 99.8 98.31
Krishnagiri 27.5 23.13 102.26 99.56 926 0.8 99.85 91.21
Madurai 28.3 15.89 102.57 97.22 932 0 99.83 94.29
Nagapattiam 27 25.24 102.54 103.52 959 0 99.78 91.46
Nammakkal 24.5 10.99 102.6 95.92 914 0.04 99.78 101.17
Perambalur 26.1 20.87 102.9 102.52 913 0 99.73 97.06
Pudukottai 23.3 26.31 102.84 95.75 960 0.3 99.78 92.8
Ramanathapuram 24 32.08 102.93 95.54 961 0.52 99.8 88.45
Salem 29.5 22.03 102.29 91.45 916 0.09 99.78 91.54
Sivaganga 26.9 10.68 102.44 97.73 960 0 99.83 92.31
Thanjavur 21.5 21.58 102.69 99.91 957 0 99.83 94.87
The Nilgiris 18.1 23.08 103.13 99.47 985 0.51 99.8 96.39
Theni 31.1 10.89 102.16 98.38 934 0 99.8 93.52
Thiruvallur 20.9 12.5 102.66 89.83 946 0.36 99.85 96.46
Thiruvarur 21.7 21.48 102.79 97.86 958 0.1 99.8 92.41
Tiruvannamalai 29.4 29.58 101.72 88.78 930 0.7 99.83 93.86
Thoothukudi 21.5 13.75 102.58 94.35 963 0.01 99.78 93
Tirunelveli 26.1 19.21 102.55 98.39 960 0.01 99.78 87.96
Tiruppur 0 10.44 98.79 95.31 952 0.2 99.48 94.15
Trichy 26.2 21.01 102.44 99.01 947 0 99.8 100.27
Vellore 30.8 23.11 102.51 89.95 944 0.01 99.78 82.77
Villupuram 26.7 31.04 102.27 87.88 941 0.008 99.75 92.49
Virudhunagar 26.7 29.1 102.53 98.92 955 0 99.85 98.27
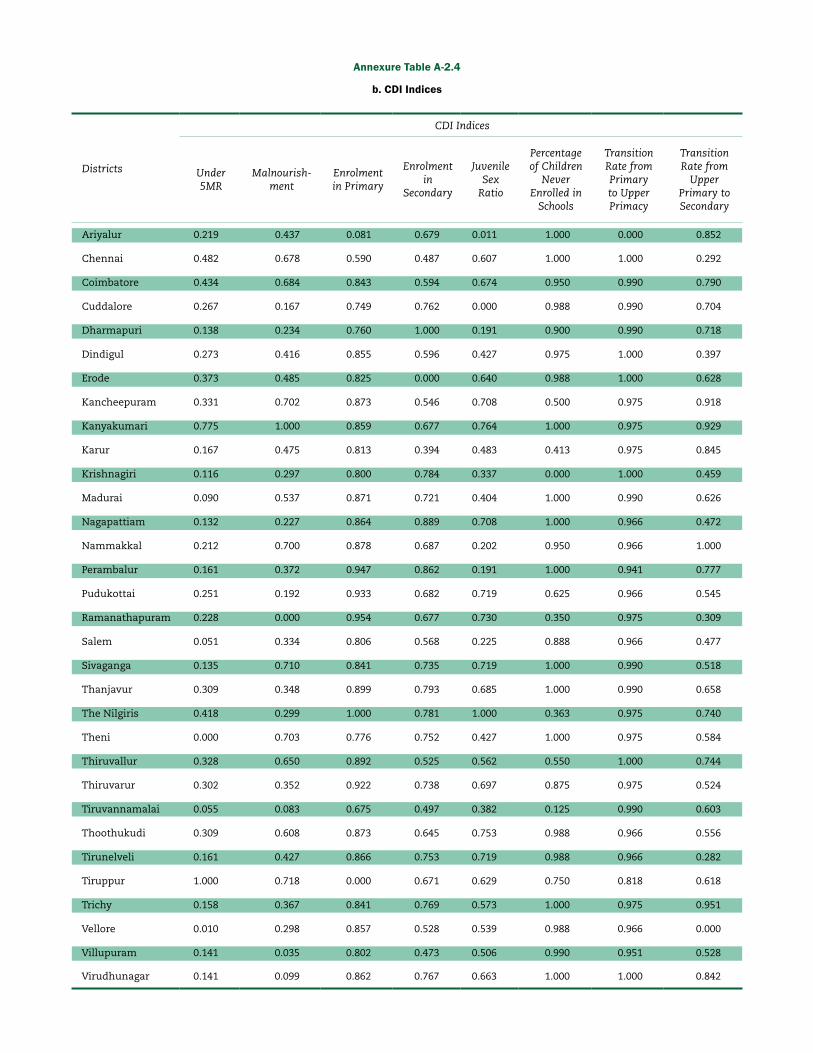
Annexure Table A-2.4
b. CDI Indices
Districts
CDI Indices
Under 5MR
Malnourish-ment
Enrolment in Primary
Enrolment in
Secondary
Juvenile Sex
Ratio
Percentage of Children
Never Enrolled in
Schools
Transition Rate from Primary to Upper Primacy
Transition Rate from
Upper Primary to Secondary
Ariyalur 0.219 0.437 0.081 0.679 0.011 1.000 0.000 0.852
Chennai 0.482 0.678 0.590 0.487 0.607 1.000 1.000 0.292
Coimbatore 0.434 0.684 0.843 0.594 0.674 0.950 0.990 0.790
Cuddalore 0.267 0.167 0.749 0.762 0.000 0.988 0.990 0.704
Dharmapuri 0.138 0.234 0.760 1.000 0.191 0.900 0.990 0.718
Dindigul 0.273 0.416 0.855 0.596 0.427 0.975 1.000 0.397
Erode 0.373 0.485 0.825 0.000 0.640 0.988 1.000 0.628
Kancheepuram 0.331 0.702 0.873 0.546 0.708 0.500 0.975 0.918
Kanyakumari 0.775 1.000 0.859 0.677 0.764 1.000 0.975 0.929
Karur 0.167 0.475 0.813 0.394 0.483 0.413 0.975 0.845
Krishnagiri 0.116 0.297 0.800 0.784 0.337 0.000 1.000 0.459
Madurai 0.090 0.537 0.871 0.721 0.404 1.000 0.990 0.626
Nagapattiam 0.132 0.227 0.864 0.889 0.708 1.000 0.966 0.472
Nammakkal 0.212 0.700 0.878 0.687 0.202 0.950 0.966 1.000
Perambalur 0.161 0.372 0.947 0.862 0.191 1.000 0.941 0.777
Pudukottai 0.251 0.192 0.933 0.682 0.719 0.625 0.966 0.545
Ramanathapuram 0.228 0.000 0.954 0.677 0.730 0.350 0.975 0.309
Salem 0.051 0.334 0.806 0.568 0.225 0.888 0.966 0.477
Sivaganga 0.135 0.710 0.841 0.735 0.719 1.000 0.990 0.518
Thanjavur 0.309 0.348 0.899 0.793 0.685 1.000 0.990 0.658
The Nilgiris 0.418 0.299 1.000 0.781 1.000 0.363 0.975 0.740
Theni 0.000 0.703 0.776 0.752 0.427 1.000 0.975 0.584
Thiruvallur 0.328 0.650 0.892 0.525 0.562 0.550 1.000 0.744
Thiruvarur 0.302 0.352 0.922 0.738 0.697 0.875 0.975 0.524
Tiruvannamalai 0.055 0.083 0.675 0.497 0.382 0.125 0.990 0.603
Thoothukudi 0.309 0.608 0.873 0.645 0.753 0.988 0.966 0.556
Tirunelveli 0.161 0.427 0.866 0.753 0.719 0.988 0.966 0.282
Tiruppur 1.000 0.718 0.000 0.671 0.629 0.750 0.818 0.618
Trichy 0.158 0.367 0.841 0.769 0.573 1.000 0.975 0.951
Vellore 0.010 0.298 0.857 0.528 0.539 0.988 0.966 0.000
Villupuram 0.141 0.035 0.802 0.473 0.506 0.990 0.951 0.528
Virudhunagar 0.141 0.099 0.862 0.767 0.663 1.000 1.000 0.842

Tamil Nadu HumaN developmeNT RepoRTStatus of Human development
57Chapter 2
Annexure Table A-2.4
c. CDI Values and Ranks District-Wise
District CDI Value CDI Rank
Kanyakumari 0.872 1
Coimbatore 0.745 2
Thoothukudi 0.712 3
Thanjavur 0.71 4
Sivaganga 0.706 5
Trichy 0.704 6
Nammakkal 0.699 7
The Nilgiris 0.697 8
Kancheepuram 0.694 9
Thiruvarur 0.673 10
Virudhunagar 0.672 11
Nagapattiam 0.657 12
Perambalur 0.656 13
Thiruvallur 0.656 14
Madurai 0.655 15
Theni 0.652 16
Tiruppur 0.651 17
Tirunelveli 0.645 18
Chennai 0.642 19
Dindigul 0.617 20
Erode 0.617 21
Dharmapuri 0.616 22
Pudukottai 0.614 23
Cuddalore 0.578 24
Karur 0.571 25
Villupuram 0.553 26
Salem 0.539 27
Ramanathapuram 0.528 28
Vellore 0.523 29
Krishnagiri 0.474 30
Tiruvannamalai 0.426 31
Ariyalur 0.41 32
Annexure Table A-2.5
a. MPI Index and Rank: District-wise
District MPI Index MPI Rank
Kancheepuram 0.34 1
Chennai 0.34 2
Cuddalore 0.38 3
Coimbatore 0.41 4
Nagapattiam 0.41 5
Tiruppur 0.42 6
Vellore 0.43 7
Madurai 0.45 8
Thiruvallur 0.46 9
Tirunelveli 0.46 10
Trichy 0.47 11
Thoothukudi 0.49 12
Kanyakumari 0.5 13
Pudukottai 0.51 14
The Nilgiris 0.52 15
Erode 0.52 16
Salem 0.53 17
Thiruvarur 0.53 18
Tiruvannamalai 0.53 19
Sivaganga 0.55 20
Villupuram 0.58 21
Thanjavur 0.59 22
Dindigul 0.59 23
Theni 0.6 24
Nammakkal 0.6 25
Krishnagiri 0.6 26
Karur 0.61 27
Ariyalur 0.62 28
Virudhunagar 0.62 29
Ramanathapuram 0.63 30
Perambalur 0.63 31
Dharmapuri 0.7 32
Tamil Nadu HumaN developmeNT RepoRTStatus of Human development
58Chapter 2
Annexure Table A-2.5
b. MPI Index: Data
Indicators IMRHigher Order
Birth RateDropout in
PrimaryDropout in Secondary
Cooking Fuel (LPG, Kerosene,
Electric and Biogas)
Access to Safe
Drinking Water within
Premises
Access to Toilet within
Premises
Negative Positive Negative Negative Positive Positive Positive
Source Health Dept Health DeptEducation
DeptEducation
DeptCensus of India
Census of India
Census of India
Unit % Rate Rate % % %
Year 2013-14 2013-14 2013-14 2013-14 2011 2011 2011
Ariyalur 9 13.40 1.07 8.33 20.80 66.43 18.10
Chennai 7 2.60 1.02 8.53 96.60 97.57 95.60
Coimbatore 6 3.20 1.22 8.22 81.00 95.67 66.70
Cuddalore 12 10.60 0.40 6.75 41.00 81.07 36.10
Dharmapuri 20 13.40 1.86 7.65 30.90 76.69 19.00
Dindigul 13 8.60 1.28 7.92 43.10 80.22 33.30
Erode 7 3.70 1.18 8.51 66.30 88.21 49.00
Kancheepuram 10 6.20 0.43 7.48 72.50 86.22 65.50
Kanyakumari 9 3.40 0.44 8.74 43.40 77.32 87.50
Karur 18 9.00 1.23 8.14 54.80 79.64 41.20
Krishnagiri 17 12.00 1.45 7.93 38.00 83.97 33.00
Madurai 12 7.20 0.73 8.40 63.70 91.21 59.20
Nagapattiam 14 11.30 0.43 7.10 36.90 84.34 39.50
Nammakkal 14 7.70 1.54 8.41 63.30 84.63 40.70
Perambalur 15 12.80 1.23 7.69 35.90 61.44 22.20
Pudukottai 12 12.40 0.70 7.64 23.60 77.48 28.00
Ramanathapuram 13 10.30 0.90 8.14 34.70 59.08 36.60
Salem 12 10.40 1.55 7.94 56.60 89.09 35.00
Sivaganga 13 9.00 0.48 8.39 37.40 76.74 40.70
Thanjavur 10 9.90 1.03 7.92 40.10 55.36 45.10
The Nilgiris 11 5.90 1.05 8.02 52.50 84.94 51.90
Theni 17 6.80 1.15 8.09 53.50 87.27 39.30
Thiruvallur 12 6.50 1.21 7.82 75.90 81.97 67.90
Thiruvarur 11 8.20 0.50 7.42 34.80 62.89 39.70
Tiruvannamalai 15 14.50 0.98 7.09 33.00 66.88 22.80
Thoothukudi 11 10.30 0.93 8.60 49.90 88.75 50.00
Tirunelveli 14 9.40 0.35 8.36 51.80 88.84 47.60
Tiruppur 7 3.70 0.82 8.30 77.60 93.09 57.20
Trichy 12 9.60 0.55 8.56 55.70 87.34 48.50
Vellore 11 13.40 0.89 7.42 48.90 75.84 41.10
Villupuram 17 13.50 0.98 7.34 31.30 69.97 21.10
Virudhunagar 12 6.70 0.94 8.62 53.50 74.49 30.90
Tamil Nadu HumaN developmeNT RepoRTStatus of Human development
59Chapter 2
Annexure Table A-2.5
c. MPI Indices
Districts
MPI Indices
IMRHigher
Order Birth Rate
Dropout in Primary
Dropout in Secondary
Cooking Fuel (LPG, Kerosene,
Electric and Biogas)
Access to Safe Drinking
Water
Access to Toilet within
Premises
Ariyalur 0.786 0.908 0.523 0.206 0.000 0.262 0.000
Chennai 0.929 0.000 0.556 0.106 1.000 1.000 1.000
Coimbatore 1.000 0.050 0.424 0.261 0.794 0.955 0.627
Cuddalore 0.571 0.672 0.967 1.000 0.266 0.609 0.232
Dharmapuri 0.000 0.908 0.000 0.548 0.133 0.505 0.012
Dindigul 0.500 0.504 0.384 0.412 0.294 0.589 0.196
Erode 0.929 0.092 0.450 0.116 0.600 0.778 0.399
Kancheepuram 0.714 0.303 0.947 0.633 0.682 0.731 0.612
Kanyakumari 0.786 0.067 0.940 0.000 0.298 0.520 0.895
Karur 0.143 0.538 0.417 0.302 0.449 0.575 0.298
Krishnagiri 0.214 0.790 0.272 0.407 0.227 0.678 0.192
Madurai 0.571 0.387 0.748 0.171 0.566 0.849 0.530
Nagapattiam 0.429 0.731 0.947 0.824 0.212 0.687 0.276
Nammakkal 0.429 0.429 0.212 0.166 0.561 0.693 0.292
Perambalur 0.357 0.857 0.417 0.528 0.199 0.144 0.053
Pudukottai 0.571 0.824 0.768 0.553 0.037 0.524 0.128
Ramanathapuram 0.500 0.647 0.636 0.302 0.183 0.088 0.239
Salem 0.571 0.655 0.205 0.402 0.472 0.799 0.218
Sivaganga 0.500 0.538 0.914 0.176 0.219 0.506 0.292
Thanjavur 0.714 0.613 0.550 0.412 0.255 0.000 0.348
The Nilgiris 0.643 0.277 0.536 0.362 0.418 0.701 0.436
Theni 0.214 0.353 0.470 0.327 0.431 0.756 0.274
Thiruvallur 0.571 0.328 0.430 0.462 0.727 0.630 0.643
Thiruvarur 0.643 0.471 0.901 0.663 0.185 0.179 0.279
Tiruvannamalai 0.357 1.000 0.583 0.829 0.161 0.273 0.061
Thoothukudi 0.643 0.647 0.616 0.070 0.384 0.791 0.412
Tirunelveli 0.429 0.571 1.000 0.191 0.409 0.793 0.381
Tiruppur 0.929 0.092 0.689 0.221 0.749 0.894 0.505
Trichy 0.571 0.588 0.868 0.090 0.460 0.758 0.392
Vellore 0.643 0.908 0.642 0.663 0.371 0.485 0.297
Villupuram 0.214 0.916 0.583 0.704 0.139 0.346 0.039
Virudhunagar 0.571 0.345 0.609 0.060 0.431 0.453 0.165
Anne
xure
Tab
le A
-2.6
a. F
ood
Secu
rity
Inde
x: D
ata
Indi
cato
rs
Per
Cap
ita
Food
grai
n Pr
odu
c-ti
on
Legu
mi-
nou
s C
rop
(Pu
lses
) in
GC
A
Cro
ppin
g In
tens
ity
Irri
gati
on
Inte
nsit
y
Perc
enta
ge
of B
PL
Fam
ilies
U5M
RM
alno
uri
-sh
men
t
Per
Cap
ita
Inco
me
% N
oon-
mea
l B
enefi
-ci
arie
s
Off
take
of
Foo
d-
grai
ns
in
Dis
tric
ts
Perc
enta
ge
of L
ow B
irth
W
eigh
t (L
ess
than
2.
5 kg
)
Food
grai
ns
Allo
tmen
t to
Dis
tric
ts
Perc
enta
ge
of
Off
take
of
Food
grai
ns
to T
otal
A
llotm
ent
Sou
rce
Agr
i. D
ept
Agr
i. D
ept
Dep
t of
Ec
o. a
nd
Stat
isti
cs
Dep
t of
Ec
o. a
nd
Stat
isti
cs
RD
&PR
D
ept
Hea
lth
Dep
tC
DPO
DO
ESSW
D
ept
TN
CS
Hea
lth
Dep
tT
NC
ST
NC
S
Uni
tM
T%
Are
a%
Rat
e%
`%
MT
%M
TM
T
Year
2011
-12
2011
-12
2011
-12
2011
-12
2003
2012
2013
2011
-12
2013
-14
2013
2013
-14
2013
2013
Ari
yalu
r0.
223.
611.
041.
0537
24.2
818
.91
1946
780
5526
56.
758
049
95.2
0
Coi
mba
tore
0.02
22.5
31.
381.
1439
.31
17.6
11.4
877
975
6116
5181
7.1
2381
3069
.37
Cu
dd
alor
e0.
1228
.47
1.38
1.14
30.9
722
.827
.06
5631
578
1520
429.
817
3751
87.5
1
Dh
arm
apu
ri0.
1726
.68
1.27
1.11
44.5
26.8
25.0
456
262
9092
318
13.2
1036
2189
.09
Din
dig
ul
0.20
20.0
11.
021.
2237
.15
22.6
19.5
456
376
7112
0991
6.2
1496
1580
.87
Erod
e0.
1011
.06
1.08
1.11
30.9
719
.517
.48
7567
070
1022
8013
.215
5613
65.7
3
Kan
chee
pu
ram
0.10
1.1
1.14
143
.05
20.8
10.9
392
713
7513
8956
8.1
1561
0489
.02
Kan
yaku
mar
i0.
053.
861.
121.
2528
.84
71.
9596
070
6913
3088
6.8
1380
7896
.39
Kar
ur
0.09
14.9
81.
081.
1938
25.9
17.7
871
795
7955
785
9.3
7028
979
.37
Kri
shn
agir
i0.
1327
.77
1.14
1.07
3927
.523
.13
6931
890
1145
0015
.512
2254
93.6
6
Mad
ura
i0.
128.
971.
061.
1733
28.3
15.8
967
258
6915
0613
9.8
1962
0276
.76
Nag
apat
tiam
0.37
34.9
81.
811.
3427
.08
2725
.24
4120
881
1086
1911
1150
7194
.39
Nam
mak
kal
0.05
14.8
51.
211.
1444
24.5
10.9
968
213
7478
078
12.3
1147
6768
.03
Pera
mba
lur
0.52
1.11
1.04
039
26.1
20.8
724
256
6038
615
13.4
4226
591
.36
Pud
uko
ttai
0.23
2.63
1.04
145
.54
23.3
26.3
143
890
8394
090
9.1
1044
6990
.06
Ram
anat
hap
ura
m0.
332.
951
043
.82
2432
.08
4470
778
8736
010
.495
974
91.0
2
Sale
m0.
1124
.75
1.44
1.01
2229
.522
.03
5862
376
1650
6910
2193
7275
.25
Siva
gan
ga0.
231.
231.
010
3026
.910
.68
5046
675
8896
99.
996
422
92.2
7
Th
anja
vur
0.31
15.7
71.
431.
3135
21.5
21.5
848
284
7815
5551
10.3
1641
1494
.78
Th
e N
ilgi
ris
0.00
0.47
10
34.7
918
.123
.08
5173
872
5799
325
6602
087
.84
Th
eni
0.16
16.5
21.
121
29.6
831
.110
.89
3985
671
8611
914
.496
503
89.2
4

Indi
cato
rs
Per
Cap
ita
Food
grai
n Pr
odu
c-ti
on
Legu
mi-
nou
s C
rop
(Pu
lses
) in
GC
A
Cro
ppin
g In
tens
ity
Irri
gati
on
Inte
nsit
y
Perc
enta
ge
of B
PL
Fam
ilies
U5M
RM
alno
uri
-sh
men
t
Per
Cap
ita
Inco
me
% N
oon-
mea
l B
enefi
-ci
arie
s
Off
take
of
Foo
d-
grai
ns
in
Dis
tric
ts
Perc
enta
ge
of L
ow B
irth
W
eigh
t (L
ess
than
2.
5 kg
)
Food
grai
ns
Allo
tmen
t to
Dis
tric
ts
Perc
enta
ge
of
Off
take
of
Food
grai
ns
to T
otal
A
llotm
ent
Sou
rce
Agr
i. D
ept
Agr
i. D
ept
Dep
t of
Ec
o. a
nd
Stat
isti
cs
Dep
t of
Ec
o. a
nd
Stat
isti
cs
RD
&PR
D
ept
Hea
lth
Dep
tC
DPO
DO
ESSW
D
ept
TN
CS
Hea
lth
Dep
tT
NC
ST
NC
S
Uni
tM
T%
Are
a%
Rat
e%
`%
MT
%M
TM
T
Year
2011
-12
2011
-12
2011
-12
2011
-12
2003
2012
2013
2011
-12
2013
-14
2013
2013
-14
2013
2013
Th
iru
vall
ur
0.09
8.26
1.25
2.36
27.0
220
.912
.583
594
7611
6556
11.1
1299
4289
.70
Th
iru
varu
r0.
6533
1.82
1.31
3521
.721
.48
3472
778
8443
56.
389
448
94.4
0
Tir
uva
nn
amal
ai0.
168.
31.
251.
0332
.67
29.4
29.5
841
569
8515
5196
11.6
1666
4393
.13
Th
ooth
uku
di
0.16
54.9
51.
021.
2723
.41
21.5
13.7
574
933
6591
531
811
6173
78.7
9
Tir
un
elve
li0.
1815
.99
1.16
1.57
28.6
26.1
19.2
161
899
6617
6401
10.5
2037
6486
.57
Tir
up
pu
r0.
1226
.85
1.02
1.02
35.6
60
10.4
488
549
7211
3292
9.5
1619
0369
.98
Tric
hy
0.13
8.97
1.08
1.17
3526
.221
.01
7539
380
1478
0710
.418
2899
80.8
1
Vel
lore
0.05
22.6
31.
121
4230
.823
.11
6318
580
2321
8314
.724
5699
94.5
0
Vil
lup
ura
m0.
1611
.53
1.07
142
26.7
31.0
435
295
8621
6968
10.6
2334
1792
.95
Vir
ud
hu
nag
ar0.
1320
.63
1.03
045
26.7
29.1
8736
168
1037
1112
.413
0183
79.6
7

Tamil Nadu HumaN developmeNT RepoRTStatus of Human development
62Chapter 2
Annexure Table A-2.6
b. FSI Index: Rank
DistrictAvailability
IndexRank
Accessibility Index
RankAbsorption
IndexRank FSI Rank
Ariyalur 0.222 23 0.454 18 0.454 11 0.377 17
Coimbatore 0.346 10 0.263 30 0.597 3 0.402 12
Cuddalore 0.411 5 0.528 12 0.344 20 0.428 9
Dharmapuri 0.386 8 0.566 7 0.277 24 0.409 11
Dindigul 0.302 12 0.382 27 0.472 7 0.385 15
Erode 0.229 21 0.347 28 0.433 12 0.336 26
Kancheepuram 0.190 27 0.568 6 0.555 4 0.438 8
Kanyakumari 0.204 26 0.667 2 0.814 1 0.562 2
Karur 0.252 18 0.482 15 0.414 13 0.382 16
Krishnagiri 0.331 11 0.676 1 0.258 26 0.422 10
Madurai 0.227 22 0.390 26 0.401 15 0.339 25
Nagapattiam 0.690 2 0.581 4 0.302 23 0.524 3
Nammakkal 0.270 16 0.303 29 0.459 10 0.344 24
Perambalur 0.215 25 0.261 31 0.325 21 0.267 30
Pudukottai 0.217 24 0.470 16 0.356 19 0.347 23
Ramanathapuram 0.138 29 0.448 21 0.271 25 0.286 28
Salem 0.395 7 0.468 17 0.322 22 0.395 14
Sivaganga 0.095 30 0.528 11 0.469 8 0.364 19
Thanjavur 0.459 3 0.539 9 0.408 14 0.469 7
The Nilgiris 0.000 31 0.445 22 0.233 30 0.226 31
Theni 0.278 15 0.437 23 0.362 18 0.359 21
Thiruvallur 0.397 6 0.640 3 0.498 6 0.511 4
Thiruvarur 0.788 1 0.491 14 0.460 9 0.580 1
Tiruvannamalai 0.283 13 0.575 5 0.223 31 0.360 20
Thoothukudi 0.452 4 0.451 20 0.520 5 0.474 6
Tirunelveli 0.356 9 0.451 19 0.381 16 0.396 13
Tiruppur 0.281 14 0.414 24 0.765 2 0.487 5
Trichy 0.237 20 0.530 10 0.362 17 0.377 18
Vellore 0.263 17 0.563 8 0.234 29 0.354 22
Villupuram 0.240 19 0.510 13 0.250 27 0.333 27
Virudhunagar 0.152 28 0.405 25 0.246 28 0.268 29
Tamil Nadu HumaN developmeNT RepoRTStatus of Human development
63Chapter 2
ReferencesDrèze, Jean and Reetika Khera (2012).“Regional Patterns of
Human and Child Deprivation in India”, Economic and Political Weekly 47(39): 42-49.
Engelman, R. (2009). The State of World Population 2009—Facing a Changing World: Women, Population and Climate. UNFPA.
Jeyaranjan, J. (2011). “Women and Pro-poor Policies in Rural Tamil Nadu: An Examination of Practices and Responses”, Economic and Political Weekly 46(43): 64-74.