Embed Size (px)
Citation preview

Status of Mercury in MexicoFirst Draft (June 2000)

This report was prepared by the National Institute of Ecology (InstitutoNacional de Ecología—INE), a deconcentrated body of the Ministry ofthe Environment, Natural Resources and Fisheries (Secretaría deMedio Ambiente, Recursos Naturales y Pesca—Semarnap).
The purpose of this report is to analyse the extraction, use, shippingand final disposal of waste contaminated with mercury throughoutMexico, so as to assess the quantities of this metal in circulation, andthe emissions and discharges of this metal occurring on the country’sterritory. The report also considers the risks to the general public, andespecially those segments most exposed to mercury; i.e., those thatlive in proximity to the largest emission sources or carry on workactivities that involve the use of mercury.
Report preparation and data compilation:
José Alfredo Ramírez Álvarez, Independent ConsultantJosé Castro Díaz, Assistant Director, Regional Action PlansRocío Alatorre Eden Wynter, Director, Toxic Materials

Contents
1 STATUS AND TRENDS 7
1.1. EMISSIONS INVENTORY 71.1.1. INVENTORY OF TOXICS IN MEXICO 71.2. ENVIRONMENTAL MONITORING 81.3. TRENDS 91.3.1. PATTERNS OF PRODUCTION 91.3.1.1. Primary Production 111.3.1.2. Secondary Production 111.3.2. NATIONAL CONSUMPTION 121.3.2.1. Import and Export 121.3.3. PATTERNS OF USE 131.3.3.1. Chlorine and Caustic Soda Plants 131.3.3.2. Thermometers and Sphygmomanometers 141.3.3.3. Dental Offices 141.3.3.4. Thermostats 151.3.3.5. Fluorescent Light Bulbs 161.3.3.6. Small-Scale Uses 171.3.3.7. Cultural/Religious Uses 171.3.3.8. Coal and Coke Production Processes 171.3.3.9. Coal-Fired Power Plants 181.3.3.10. Smelting 191.3.3.11. Cement Production 201.3.3.12. Incineration of Biological/Infectious and Industrial Waste 211.3.3.13. Cremation 23
2 REGULATORY FRAMEWORK FOR RISK MANAGEMENT AND POLLUTIONPREVENTION 25
2.1 FEDERAL LAWS , REGULATIONS AND STANDARDS 252.1.1 ENVIRONMENTAL POLICY 27
3 REHABILITATION ACTIVITIES 29
3.1 CONTAMINATED SITES 29BIBLIOGRAPHY 29APPENDIX 1. CONSUMPTION 31APPENDIX 2. EMISSIONS 32APPENDIX 3. EMISSION FACTORS 33APPENDIX 4. CHLORINE AND CAUSTIC SODA INDUSTRY IN NORTH AMERICA AND WESTERN EUROPE 34

Tables and Figures
Table 1.1. Legal framework applicable to work of Cinvestav (Hg mg/l). .............................................................8Table 1.2. Mercury mines in Mexico..........................................................................................................................................9Table 1.3. Primary mercury production, 1985–98 ...............................................................................................................11Table 1.4. Tailings processing plants in Zacatecas...............................................................................................................11Table 1.5. Mercury imports and exports, 1985–98...............................................................................................................12Table 1.6. Mexican mercury cell-based chlorine and caustic soda industry.................................................................13Table 1.7. Hospital and dental services in Mexico................................................................................................................14Table 1.8. Mercury content of light bulbs...............................................................................................................................16Table 1.9. Mercury consumption for light bulb production (1996–99)..........................................................................16Table 1.10. Mining production of coal and estimated mercury emissions, 1994–98...................................................17Table 1.11. Coking coal, 1994–99..............................................................................................................................................18Table 1.12. Coal-fired power plants in Coahuila, Mexico..................................................................................................18Table 1.13. Total mining production in Mexico (ton/year)................................................................................................19Table 1.14. Emission factor by metal and total mercury emissions (kg)........................................................................20Figure 1.1. Distribution of cement kilns..................................................................................................................................20Table 1.15. Biological/infectious waste incinerators in Mexico........................................................................................21Table 1.16. Companies authorized to incinerate hazardous industrial waste (ton/year)..........................................22Table 2.1 Legal framework for mercury in Mexico.............................................................................................................25Table 2.2 Mexican Official Standards governing the use of mercury.............................................................................26Table A1.1. Mercury consumption in Mexico, 1998............................................................................................................31Figure A1.1. Mercury consumption in Mexico, 1998..........................................................................................................31Table A2.1. Estimated mercury emissions in Mexico (ton/year)......................................................................................32Figure A2.1. Estimated mercury emissions in Mexico, 1998.............................................................................................32Table A3.1. Mercury emission factors .....................................................................................................................................33Table A4.1. Chlorine production with mercury cell technology (MT/year)..................................................................34

Abbreviations
ADM Mexican Dental AssociationANIQ National Chemical Industry AssociationBancomext National External Trade BankBOD Biochemical Oxygen DemandCanacem National Cement Industry AssociationCanacintra National Processing Industry AssociationCEC North American Commission for Environmental CooperationCemex Cementos MexicanosCenica National Environmental Information and Training CentreCFE Federal Electricity CommissionCinvestav IPN Centre for Advanced Research and StudyCNA National Water CommissionCOA Annual Certificate of OperationConae National Energy Efficiency CommissionCoremi Council of Mineral ResourcesCRETIB Corrosive, Reactive, Explosive, Toxic, Ignitable or Biological/InfectiousDgmryar High-Risk Materials, Wastes and Activities BranchDIF Mexican Family Development ProgramDMT Toxic Materials DirectorateEPA U.S. Environmental Protection AgencyGIS Geographical Information SystemIMSS Mexican Institute of Social SecurityINE National Institute of EcologyINEGI National Institute of Statistics, Geography and InformaticsISSSTE Institute of Social Security and Social Services for Public EmployeesLAU Comprehensive Environmental LicenseLGEEPA General Law on Ecological Balance and Environmental ProtectionMBAS Methylene blue active substancesMT Metric tonNAAEC North American Agreement on Environmental CooperationNAFTA North American Free Trade AgreementNARAP North American Regional Action PlanNOM Mexican Official StandardOECD Organization for Economic Cooperation and DevelopmentPemex Petróleos MexicanosProfepa Office of the Federal Attorney for Environmental ProtectionPRTR Pollutant Release and Transfer RegistryPUMA University Environment ProgramSagar Ministry of Agriculture, Animal Husbandry and Rural DevelopmentSCT Ministry of Communications and TransportationSecofi Ministry of Trade and Industrial DevelopmentSedena Ministry of National DefenseSedesol Ministry of Social DevelopmentSedue Ministry of Urban Development and Ecology

NOTE: The data and quantities presented in this draft have been obtained from official and unofficial sources, bothnational and international. This data is under review to determine whether more accurate data is required.
Draft: Do not cite or reference June 2000 Status of Mercury in Mexico -6
Semarnap Ministry of the Environment, Natural Resources and FisheriesSNIA National Environmental Information SystemSsa Ministry of HealthSTPS Ministry of Labour and Social WelfareTSS Total Suspended Solids

NOTE: The data and quantities presented in this draft have been obtained from official and unofficial sources, bothnational and international. This data is under review to determine whether more accurate data is required.
Draft: Do not cite or reference June 2000 Status of Mercury in Mexico -7
1 Status and Trends
1.1. Emissions Inventory
1.1.1. Inventory of Toxics in Mexico
Industrial Emissions
The Pollutant Release and Transfer Registry (PRTR) is a component of the NationalEnvironmental Information System (Sistema Nacional de Información Ambiental—SNIA)bringing together information on air, water and soil pollution by means of relationaldatabases, geographic information system (GIS) tools and estimation methods for airemissions, wastewater discharges and hazardous waste generation. Thanks to thisinventory, it is possible to ascertain emissions and transfers of 105 pollutants in thecountry’s various industrial sectors. So far, mercury emissions have not been included,since the final phase of training for companies in this pollutant is in progress, as is theestablishment of the legal requirement to report these emissions (INE-Semarnap, 1999).
Air Emissions in Large Cities
In Mexico, there exists an air emissions inventory comprising 14 cities (Aguascalientes,Cananea, Coatzacoalcos, Federal District, Guadalajara, Ciudad Juárez, Manzanillo,Mexicali, Monterrey, Nacozari, Querétaro, San Luis Potosí, Tijuana and Toluca). Theseven pollutants monitored and regulated are: ozone (O3), inhalable particles (PM10),nitrogen dioxide (NO2), sulfur dioxide (SO2), carbon monoxide (CO), total suspendedparticles (TSP) and lead (Pb).
Mercury is not yet regulated, and so is not monitored. The National Institute of Ecology(Instituto Nacional de Ecología—INE), through its National Centre for EnvironmentalResearch and Training (Centro Nacional de Investigación y Capacitación Ambiental),has undertaken activities to develop mercury measurement capacity.
Incineration Emissions
A draft Mexican Official Standard (NOM-098-ECOL/99), in process of approval, willgovern and determine the requirements and specifications for the adequate operation ofincinerators as well as the maximum allowable air emissions and wastewater dischargesand the management of solid waste produced by the incineration of municipal solidwaste, hazardous waste, non-hazardous industrial waste and biological/infectiouswaste, with a view to reducing the risks they represent for health and the environment.
This standard sets the maximal allowable limit at 0.07 mg/m3 for mercury emissions.Measurements must be taken every four months and the sampling time is one hour with
NOTE: The data and quantities presented in this draft have been obtained from official and unofficial sources, bothnational and international. This data is under review to determine whether more accurate data is required.
Draft: Do not cite or reference June 2000 Status of Mercury in Mexico -8
an average of 3 samples over an 8-hour period. The data now being generated has notyet been systematized.
1.2. Environmental Monitoring
The National Water Commission (Comisión Nacional del Agua—CNA), an agency of theSemarnap, conducts systematic observation of the country’s water quality through itsNational Water Quality Monitoring Network (Red Nacional de Monitoreo de la Calidaddel Agua—RNM). The RNM has been in operation since 1974, the year that the firstperiodic monitoring program for national water quality was applied in 14 regions or workzones, each with its own laboratory, with a total of 239 sampling stations. The programexpanded, by 1998, to involve 3,345 samples and a total of 101,576 analyses, with thenumber of stations increasing to 743. In 1999, 3,365 samples were taken and 102,179analyses were performed.
The data generated by the CNA includes pH, hardness, alkalinity, total suspended solids(TSS), methylene blue active substances (MBAS) and biochemical oxygen demand(BOD). For mercury, in 1991, the Cuautitlán River in the State of Mexico and the GrandCanal in the Federal District exceeded the limit, with 0.3 and 0.2 mg/l, respectively. Itshould be noted that these rivers receive discharges from the metropolitan industrialzone. Between 1994 and 1998, the CNA did not report any river exceeding the standard.
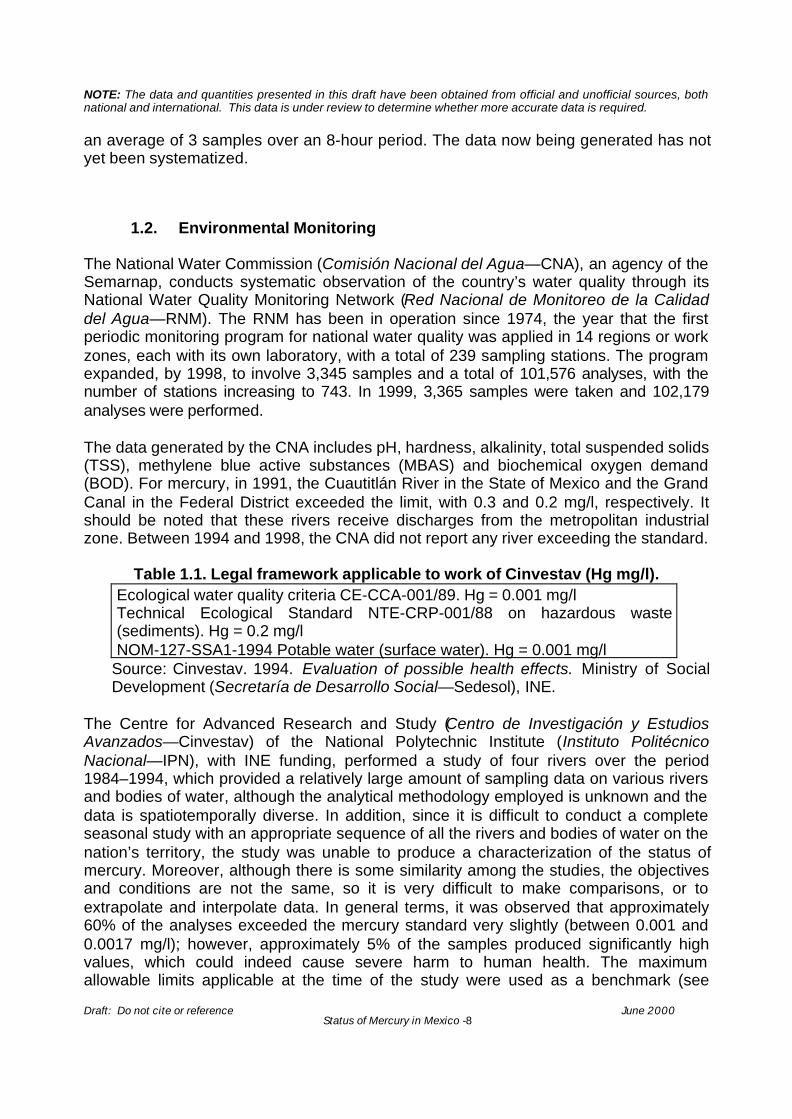
Table 1.1. Legal framework applicable to work of Cinvestav (Hg mg/l).Ecological water quality criteria CE-CCA-001/89. Hg = 0.001 mg/lTechnical Ecological Standard NTE-CRP-001/88 on hazardous waste(sediments). Hg = 0.2 mg/lNOM-127-SSA1-1994 Potable water (surface water). Hg = 0.001 mg/l
Source: Cinvestav. 1994. Evaluation of possible health effects. Ministry of SocialDevelopment (Secretaría de Desarrollo Social—Sedesol), INE.
The Centre for Advanced Research and Study (Centro de Investigación y EstudiosAvanzados—Cinvestav) of the National Polytechnic Institute (Instituto PolitécnicoNacional—IPN), with INE funding, performed a study of four rivers over the period1984–1994, which provided a relatively large amount of sampling data on various riversand bodies of water, although the analytical methodology employed is unknown and thedata is spatiotemporally diverse. In addition, since it is difficult to conduct a completeseasonal study with an appropriate sequence of all the rivers and bodies of water on thenation’s territory, the study was unable to produce a characterization of the status ofmercury. Moreover, although there is some similarity among the studies, the objectivesand conditions are not the same, so it is very difficult to make comparisons, or toextrapolate and interpolate data. In general terms, it was observed that approximately60% of the analyses exceeded the mercury standard very slightly (between 0.001 and0.0017 mg/l); however, approximately 5% of the samples produced significantly highvalues, which could indeed cause severe harm to human health. The maximumallowable limits applicable at the time of the study were used as a benchmark (see

NOTE: The data and quantities presented in this draft have been obtained from official and unofficial sources, bothnational and international. This data is under review to determine whether more accurate data is required.
Draft: Do not cite or reference June 2000 Status of Mercury in Mexico -9
previous table). The following are the highest values observed in surface water in threeof the four rivers:
• In the San Juan River, the mercury limit was exceeded at 9 (32%) of the 28 samplingstations; the mercury concentration exceeded the standard 11 times, with amaximum recorded mercury value of 0.0011 mg/l (Cinvestav, 1994).
• In the Lerma-Chapala-Santiago system, the standard was exceeded at 6 (33%) of 18stations; the mercury concentration exceeded the limit twice, and a maximum valueof 0.0021 mg/l was recorded (Cinvestav, 1994).
• In the Coatzacoalcos River, the limit was exceeded at 3 (14%) of 22 samplingstations, and the mercury concentration exceeded the limit 380 times, with amaximum value of 0.38 mg/l recorded at the Pajaritos lagoon station (Cinvestav,1994).
1.3. Trends
Mercury-containing minerals are found in 21 Mexican states (Aguascalientes,Chihuahua, Coahuila, Colima, Mexico, Durango, Guanajuato, Guerrero, Hidalgo,Jalisco, Michoacán, Morelos, Nayarit, Puebla, Querétaro, San Luis Potosí, Sinaloa,Sonora, Tamaulipas, Veracruz and Zacatecas), in the northern and central parts of thecountry. A 1994 report of the National Institute of Statistics, Geography and Informatics(Instituto Nacional de Estadística, Geografía e Informática—INEGI) on the history ofmercury production mentions that this activity has been taking place since 1891. From1920 to 1929, production was minimal, but it increased from that date on, reaching1,118 tons in 1942. The declining price for this element on world markets hasdepressed production, with world production dropping from 6,100 MT in 1990 to 2,200MT in 1994. In the latter year, Mexico contributed a mere 0.5% (11 tons). Between 1995and 1999, no primary production was officially recorded for Mexico (Anuario Estadísticode la Minería Mexicana [Statistical Yearbook of Mexican Mining], 1999).
1.3.1. Patterns of Production
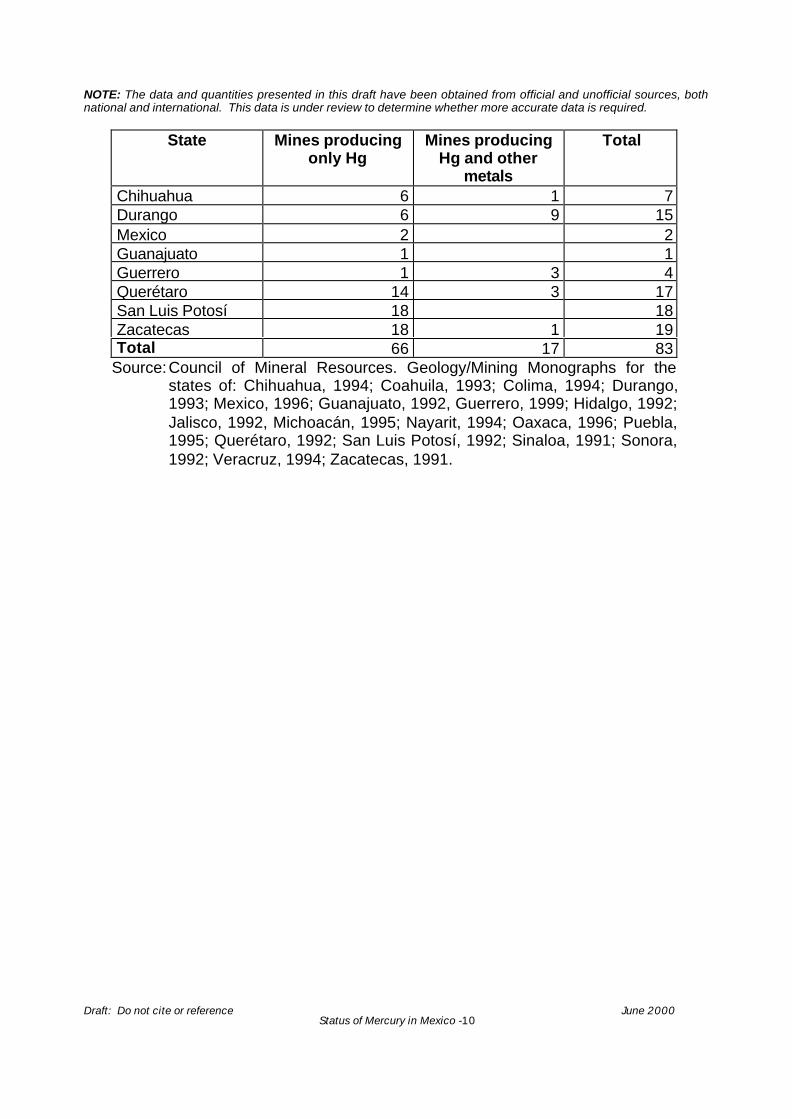
The Council of Mineral Resources (Consejo de Recursos Minerales—Coremi), in itsstate-by-state geological and mining monographs, states that of the total of 4,705 minesinventoried, 83 produce mercury. They are located in 8 states (Chihuahua, Durango,Mexico, Guanajuato, Guerrero, Querétaro, San Luis Potosí and Zacatecas). Of these,66 report that they produce only mercury, while 17 produce mercury and one or moreother minerals (Table 1.2). No study has yet been done on the status of each of thesemines, since none has declared production to the Ministry of Trade and IndustrialDevelopment (Secretaría de Comercio y Fomento Industrial—Secofi) in the last 5 years(Table 1.3). However, it is possible that they are still being operated on a small-scalebasis in order to produce mercury for the informal market.
Table 1.2. Mercury mines in Mexico
NOTE: The data and quantities presented in this draft have been obtained from official and unofficial sources, bothnational and international. This data is under review to determine whether more accurate data is required.
Draft: Do not cite or reference June 2000 Status of Mercury in Mexico -10
State Mines producingonly Hg
Mines producingHg and other
metals
Total
Chihuahua 6 1 7Durango 6 9 15Mexico 2 2Guanajuato 1 1Guerrero 1 3 4Querétaro 14 3 17San Luis Potosí 18 18Zacatecas 18 1 19Total 66 17 83
Source:Council of Mineral Resources. Geology/Mining Monographs for thestates of: Chihuahua, 1994; Coahuila, 1993; Colima, 1994; Durango,1993; Mexico, 1996; Guanajuato, 1992, Guerrero, 1999; Hidalgo, 1992;Jalisco, 1992, Michoacán, 1995; Nayarit, 1994; Oaxaca, 1996; Puebla,1995; Querétaro, 1992; San Luis Potosí, 1992; Sinaloa, 1991; Sonora,1992; Veracruz, 1994; Zacatecas, 1991.
NOTE: The data and quantities presented in this draft have been obtained from official and unofficial sources, bothnational and international. This data is under review to determine whether more accurate data is required.
Draft: Do not cite or reference June 2000 Status of Mercury in Mexico -11
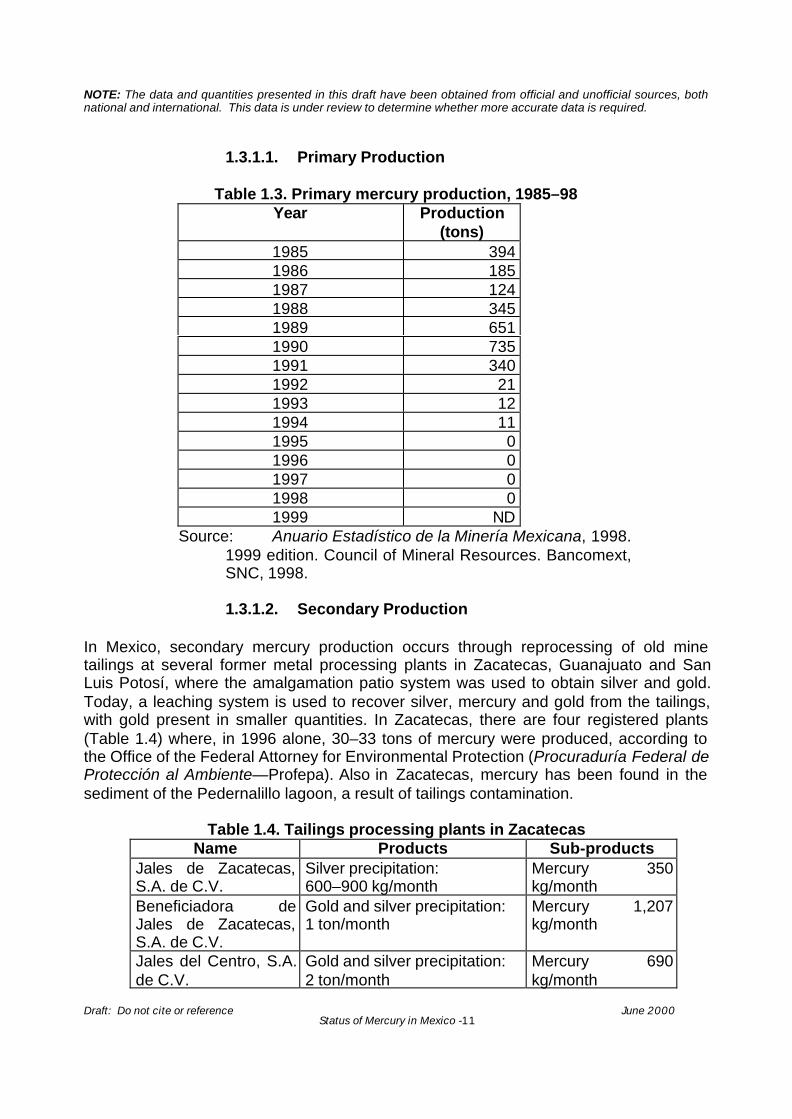
1.3.1.1. Primary Production
Table 1.3. Primary mercury production, 1985–98Year Production
(tons)1985 3941986 1851987 1241988 3451989 6511990 7351991 3401992 211993 121994 111995 01996 01997 01998 01999 ND
Source: Anuario Estadístico de la Minería Mexicana, 1998.1999 edition. Council of Mineral Resources. Bancomext,SNC, 1998.
1.3.1.2. Secondary Production
In Mexico, secondary mercury production occurs through reprocessing of old minetailings at several former metal processing plants in Zacatecas, Guanajuato and SanLuis Potosí, where the amalgamation patio system was used to obtain silver and gold.Today, a leaching system is used to recover silver, mercury and gold from the tailings,with gold present in smaller quantities. In Zacatecas, there are four registered plants(Table 1.4) where, in 1996 alone, 30–33 tons of mercury were produced, according tothe Office of the Federal Attorney for Environmental Protection (Procuraduría Federal deProtección al Ambiente—Profepa). Also in Zacatecas, mercury has been found in thesediment of the Pedernalillo lagoon, a result of tailings contamination.
Table 1.4. Tailings processing plants in ZacatecasName Products Sub-products
Jales de Zacatecas,S.A. de C.V.
Silver precipitation:600–900 kg/month
Mercury 350kg/month
Beneficiadora deJales de Zacatecas,S.A. de C.V.
Gold and silver precipitation:1 ton/month
Mercury 1,207kg/month
Jales del Centro, S.A.de C.V.
Gold and silver precipitation:2 ton/month
Mercury 690kg/month

NOTE: The data and quantities presented in this draft have been obtained from official and unofficial sources, bothnational and international. This data is under review to determine whether more accurate data is required.
Draft: Do not cite or reference June 2000 Status of Mercury in Mexico -12
Mercurio del Bordo,S.A. de C.V.
Gold and silver precipitation:0.5 ton/month
Mercury 518kg/month
Source: Office of the Deputy Attorney for Environmental Auditing, Profepa.July, 1996. Directorio de la Minería Mexicana, 1999.
In a preliminary study by the Universidad Nacional Autónoma de México (UNAM),similar data were obtained in 1999 for two of the companies listed in Table 1.4, andtherefore it is believed that production has been maintained at the same level up to thepresent year.
1.3.2. National Consumption
In Mexico, the majority of mercury consumption, generally of secondary origin, is relatedto the manufacturing of chlorine, light bulbs, amalgams and instruments. Mercuryconsumption in Mexico in 1996 was 30–33 tons.
There is unquantified small-scale production corresponding to mercury consumption fornon-essential uses (see Sections 1.3.3.6, Small-Scale Uses, and 1.3.3.7, Cultural andReligious Uses).
1.3.2.1. Import and Export
Except for 1998, in recent years Mexico has not needed to purchase mercury in largequantities abroad. According to the Catalogue of Exporting and Importing Companies(Secofi-Bancomext), in 1998, 6 companies purchased 13.7 tons of mercury abroad,among them two fluorescent bulb manufacturers and one restorative dentistry company.In recent years (1994–98), a total of about 12 tons of mercury was exported, including 7in 1997 (Table 1.5.).
Table 1.5. Mercury imports and exports, 1985–98Year Imports (ton) Exports (ton)1985 7 921986 0 1541987 0 1211988 0.4 1421989 276.1 911990 0.4 23.21991 2.15 0.31992 101.9 1.91993 40.5 0.31994 27.8 0.31995 5.78 0.31996 0.85 41997 0.87 7.01998 13.74 0.24
Source: Anuario Estadístico de la Minería Mexicana, 1998.

NOTE: The data and quantities presented in this draft have been obtained from official and unofficial sources, bothnational and international. This data is under review to determine whether more accurate data is required.
Draft: Do not cite or reference June 2000 Status of Mercury in Mexico -13
1999 edition. Council of Mineral Resources. Bancomext,SNC, 1998.
1.3.3. Patterns of Use
Note: In the absence of emissions estimation methodologies developed specificallyfor Mexico, the results of the calculations in this section were obtained fromemission factors of the EPA (Environmental Protection Agency, 1997. Locating andEstimating Air Emissions from Sources of Mercury and Mercury Compounds), aswell as Parcom-Atmos (Parcom-Atmos Emission Factors Manual, The Netherlands,1992). These results should be viewed with caution (Appendix 3) since, amongother things, Mexico’s technological and climatic context is different, and as for themining industry, the mercury content in the extracted minerals has not beenanalyzed. Regarding consumption data, these were estimated from official statisticsand data provided by the various industries. The difference between emissions andconsumption resides in the fact that the emissions go to the atmosphere, while theexact endpoint of the mercury consumed is not known (water, air, soil and whetherthe products are transformed or stay in the same form). The results are presentedindividually in sections by economic sector and service, as well as globally in thefigures in Appendices 1 and 2 on consumption and emissions, respectively.
1.3.3.1. Chlorine and Caustic Soda Plants
The company Industria Mexicana de Cloro-Alcali (IMCA) currently produces 447,000 MTof chlorine per year, of which 147,000 (33% of national production) is produced usingthe mercury cathode process. The last plant of this type was commissioned in 1967 andthere are no plans to build any new plants using this technology. It is important to notethat the mercury used in these plants is primarily of secondary origin, from tailingsrecycling plants.
Table 1.6. Mexican mercury cell-based chlorine and caustic soda industryYear Chlorine production
(ton/year)Mercury used(tons Hg/year)
1995 121,846 5.2581996 131,211 5.1741997 134,786 5.4031998 141,446 5.6581999 133,352 5.767Total 662,641 27.26
Source:National Chemical Industry Association (ANIQ), AC, 2000.
The waste generated by the brine treatment process consists of sludge mainlycomposed of calcium and magnesium (hydroxides and sulfides) with traces of mercury(< 0.001 mg/l discharge). The sludge, once filtered and partially dehydrated, is sent forcontrolled disposal in accordance with the applicable regulations.

NOTE: The data and quantities presented in this draft have been obtained from official and unofficial sources, bothnational and international. This data is under review to determine whether more accurate data is required.
Draft: Do not cite or reference June 2000 Status of Mercury in Mexico -14
As regards the program proposed by the Chlorine Institute in 1995 to phase down theuse of mercury cells by 50% by 2005, IMCA is in a position to adopt it, but with 2001 asa baseline year, so that the goal would be attained in 2011.
For additional information, Appendix 4 presents a table provided by the NationalChemical Industry Association (Asociación Nacional de la Industria Química—ANIQ)comparing Mexico with North America and Western Europe as regards mercury-cellchlorine production.
Consumption calculation:
Annual installed production capacity = 147,000 tonEmission factor = 41.2 g/ton depending on mercury purchases (average).Total emissions for 1998 = 5.658 ton (Appendix 1).
1.3.3.2. Thermometers and Sphygmomanometers
Mercury is used in various types of thermometers in the health-care sector, laboratories,industry and other sectors, with an approximate content of 1 g mercury per item.According to official statistics, the country has a total of 160,017 beds in the variouspublic and private hospitals. Assuming one thermometer per bed and one out of fourbroken per week, a total of 40,000 thermometers are replaced per week, which,multiplied by 52 weeks, gives a total of 2,080,000. Adding the 160,000 initial ones, thetotal number of thermometers used in one year is 2,240,000, and the total mercurycontent is 2,240 kg/year.
Consumption calculation:
For sphygmomanometers, whose average mercury content is 6 g, if there is one forevery four beds, then the total number is 40,000, which require maintenance four timesper year. In this cleaning process, an average of 1 g is lost, representing consumption of160 kg/year (Appendix 1).
Summing these two values yields total national hospital consumption of 2,400 kg peryear (Appendix 1).
1.3.3.3. Dental Offices
According to official statistics, there are 10,781 dentists (Table 1.7), of whom, accordingto a Mexican Dental Association (Asociación Dental Mexicana) survey, 70% are stillusing the mortar and pestle technique. This practice generates approximately 200g/yearof mercury per professional. The remaining 30% use pre-encapsulated amalgam.
Table 1.7. Hospital and dental services in MexicoInstitution State Hospital Beds Dental
officesDentists

NOTE: The data and quantities presented in this draft have been obtained from official and unofficial sources, bothnational and international. This data is under review to determine whether more accurate data is required.
Draft: Do not cite or reference June 2000 Status of Mercury in Mexico -15
(IMSS) FederalDistrict
----- 27,616 *3 132 *1 1,834 Total *2
States ----- 7,683 *3 691 *1 -----(ISSSTE) Federal
District99 Total
+4,154 + 108 + 946 Total *2
States 9,358 + 324 + -----(Ssa)Health Centres,
FederalDistrict
----- 2,012 *2 185 *2 356 *2
All 3rd levelcentres
States ----- 54,036*2 2,009 *2 2,084 *2
Private FederalDistrict
228 *2 7,191 *3 79 *2 4,613 Total *2
States 1944 *2 34,456 *3 359 *2 -----State, Federal
District----- 4,255 *3 ----- 928 Total *2
Pemex,Sedena,Marine, DIF
States ----- 7,340 *3 ----- -----
Red Cross FederalDistrict
1 85 *3 ----- 20 *2
States ----- 1,831 *3 -----Total 2,271 45,313
114,704160,017
3,887 10,781
*1 Administrative Branch; Construction, Maintenance and EquipmentDirectorate; Regulatory and Technological Innovation Division;Technological Innovation and Adaptation. IMSS. 1999.
*2 Ssa page: http://www.ssa.gob.mx/dgei/ Nov-99.*3 INE page: http://www.ine.gob.mx/dgrmar Jan-99.+ Statistical Yearbook 1998, Finance Division, ISSSTE.++ Private dentists, Mexican Dental Association, 1999.Note: Data in process of validation.
Consumption calculation:
Of a total of 10,781 practising dental professionals, 70% (7,547) are using mortar andpestle, generating approximate emissions of 200 g/year per professional.Total mercury emissions = 1.51 ton (Appendix 1).
1.3.3.4. Thermostats
Consumption calculation:
The thermostats are used in the country to regulate air conditioners. According toindustry sources, some 36,000–40,000 units are sold in Mexico annually. Eachthermostat contains one or two 3-g capsules of mercury, approximately. Assuming a

NOTE: The data and quantities presented in this draft have been obtained from official and unofficial sources, bothnational and international. This data is under review to determine whether more accurate data is required.
Draft: Do not cite or reference June 2000 Status of Mercury in Mexico -16
per-unit average of 4 g of mercury, the estimated average consumption in order to buildthis equipment is 152 kg (Appendix 1).
1.3.3.5. Fluorescent Light Bulbs
There are various kinds of mercury-containing bulbs on the market: fluorescent, metalhalide, high-pressure sodium and neon bulbs. All fluorescent light bulbs containelemental mercury, with the approximate content of a 120 cm tube being 15–25 mg(Tables 1.8 and 1.9). There are three main manufacturers in Mexico (General Electric,Osram, Phillips). To date, no program has been established to collect and recycle thismercury in the country.
Table 1.8. Mercury content of light bulbsYear Type of bulb Production Hg
content/unitTotal Hgcontent
Nationalproduction(%)
1996 Fluorescent 22 million 40 mg 880 kg 100% Compact
(112/T8) 4 million 10 mg 40 kg 20%
1997 Fluorescent 25 million 40 mg 1000 kg 95% Compact
(112/T8) 5 million 10 mg 50 kg 20%
1998 Fluorescent 27 million 35 mg 945 kg 80% Compact
(112/T8) 6 million 10 mg 60 kg 20%
1999 Fluorescent 30 million 30 mg 900 kg 75% Compact
(112/T8) 7 million 5 mg 35 kg 20%
Source:Information provided by Caname on February 7, 2000.
Table 1.9. Mercury consumption for light bulb production (1996–99)Year Production
(million)Total Hg
content (kg) 1996 26 920 1997 30 1,050 1998 33 1,005 1999 37 935
Source: Information provided by Caname onFebruary 7, 2000.
Consumption calculation:
Approximately 1 ton of mercury per year is used in the production of light bulbs(Appendix 1).

NOTE: The data and quantities presented in this draft have been obtained from official and unofficial sources, bothnational and international. This data is under review to determine whether more accurate data is required.
Draft: Do not cite or reference June 2000 Status of Mercury in Mexico -17
1.3.3.6. Small-Scale Uses
Largely on the informal market, craft products containing encapsulated liquid mercury(up to 0.8–4.5 g of mercury mixed with water or glycerine) are sold; e.g., glass charmbracelets or necklaces. These may occur with or without ornaments of stone or chaquira(painted glass beads). They are found in four different models.
Consumption calculation:
In a survey conducted in Mexico City in three markets where these bracelets ornecklaces were being sold wholesale, a monthly sale of approximately 3,000 pieces permarket was found, i.e. 9,000 per month. Assuming that each piece contains an averageof 2.65 g, mercury consumption is calculated at 23.85 kg.
Besides Mexico City, other cities such as Querétaro and Zacatecas are also significantdistributors, leading to a conservative estimate of mercury consumption in Mexico forthis item of 75 kg/month or 900 kg/year (Appendix 1).
The INE has made contact with the competent authorities to eliminate mercuryconsumption for this non-essential use.
1.3.3.7. Cultural/Religious Uses
In a survey conducted by the INE at the Sonora plant market in the Federal District, 35stands were found to be distributing liquid mercury in small glass or plastic containers,with volumes ranging from 7–15 g. Daily average sale according to the survey is onecontainer per stand (35 containers total), with an average content of 12.5 g, amountingto approximate monthly consumption of 9.375 kg (112.5 kg/year) (Appendix 1).
It should be noted that due to the belief that mercury brings good luck, this substance issprinkled on the floors of homes and businesses. To date, the risks due toenvironmental exposure to mercury in this way have not been assessed; however, in thelast four years, five intoxications by elemental mercury attributed to this non-essentialuse have been recorded.
1.3.3.8. Coal and Coke Production Processes
In Mexico, there exist two main types of coal; thermal (Table 1.10) for direct combustionin coal-fired power plants, and coking (Table 1.11), for metallurgical use. The mercurycontent of coal in Mexico has not been analyzed.
Table 1.10. Coal production and estimated mercury emissions, 1994–98Year Coal production
(ton/year)Estimated emissions
(kg Hg/year)

NOTE: The data and quantities presented in this draft have been obtained from official and unofficial sources, bothnational and international. This data is under review to determine whether more accurate data is required.
Draft: Do not cite or reference June 2000 Status of Mercury in Mexico -18
1994 11,432,222.00 1,557.071995 11,800,258.00 1,607.201996 13,745,528.00 1,872.141997 12,707,443.30 1,730.751998 12,378,788.40 1,685.99Total 62,064,239.70 8,453.15
Source: Anuario Estadístico de la Minería Mexicana, 1998. 1999 edition.Council of Mineral Resources. Secofi.
Table 1.11. Coking coal, 1994–99Year Coke production (ton/year) Estimated emissions
(kg Hg/year)1994 1,984,730 54.11995 2,147,602 58.51996 2,184,364 59.51997 2,139,376 58.31998 2,202,558 60.01999 2,219,845 60.5Total 12,878,475 350.9
Source: INEGI page, 2000. Mining industry.
Emissions calculation:
Coal production = 62,064,239.70 ton (period 1994–98).Emission factor = 1.362 x 10⁻⁴ kg Hg/ton (EPA, 1997).Total emissions = 8.45 ton (Appendix 2).
Coking coal = 12,878,475 ton (period 1994–98).Emission factor = 2.724 x 10⁻⁵ kg Hg/ton (EPA, 1997).Total emissions = 0.351 ton (Appendix 2).
1.3.3.9. Coal-Fired Power Plants
All available technologies are used to generate electrical power in Mexico. In late 1994,the Federal Electricity Commission had a productive capacity of more than 31,600 MW,of which 28.8% corresponded to hydroelectric plants, 6% to coal-fired plants, 2.38% togeothermal plants, 54.02% to hydrocarbon-based thermal plants, 6.64% to combinedcycle plants, 2.13% to nuclear plants and 0.01% to wind plants.
At the present time, only 6% of the electricity in Mexico is generated by the two coal-fired plants, both located in the state of Coahuila (Table 1.12).
Table 1.12. Coal-fired power plants in Coahuila, MexicoPlant
Río Escondido (President José López Portillo) plant

NOTE: The data and quantities presented in this draft have been obtained from official and unofficial sources, bothnational and international. This data is under review to determine whether more accurate data is required.
Draft: Do not cite or reference June 2000 Status of Mercury in Mexico -19
24 km south of Piedras Negras.4 units, 300 MW capacity each.Total production capacity: 1,200 MW.Annual coal consumption: 4.2 million tons.Carbón II plant.24 km south of Piedras Negras.4 units, 350 MW capacity each.Total production capacity: 1,400 MW.Annual coal consumption: 6.3 million tons.
Source: CFE, Carbón II. Information bulletin. Undated.
At mid-year 2000, in Petacalco, Guerrero, the CFE will begin converting a petroleum-based thermal plant to coal. The new plant will have six units with 350 MW capacityeach for a total production capacity of 2,100 MW. Annual coal consumption is estimatedat approximately 8 million tons. The mercury content of coal mined in Mexico has notbeen analyzed.
Emissions calculation:
Annual coal consumption = 10,500,000 ton.Emission factor = 0.25 g/ton (Parcom-Atmos, 1992).Total emissions = 2.625 ton (average for 1997 and 1998) (Appendix 2).
1.3.3.10. Smelting
The smelting industry in Mexico is under the umbrella of the industry associationSociedad Mexicana de Fundidores. In 1999, according to its national directory, therewere 482 foundries for both primary and recycled (secondary) metals, of which two aremicro-businesses with monthly capacity less than 200 tons; 194 are small businesses,200–500 tons; 193 are mid-sized businesses, 500–1000 tons, and 93 are largebusinesses producing more than 1000 tons monthly.
Many of these companies are producing more than one metal. The data obtained showsthat the small companies are more diversified in their activities: some of them produceup to five different metals. The large companies are more specialized and concentrateon one or two metals.
No study has yet been done on the type of technology and fuel they use; no accurateproduction data is available (Table 1.13), nor is it known whether their production isprimary or secondary, nor the magnitude of their mercury emissions.
Table 1.13. Total mining production in Mexico (ton/year)1995 1996 1997 1998 1999 Total
Silver 2,495,522 2,536,465 2,701,329 2,868,099 2,337,554 24,581,545
Gold 20,902 24,083 26,032 25,983 22,285 172,945Copper 339,347 327,976 338,932 344,753 321,041 3,143,436

NOTE: The data and quantities presented in this draft have been obtained from official and unofficial sources, bothnational and international. This data is under review to determine whether more accurate data is required.
Draft: Do not cite or reference June 2000 Status of Mercury in Mexico -20
Lead 179,741 167,115 180,349 171,611 125,956 1,680,597Zinc 354,673 348,329 377,861 371,899 321,205 3,411,664
Source: Anuario Estadístico de la Minería Mexicana, 1998. 1999 edition. Council ofMineral Resources. Secofi. INEGI mining industry Web page, 1999.
Emissions calculation:
Three metals possibly involving mercury in their production processes wereconsidered. The values for gold and silver were not estimated since the emissionsfactors were not available; for these, only production data are presented (Table 1.14).It should also be clarified that the calculation for the other three metals wasperformed with gross mining production data, with no accounting for the technologyused nor the mercury content of the minerals.
Table 1.14. Emission factor by metal and total mercury emissions (kg)Emission
factor*1995 1996 1997 1998 1999 Total
emissionsCopper 0.1 g/ton 33,9 32,8 33.9 34.5 32.1 167.2Lead 3 g/ton 539,2 501,3 541.1 514.8 377.9 2,474.3Zinc 20 g/ton 7,093.5 6,966.6 7,557.2 7,438.0 6,424.1 35,479.4Total 7,666.6 7,500.7 8,132.2 7,987.3 6,834.1 38,120.9
* (Parcom-Atmos, 1992). (Appendix 3).
1.3.3.11. Cement Production
In Mexico, there are three large companies with a total of 29 cement kilns (Figure 1.1),of which 24 are authorized to use alternate fuels while the remaining ones use heavyfuel oil. Cemex has a total of 16 plants, Cementos Apasco has six and Cooperativa LaCruz Azul has three.
Figure 1.1. Distribution of cement kilns
Source: National Association of Cement Producers (Canacem).

NOTE: The data and quantities presented in this draft have been obtained from official and unofficial sources, bothnational and international. This data is under review to determine whether more accurate data is required.
Draft: Do not cite or reference June 2000 Status of Mercury in Mexico -21
Emissions calculation:
Cement production = 30,000,000.00 ton (INEGI).Emission factor = 0.087 g/ton (EPA).Total emissions = 2.61 ton (Appendix 2).
1.3.3.12. Incineration of Biological/Infectious and IndustrialWaste
In Mexico, there are 24 authorized incinerators of biological/infectious waste (Table1.15). Under NOM 098, they are required to report emissions of lead, total suspendedparticles, dioxins, furans and mercury, among others. The incineration temperature atthese facilities does not exceed 300 °C.
Table 1.15. Biological/infectious waste incinerators in MexicoCompany State Capacity (kg/h)
Tradem Federal District 1000Control de Desechos Ind. y Monit.Amb.
Coahuila 200
Tradem Mexico 500Sterimed Mexico 109Soluciones Ecológicas Integrales Mexico 1400Protección Integral del MedioAmbiente
Mexico 45
Desechos Biológicos Mexico 250Proterm-JV de México Mexico 350Proterm-JV de México Mexico 200Tecnología Especializada enReciclaje
Hidalgo 1000
Alicia Chávez González Jalisco 360Ciba Especialidades QuímicasMéxico
Jalisco 588
Servicios de Tecnología Ambiental Nuevo León 350Bio-System Technology Nuevo León 270Ecotérmica de Oriente Puebla 350Marepel Sinaloa 200Secam Tamaulipas 220Ecología del Mayab Yucatán 270Incineradores, Mantenimiento yEquipo
Jalisco 420
Centro Ambiental San Luis Potosí 90Bio-Tratamientos Mexico 340Ameq de México Coahuila 112.5Técnicas Especiales Reducción deAltamirano
Tamaulipas 250

NOTE: The data and quantities presented in this draft have been obtained from official and unofficial sources, bothnational and international. This data is under review to determine whether more accurate data is required.
Draft: Do not cite or reference June 2000 Status of Mercury in Mexico -22
Control Ambiental del Bajío Guanajuato 83Total companies: 24 8,957.5
Source:National Institute of Ecology. High Risk Materials, Wastes and ActivitiesBranch. Internal Report. March 2000.
The installed capacity for biological/infectious waste incineration in Mexico as ofDecember 1999 was 18,632 ton/year, assuming 260 days of operation at 8 hours perday. If it is considered that the application of the regulations takes approximately threeyears, it can be estimated that operations are at 40% of capacity, so that the volume ofincineration should now be 7,453 ton/year. Applying an emission factor of 0.96 g/ton, weobtain an approximate figure of 7.15 ton/year of mercury emissions.
Emissions calculation:
Average annual incineration for 1997–1999 = 7,453 ton.Emission factor = 0.96 g/ton (Parcom-Atmos, 1992).Estimated annual emissions (1997–1999) = 7.15 ton (Appendix 2).
For hazardous industrial waste, there are 11 incinerators in Mexico with an installedcapacity of 65,400 tons per year, 10% of which is currently in use. Among the wastesincinerated are oils and greases, solvent-soaked rags and pharmaceutical industrywaste.
Table 1.16. Companies authorized to incinerate hazardous industrial waste(ton/year)
Company Hazardous wastes Installedcapacity
Tecnología Especializada enReciclaje, Tepeji del Río,Hidalgo
Industrial and biological/infectious waste. 7,500
Ciba Geigy Mexicana,Atotonilco, Jal.
Industrial and pharmaceutical waste. 2,075
Kodak de México, Zapopan,Jalisco
Waste from production of photographicfilm, filter paper, activated sludge,foundry slag and silver recovery processsludge.
613
Bayer de México, Ecatepec,State of Mexico
Incineration of hazardous wastegenerated by the company.
1,752
Aceros Nacionales,Tlalnepantla, State of Mexico
Incineration of oil and grease-soakedsawdust, rags, gloves and flash.
183
Siderúrgica LázaroCárdenas. Las Truchas,Lázaro Cárdenas,Michoacán
Incineration of solvent-, oil- and grease-soaked gloves and rags.
22
Laboratorios Julián deMéxico, Jiutepec, Morelos
Incineration of hazardous wastegenerated by its facilities.
20,000

NOTE: The data and quantities presented in this draft have been obtained from official and unofficial sources, bothnational and international. This data is under review to determine whether more accurate data is required.
Draft: Do not cite or reference June 2000 Status of Mercury in Mexico -23
Sintex, Jiutepec, Morelos Expired and substandard pharmaceuticalproducts.
840
Hylsa, San Nicolás de LosGarza, Nuevo León.
Waste oil incineration. 246
Síntesis Orgánica, Xalostoc,Tlaxcala
Incineration of solid blocks of tar fromphthalic anhydride distillation.
2,160
Pemex-Petroquímica,Coatzacoalcos, Veracruz
Operation of incinerator (PajaritosComplex) for thermal treatment ofeffluents with heavy chlorinatedhydrocarbons.
30,000
Total capacity ofcompanies (2)
65,391
Total capacity of cementproducers (1)
1,227,414
Total installed capacity 1,292,805Estimated 10% of installedcapacity used 129,281
Source: (1) Web pages of Cementos Apasco; Cemex; Cementos Cruz Azul, 1999.(2) INE, DGMRAR, 2000
The INE has also authorized the incineration of hazardous waste for the majority of thecement plants operating in the country. The installed incineration capacity (1,227,414ton) is greater than the hazardous waste actually incinerated, which amounts to 10% ofthis capacity; 90% of the energy consumed is generated by heavy fuel oil.
Emissions calculation.
In 1998–1999, 10% of total installed capacity for hazardous waste incineration wasused.Waste incinerated by companies = 6,539.1Waste used as alternate fuel by cement plants = 122,741.4Total incinerated = 129,280.5Emission factor (Parcom-Atmos, 1992) = 3.0 g/tonTotal mercury emissions = 0.388 ton (Appendix 2).
1.3.3.13. Cremation
In the Federal District there are nine crematoria, with a total of 18 furnaces crematingbetween four and seven cadavers per day. A mid-sized crematorium cremates fivecadavers daily, and it is reported that for the year to date, the number of cadaverscremated has been about 1,600. Cremation services are growing at an estimated 30%annually.
Assuming an average of five cremations per day for each of the eight crematoria inoperation yields a total of 14,600 cremations per year in the Federal District. Applying

NOTE: The data and quantities presented in this draft have been obtained from official and unofficial sources, bothnational and international. This data is under review to determine whether more accurate data is required.
Draft: Do not cite or reference June 2000 Status of Mercury in Mexico -24
the emission factor to this figure yields a result of 21.9 kg of emissions per year for thisitem.
Emissions calculation:
Estimated annual cremations = 14,600.Emission factor = 1.5 x 10⁻³ kg/cremation (EPA, 1997).Emissions = 21.9 kg (Appendix 2).
NOTE: The data and quantities presented in this draft have been obtained from official and unofficial sources, bothnational and international. This data is under review to determine whether more accurate data is required.
Draft: Do not cite or reference June 2000 Status of Mercury in Mexico -25
2 Regulatory Framework for Risk Management and Pollution Prevention
2.1 Federal Laws, Regulations and Standards
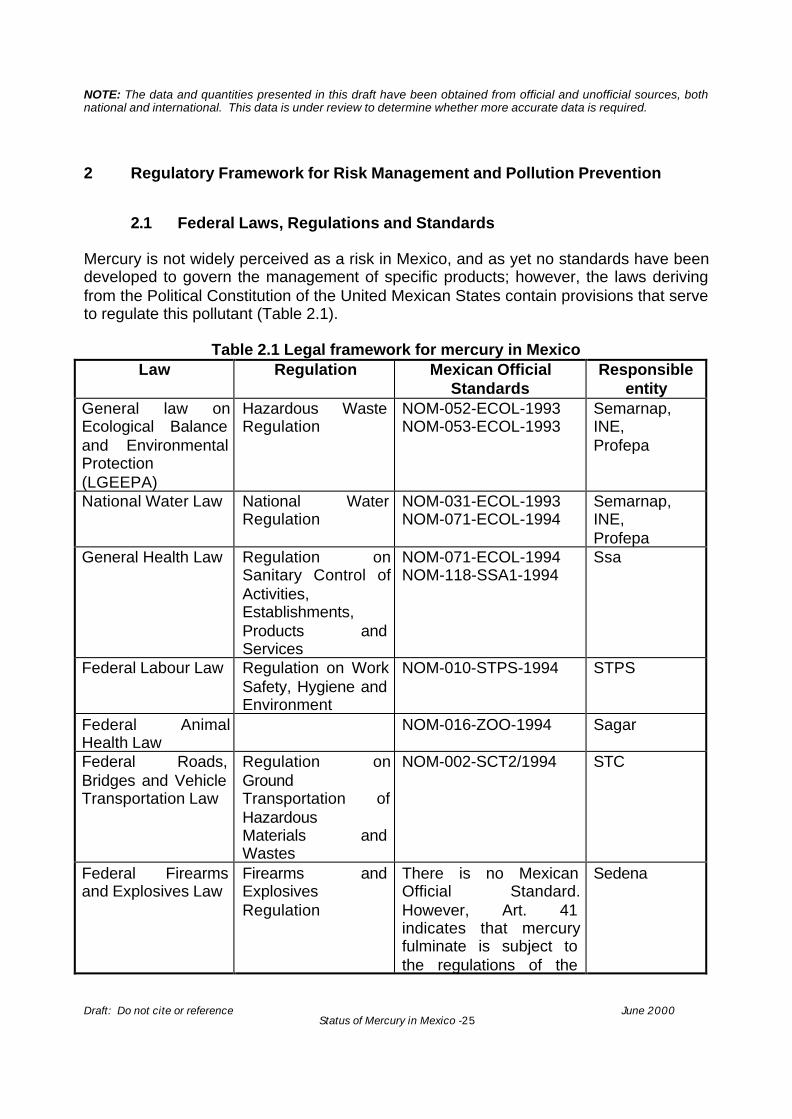
Mercury is not widely perceived as a risk in Mexico, and as yet no standards have beendeveloped to govern the management of specific products; however, the laws derivingfrom the Political Constitution of the United Mexican States contain provisions that serveto regulate this pollutant (Table 2.1).
Table 2.1 Legal framework for mercury in MexicoLaw Regulation Mexican Official
StandardsResponsible
entityGeneral law onEcological Balanceand EnvironmentalProtection(LGEEPA)
Hazardous WasteRegulation
NOM-052-ECOL-1993NOM-053-ECOL-1993
Semarnap,INE,Profepa
National Water Law National WaterRegulation
NOM-031-ECOL-1993NOM-071-ECOL-1994
Semarnap,INE,Profepa
General Health Law Regulation onSanitary Control ofActivities,Establishments,Products andServices
NOM-071-ECOL-1994NOM-118-SSA1-1994
Ssa
Federal Labour Law Regulation on WorkSafety, Hygiene andEnvironment
NOM-010-STPS-1994 STPS
Federal AnimalHealth Law
NOM-016-ZOO-1994 Sagar
Federal Roads,Bridges and VehicleTransportation Law
Regulation onGroundTransportation ofHazardousMaterials andWastes
NOM-002-SCT2/1994 STC
Federal Firearmsand Explosives Law
Firearms andExplosivesRegulation
There is no MexicanOfficial Standard.However, Art. 41indicates that mercuryfulminate is subject tothe regulations of the
Sedena

NOTE: The data and quantities presented in this draft have been obtained from official and unofficial sources, bothnational and international. This data is under review to determine whether more accurate data is required.
Draft: Do not cite or reference June 2000 Status of Mercury in Mexico -26
Ministry of NationalDefense.
Mining IndustriesLaw
Regulation onMining Activities
There is no MexicanOfficial Standard.However, Art. 41indicates that mercuryfulminate is subject tothe regulations of theMinistry of NationalDefense.
Secofi
The Mexican Official Standards (NOM) deriving from the laws and regulations arefederally enforced. They were drafted with the participation of various government,academic and industry sectors and submitted for public consultation before finalpublication. Table 2.2 lists the mercury-related standards published to date.
The agency in charge of enforcing compliance with these standards is the Office of theFederal Attorney for Environmental Protection (Profepa); its head offices are in MexicoCity and it has branch offices in every state of the republic.
Table 2.2 Mexican Official Standards governing the use of mercuryStandard Type of regulation
NOM-052-ECOL-93 Establishing the characteristics of hazardous wastes, thelist thereof and the threshold above which a waste isconsidered hazardous due to its toxicity in theenvironment.
NOM-053-ECOL-93 Establishing the testing procedure for determining thecomponents identifying a waste as hazardous due to itstoxicity in the environment.
NOM-001-ECOL-1996 Establishing the maximum allowable limits for pollutants inwastewater discharges into national bodies of water andproperty.
NOM-002-ECOL-1996 Establishing the maximum allowable limits for pollutants inwastewater discharges into urban or municipal sewersystems.
NOM-117-SSA1-1994 Goods and services. Testing method for the determinationof cadmium, arsenic, lead, tin, copper, iron, zinc andmercury in food, potable water and purified water byatomic absorption spectroscopy.
NOM-048-SSA1-1993 Establishing the standard method for assessing risk tohealth as a consequence of environmental agents.
NOM-118-SSA1-1994 Goods and services. Raw materials for food, perfume andbeauty products. Inorganic dyes and pigments. Sanitaryspecifications.

NOTE: The data and quantities presented in this draft have been obtained from official and unofficial sources, bothnational and international. This data is under review to determine whether more accurate data is required.
Draft: Do not cite or reference June 2000 Status of Mercury in Mexico -27
Standard Type of regulation
NOM-016-ZOO-1994 Analysis of mercury in liver, muscle and kidney of bovines,equines, porcines, ovines and birds by atomic absorptionspectroscopy.
NOM-010-STPS-1994 Concerning safety and hygiene conditions in work centresproducing, storing or managing chemicals capable ofcausing pollution in the working environment.
NOM-002-SCT2/1994 List of hazardous substances and materials mostcommonly transported.
Draft standard NOM-098-ECOL/99, in process of approval, governs and establishes therequirements and specifications for the adequate operation of incinerators, and themaximum allowable limits for air emissions, wastewater discharges and solid wastemanagement produced by the incineration of urban solid waste, hazardous waste, non-hazardous industrial waste and biological/infectious waste, so as to reduce their risks toheath and the environment. This standard, which establishes the mercury emission limitat 0.07 mg/m3, also indicates that the sampling time is 1 hour with an average of 3samples in an 8-hour period.
2.1.1 Environmental Policy
The General Law on Ecological Balance and Environmental Protection (Ley General delEquilibrio Ecológico y la Protección al Ambiente—LGEEPA) was amended by theCongress of the Union and its reformed version was published in the Official Gazette ofthe Federation (Diario Oficial de la Federación) on December 13, 1996. Thefundamental purpose of these reforms was to make into law the orientations andprinciples of a new environmental policy founded on the principle of sustainabledevelopment (INE-Semarnap, 1999).
The Semarnap has a wide range of environmental regulatory instruments arising fromthe law and its internal regulation, which establishes the powers of the bodies making upthis ministry. The modernization of the procedures for the licensing of industrialestablishments and for emissions reporting helped to strengthen the application, scopeand effectiveness of the Comprehensive Environmental License (Licencia AmbientalÚnica—LAU) and to promote the use of the Annual Certificate of Operation (Cédula deOperación Anual—COA).
Characteristics of the LAU:
• One per industrial establishment. Comprised of the following elements:• Environmental impact assessment• Risk assessment• Air emissions

NOTE: The data and quantities presented in this draft have been obtained from official and unofficial sources, bothnational and international. This data is under review to determine whether more accurate data is required.
Draft: Do not cite or reference June 2000 Status of Mercury in Mexico -28
• Hazardous wastes• Wastewater discharges
• Applies to new establishments or those that are required to regularize theirsituation
• Also, those establishments so desiring may participate by renewing their license.
Characteristics of the COA:
• Generates annual up-to-date information on pollutant emissions, managementand transfer
• Monitors the operation of the establishment• Supports decision-making on environmental protection matters• Contributes to the formulation of environmental criteria and policies.
The Pollutant Release and Transfer Registry (PRTR) is a component of the SNIA, whichcontains information on air, water and soil pollutant emissions obtained by use of GIStechniques and by methods for estimating air emissions, wastewater discharges andhazardous waste production.
The PRTR makes it possible to ascertain, through information reported by allmunicipalities and states, the emissions and transfers of 105 pollutants, listed byindustry, by means of:
• Annual air, water and soil emissions data, and data on transfers of hazardouswaste for treatment and/or containment, broken down by chemical species and byestablishment type, industry and geographical area.
• Geographical location, general data, operational characteristics and pollutionprevention and control characteristics for the emission sources, as well as dataon non-point sources, such as agricultural or transportation operations.
With this inventory, it is hoped to achieve the following objectives:
• Obtain a reliable, up-to-date database on emissions and transfers of toxicsubstances.
• Simplify and rationalize data collection.• Help companies make environmental decisions.• Monitor and quantify advances in emission and discharge reductions.• Provide information on chemical substances representing a risk to health and the
environment.• Create an emission and transfer information system for the production of reports
containing information available to the general public• Generate an instrument to serve as a basis for Mexico’s fulfilment of its
international environmental information obligations.

NOTE: The data and quantities presented in this draft have been obtained from official and unofficial sources, bothnational and international. This data is under review to determine whether more accurate data is required.
Draft: Do not cite or reference June 2000 Status of Mercury in Mexico -29
The formulation and implementation of a notification procedure for pollutant emissionsand the development of a PRTR in Mexico grow out of the principles contained in the“Environment Program 1995–2000” and the powers invested in the Semarnap by theLGEEPA (INE-Semarnap, 1999).
3 Rehabilitation Activities
3.1 Contaminated Sites
According to data obtained by the Profepa state office in Zacatecas in December 1996,at the Zacatecana Lagoon, covering approximately 120 hectares and located about 10km from the city of Zacatecas, there are 4 plants located downstream from the lagoon(Jales de Zacatecas, S.A. de C.V., Beneficiadora de Jales de Zacatecas, S.A. de C.V.,Jales del Centro, S.A. de C.V. and Mercurio del Bordo, S.A. de C.V.) that are processingtailings by leaching with sodium hyposulfite. The valuable metals (mainly gold and silveras products and mercury as a sub-product) are separated by means of a thermalprocess in which the mercury is condensed. It should be noted that the tailingsprocessed by these plants and the tailings dumped in the lagoon are of the same origin,that is, the District of Zacatecas. The product of the 3 main groups of lodes, VetaGrande, San Bernabé and La Cantera, was processed at 48 processing facilities locatedin the Zacatecas mountains. These facilities, which operated for 300 years until the turnof the century, habitually dumped their waste into the streambeds, whence it was carrieddown into the valleys by the rains, forming very large deposits. In the case of thePedernalillo lagoon, some 5 million tons of mineralized material built up, with an averageof 60 g of silver and 180 g of mercury per ton, for an approximate total of 300 tons ofsilver and 900 tons of mercury.
Bibliography
1. Federal Electricity Commission. No year. Carbón II. Information Bulletin.2. Cinvestav. 1994. Evaluación de los posibles efectos sobre la salud. [Assessment
of Potential Health Effects.] Ministry of Social Development. National Institute ofEcology.
3. Council of Mineral Resources. 1998. Anuario Estadístico de la Minería Mexicana.1999 edition. Bancomext, SNC, 1998.
4. Council of Mineral Resources. 1999. Directorio de la Minería Mexicana.5. Council of Mineral Resources. 1994 Monografía Geológico-Minera del Estado de
Chihuahua [Geology/Mining Monograph for the State of Chihuahua].6. Council of Mineral Resources. 1993 Monografía Geológico-Minera del Estado de
Coahuila.7. Council of Mineral Resources. 1994 Monografía Geológico-Minera del Estado de
Colima.

NOTE: The data and quantities presented in this draft have been obtained from official and unofficial sources, bothnational and international. This data is under review to determine whether more accurate data is required.
Draft: Do not cite or reference June 2000 Status of Mercury in Mexico -30
8. Council of Mineral Resources. 1993 Monografía Geológico-Minera del Estado deDurango.
9. Council of Mineral Resources. 1996 Monografía Geológico-Minera del Estado deMéxico.
10. Council of Mineral Resources. 1992 Monografía Geológico-Minera del Estado deGuanajuato.
11. Council of Mineral Resources. 1999 Monografía Geológico-Minera del Estado deGuerrero.
12. Council of Mineral Resources. 1992 Monografía Geológico-Minera del Estado deHidalgo.
13. Council of Mineral Resources. 1992 Monografía Geológico-Minera del Estado deJalisco.
14. Council of Mineral Resources. 1995 Monografía Geológico-Minera del Estado deMichoacán.
15. Council of Mineral Resources. 1994 Monografía Geológico-Minera del Estado deNayarit.
16. Council of Mineral Resources. 1996 Monografía Geológico-Minera del Estado deOaxaca.
17. Council of Mineral Resources. 1995 Monografía Geológico-Minera del Estado dePuebla.
18. Council of Mineral Resources. 1992 Monografía Geológico-Minera del Estado deQuerétaro.
19. Council of Mineral Resources. 1992 Monografía Geológico-Minera del Estado deSan Luis Potosí.
20. Council of Mineral Resources. 1991 Monografía Geológico-Minera del Estado deSinaloa.
21. Council of Mineral Resources. 1992 Monografía Geológico-Minera del Estado deSonora.
22. Council of Mineral Resources. 1994 Monografía Geológico-Minera del Estado deVeracruz.
23. Council of Mineral Resources. 1991 Monografía Geológico-Minera del Estado deZacatecas.
24. Environmental Protection Agency. 1997. Locating and Estimating Air Emissionsfrom Sources of Mercury and Mercury Compounds.
25. INE_Semarnap. 1996. “Program for the Minimization and Integrated Managementof Hazardous Industrial Waste in Mexico”.
26. INE-Semarnap. 1999. National Report on Pollutant Releases and Transfers1997-1998. Pollutant Release and Transfer Registry.
27. Sociedad Mexicana de Fundidores, A.C. 1999. Directorio Nacional de la Industriade la Fundición. 1999-2000 edition.

NOTE: The data and quantities presented in this draft have been obtained from official and unofficial sources, bothnational and international. This data is under review to determine whether more accurate data is required.
Draft: Do not cite or reference June 2000 Status of Mercury in Mexico -31
Appendix 1. Consumption
Table A1.1. Mercury consumption in Mexico, 1998Product Hg quantity
(ton/year)Chlorine and caustic soda 5.658Thermometers andsphygmomanometers
2.4
Dentistry 1.51Thermostat 0.152Fluorescent light bulbs 1.0Cultural uses 1.0
Total 11.72
Figure A1.1. Mercury consumption in Mexico, 1998
Mercury Consumption 1998
Cultural8.5%
Light bulbs
8.5%Thermostats
1.3%
Dentistry
12.9%Thermometers
20.5%
Chlorine andcaustic soda
48.3%

NOTE: The data and quantities presented in this draft have been obtained from official and unofficial sources, bothnational and international. This data is under review to determine whether more accurate data is required.
Draft: Do not cite or reference June 2000 Status of Mercury in Mexico -32
Appendix 2. Emissions
Table A2.1. Estimated mercury emissions in Mexico (ton/year)Source 1994 1995 1996 1997 1998 1999Coal production 1.557 1.607 1.872 1.731 1.686Coke production 0.054 0.059 0.060 0.058 0.060 0.061Coal-fired power plants 2.625 2.625Smelting (copper, lead andzinc)
7.667 7.501 8.132 7.987 6.834
Cement production 2.61 2.61Hospital waste 7.15 7.15 7.15Hazardous waste 0.390 0.390 0.390Cremation 0.022 0.022 0.022
Total 22.718 22.53
Figure A2.1. Estimated mercury emissions in Mexico, 1998
Mecury Emissions 1998
Hosp. w31.7%
Cement11.6%
Haz. w1.7%
Coal7.5%
Cremation0.1%
Coke0.3% Coal-fired plants
11.7%
Smelting35.5%

NOTE: The data and quantities presented in this draft have been obtained from official and unofficial sources, bothnational and international. This data is under review to determine whether more accurate data is required.
Draft: Do not cite or reference June 2000 Status of Mercury in Mexico -33
Appendix 3. Emission Factors
Table A3.1. Mercury emission factorsProduct Parcom-
Atmos (g/Mg)Emission factor (Hg)
(EPA)Sinter plants 0.02Pelletizing plants Page missingMP in powders for blastfurnaces
0.02
MP in powders for basicconverters
0.003
MP in electric arc furnaces(steel, steel forconstruction and stainlesssteel)
0.15
Coke production 6 x 10⁻⁵ lb/ton2.724 x 10-5 kg/ton
Coke furnaces 0.03 6 x 10⁻⁵ lb/ton (2.724 x 10⁻⁵ kg/ton)Primary copperproduction
0.1 0.1 g/ton
Primary lead production 3.0 3 g/tonPrimary zinc production 20.0 20 g/tonSecondary zincproduction
0.02 0.02
Black coal manufacturing 3 x 10⁻⁴ lb/ton1.362 x 10-4 kg/ton
Coal-fired power plants 0.25, 0.18 0.15 g/Mg (3 x 10⁻⁴ lb/ton, 1.362 x 10⁻⁴
kg/ton)MP from lignitecombustion
0.06
Natural gas 5 µg/m3
Firewood combustion 0-0.2Percentage in dust forwaste incineration
0.6
Hazardous industrialwaste
3.0
Biological/infectiouswaste
0.96
MP from incineration ofsewage sludge
1.0
Chlorine and caustic sodaindustry
3.1 41.2 g/ton (Méx)4.071 g/ton (USA)
Portland cementmanufacturing
1.3 x 10⁻⁴ lb/ton5.902 x 10-5 kg/ton

NOTE: The data and quantities presented in this draft have been obtained from official and unofficial sources, bothnational and international. This data is under review to determine whether more accurate data is required.
Draft: Do not cite or reference June 2000 Status of Mercury in Mexico -34
Cement production 0.275 0.087 g/ton (8.7 x 10⁻⁵ kg/ton)6.5 x 10-5 kg/Mg (1.3 x 10⁻⁴ lb/ton, 5.902
x 10-5 kg/ton)Glass production (NA) 0.05Batteries -----Cremation 1.0 Hg/cadaver
(Switzerland)3.3 x 10⁻³ lb/cremation (1.5 x 10⁻³
kg/cremation)
Dentistry 0.6 g/dentalfilling (United
Kingdom)
40 lb/ton20 kg/ton
Source:Emission Factors Manual Parcom-Atmos Emission factors for air pollutants.Netherlands, 1992.Locating and Estimating Air Emissions from Sources of Mercury and MercuryCompounds. EPA, 1997
Appendix 4. Chlorine and Caustic Soda Industry in North America and WesternEurope
Table A4.1. Chlorine production with mercury cell technology (MT/year)Installed
capacity (IC)(MT Chlorine)
% of IC/TotalCapacity
% of US IC
Mexico 147,000 33 8.2Canada 37,700 2.8 2.1United States 1,800,000 14 ---WesternEurope
6,300,000 70 350
Source: Information provided by ANIQ. 2000.