Embed Size (px)
Citation preview
STATUS OF MINNESOTA BLACK BEARS, 2013, 2012
Final Report to Bear Committee
March 13, 2014
Dave Garshelis & Karen Noyce
All data contained herein are subject to revision, due to updated information, improved analysis
techniques, and/or regrouping of data for analysis.
© 2014 Minnesota Department of Natural Resources
Key points
Table 1 & Fig. 1
Overview: Permits, licenses, harvest, and success rates Permit applications for bear licenses seem to have stabilized at a higher level during 2010-2013 than before that, when permit availability was higher. The reduced permit availability seems to have driven up sales of no-quota licenses, which were the highest on record in 2012 and second highest in 2013.The estimated number of hunters in the field (6,300) was the lowest since 1989, and the total harvest (1,866) was the lowest since 1988. Statewide success rate was the same as last year (30%), but quota area success rate (37%) was the highest since the very poor food year of 1995. High success rate in the quota zone is related in part to reduced numbers of hunters (i.e., competition).
Tables 2,3 & Fig. 2
Quota zone permits and licenses The number of available quota zone permits was reduced 38% from 2012 to 2013; this reduction was distributed fairly uniformly across Bear Management Units (BMUs). This followed a reduction of 15% from 2011 to 2012. These reductions were aimed at increasing the bear population in the quota zone. This was the third year of a system whereby all available licenses for the quota zone were sold (those not purchased by permittees selected in the lottery were purchased later as surplus).
Table 4
Quota zone lottery As permit allocations have been reduced, the percentage of 1st-year applicants drawn in the lottery diminished. In 2009, some 1st-year applicants (preference level 1) were drawn in all BMUs. In 2013, 1st-year applicants were drawn only in BMU 22 (BWCAW). Less than 50% of 2nd-year applicants were drawn in all but 2 BMUs, and no 2nd-year applicants were drawn in 2 BMUs (44 and 45).
Table 5 & Fig. 3
Harvest by BMU The statewide harvest and harvest for the quota zone were the lowest since 1988. Three BMUs (12, 24, 26) had record low harvests. BMU 11 had the lowest harvest since 2006, but the no-quota zone as a whole had a fairly normal harvest. The percent of the total statewide harvest contained within the no-quota zone has sharply increased with reduction of quota zone permits, reaching a record this year (26%).
Table 6
Hunting success by BMU Hunting success was the highest since the early-mid 1990s in the quota zone as a whole, and in 4 quota zone BMUs; one additional BMU (51) had the highest success since it was established by splitting the quota and no-quota zones in 1987. These high success rates are likely a reflection of low hunter density (and possibly more hunter effort, given the decreased opportunity to be drawn for a permit). For the first time hunter numbers could be estimated for the individual BMUs in the no-quota zone, based on where hunters indicated they planned to hunt when they purchased their license. This enabled a derivation of hunting success for BMUs 10, 11, and 52. This system, though, needs improvement as many no-quota hunters selected portions of the quota zone.
Table 7
Harvest by date During years of normal fall food abundance, about 70% of the harvest occurs during the 1st week of the bear season, and ~83% occurs by the end of the 2nd week. This year (2013), harvesting was delayed: only 61% in the first week and 76% after the 2nd week.
Tables 8–9 & Fig. 4
Nuisance complaints and kills The number of wildlife and enforcement personnel submitting bear nuisance tally forms each month was higher than normal, but the total number of registered complaints (623) was about average (mean = 586) since the institution of the nuisance bear policy took effect in 2000. Also, as typical, only 25 bears were known killed as nuisances, 3 were translocated, and 32 killed in vehicle collisions.
Tables 10-12 & Fig. 5
Food abundance The abundance of wild bear foods in 2013 was the highest in 15 years (since the summer of 1998). This was in sharp contrast to 2012, when bear foods were the scarcest they had been since the catastrophic food failure of 1995. Statewide food survey results show that it is typical for fruiting to be better than average the year after food failures, as witnessed in 1985/1986, 1990/1991, 1995/1996, and now 2012/2013. High bear food indices this year were primarily due to abundant summer berries particularly across the northern tier of survey areas. In contrast to summer foods, productivity of key fall foods (hazel, oak, and dogwood ― those that affect hunting success) were average or a bit above average across most of the bear range in 2013.
Fig. 6
Predictions of harvest from food abundance A combination of fall food abundance and number of hunters accounts for 84% of the yearly variation in the bear harvest since 1984. Predictions of the number of bears killed by hunters, based solely on these 2 factors, have been more accurate since 2000 (R2 = 0.95). Since then, actual bear harvest has only once differed from predicted harvest by >10%.
Fig. 7
Yearly variability in food abundance Following a 15-year period of relative abundance and stability, bear food production exhibited a wider swing in 2012 and 2013 than observed since 1996. Back-to-back years of poor foods followed by abundant foods often result in a partial synchronization of reproduction among female bears, resulting in alternating years of small and large cohorts being born for the next several years: 2014 reproduction is likely to reflect the excellent 2013 summer food crop.
Fig. 8
Harvest sex ratios Sex ratios of harvested bears reflect both the sex ratio of the living population (which varies with harvest pressure) as well as the relative vulnerability of the sexes to hunters (which varies with natural food conditions and hunter density). In 2013, 3 BMUs had record high (or tied with record high) sex ratios (%M)(BMUs 13, 25, 26), as did the state as a whole (62%). However, no BMU showed a consistent trend in sex ratios (BMU 26 shows a generally increasing trend from 2007 to 2013, but not so going back before that).
Fig. 9–11
Harvest ages Statewide, ages of harvested females declined dramatically during the past 3 decades, as evidenced by a declining median age and increasing proportion of the harvest composed of 1–2 year-olds. Median age of harvested females was 2.8 years old in 2013, with signs that this downward trend is leveling off. Median ages of harvested males has remained at about 2 years old for the past 20 years. Variation in female median ages within individual BMUs is too great to discern short-term trends. The low, male-skewed harvest this year resulted in smaller sample sizes of female ages per BMU, and hence more erratic median ages. Notably, though, BMU 11 (no quota) has less erratic female median ages through time than adjacent BMU 12, and BMU 52 (no quota) has similar female median ages as adjacent BMU 51.
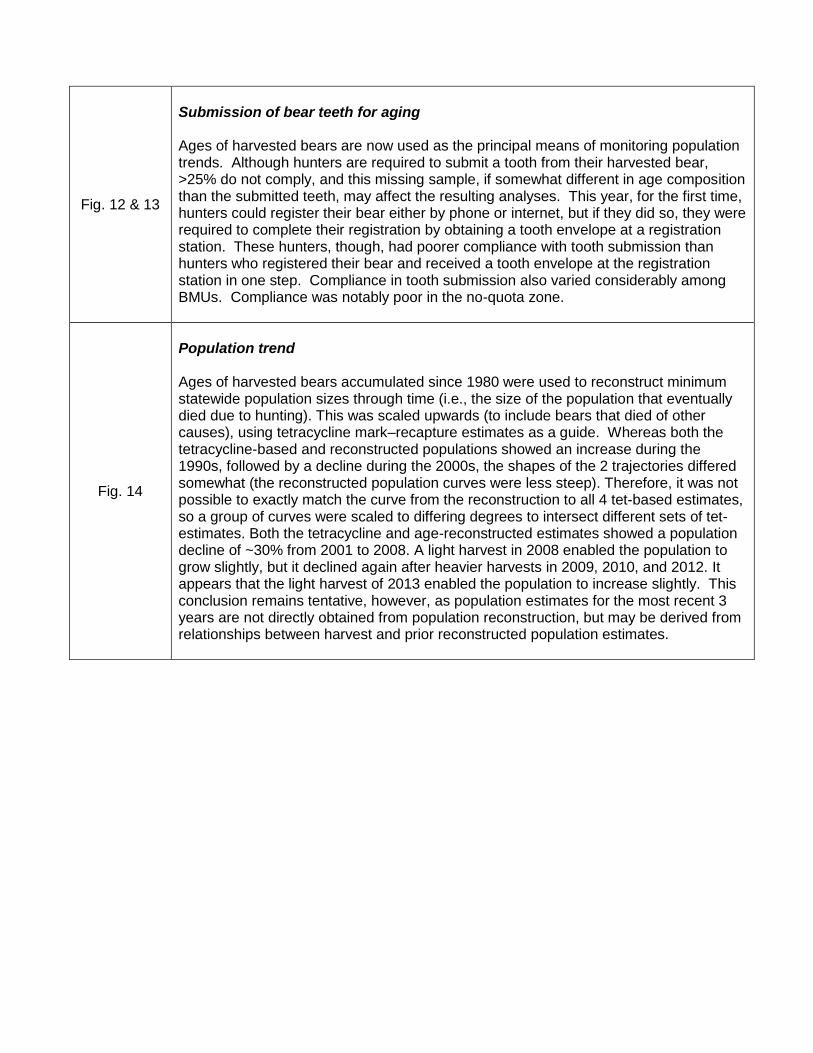
Fig. 12 & 13
Submission of bear teeth for aging Ages of harvested bears are now used as the principal means of monitoring population trends. Although hunters are required to submit a tooth from their harvested bear, >25% do not comply, and this missing sample, if somewhat different in age composition than the submitted teeth, may affect the resulting analyses. This year, for the first time, hunters could register their bear either by phone or internet, but if they did so, they were required to complete their registration by obtaining a tooth envelope at a registration station. These hunters, though, had poorer compliance with tooth submission than hunters who registered their bear and received a tooth envelope at the registration station in one step. Compliance in tooth submission also varied considerably among BMUs. Compliance was notably poor in the no-quota zone.
Fig. 14
Population trend Ages of harvested bears accumulated since 1980 were used to reconstruct minimum statewide population sizes through time (i.e., the size of the population that eventually died due to hunting). This was scaled upwards (to include bears that died of other causes), using tetracycline mark–recapture estimates as a guide. Whereas both the tetracycline-based and reconstructed populations showed an increase during the 1990s, followed by a decline during the 2000s, the shapes of the 2 trajectories differed somewhat (the reconstructed population curves were less steep). Therefore, it was not possible to exactly match the curve from the reconstruction to all 4 tet-based estimates, so a group of curves were scaled to differing degrees to intersect different sets of tet-estimates. Both the tetracycline and age-reconstructed estimates showed a population decline of ~30% from 2001 to 2008. A light harvest in 2008 enabled the population to grow slightly, but it declined again after heavier harvests in 2009, 2010, and 2012. It appears that the light harvest of 2013 enabled the population to increase slightly. This conclusion remains tentative, however, as population estimates for the most recent 3 years are not directly obtained from population reconstruction, but may be derived from relationships between harvest and prior reconstructed population estimates.
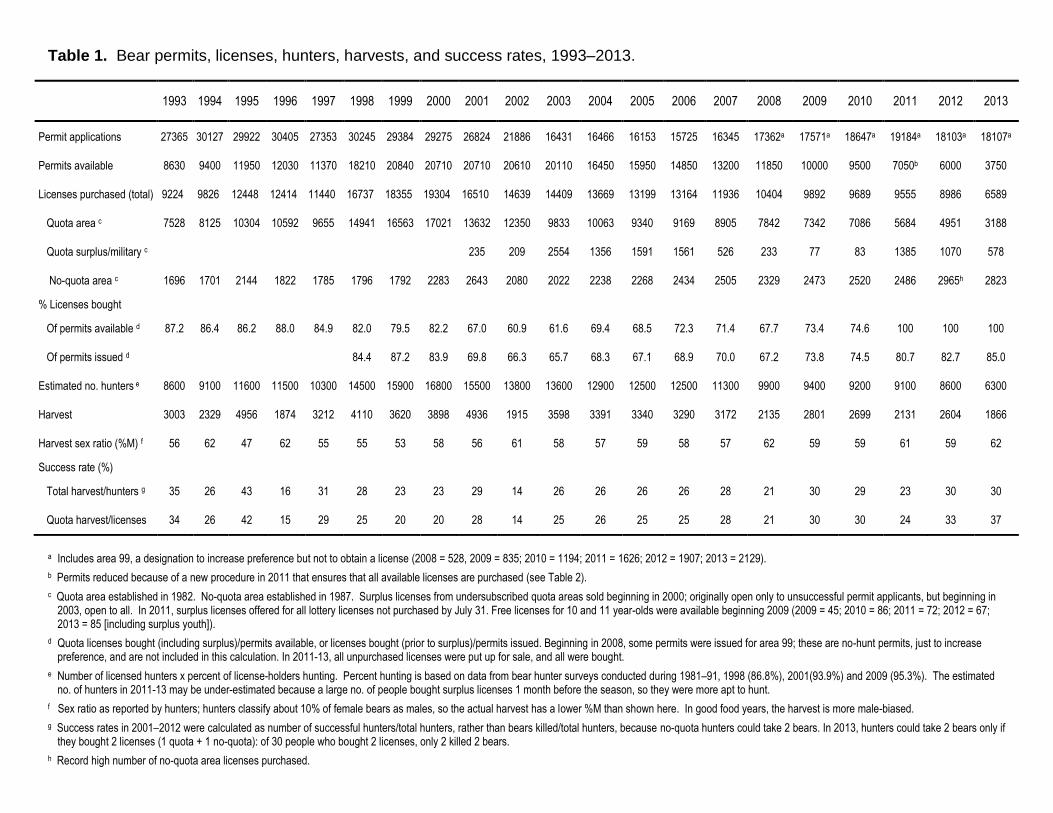
Table 1. Bear permits, licenses, hunters, harvests, and success rates, 1993–2013.
1993 1994 1995 1996 1997 1998 1999 2000 2001 2002 2003 2004 2005 2006 2007 2008 2009 2010 2011 2012 2013
Permit applications 27365 30127 29922 30405 27353 30245 29384 29275 26824 21886 16431 16466 16153 15725 16345 17362a 17571a 18647a 19184a 18103a 18107a
Permits available 8630 9400 11950 12030 11370 18210 20840 20710 20710 20610 20110 16450 15950 14850 13200 11850 10000 9500 7050b 6000 3750
Licenses purchased (total) 9224 9826 12448 12414 11440 16737 18355 19304 16510 14639 14409 13669 13199 13164 11936 10404 9892 9689 9555 8986 6589
Quota area c 7528 8125 10304 10592 9655 14941 16563 17021 13632 12350 9833 10063 9340 9169 8905 7842 7342 7086 5684 4951 3188
Quota surplus/military c 235 209 2554 1356 1591 1561 526 233 77 83 1385 1070 578
No-quota area c 1696 1701 2144 1822 1785 1796 1792 2283 2643 2080 2022 2238 2268 2434 2505 2329 2473 2520 2486 2965h 2823
% Licenses bought
Of permits available d 87.2 86.4 86.2 88.0 84.9 82.0 79.5 82.2 67.0 60.9 61.6 69.4 68.5 72.3 71.4 67.7 73.4 74.6 100 100 100
Of permits issued d 84.4 87.2 83.9 69.8 66.3 65.7 68.3 67.1 68.9 70.0 67.2 73.8 74.5 80.7 82.7 85.0
Estimated no. hunters e 8600 9100 11600 11500 10300 14500 15900 16800 15500 13800 13600 12900 12500 12500 11300 9900 9400 9200 9100 8600 6300
Harvest 3003 2329 4956 1874 3212 4110 3620 3898 4936 1915 3598 3391 3340 3290 3172 2135 2801 2699 2131 2604 1866
Harvest sex ratio (%M) f 56 62 47 62 55 55 53 58 56 61 58 57 59 58 57 62 59 59 61 59 62
Success rate (%)
Total harvest/hunters g 35 26 43 16 31 28 23 23 29 14 26 26 26 26 28 21 30 29 23 30 30
Quota harvest/licenses 34 26 42 15 29 25 20 20 28 14 25 26 25 25 28 21 30 30 24 33 37
a Includes area 99, a designation to increase preference but not to obtain a license (2008 = 528, 2009 = 835; 2010 = 1194; 2011 = 1626; 2012 = 1907; 2013 = 2129).
b Permits reduced because of a new procedure in 2011 that ensures that all available licenses are purchased (see Table 2).
c Quota area established in 1982. No-quota area established in 1987. Surplus licenses from undersubscribed quota areas sold beginning in 2000; originally open only to unsuccessful permit applicants, but beginning in 2003, open to all. In 2011, surplus licenses offered for all lottery licenses not purchased by July 31. Free licenses for 10 and 11 year-olds were available beginning 2009 (2009 = 45; 2010 = 86; 2011 = 72; 2012 = 67; 2013 = 85 [including surplus youth]).
d Quota licenses bought (including surplus)/permits available, or licenses bought (prior to surplus)/permits issued. Beginning in 2008, some permits were issued for area 99; these are no-hunt permits, just to increase preference, and are not included in this calculation. In 2011-13, all unpurchased licenses were put up for sale, and all were bought.
e Number of licensed hunters x percent of license-holders hunting. Percent hunting is based on data from bear hunter surveys conducted during 1981–91, 1998 (86.8%), 2001(93.9%) and 2009 (95.3%). The estimated no. of hunters in 2011-13 may be under-estimated because a large no. of people bought surplus licenses 1 month before the season, so they were more apt to hunt.
f Sex ratio as reported by hunters; hunters classify about 10% of female bears as males, so the actual harvest has a lower %M than shown here. In good food years, the harvest is more male-biased.
g Success rates in 2001–2012 were calculated as number of successful hunters/total hunters, rather than bears killed/total hunters, because no-quota hunters could take 2 bears. In 2013, hunters could take 2 bears only if they bought 2 licenses (1 quota + 1 no-quota): of 30 people who bought 2 licenses, only 2 killed 2 bears.
h Record high number of no-quota area licenses purchased.
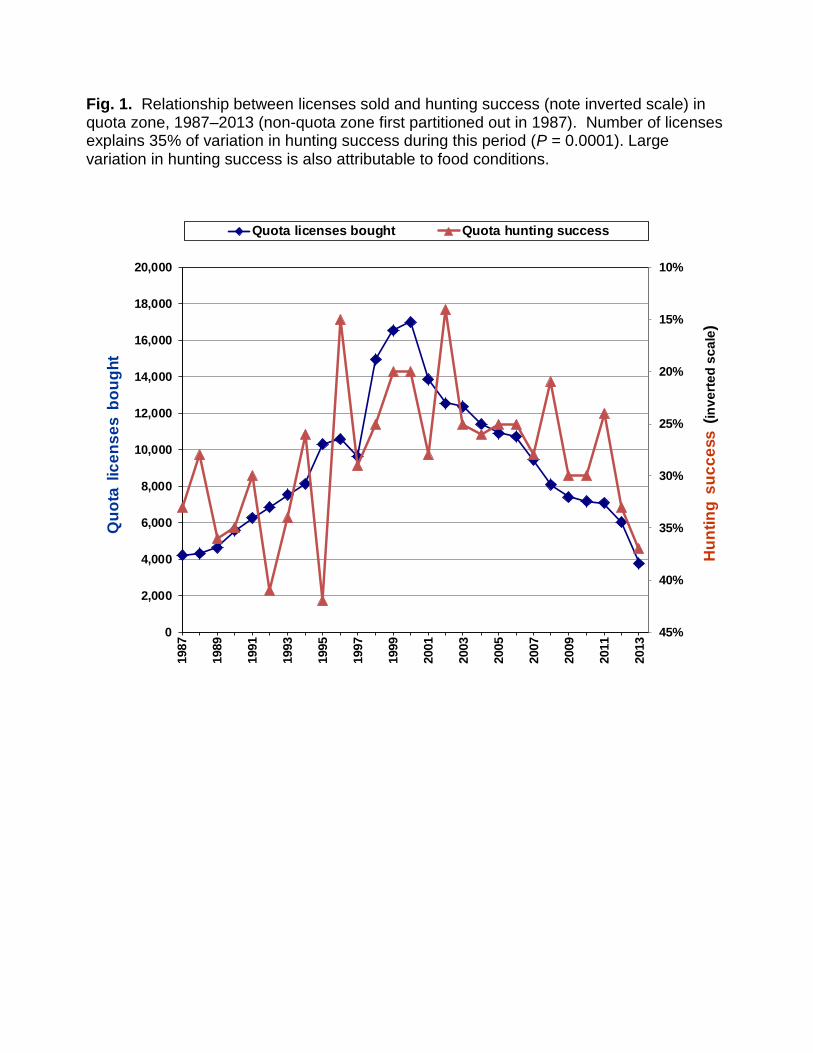
Fig. 1. Relationship between licenses sold and hunting success (note inverted scale) in quota zone, 1987–2013 (non-quota zone first partitioned out in 1987). Number of licenses explains 35% of variation in hunting success during this period (P = 0.0001). Large variation in hunting success is also attributable to food conditions.
10%
15%
20%
25%
30%
35%
40%
45%0
2,000
4,000
6,000
8,000
10,000
12,000
14,000
16,000
18,000
20,000
1987
1989
1991
1993
1995
1997
1999
2001
2003
2005
2007
2009
2011
2013
Hu
nti
ng
su
cc
ess
(in
ve
rte
d s
ca
le)
Qu
ota
lic
en
se
s b
ou
gh
t
Quota licenses bought Quota hunting success
Fig. 2. Bear management units (BMUs) within quota (white) and no-quota (gray) zones. Hunters in the quota zone are restricted to a single BMU, whereas no-quota hunters can hunt anywhere within that zone. BMU 10 is renamed this year (previously grouped with BMU 11, then separated as BMU 11b), in preparation for possibly making BMU 11 a quota area.
11
52
This region was previously tallied as BMU 11, here
separated as
BMU 10
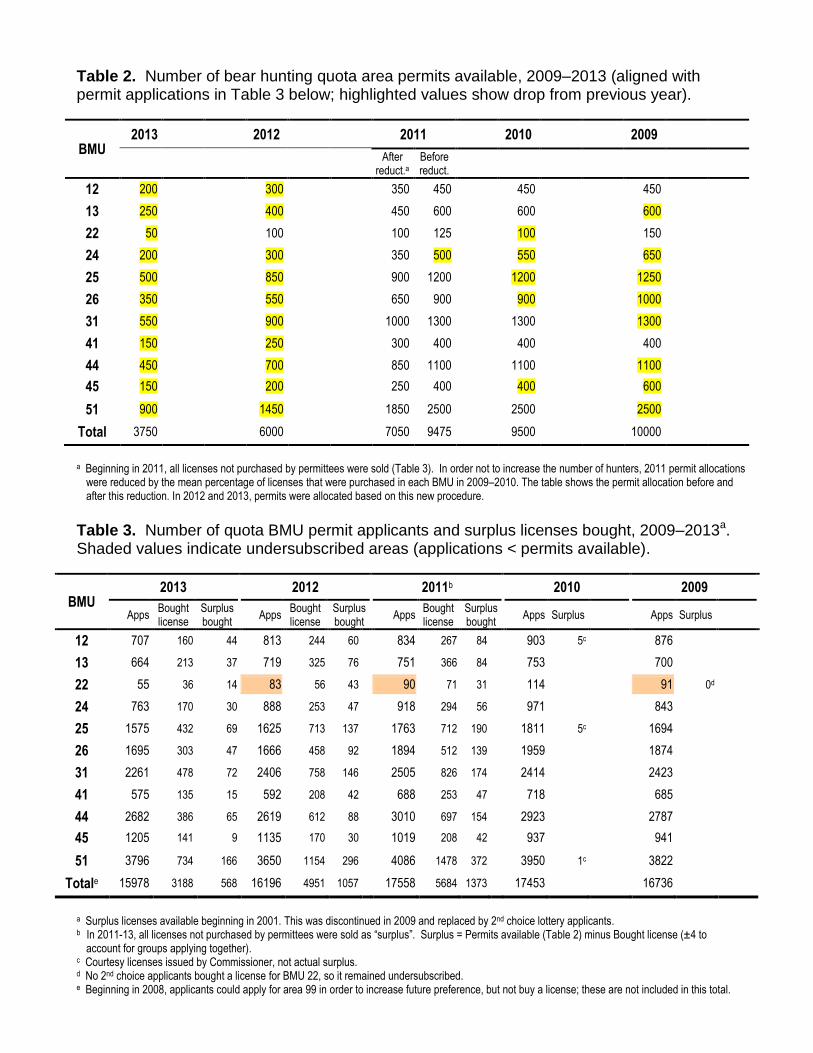
Table 2. Number of bear hunting quota area permits available, 2009–2013 (aligned with permit applications in Table 3 below; highlighted values show drop from previous year).
BMU 2013 2012 2011 2010 2009
After
reduct.a Before reduct.
12 200 300 350 450 450 450
13 250 400 450 600 600 600
22 50 100 100 125 100 150
24 200 300 350 500 550 650
25 500 850 900 1200 1200 1250
26 350 550 650 900 900 1000
31 550 900 1000 1300 1300 1300
41 150 250 300 400 400 400
44 450 700 850 1100 1100 1100
45 150 200 250 400 400 600
51 900 1450 1850 2500 2500 2500
Total 3750 6000 7050 9475 9500 10000
a Beginning in 2011, all licenses not purchased by permittees were sold (Table 3). In order not to increase the number of hunters, 2011 permit allocations
were reduced by the mean percentage of licenses that were purchased in each BMU in 2009–2010. The table shows the permit allocation before and after this reduction. In 2012 and 2013, permits were allocated based on this new procedure.
Table 3. Number of quota BMU permit applicants and surplus licenses bought, 2009–2013a. Shaded values indicate undersubscribed areas (applications < permits available).
BMU 2013 2012 2011b 2010 2009
Apps Bought license
Surplus bought
Apps Bought license
Surplus bought
Apps Bought license
Surplus bought
Apps Surplus Apps Surplus
12 707 160 44 813 244 60 834 267 84 903 5c 876
13 664 213 37 719 325 76 751 366 84 753 700
22 55 36 14 83 56 43 90 71 31 114 91 0d
24 763 170 30 888 253 47 918 294 56 971 843
25 1575 432 69 1625 713 137 1763 712 190 1811 5c 1694
26 1695 303 47 1666 458 92 1894 512 139 1959 1874
31 2261 478 72 2406 758 146 2505 826 174 2414 2423
41 575 135 15 592 208 42 688 253 47 718 685
44 2682 386 65 2619 612 88 3010 697 154 2923 2787
45 1205 141 9 1135 170 30 1019 208 42 937 941
51 3796 734 166 3650 1154 296 4086 1478 372 3950 1c 3822
Totale 15978 3188 568 16196 4951 1057 17558 5684 1373 17453 16736
a Surplus licenses available beginning in 2001. This was discontinued in 2009 and replaced by 2nd choice lottery applicants. b In 2011-13, all licenses not purchased by permittees were sold as “surplus”. Surplus = Permits available (Table 2) minus Bought license (±4 to
account for groups applying together). c Courtesy licenses issued by Commissioner, not actual surplus. d No 2nd choice applicants bought a license for BMU 22, so it remained undersubscribed. e Beginning in 2008, applicants could apply for area 99 in order to increase future preference, but not buy a license; these are not included in this total.
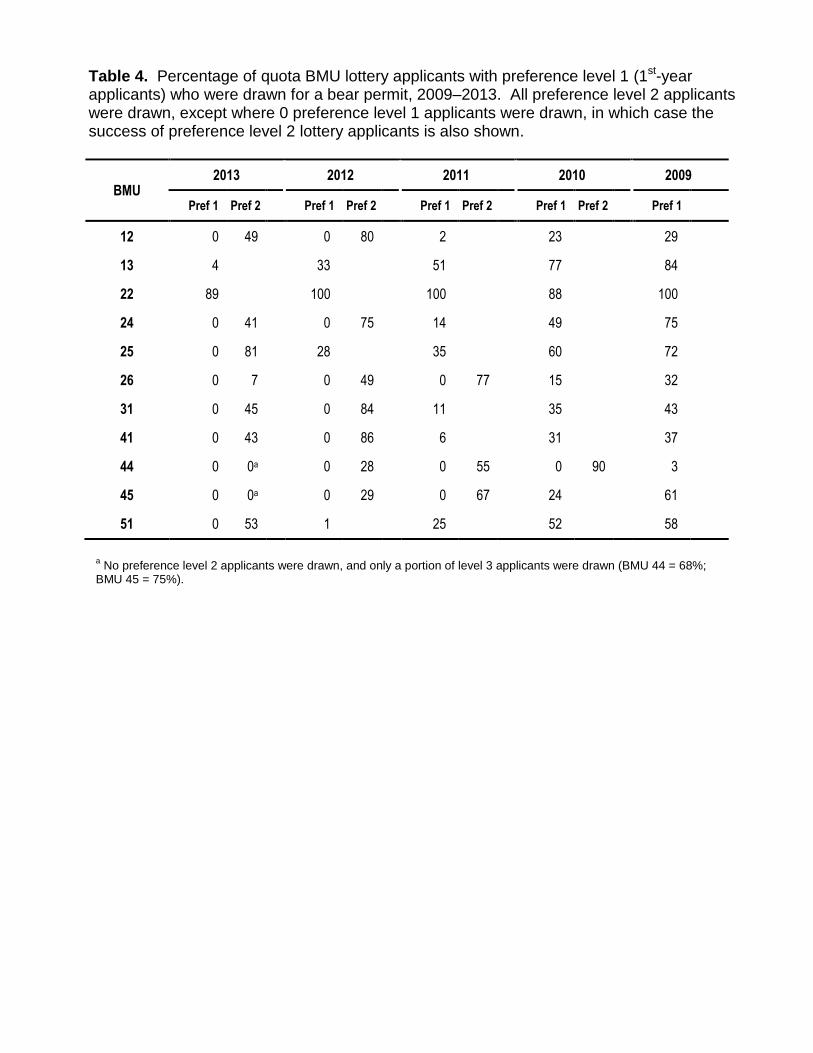
Table 4. Percentage of quota BMU lottery applicants with preference level 1 (1st-year applicants) who were drawn for a bear permit, 2009–2013. All preference level 2 applicants were drawn, except where 0 preference level 1 applicants were drawn, in which case the success of preference level 2 lottery applicants is also shown.
BMU 2013 2012 2011 2010 2009
Pref 1 Pref 2 Pref 1 Pref 2 Pref 1 Pref 2 Pref 1 Pref 2 Pref 1
12 0 49 0 80 2 23 29
13 4 33 51 77 84
22 89 100 100 88 100
24 0 41 0 75 14 49 75
25 0 81 28 35 60 72
26 0 7 0 49 0 77 15 32
31 0 45 0 84 11 35 43
41 0 43 0 86 6 31 37
44 0 0a 0 28 0 55 0 90 3
45 0 0a 0 29 0 67 24 61
51 0 53 1 25 52 58
a No preference level 2 applicants were drawn, and only a portion of level 3 applicants were drawn (BMU 44 = 68%;
BMU 45 = 75%).
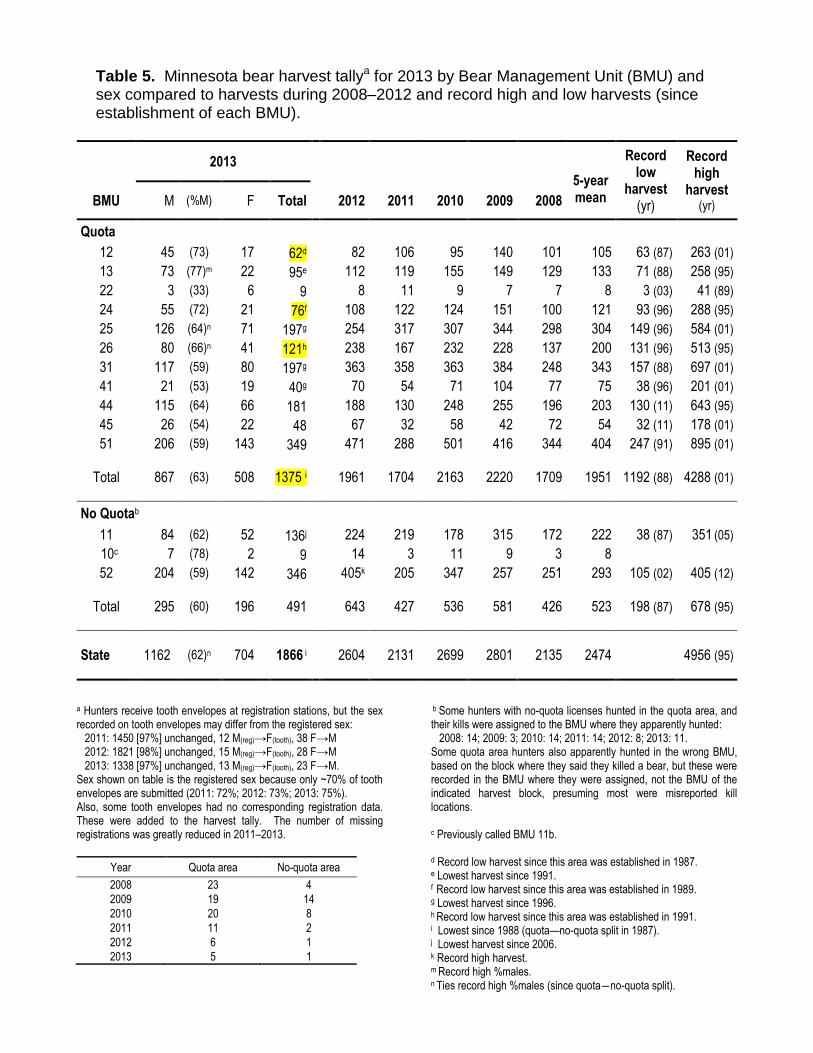
Table 5. Minnesota bear harvest tallya for 2013 by Bear Management Unit (BMU) and sex compared to harvests during 2008–2012 and record high and low harvests (since establishment of each BMU).
2013
5-year mean
Record low
harvest (yr)
Record high
harvest (yr) BMU M (%M) F Total
2012 2011 2010 2009 2008
Quota
12 45 (73) 17 62d 82 106 95 140 101 105 63 (87) 263 (01)
13 73 (77)m 22 95e 112 119 155 149 129 133 71 (88) 258 (95)
22 3 (33) 6 9 8 11 9 7 7 8 3 (03) 41 (89)
24 55 (72) 21 76f 108 122 124 151 100 121 93 (96) 288 (95)
25 126 (64)n 71 197g 254 317 307 344 298 304 149 (96) 584 (01)
26 80 (66)n 41 121h 238 167 232 228 137 200 131 (96) 513 (95)
31 117 (59) 80 197g 363 358 363 384 248 343 157 (88) 697 (01)
41 21 (53) 19 40g 70 54 71 104 77 75 38 (96) 201 (01)
44 115 (64) 66 181 188 130 248 255 196 203 130 (11) 643 (95)
45 26 (54) 22 48 67 32 58 42 72 54 32 (11) 178 (01)
51 206 (59) 143 349 471 288 501 416 344 404 247 (91) 895 (01)
Total 867 (63) 508 1375 i
1961 1704 2163 2220 1709 1951 1192 (88) 4288 (01)
No Quotab
11 84 (62) 52 136j 224 219 178 315 172 222 38 (87) 351 (05)
10c 7 (78) 2 9 14 3 11 9 3 8
52 204 (59) 142 346 405k 205 347 257 251 293 105 (02) 405 (12)
Total 295 (60) 196 491
643 427 536 581 426 523 198 (87) 678 (95)
State 1162 (62)n 704 1866 i
2604 2131 2699 2801 2135 2474 4956 (95)
a Hunters receive tooth envelopes at registration stations, but the sex recorded on tooth envelopes may differ from the registered sex: 2011: 1450 [97%] unchanged, 12 M(reg)→F(tooth), 38 F→M 2012: 1821 [98%] unchanged, 15 M(reg)→F(tooth), 28 F→M 2013: 1338 [97%] unchanged, 13 M(reg)→F(tooth), 23 F→M. Sex shown on table is the registered sex because only ~70% of tooth envelopes are submitted (2011: 72%; 2012: 73%; 2013: 75%). Also, some tooth envelopes had no corresponding registration data. These were added to the harvest tally. The number of missing registrations was greatly reduced in 2011–2013.
Year Quota area No-quota area
2008 23 4
2009 19 14
2010 20 8
2011 11 2
2012 6 1
2013 5 1
b Some hunters with no-quota licenses hunted in the quota area, and their kills were assigned to the BMU where they apparently hunted: 2008: 14; 2009: 3; 2010: 14; 2011: 14; 2012: 8; 2013: 11. Some quota area hunters also apparently hunted in the wrong BMU, based on the block where they said they killed a bear, but these were recorded in the BMU where they were assigned, not the BMU of the indicated harvest block, presuming most were misreported kill locations.
c Previously called BMU 11b. d Record low harvest since this area was established in 1987. e Lowest harvest since 1991. f Record low harvest since this area was established in 1989. g Lowest harvest since 1996. h Record low harvest since this area was established in 1991. i Lowest since 1988 (quota—no-quota split in 1987). j Lowest harvest since 2006. k Record high harvest. m Record high %males. n Ties record high %males (since quota―no-quota split).
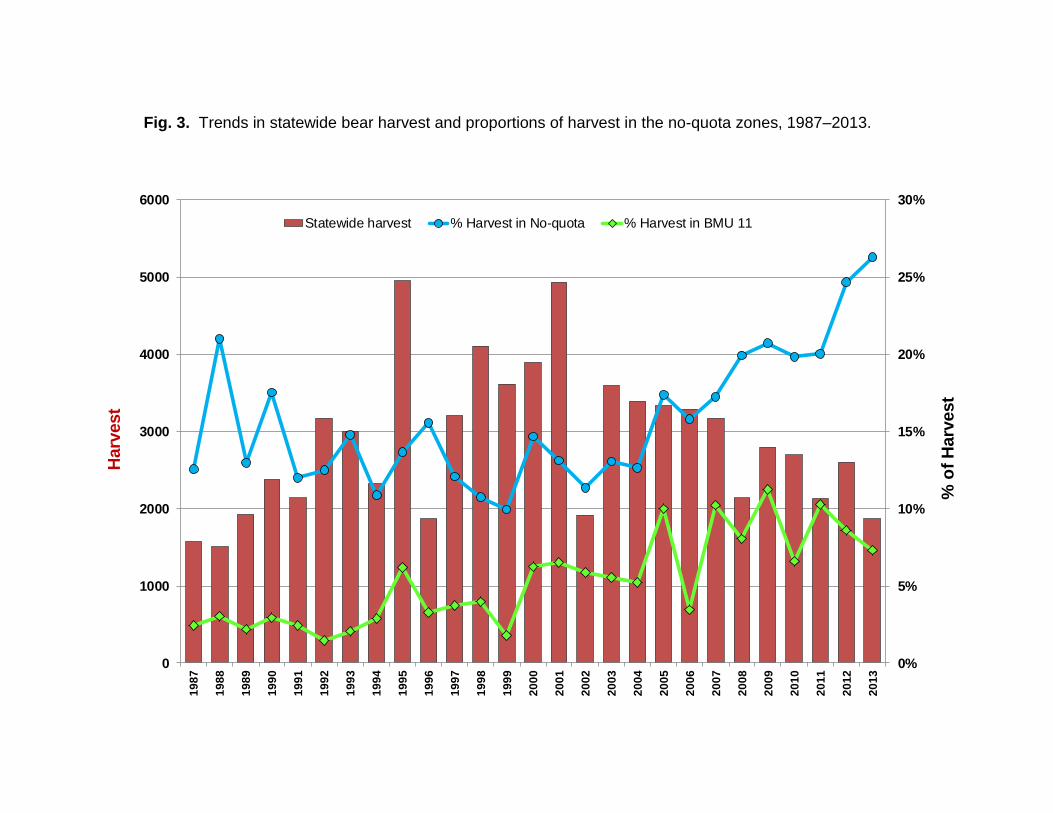
Fig. 3. Trends in statewide bear harvest and proportions of harvest in the no-quota zones, 1987–2013.
0%
5%
10%
15%
20%
25%
30%
0
1000
2000
3000
4000
5000
60001
98
7
19
88
19
89
19
90
19
91
19
92
19
93
19
94
19
95
19
96
19
97
19
98
19
99
20
00
20
01
20
02
20
03
20
04
20
05
20
06
20
07
20
08
20
09
20
10
20
11
20
12
20
13
% o
f H
arv
est
Harv
est
Statewide harvest % Harvest in No-quota % Harvest in BMU 11
Table 6. Bear hunting success (%) by BMU, measured as the registered harvest (excluding second bear) divided by the number of licenses solda, 2008–2013.
BMU Max
success (yr) (excl 2013)
Mean success 2008-2012
2013 2012 2011 2010 2009 2008
12 49 (95) 32 30 27 30 30 39 32
13 59 (95) 30 38d 28 26 34c 32 28
22 21 (92) 11 18e 8 11 14 16c 8
24 45 (92) 30 38e 36e 35e 29 31d 20
25 47 (92) 33 39d 30 35 34 36 28f
26 59 (95) 30 34 43d 26 34 31 17f
31 55 (92) 34 36 40d 36 36 38c 21f
41 50 (95) 27 26 28 18 25 34 27
44 43 (95) 24 40d 27 15f 28 30 21
45 24 (95) 18 32 33b 13 21d 11f 11f
51 37 (95) 23 39g 32d 16f 27 23 19
Quota 42 (95) 28 37d 33d 24 30 30 21
11h 15
10h 12
52h 19
No Quota 32 (95) 19 17 20 15f 20 22 17f
Statewide 40 (95) 25 28 28 22 27 28c 20
a Harvest/licenses instead of harvest/hunters because BMU-year-specific estimates for the proportion of license-holders that hunted are unreliable. No-quota hunters could take 2 bears during 2008-2012, so their success was calculated by whether or not they shot at least 1 bear. No-quota hunters could take only 1 bear in 2013. Statewide estimates of harvest/hunters are presented in Table 1.
b Highest success since establishment of this BMU in 1994 c Highest success since 1997 (until this year). d Highest success since 1995 (until this year). e Highest success since 1992 (until this year) f Lowest success since 2002 (until this year). g Highest success since establishment of this BMU in 1987. h For the first time, in 2013, an attempt was made to differentiate the number of no-quota hunters by BMU. When no-quota hunters bought licenses, they recorded the deer block where they anticipated hunting. Those who selected blocks in or adjacent to BMUs 10 (3%), 11 (30%), or 52 (63%) were categorized as such; those hunters who selected blocks in the quota zone(127= 4%) were distributed in no-quota zones proportional to those who selected blocks in the no-quota zone (note: 5 of them harvested a bear in the no-quota zone, 4 harvested a bear in the quota zone,1 harvested a bear in the quota zone with a quota zone license, and the remainder were unsuccessful); 10 hunters chose blocks in SE Minnesota, 9 of whom lived in the area, but none harvested a bear.
Table 7. Cumulative bear harvest (% of total harvest) by date, 1992–2013.
Year
Day of week for opener
Aug 22/23 – Aug 31
Sep 1 – Sep 7
Sep 1 – Sep 14
Sep 1 – Sep 30
1993 Wed 67 80 94
1994 Thu 67 78 92
1995 Fri 72 87 97
1996 Sun 56a 70 87
1997 Mon 76 88 97
1998 Tue 76 87 96
1999 Wed 69 81 95
2000 Wed 57 72 82 96
2001 Wed 67 82 88 98
2002 Sun 57a 69 90
2003 Mon 72 84 96
2004 Wed 68 82 95
2005 Thu 72 81 94
2006 Fri 69 83 96
2007 Sat 69 82 96
2008 Mon 58a 71 92
2009 Tue 74 86 96
2010 Wed 69 84 96
2011 Thu 65 78 93
2012 Sat 68 83 96
2013 Sun 61 76 94
a The low proportion of total harvest taken during the opening week (<60%) reflects a high abundance of natural foods.
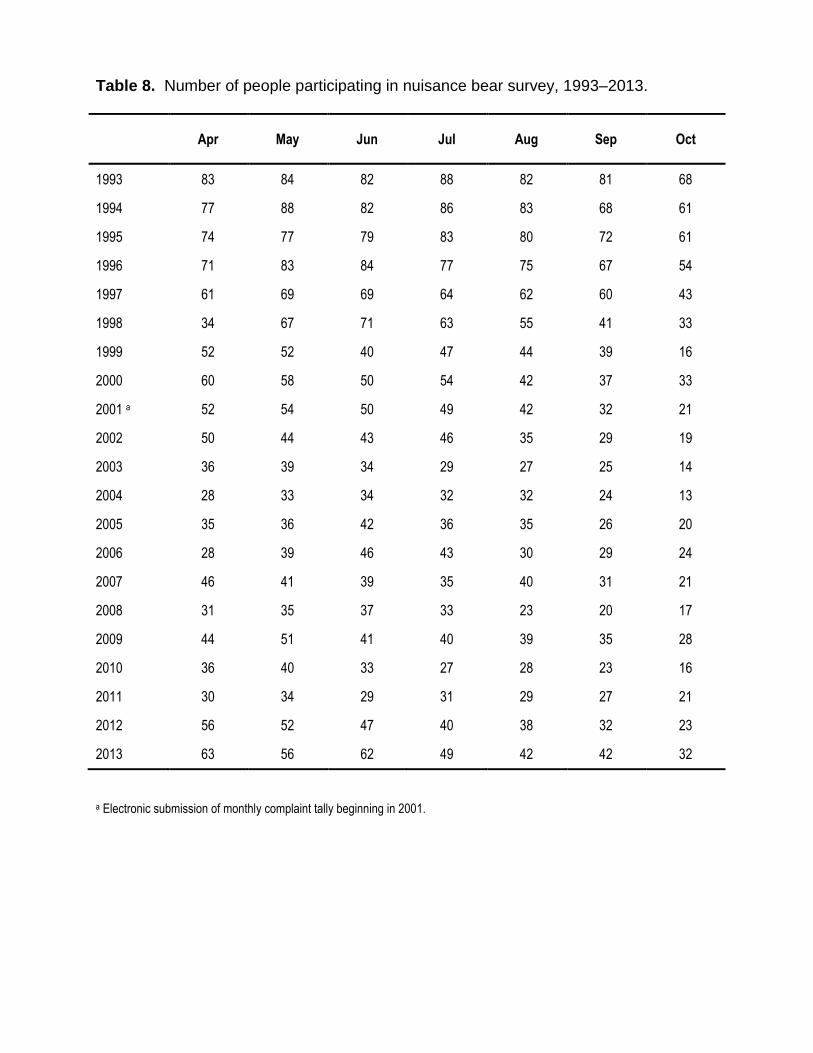
Table 8. Number of people participating in nuisance bear survey, 1993–2013.
Apr May Jun Jul Aug Sep Oct
1993 83 84 82 88 82 81 68
1994 77 88 82 86 83 68 61
1995 74 77 79 83 80 72 61
1996 71 83 84 77 75 67 54
1997 61 69 69 64 62 60 43
1998 34 67 71 63 55 41 33
1999 52 52 40 47 44 39 16
2000 60 58 50 54 42 37 33
2001 a 52 54 50 49 42 32 21
2002 50 44 43 46 35 29 19
2003 36 39 34 29 27 25 14
2004 28 33 34 32 32 24 13
2005 35 36 42 36 35 26 20
2006 28 39 46 43 30 29 24
2007 46 41 39 35 40 31 21
2008 31 35 37 33 23 20 17
2009 44 51 41 40 39 35 28
2010 36 40 33 27 28 23 16
2011 30 34 29 31 29 27 21
2012 56 52 47 40 38 32 23
2013 63 56 62 49 42 42 32
a Electronic submission of monthly complaint tally beginning in 2001.
Table 9. Number of nuisance bear complaints registered by Conservation Officers and Wildlife Managers during 1993–2013, including number of nuisance bears killed and translocated, and bears killed in vehicular collisions.
1993 1994 1995 1996 1997 1998 1999 2000 2001 2002 2003 2004 2005 2006 2007 2008 2009 2010 2011 2012 2013
Number of personnel participating in survey a 88 88 83 84 69 71 52 60 54 50 39 34 42 46 46 37 51 40 34 56 63
Complaints examined on site 1010 696 1568 337 661 226 189 105 122 75 81 75 61 57 63 59 65 70 37 h 113 69
Complaints handled by phone b 959 2196 743 987 618 660 550 424 507 451 426 380 452 535 514 396 h 722 i 623
Total complaints received 1296 2857 969 1176 723 782 625 505 582 512 483 443 511 600 584 433 h 835 692
% Handled by phone 74% 77% 77% 84% 85% 84% 88% 84% 87% 88% 88% 86% 88% 89% 88% 91% 86% 90%
Bears killed by:
Private party or DNR 111 67 232 27 93 31 25 25 22 12 13 25 28 11 21 22 23 22 9 h 16 24
Hunter before season c
– from nuisance survey 21 28 81 6 32 23 5 7 4 0 3 3 6 2 18 3 4 3 3 11 0
– from registration file 30 25 138 18 35 31 24 43 20 11 8 4 13 6 25 5 15 10 5 12 0
Hunter during/after season d 8 3 13 0 4 3 0 1 1 0 0 0 1 0 0 0 0 0 0 0 1
Permittee e 6 3 57 4 7 11 7 2 6 4 6 1 5 4 5 1 3 5 0 0 1 j
Bears translocated 180 171 295 64 115 24 29 1 6 3 1 3 3 3 1 3 2 2 2 0 3
% bears translocated f 18 25 19 19 17 11 15 1 5 4 1 4 5 5 2 5 3 3 5 0 4
Bears killed by cars g 54 40 68 42 52 61 60 39 43 26 25 16 22 18 20 27 18 28 15 h 33 32

Table 9 footnotes:
a Maximum number of people turning in a nuisance bear report each month (from Table 7). Monthly reports were required
beginning in 1984. b Tallies of complaints handled by phone were made only during the indicated years. c The discrepancy between the number recorded on the nuisance survey and the number registered before the opening of the
season indicates incomplete data. Similarity between the two values does not necessarily mean the same bears were reported.
d Data only from nuisance survey because registration data do not indicate whether bear was a nuisance. e A permit for non-landowners to take a nuisance bear before the bear season was officially implemented in 1992, but some
COs individually implemented this program in 1991. Data are based on records from the nuisance survey, not directly from permit receipts.
f Percent of on-site investigations resulting in a bear being captured and translocated. g Car kill data were reported on the monthly nuisance form for the first time in 2005. In all previous years, car kill data were from
confiscation records. Values shown for 2005-2013 are either from the forms or from the confiscation records, whichever was greater (they differed very little)(2013: 32 confiscations, 28 reported in nuisance survey).
h Lowest since record-keeping began (1981 for on-site complaints, nuisance bears killed and car-kills). However, participation in
this survey may have affected the results. In 2011, 2 known nuisance kills of radio-collared bears, which were handled by COs, were not tallied here because these 2 COs did not participate in this survey.
I 120-180 calls in each month, May–Aug. j 4 permits issued, 1 bear killed.
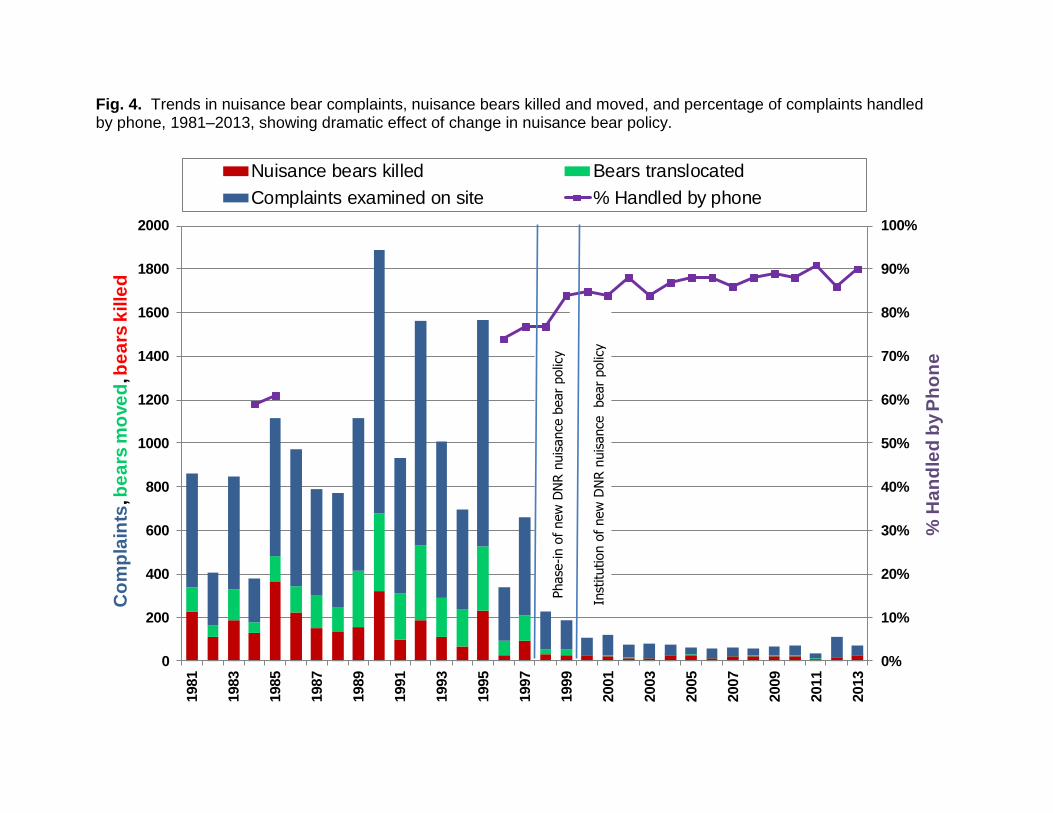
Fig. 4. Trends in nuisance bear complaints, nuisance bears killed and moved, and percentage of complaints handled by phone, 1981–2013, showing dramatic effect of change in nuisance bear policy.
0%
10%
20%
30%
40%
50%
60%
70%
80%
90%
100%
0
200
400
600
800
1000
1200
1400
1600
1800
2000
1981
1983
1985
1987
1989
1991
1993
1995
1997
1999
2001
2003
2005
2007
2009
2011
2013
% H
an
dle
d b
y P
ho
ne
Co
mp
lain
ts, b
ea
rs m
ove
d, b
ea
rs k
ille
d
Nuisance bears killed Bears translocated
Complaints examined on site % Handled by phone
Inst
itution o
f new
DN
R n
uis
ance
bear
polic
y
Phase
-in o
f new
DN
R n
uis
ance
bear
polic
y
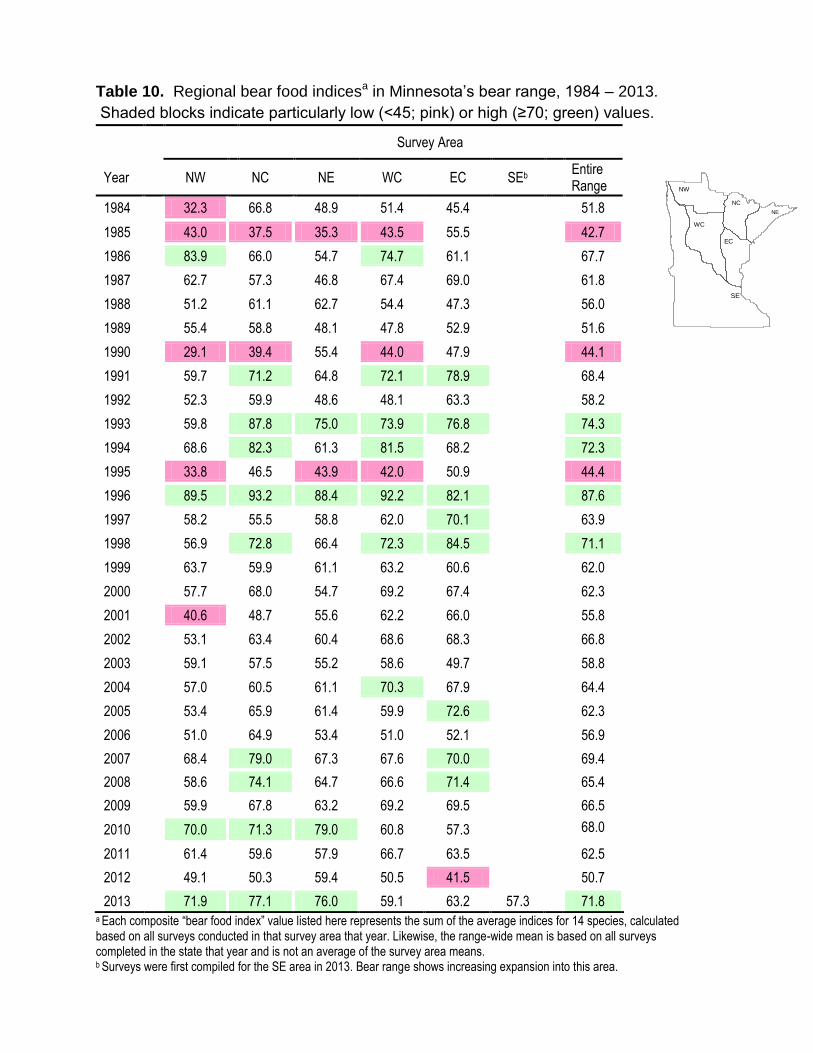
Table 10. Regional bear food indicesa in Minnesota’s bear range, 1984 – 2013.
Shaded blocks indicate particularly low (<45; pink) or high (≥70; green) values.
Survey Area
Year NW NC NE WC EC SEb Entire
Range
1984 32.3 66.8 48.9 51.4 45.4 51.8
1985 43.0 37.5 35.3 43.5 55.5 42.7
1986 83.9 66.0 54.7 74.7 61.1 67.7
1987 62.7 57.3 46.8 67.4 69.0 61.8
1988 51.2 61.1 62.7 54.4 47.3 56.0
1989 55.4 58.8 48.1 47.8 52.9 51.6
1990 29.1 39.4 55.4 44.0 47.9 44.1
1991 59.7 71.2 64.8 72.1 78.9 68.4
1992 52.3 59.9 48.6 48.1 63.3 58.2
1993 59.8 87.8 75.0 73.9 76.8 74.3
1994 68.6 82.3 61.3 81.5 68.2 72.3
1995 33.8 46.5 43.9 42.0 50.9 44.4
1996 89.5 93.2 88.4 92.2 82.1 87.6
1997 58.2 55.5 58.8 62.0 70.1 63.9
1998 56.9 72.8 66.4 72.3 84.5 71.1
1999 63.7 59.9 61.1 63.2 60.6 62.0
2000 57.7 68.0 54.7 69.2 67.4 62.3
2001 40.6 48.7 55.6 62.2 66.0 55.8
2002 53.1 63.4 60.4 68.6 68.3 66.8
2003 59.1 57.5 55.2 58.6 49.7 58.8
2004 57.0 60.5 61.1 70.3 67.9 64.4
2005 53.4 65.9 61.4 59.9 72.6 62.3
2006 51.0 64.9 53.4 51.0 52.1 56.9
2007 68.4 79.0 67.3 67.6 70.0 69.4
2008 58.6 74.1 64.7 66.6 71.4 65.4
2009 59.9 67.8 63.2 69.2 69.5 66.5
2010 70.0 71.3 79.0 60.8 57.3 68.0
2011 61.4 59.6 57.9 66.7 63.5 62.5
2012 49.1 50.3 59.4 50.5 41.5 50.7
2013 71.9 77.1 76.0 59.1 63.2 57.3 71.8 a Each composite “bear food index” value listed here represents the sum of the average indices for 14 species, calculated based on all surveys conducted in that survey area that year. Likewise, the range-wide mean is based on all surveys completed in the state that year and is not an average of the survey area means. b Surveys were first compiled for the SE area in 2013. Bear range shows increasing expansion into this area.
NW
NC
NE
WC
EC
Fig 1. Boundaries of Minnesota's 5 bear food survey areas.
SE
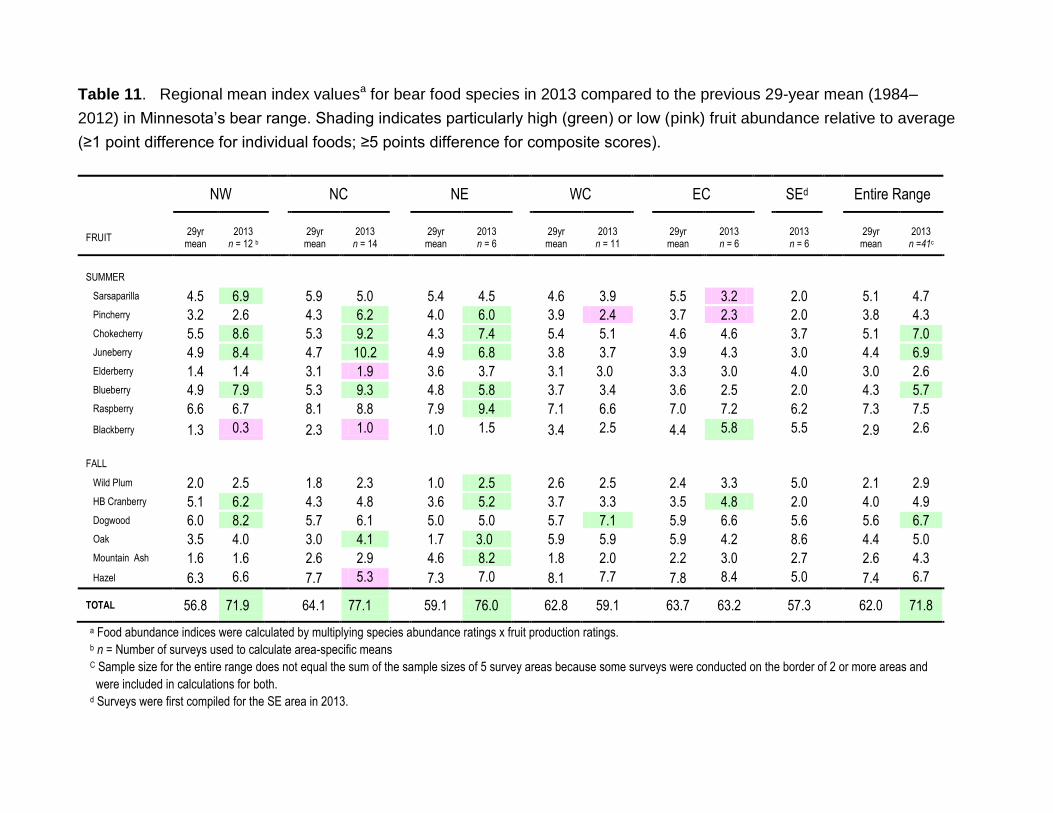
Table 11. Regional mean index valuesa for bear food species in 2013 compared to the previous 29-year mean (1984–
2012) in Minnesota’s bear range. Shading indicates particularly high (green) or low (pink) fruit abundance relative to average
(≥1 point difference for individual foods; ≥5 points difference for composite scores).
NW NC NE WC EC SEd Entire Range
FRUIT
29yr mean
2013
n = 12 b
29yr mean
2013
n = 14
29yr mean
2013 n = 6
29yr mean
2013
n = 11
29yr mean
2013 n = 6
2013 n = 6
29yr mean
2013
n =41c
SUMMER
Sarsaparilla 4.5 6.9 5.9 5.0 5.4 4.5 4.6 3.9 5.5 3.2 2.0 5.1 4.7
Pincherry 3.2 2.6 4.3 6.2 4.0 6.0 3.9 2.4 3.7 2.3 2.0 3.8 4.3
Chokecherry 5.5 8.6 5.3 9.2 4.3 7.4 5.4 5.1 4.6 4.6 3.7 5.1 7.0
Juneberry 4.9 8.4 4.7 10.2 4.9 6.8 3.8 3.7 3.9 4.3 3.0 4.4 6.9
Elderberry 1.4 1.4 3.1 1.9 3.6 3.7 3.1 3.0 3.3 3.0 4.0 3.0 2.6
Blueberry 4.9 7.9 5.3 9.3 4.8 5.8 3.7 3.4 3.6 2.5 2.0 4.3 5.7
Raspberry 6.6 6.7 8.1 8.8 7.9 9.4 7.1 6.6 7.0 7.2 6.2 7.3 7.5
Blackberry 1.3 0.3 2.3 1.0 1.0 1.5 3.4 2.5 4.4 5.8 5.5 2.9 2.6
FALL
Wild Plum 2.0 2.5 1.8 2.3 1.0 2.5 2.6 2.5 2.4 3.3 5.0 2.1 2.9
HB Cranberry 5.1 6.2 4.3 4.8 3.6 5.2 3.7 3.3 3.5 4.8 2.0 4.0 4.9
Dogwood 6.0 8.2 5.7 6.1 5.0 5.0 5.7 7.1 5.9 6.6 5.6 5.6 6.7
Oak 3.5 4.0 3.0 4.1 1.7 3.0 5.9 5.9 5.9 4.2 8.6 4.4 5.0
Mountain Ash 1.6 1.6 2.6 2.9 4.6 8.2 1.8 2.0 2.2 3.0 2.7 2.6 4.3
Hazel 6.3 6.6 7.7 5.3 7.3 7.0 8.1 7.7 7.8 8.4 5.0 7.4 6.7
TOTAL 56.8 71.9 64.1 77.1 59.1 76.0 62.8 59.1 63.7 63.2 57.3
62.0 71.8
a Food abundance indices were calculated by multiplying species abundance ratings x fruit production ratings. b n = Number of surveys used to calculate area-specific means C Sample size for the entire range does not equal the sum of the sample sizes of 5 survey areas because some surveys were conducted on the border of 2 or more areas and
were included in calculations for both. d Surveys were first compiled for the SE area in 2013.
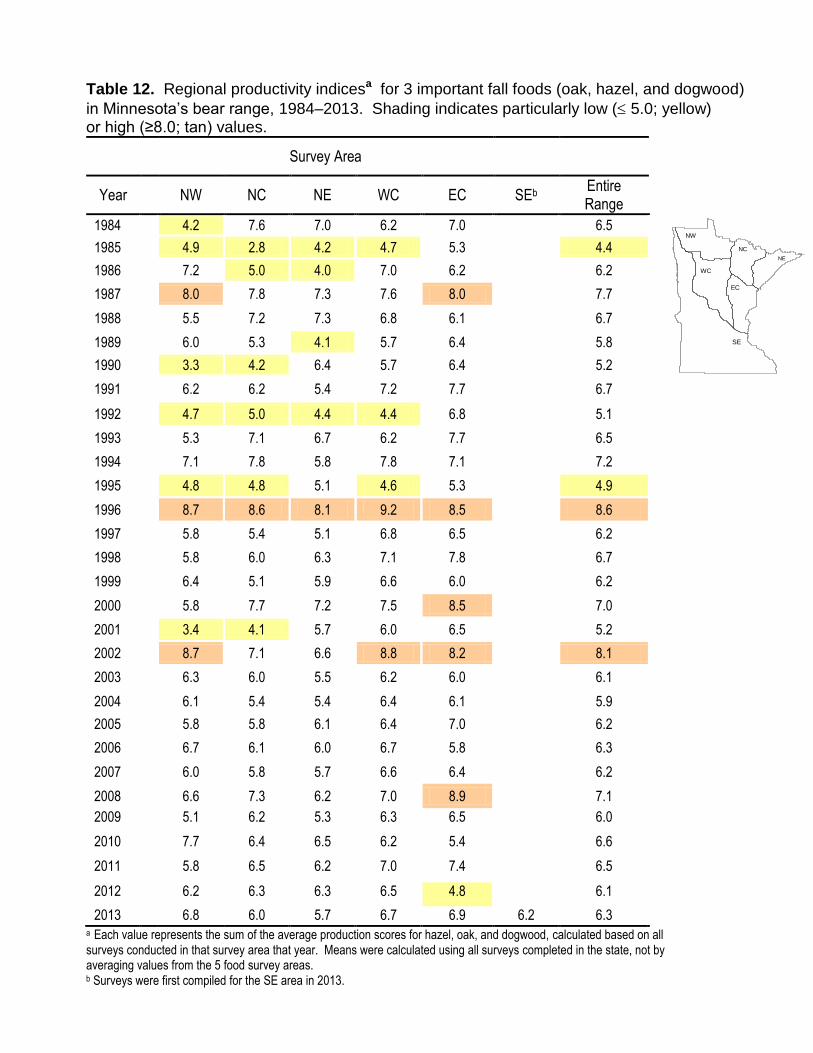
Table 12. Regional productivity indicesa for 3 important fall foods (oak, hazel, and dogwood)
in Minnesota’s bear range, 1984–2013. Shading indicates particularly low ( 5.0; yellow) or high (≥8.0; tan) values.
Survey Area
Year NW NC NE WC EC SEb Entire Range
1984 4.2 7.6 7.0 6.2 7.0 6.5
1985 4.9 2.8 4.2 4.7 5.3 4.4
1986 7.2 5.0 4.0 7.0 6.2 6.2
1987 8.0 7.8 7.3 7.6 8.0 7.7
1988 5.5 7.2 7.3 6.8 6.1 6.7
1989 6.0 5.3 4.1 5.7 6.4 5.8
1990 3.3 4.2 6.4 5.7 6.4 5.2
1991 6.2 6.2 5.4 7.2 7.7 6.7
1992 4.7 5.0 4.4 4.4 6.8 5.1
1993 5.3 7.1 6.7 6.2 7.7 6.5
1994 7.1 7.8 5.8 7.8 7.1 7.2
1995 4.8 4.8 5.1 4.6 5.3 4.9
1996 8.7 8.6 8.1 9.2 8.5 8.6
1997 5.8 5.4 5.1 6.8 6.5 6.2
1998 5.8 6.0 6.3 7.1 7.8 6.7
1999 6.4 5.1 5.9 6.6 6.0 6.2
2000 5.8 7.7 7.2 7.5 8.5 7.0
2001 3.4 4.1 5.7 6.0 6.5 5.2
2002 8.7 7.1 6.6 8.8 8.2 8.1
2003 6.3 6.0 5.5 6.2 6.0 6.1
2004 6.1 5.4 5.4 6.4 6.1 5.9
2005 5.8 5.8 6.1 6.4 7.0 6.2
2006 6.7 6.1 6.0 6.7 5.8 6.3
2007 6.0 5.8 5.7 6.6 6.4 6.2
2008 6.6 7.3 6.2 7.0 8.9 7.1
2009 5.1 6.2 5.3 6.3 6.5 6.0
2010 7.7 6.4 6.5 6.2 5.4 6.6
2011 5.8 6.5 6.2 7.0 7.4 6.5
2012 6.2 6.3 6.3 6.5 4.8 6.1
2013 6.8 6.0 5.7 6.7 6.9 6.2 6.3 a Each value represents the sum of the average production scores for hazel, oak, and dogwood, calculated based on all surveys conducted in that survey area that year. Means were calculated using all surveys completed in the state, not by averaging values from the 5 food survey areas. b Surveys were first compiled for the SE area in 2013.
NW
NC
NE
WC
EC
Fig 1. Boundaries of Minnesota's 5 bear food survey areas.
SE
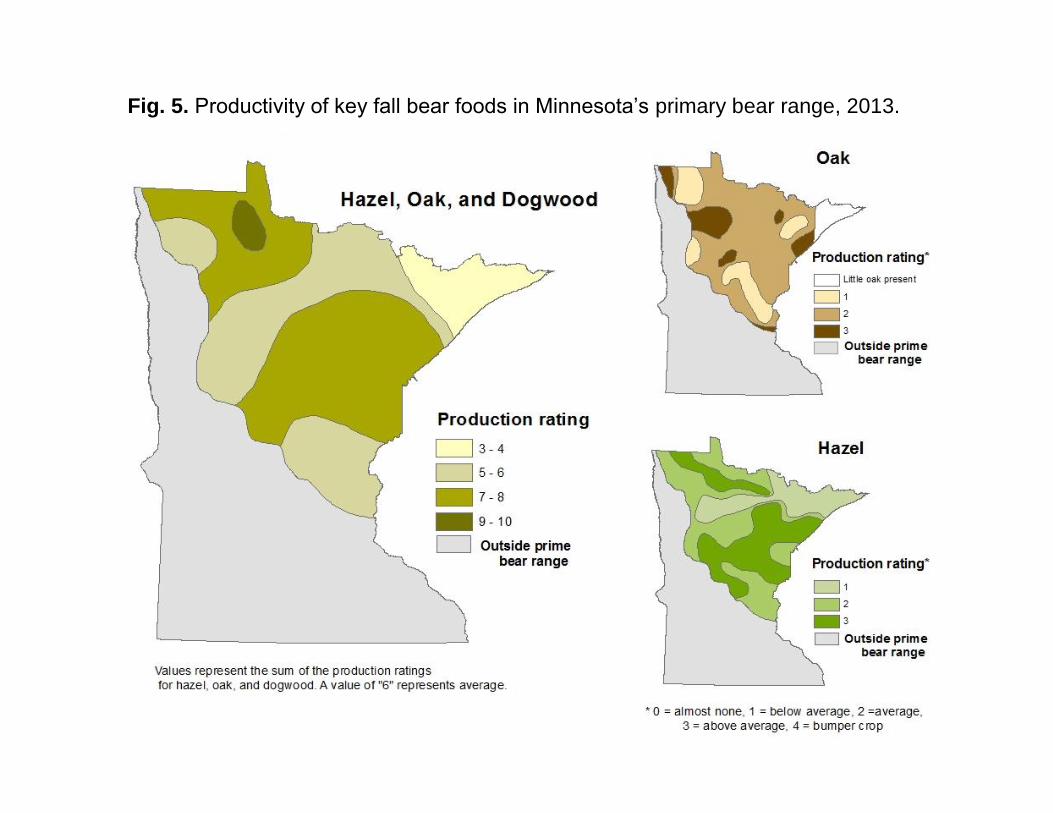
Fig. 5. Productivity of key fall bear foods in Minnesota’s primary bear range, 2013.
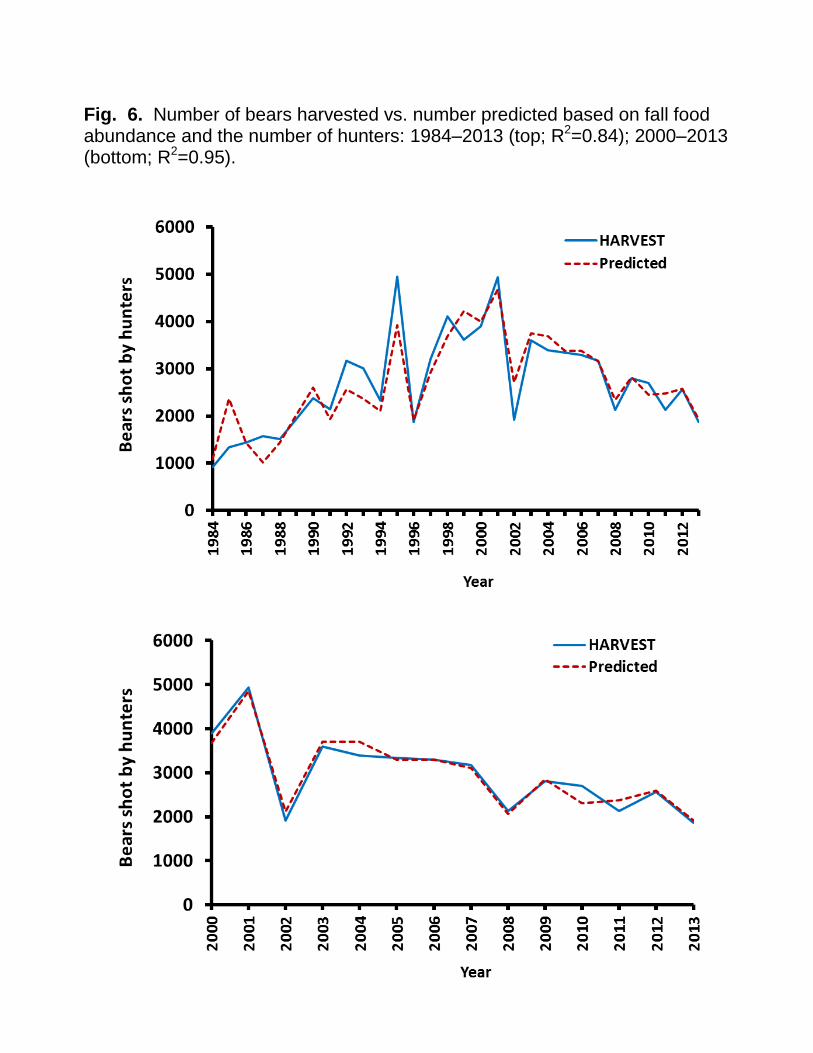
Fig. 6. Number of bears harvested vs. number predicted based on fall food abundance and the number of hunters: 1984–2013 (top; R2=0.84); 2000–2013 (bottom; R2=0.95).
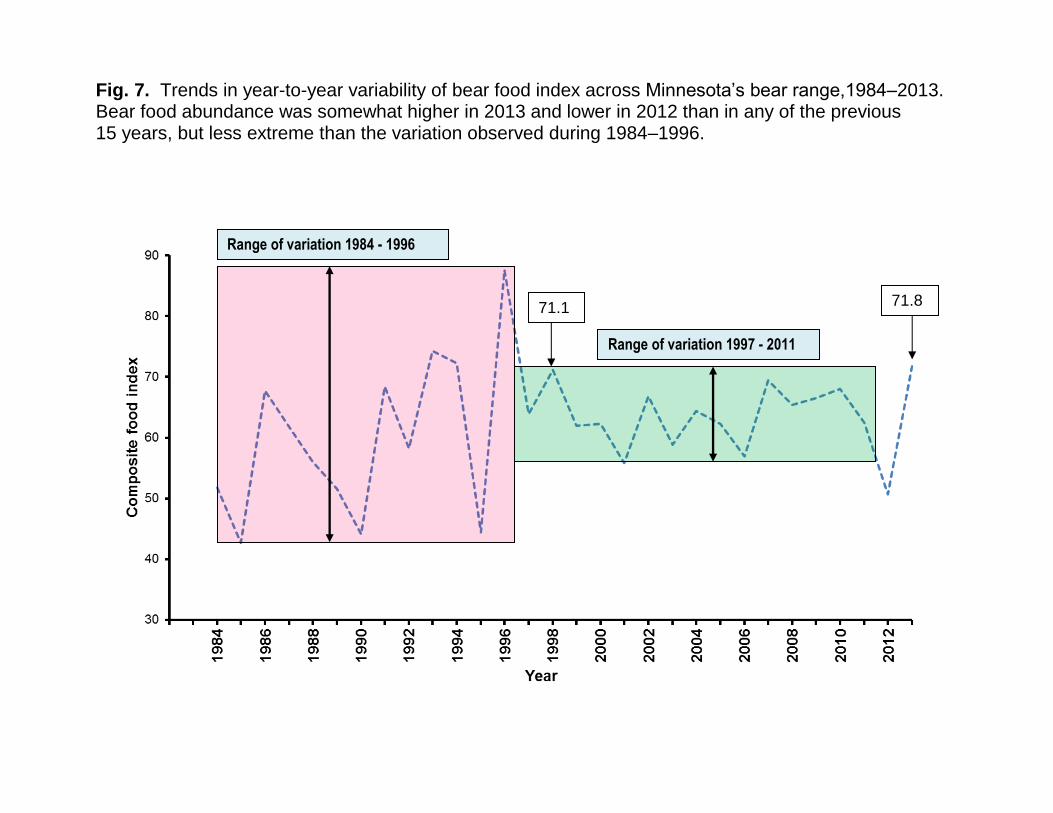
Fig. 7. Trends in year-to-year variability of bear food index across Minnesota’s bear range,1984–2013. Bear food abundance was somewhat higher in 2013 and lower in 2012 than in any of the previous 15 years, but less extreme than the variation observed during 1984–1996.
Range of variation 1984 - 1996
Range of variation 1997 - 2011
71.1 71.8
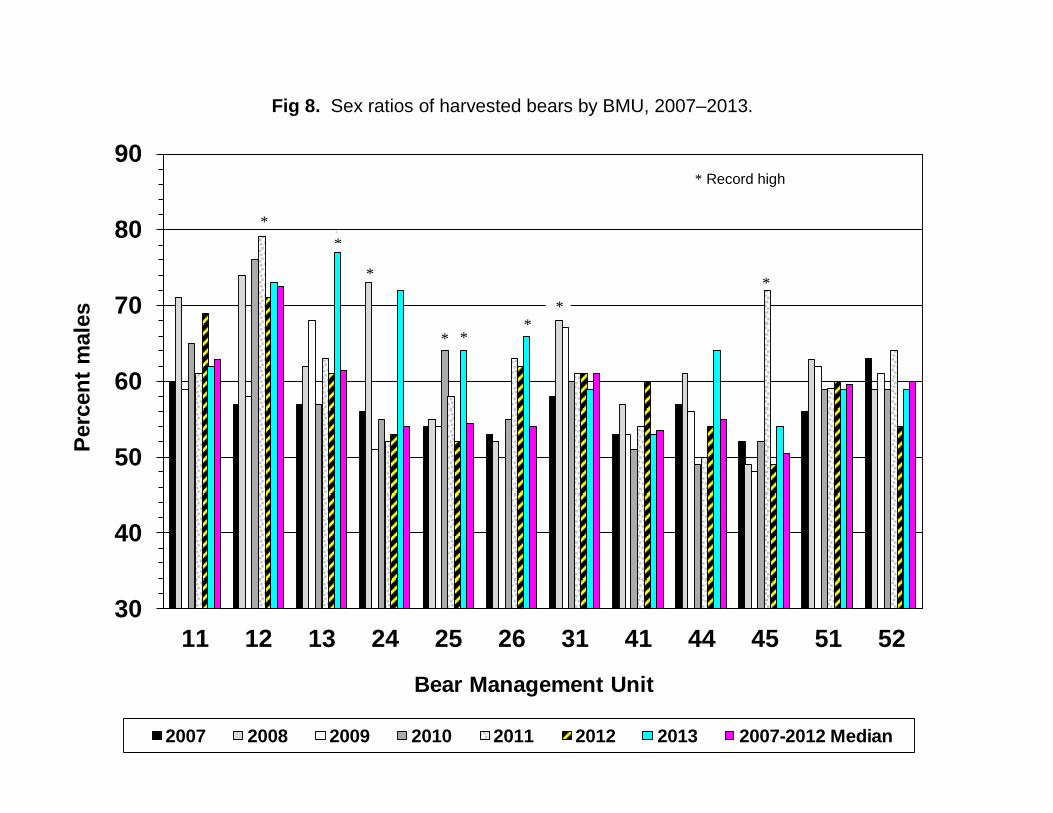
Fig 8. Sex ratios of harvested bears by BMU, 2007–2013.
30
40
50
60
70
80
90
11 12 13 24 25 26 31 41 44 45 51 52
Perc
en
t m
ale
s
Bear Management Unit
2007 2008 2009 2010 2011 2012 2013 2007-2012 Median
* Record high
*
* *
*
*
*
*
*
*
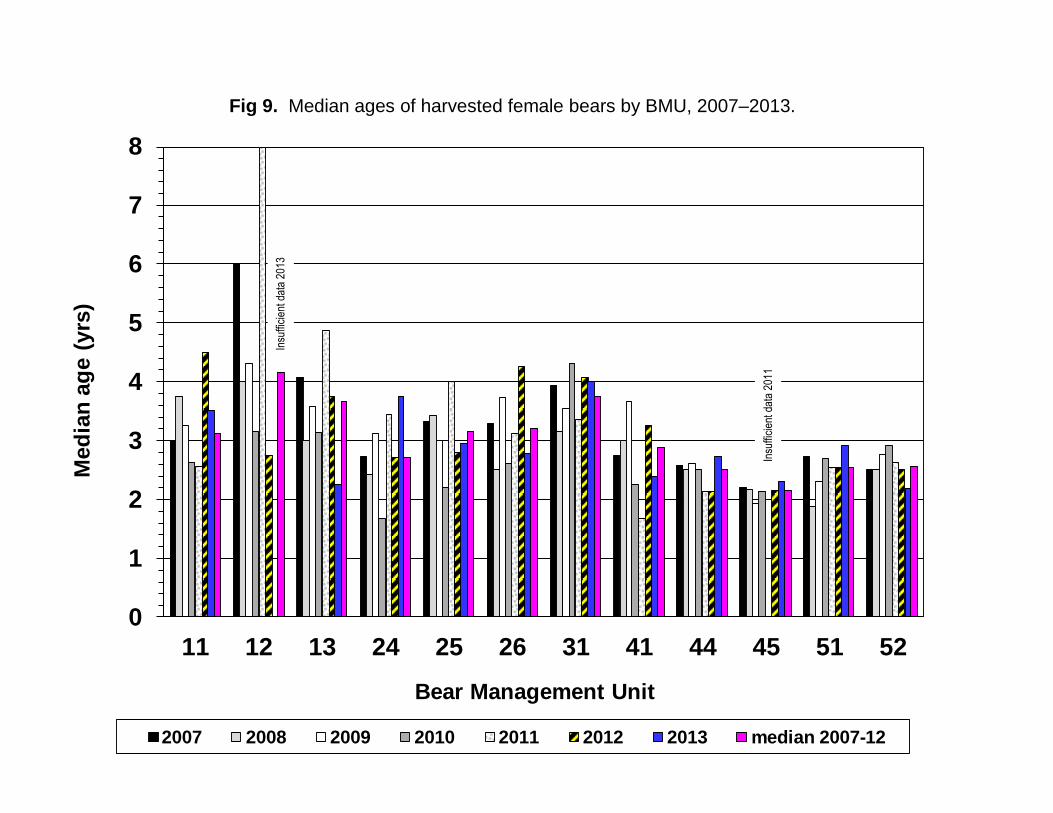
Fig 9. Median ages of harvested female bears by BMU, 2007–2013.
0
1
2
3
4
5
6
7
8
11 12 13 24 25 26 31 41 44 45 51 52
Med
ian
ag
e (
yrs
)
Bear Management Unit
2007 2008 2009 2010 2011 2012 2013 median 2007-12
Insu
ffici
ent d
ata
2013
Insu
ffici
ent d
ata
2011
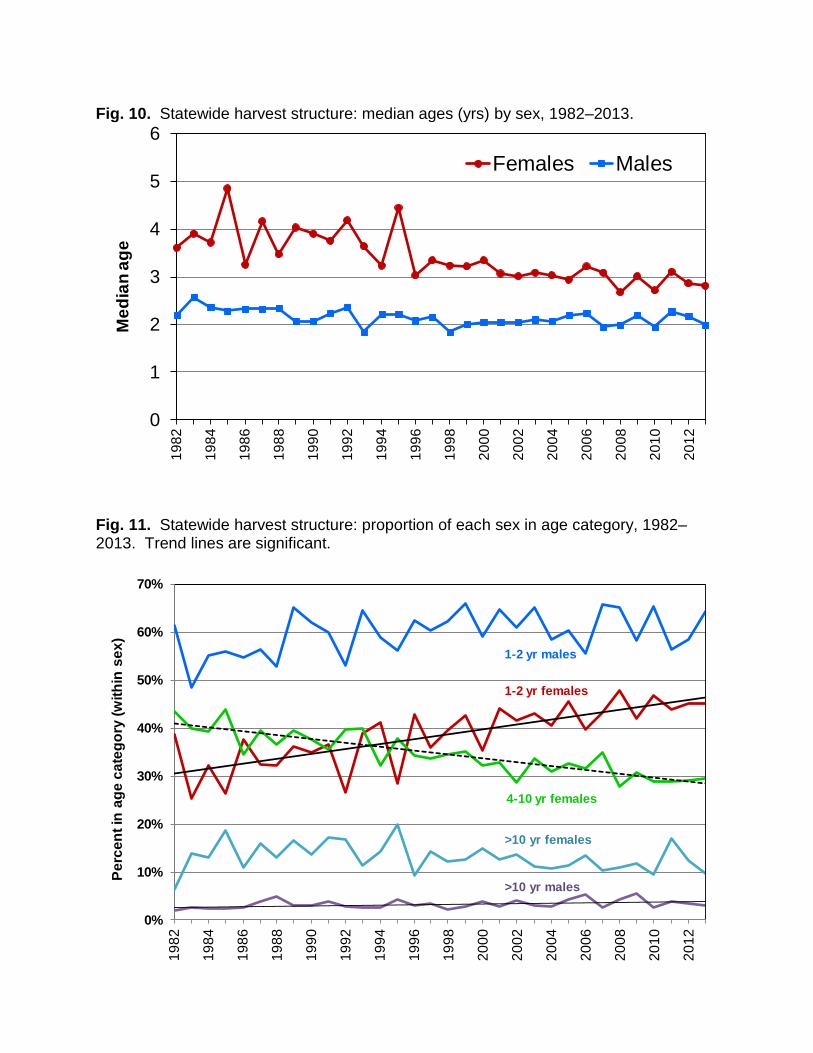
Fig. 10. Statewide harvest structure: median ages (yrs) by sex, 1982–2013.
Fig. 11. Statewide harvest structure: proportion of each sex in age category, 1982–2013. Trend lines are significant.
0
1
2
3
4
5
6
19
82
19
84
19
86
19
88
19
90
19
92
19
94
19
96
19
98
20
00
20
02
20
04
20
06
20
08
20
10
20
12
Me
dia
n a
ge
Females Males
0%
10%
20%
30%
40%
50%
60%
70%
19
82
19
84
19
86
19
88
19
90
19
92
19
94
19
96
19
98
20
00
20
02
20
04
20
06
20
08
20
10
20
12
Pe
rce
nt
in a
ge
ca
teg
ory
(w
ith
in s
ex
)
1-2 yr males
1-2 yr females
4-10 yr females
>10 yr females
>10 yr males
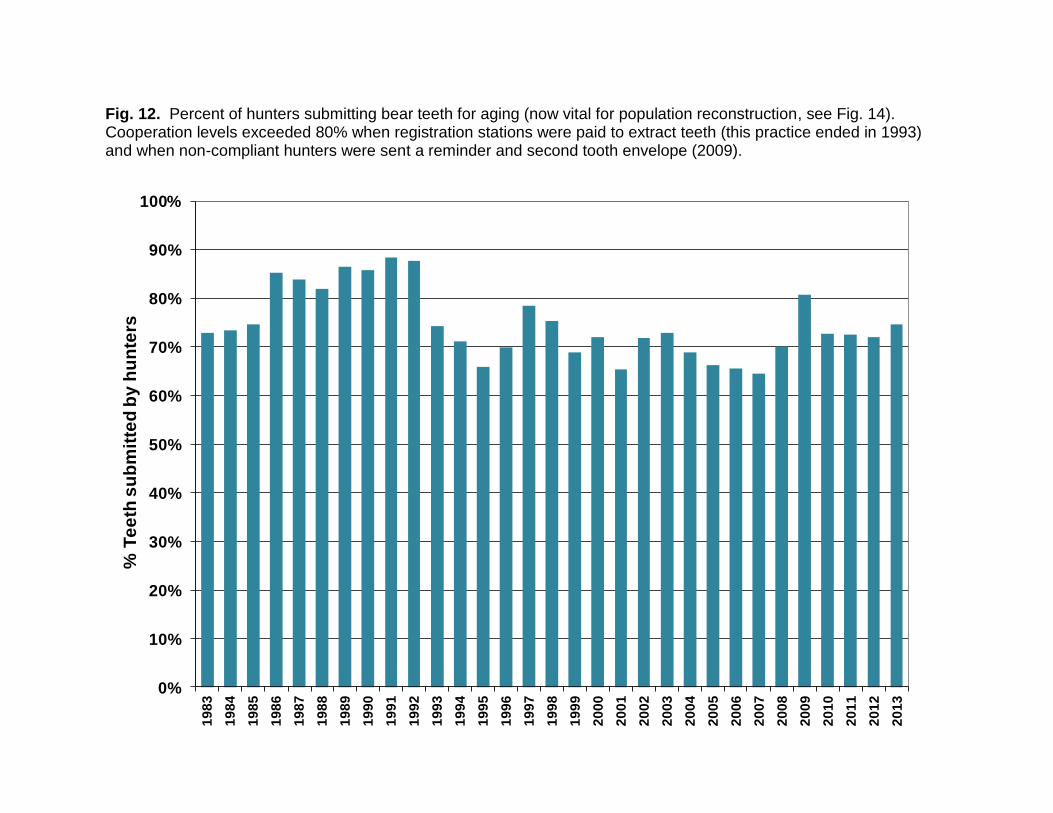
Fig. 12. Percent of hunters submitting bear teeth for aging (now vital for population reconstruction, see Fig. 14). Cooperation levels exceeded 80% when registration stations were paid to extract teeth (this practice ended in 1993) and when non-compliant hunters were sent a reminder and second tooth envelope (2009).
0%
10%
20%
30%
40%
50%
60%
70%
80%
90%
100%1
98
3
19
84
19
85
19
86
19
87
19
88
19
89
19
90
19
91
19
92
19
93
19
94
19
95
19
96
19
97
19
98
19
99
20
00
20
01
20
02
20
03
20
04
20
05
20
06
20
07
20
08
20
09
20
10
20
11
20
12
20
13
% T
ee
th s
ub
mit
ted
by h
un
ters
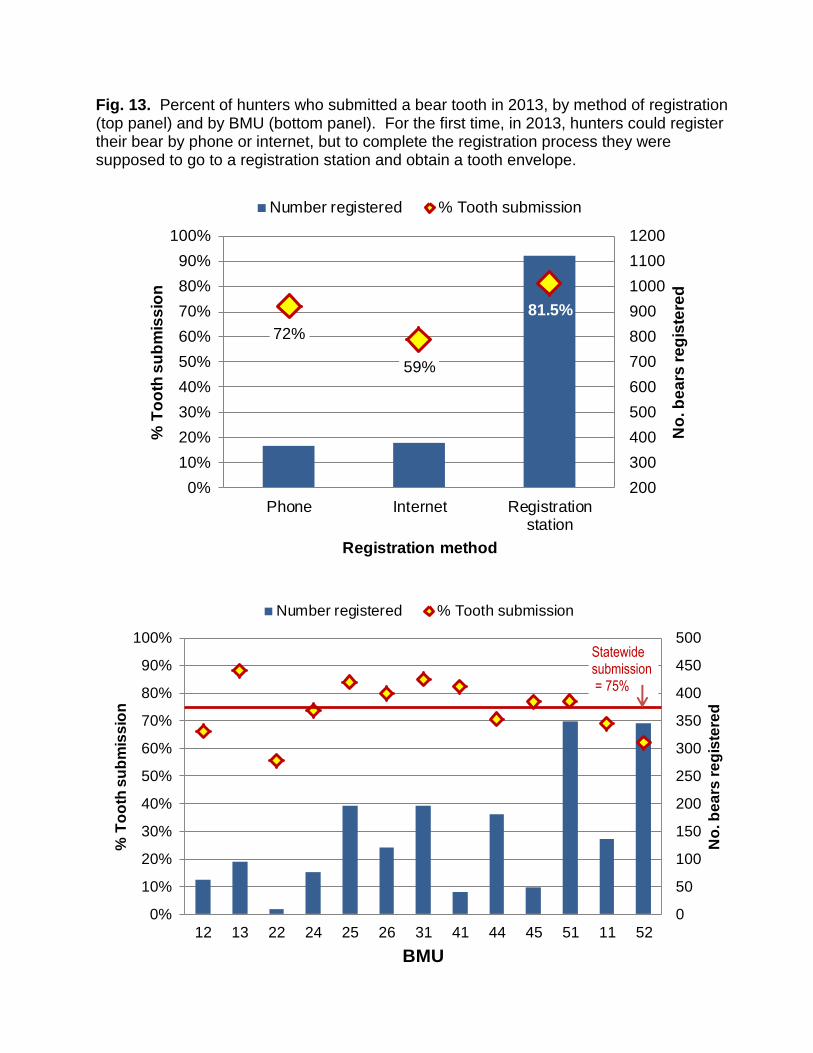
Fig. 13. Percent of hunters who submitted a bear tooth in 2013, by method of registration (top panel) and by BMU (bottom panel). For the first time, in 2013, hunters could register their bear by phone or internet, but to complete the registration process they were supposed to go to a registration station and obtain a tooth envelope.
72%
59%
81.5%
0%
10%
20%
30%
40%
50%
60%
70%
80%
90%
100%
Phone Internet Registrationstation
200
300
400
500
600
700
800
900
1000
1100
1200
% T
oo
th s
ub
mis
sio
n
Registration method
No
. b
ea
rs r
eg
iste
red
Number registered % Tooth submission
0%
10%
20%
30%
40%
50%
60%
70%
80%
90%
100%
12 13 22 24 25 26 31 41 44 45 51 11 52
0
50
100
150
200
250
300
350
400
450
500
% T
oo
th s
ub
mis
sio
n
BMU
No
. b
ea
rs r
eg
iste
red
Number registered % Tooth submission
Statewide submission = 75%
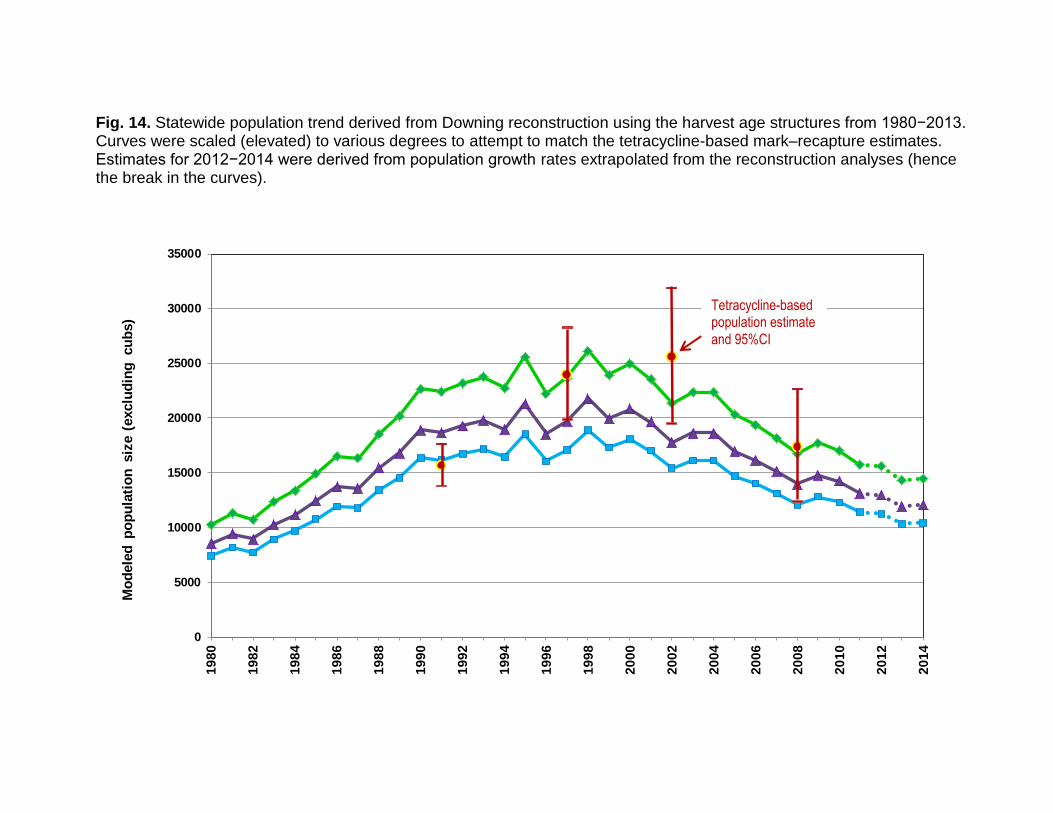
Fig. 14. Statewide population trend derived from Downing reconstruction using the harvest age structures from 1980−2013. Curves were scaled (elevated) to various degrees to attempt to match the tetracycline-based mark–recapture estimates. Estimates for 2012−2014 were derived from population growth rates extrapolated from the reconstruction analyses (hence the break in the curves).
0
5000
10000
15000
20000
25000
30000
35000
19
80
19
82
19
84
19
86
19
88
19
90
19
92
19
94
19
96
19
98
20
00
20
02
20
04
20
06
20
08
20
10
20
12
20
14
Mo
dele
d p
op
ula
tio
n siz
e (
exclu
din
g cu
bs)
Tetracycline-based population estimate
and 95%CI