Embed Size (px)
Citation preview

System integration and local grids
Accelerating the transformation of power systems
Status of Power System Transformation 2017
n Summary for Policy Makers n

INTERNATIONAL ENERGY AGENCY
The International Energy Agency (IEA), an autonomous agency, was established in November 1974. Its primary mandate was – and is – two-fold: to promote energy security amongst its member
countries through collective response to physical disruptions in oil supply, and provide authoritative research and analysis on ways to ensure reliable, affordable and clean energy for its 29 member countries and beyond. The IEA carries out a comprehensive programme of energy co-operation among its member countries, each of which is obliged to hold oil stocks equivalent to 90 days of its net imports. The Agency’s aims include the following objectives:
n Secure member countries’ access to reliable and ample supplies of all forms of energy; in particular, through maintaining effective emergency response capabilities in case of oil supply disruptions.
n Promote sustainable energy policies that spur economic growth and environmental protection in a global context – particularly in terms of reducing greenhouse-gas emissions that contribute to climate change.
n Improve transparency of international markets through collection and analysis of energy data.
n Support global collaboration on energy technology to secure future energy supplies and mitigate their environmental impact, including through improved energy
efficiency and development and deployment of low-carbon technologies.
n Find solutions to global energy challenges through engagement and dialogue with non-member countries, industry, international
organisations and other stakeholders.IEA member countries:
Australia Austria
Belgium Canada
Czech RepublicDenmark
EstoniaFinland
FranceGermany
GreeceHungary
Ireland Italy
JapanKoreaLuxembourgNetherlandsNew Zealand NorwayPolandPortugalSlovak RepublicSpainSweden
SwitzerlandTurkey
United KingdomUnited States
The European Commission also participates in
the work of the IEA.
© OECD/IEA, 2017
International Energy Agency Website: www.iea.org
Please note that this publication is subject to specific restrictions that limit its use and distribution.
The terms and conditions are available online at www.iea.org/t&c/
Together
SecureSustainable
© OECD/IEA 2017 Status of Power System Transformation 2017 Summary for Policy Makers
Page | 1
Summary for Policy Makers
Background and scope
This document summarises the main messages of the Status of Power System Transformation 2017 – System integration and local grids. The aim of the report is to provide an overview of current trends in the field of power system transformation, with a particular focus on the integration of renewables and the evolution of local grids. A further main objective of the report is to introduce a framework for assessing the progress of power system transformation in a country or jurisdiction. This assessment framework is applied to selected countries participating in the Clean Energy Ministerial (CEM) including Indonesia, South Africa, Mexico and Australia. The case studies are presented in this order to reflect the relative level of evolution of their power sector structures, which are discussed in detail for each specific country, according to a set of common key attributes and options.
Rather than aiming for a fully comprehensive discussion, the report provides a broad set of recent concrete examples, integrated in a consistent analytical context, to inform policy makers and power system practitioners of ongoing developments across the globe and distillate policy implications and lessons that are transferrable to a wider set of countries. The focus is on recent trends and examples that are pertinent and have implications for the integration of renewables and local grid development.
The power sector is undergoing significant changes
In countries around the world, power sectors are undergoing significant change as technologies, institutional approaches and business models evolve. Supply- and demand-side technology improvements, as well as increased digitalization and automation of end uses are influencing the planning, operation, access to, and profitability of power systems. Policymakers, regulators, utilities and other power system stakeholders can use innovative approaches across the entire power system to respond to these changes. This report provides both an update on a number of recent trends in power system operation and planning, and a discussion of how institutional frameworks can respond to technical developments.
“Power system transformation” is an active process of creating policy, market and regulatory environments that accelerate investment, innovation and the use of smart, efficient, resilient and environmentally sound technology options. This can take place through interactions of technology, the physical electricity infrastructure, and market, policy and regulatory frameworks. Looking into the future, these developments may result in a paradigm shift, away from fully centralised power systems, towards a more complex and interacting set of systems at multiple levels, which include centralised, local, and island systems. In particular, transformation entails more decentralised assets, where consumers have more ability to choose. In addition, increasing amounts of energy system integration will be seen, such as coupling with other sectors (particularly transport, and heating and cooling).
Power system transformation is highly context specific, but common themes are emerging. Power systems differ both in their technical properties (e.g. generation mix, demand characteristics, network topology) and their regulatory paradigm (e.g. ownership and investment models, level of competition, market structure). This means that solutions from one jurisdiction cannot simply be replicated in another. At the same time, a number of transferrable principles
Status of Power System Transformation 2017 © OECD/IEA 2017 Summary for Policy Makers
Page | 2
are emerging across the globe as discussed below. These principles entail measures to improve power system operation and planning, objectives of market, policy and regulatory framework to enable successful integration of renewables and the way in which local grids are planned and operated.
The transformation pathway depends on the market structure
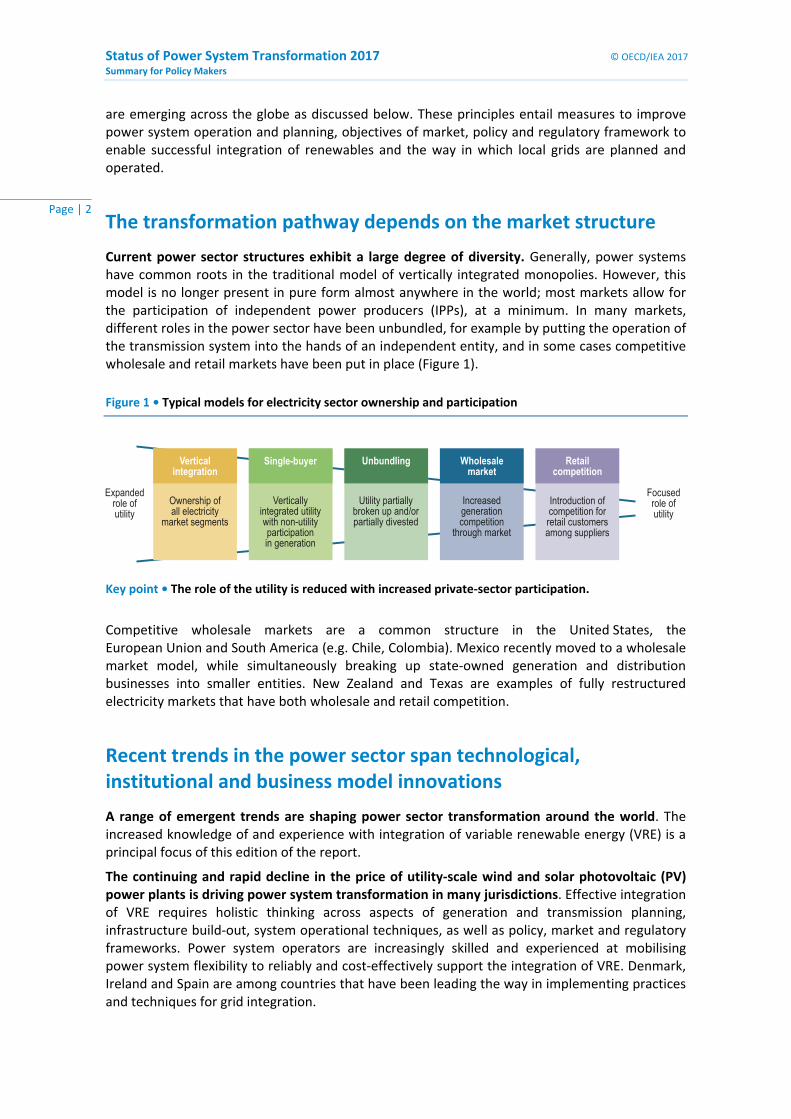
Current power sector structures exhibit a large degree of diversity. Generally, power systems have common roots in the traditional model of vertically integrated monopolies. However, this model is no longer present in pure form almost anywhere in the world; most markets allow for the participation of independent power producers (IPPs), at a minimum. In many markets, different roles in the power sector have been unbundled, for example by putting the operation of the transmission system into the hands of an independent entity, and in some cases competitive wholesale and retail markets have been put in place (Figure 1).
Figure 1 • Typical models for electricity sector ownership and participation
Expanded
role of
utility
Focused
role of
utility
Verticalintegration
Single-buyer Unbundling Wholesalemarket
Retailcompetition
Vertically
integrated utility
with non-utility
participation
in generation
Utility partially
broken up and/or
partially divested
Increased
generation
competition
through market
Introduction of
competition for
retail customers
among suppliers
Ownership of
all electricity
market segments
Key point • The role of the utility is reduced with increased private-sector participation.
Competitive wholesale markets are a common structure in the United States, the European Union and South America (e.g. Chile, Colombia). Mexico recently moved to a wholesale market model, while simultaneously breaking up state-owned generation and distribution businesses into smaller entities. New Zealand and Texas are examples of fully restructured electricity markets that have both wholesale and retail competition.
Recent trends in the power sector span technological, institutional and business model innovations
A range of emergent trends are shaping power sector transformation around the world. The increased knowledge of and experience with integration of variable renewable energy (VRE) is a principal focus of this edition of the report.
The continuing and rapid decline in the price of utility-scale wind and solar photovoltaic (PV) power plants is driving power system transformation in many jurisdictions. Effective integration of VRE requires holistic thinking across aspects of generation and transmission planning, infrastructure build-out, system operational techniques, as well as policy, market and regulatory frameworks. Power system operators are increasingly skilled and experienced at mobilising power system flexibility to reliably and cost-effectively support the integration of VRE. Denmark, Ireland and Spain are among countries that have been leading the way in implementing practices and techniques for grid integration.

© OECD/IEA 2017 Status of Power System Transformation 2017 Summary for Policy Makers
Page | 3
Another major trend is the transformation of local electricity grids, driven by the growing deployment of distributed energy resources and increasing digitalization and automation of networks. Additional trends discussed in the report include:
refined conceptualisations and evaluation frameworks for energy access;
increasing participation of the private sector in markets with growing power demand;
market design challenges in regions with sluggish demand growth;
emerging investment frameworks;
responses to changing market conditions and technology drivers; and
evolving public policy and regulatory strategies.
Successful VRE integration requires system transformation
The implications of integrating high shares of VRE are multiple and include technical, economic and institutional factors, all of which are linked through policies, markets and regulatory frameworks (Figure 2). This is due to the unique technical and economic attributes of VRE, together with the complex nature of the power system. In addition, high shares of VRE have broad implications for the power system at all timescales, ranging from several years to days, hours, minutes and seconds.
Figure 2 • Different aspects of system integration of VRE
Technical
Operation of power systems
Addressing operational challenges
Electrical energy
Information coordinationand
Policies, market and regulatory frameworks
Economic
Cost effectiveness
System planning
Market operation
Financial capital
Institutional
Participants and stakeholders in the power sector
Roles and responsibilities
Data/access flows
Key point • Successful VRE integration requires system transformation that encompasses technical, economic and institutional aspects.

Status of Power System Transformation 2017 © OECD/IEA 2017 Summary for Policy Makers
Page | 4
Integrating large-scale deployment of VRE is enabled by improvements of power system operation and planning
Market structures, regulations, system operations and technology capabilities have evolved to support power system transformation, including economic VRE integration. The issues associated with VRE integration depend largely on the level of VRE deployment and the specific situation of each power system, including aspects such as the existing power plant fleet, system size, common operational practices, market and regulatory design, and demand growth trends. Based on recent VRE integration experiences in many systems, this report identifies four phases of VRE integration and associated operational issues. The main characteristics at different phases of VRE deployment can be briefly described as follows:
Phase 1 – VRE is not noticeable at the system level. The system operators do not need to be concerned with the VRE outputs and their variability.
Phase 2 – VRE becomes noticeable at the system level to the system operator. However, the system can accommodate the new situation largely with existing system resources and by upgrading certain operational practices.
Phase 3 – system flexibility becomes key for integrating VRE. Flexibility relates to how quickly the power system can respond to changes in the demand and supply balance in a timescale of minutes to several hours.
Phase 4 – VRE contributes a significant share of demand at certain times. Technological options and improved operational practices are required to maintain power system reliability. This relates to the ability of the power system to recover from disturbances on very short time scales (a few seconds or less) and maintain the state of operational equilibrium.
Figure 3 • Annual VRE share of generation in selected countries and corresponding VRE phase, 2015
IE DK
DE ESUK IT PTGR
BRCL
IN NZCN AT
SE CAISO
ERCOT
AU
ID ZA
PJM MX
0% 10% 20% 30% 40% 50% 60%
Phase 4 - Short-term stability
Phase 3 -Flexibility is key
Phase 2 - Betteroperations
Phase 1 - Norelevant impact
Notes: AT = Austria; AU = Australia; BR = Brazil; CL = Chile; CN = China; DE = Germany; DK = Denmark; ES = Spain; GR = Greece; ID = Indonesia; IE = Ireland; IN = India; IT = Italy; MX = Mexico; NZ = New Zealand; PT = Portugal; SE = Sweden; UK = the United Kingdom; ZA = South Africa. PJM, CAISO and ERCOT are US energy markets.
Source: Adapted from IEA (2016), Medium-Term Renewable Energy Market Report 2016, OECD/IEA, Paris.
Key point • Each phase can span a wide range of VRE share of generation; there is no single point at which a new phase is entered.
© OECD/IEA 2017 Status of Power System Transformation 2017 Summary for Policy Makers
Page | 5
Integration of VRE requires specific measures to maintain the cost-effectiveness and reliability of the power system, which evolve as VRE deployment increases. A range of measures have been implemented by many power systems worldwide to mitigate the impact of VRE at various phases of deployment. These mitigation measures can be categorised into (1) technical measures and (2) economic measures. Technical measures can help to enhance the reliability of the power system, while economic measures can improve the cost-effectiveness of power systems. Each mitigation measure is discussed in detail in Chapter 3 of the report.
To ensure different measures work in concert, robust and integrative planning is key. In many jurisdictions, increasingly integrated and co-ordinated planning frameworks have played a key role in the cost-effective and reliable accommodation of higher shares of VRE in the power system. The report provides examples of emerging power sector planning practices, including:
integrated planning across a diversity of supply and demand resources;
integrated generation and network planning;
integrated planning between the power sector and other sectors, particularly transport, and heating and cooling; and
inter-regional planning across different balancing areas.
The large-scale uptake of VRE challenges traditional policy, market and regulatory frameworks
Policy, market and regulatory frameworks have a critical role in guiding operational and investment decisions. In the context of power system transformation, the large-scale uptake of VRE challenges traditional frameworks. This is true for nearly all market structures, whether they lean towards more competitive markets with extensive private sector participation, or towards more vertically integrated utility models. However, the required adaptations will be different in each circumstance, reflecting different starting points. Globally, a degree of convergence in the required adaptation between the different models can be observed.
Where vertically integrated models have prevailed so far, a push is being seen towards introducing mechanisms to improve the efficiency of power system operation. For example, the ongoing power market reform in China aims for the introduction of a market mechanism to coordinate the dispatch of power plants in a more cost-efficient manner from a system perspective. In turn, countries that have pioneered power market liberalisation have seen a tendency to implement supplementary mechanisms to ensure security of electricity supply. For example, the United Kingdom has integrated centralised forward-capacity markets and a long-term contracts-for-differences mechanism for low-carbon generation.
Five broad market, policy and regulatory framework objectives greatly enable the integration of larger shares of VRE in the context of power system transformation:
ensuring electricity security of supply, including measures to ensure that generator revenues reflect their full contribution to system security;
operating the power system efficiently at growing shares of variable and decentralised generation, including measures to unlock flexibility from all existing resources, improve dispatch practices by moving operational decisions closer to real time, and encouraging efficient energy price discovery through competitive frameworks;

Status of Power System Transformation 2017 © OECD/IEA 2017 Summary for Policy Makers
Page | 6
providing sufficient investment certainty to attract low-cost financing for capital-intensive investment in clean power generation, including well-structured power purchase agreements (PPAs) for IPP projects;
pricing of negative externalities, including measures to constrain carbon emissions and/or local air pollution when appropriate; and
fostering the integration and development of new sources of flexibility, including from thermal generators, grids, demand response resources and storage.
Evolution of local grids
Low- and medium-voltage grids are traditionally designed to passively distribute power from high-voltage networks to end users at lower voltages. The way these “local grids” need to be planned and operated is changing, driven by (1) uptake of distributed energy resources (DER), (2) the smartening of local grids and (3) electrification of end-use sectors.
Many jurisdictions are now moving away from a paradigm of passively distributed power to customers and towards smarter, actively managed systems with bidirectional flows of power and data. A successful transition will require due consideration of three key dimensions: technical, economic and institutional:
Technologically, ensuring secure and effective system operation under a high degree of decentralisation leads to new priorities for utilities and regulators. Use of advanced information and communication technology (digitalization) allows for improved visibility and control of systems and has the potential to unlock substantial demand response.
Economically, the rise of distributed solar PV and the improving economics of batteries call for a reform of retail electricity pricing and taxation. This includes both remunerating distributed resources according to their value and making users of the grid contribute a fair proportion to the cost of shared infrastructure.
Institutionally, roles and responsibilities are likely to change. One priority is better co-ordination between operators in charge of local grids and those in charge of transmission system operation. In addition, totally new actors, such as aggregators, should be incorporated into the institutional landscape.
Figure 4 • Global installed capacity of residential-scale solar PV, 2010-15
0
5
10
15
20
25
30
35
40
45
2010 2011 2012 2013 2014 2015
Installed capacity (GW)Non-OECD
OECDEurope
OECD AsiaOceania
OECDAmericas
Notes: Residential PV is defined as smaller than 20 kilowatts (kW) installed capacity; OECD = Organisation for Economic Co-operation and Development.
Key point • Residential solar PV capacity is on a continued growth trajectory globally.

© OECD/IEA 2017 Status of Power System Transformation 2017 Summary for Policy Makers
Page | 7
Power system transformation assessment framework and case studies
An updated framework for assessing different aspects of power system transformation is introduced to analyse and track the status of power system transformation. The assessment framework examines four aspects that are relevant to power system transformation: (i) markets and operations; (ii) planning and infrastructure; (iii) uptake of innovative technology; and (iv) efficiency and sector coupling (Table 1).
Four case studies have been selected: Indonesia, South Africa, Mexico and Australia. These countries capture the diversity of contexts and drivers for power system transformation around the world. Each of these countries is unique in their electricity sector institutional structure, network topology, levels of VRE deployment, uptake of new technology and regulatory and market paradigms. Both the assessment framework and the case studies are examined in detail in Chapter 6 of the report.
Table 1 • Dimensions of the power system transformation assessment framework.
Aspect Description and relevance
Markets and operations
The structure of electricity markets and how they are operated, both at the wholesale and retail levels, is a key driver of power system transformation. Emerging market frameworks and improved system operations can help cost-effectively manage electricity delivery infrastructure with greater shares of VRE resources; changes to retail rate structures and regulatory paradigms can help to activate and engage demand-side resources to contribute to the system.
Planning and infrastructure
Power system planning determines the future architecture of the power generation, transmission and distribution systems. Emerging, integrated approaches to power system planning and grid expansion can facilitate an efficient transformation of the power system, while maintaining affordability and reliability; it can also prepare electricity grids for the effective integration of greater technological innovation.
Uptake of innovative technology
An array of emerging innovative technologies, including smart technologies, flexible resources, and system-friendly VRE, can enable a more flexible, reliable and affordable power system. Smart technologies relates to a smarter future electricity system that encompasses digitalization of the energy system, data gathering and system elements to enable real-time visibility. Flexible resources cover storage technologies and demand response. Resource-efficient technologies relate to system-friendly VRE deployment that minimises overall system costs.
Efficiency and sector coupling
Greater energy efficiency in the power sector can help reduce costs both at the system and customer level. Electrification across the transport, and heating and cooling sectors, in combination with the broader trend of cross-sectoral integration of the demand side into electricity markets, can compound the benefits of clean energy deployment and hasten the transition to a low-carbon power system.
Indonesia
Indonesia represents an example of a rapidly growing power system, where affordability and energy access are primary drivers. While these drivers put pressure on expanding the system quickly, they also provide an opportunity to move towards a 21st-century power system in the process. Indonesia has a vertically integrated structure where the state-owned Perusahaan Listrik Negara (PLN) is in charge of the power sector, while allowing independent power producer (IPP) participation. The market for innovative technologies, including non-hydropower renewables is at a nascent stage.

Status of Power System Transformation 2017 © OECD/IEA 2017 Summary for Policy Makers
Page | 8
Figure 5 • Electricity generation by fuel type, 2004-14, Indonesia
0
50
100
150
200
250
2004 2006 2008 2010 2012 2014
TWhWind
PV
Biomass
Hydro
Geothermal
Gas
Oil
Coal
Source: IEA (2017), World Energy Statistics 2016, OECD/IEA, Paris.
Key point • Electricity generation has increased steadily in the past decade. VRE generation is almost non-existent in Indonesia.
South Africa South Africa experienced rapid system growth in past decades, but in recent years has faced stagnant electricity demand growth and rising electricity prices for consumers. The commissioning of large thermal plants has reversed a structural generation shortage to a situation of overcapacity, which provides a buffer in advance of significant expected plant retirements in the coming years. A highly successful competitive procurement framework for renewable energy has kick-started the market for low-cost, clean power, but further VRE deployment has recently been paused due to a variety of factors.
Figure 6 • Electricity generation by fuel type and VRE share, 2004-14, South Africa
0.00%
0.20%
0.40%
0.60%
0.80%
1.00%
0
50
100
150
200
250
300
2004 2006 2008 2010 2012 2014
VRE shareTWh Wind
PV
Bioenergy
Hydro
Nuclear
Gas
Oil
Coal
VREshare
Source: IEA (2017), World Energy Statistics 2016, OECD/IEA, Paris.
Key point • The share of generation from VRE increased from 2013, yet remaining below 1%.

© OECD/IEA 2017 Status of Power System Transformation 2017 Summary for Policy Makers
Page | 9
Mexico Mexico is anticipating growing demand for electricity against a backdrop of an existing generation fleet that includes combined-cycle gas turbines (CCGTs), national VRE goals and rapidly dropping VRE prices. As part of energy sector-wide reform, with a view to attracting private-sector investment and improving system cost-effectiveness, a systematic restructuring of the electricity sector is under way. Mexico is in the process of moving from a vertically integrated paradigm to a competitive wholesale market, while simultaneously pursuing aggressive clean energy targets. The reforms have been relatively rapid and comprehensive. A sophisticated auction system has been able to attract low-cost, large-scale investment.
Figure 7 • Electricity generation by fuel type and VRE share, 2005-15, Mexico
0.00%
0.50%
1.00%
1.50%
2.00%
2.50%
3.00%
0
50
100
150
200
250
300
350
2005 2007 2009 2011 2013 2015
VRE shareTWh Wind
PV
Biomass
Hydro
Geothermal
Nuclear
Gas
Oil
Coal
VRE share
Source: IEA (2017), World Energy Statistics 2016, OECD/IEA, Paris.
Key point • Natural gas dominates Mexico’s generation mix; VRE is growing rapidly from a low base.
Australia
Australia has been at the forefront of electricity market liberalisation; the private sector has been responsible for the bulk of power system investment in the past. Driven by support policies (green certificate system and incentives for distributed solar), Australia has reached the highest penetration of distributed solar PV per capita in the world. It is also experiencing a rapid uptake of large-scale wind and, most recently, solar power plants. Electricity demand has stagnated over recent years and wholesale electricity prices are highly volatile. The question of how to remunerate new investment under these circumstances is receiving considerable attention. Following a state-wide blackout during a severe storm in South Australia on 28 September 2016, advanced strategies for system integration are being implemented with expediency.

Status of Power System Transformation 2017 © OECD/IEA 2017 Summary for Policy Makers
Page | 10
Figure 8 • Electricity generation by fuel type and VRE share, 2005-15, Australia
0.00%
1.00%
2.00%
3.00%
4.00%
5.00%
6.00%
7.00%
8.00%
0
50
100
150
200
250
300
2005 2007 2009 2011 2013 2015
VRE shareTWhWind
PV
Biomass
Hydro
Gas
Oil
Coal
VRE share
Source: IEA (2017), World Energy Statistics 2016, OECD/IEA, Paris.
Key point • Australia’s energy system has experienced rapid growth of VRE sources in the last ten years.
Implications for policy-making
This report can support countries in their own transition by sharing international experience and providing a framework for assessing each aspect of power system transformation. The combination of analytical considerations, with specific country examples, can inform stakeholders of the dynamic changes that are occurring in power systems around the world and provide insight into measures that can help to overcome new challenges.
While the case studies refer to different specific contexts and stages of power system transformation, their assessment is made according to consistent, transferrable key attributes and policy options. For each case study, the assessment framework is applied to analyse each aspect of power system transformation, allowing comparison across countries. In addition, outcomes of the analysis are relevant for other countries with similar context and framework conditions.
Power system transformation is a complex process that requires a considerable amount of policy attention. If managed well, it holds the promise of helping to ensure affordable, reliable and sustainable energy.

Onl
in
e bookshopPDF versions at 20%
discountw
ww
.iea
.org/books
Inte
rnat
iona
l Energy Agency
Secure Sustain
able T
oget
her
World Energy Outlook series
World Energy
Investment series
Energy Statistics series
Energy Policiesof IEA
Countriesseries
Energy Technology
Perspectives series
E-mail: books@
iea.org
Market ReportSeries
Oil
Coal
RenewableEnergy Energy
Efficiency
Gas
Global Gas Security series
EnergyPolicies
Beyond IEA Countriesseries

This publication reflects the views of the IEA Secretariat but does not necessarily reflect those of individual IEA member countries. The IEA makes no representation or warranty, express or implied, in respect of the publication’s contents (including its completeness or
accuracy) and shall not be responsible for any use of, or reliance on, the publication.
Unless otherwise indicated, all material presented in figures and tables is derived from IEA data and analysis.
This document, as well as any data and any map included herein are without prejudice to the status of or sovereignty over any territory, to the delimitation of international frontiers and boundaries and to the
name of any territory, city or area.
IEA Publications, International Energy Agency
Website: www.iea.org Contact information: www.iea.org/aboutus/contactus
Typeset and printed in France by IEA, June 2017
Cover design: IEA. Photo credits: © PhotoObsession.
IEA/OECD possible corrigenda on: www.oecd.org/about/publishing/corrigenda.htm
The paper used has been produced respecting PEFC’s ecological, social and ethical standards

Accelerating the transformation of power systems