Embed Size (px)
Citation preview
sustainability
Article
Status of Waste Management in the East AfricanCities: Understanding the Drivers of WasteGeneration, Collection and Disposal and TheirImpacts on Kampala City’s Sustainability
Shamim Aryampa 1,2,*, Basant Maheshwari 1 , Elly Sabiiti 2, Najib L Bateganya 3 andBrian Bukenya 3
1 School of Science, Western Sydney University, Locked Bag 1797, Penrith, NSW 2751, Australia;[email protected]
2 School of Agricultural Sciences, Makerere University, P. O. Box 7062 Kampala, Uganda;[email protected]
3 Kampala Capital City Authority, City Hall, P. O. Box 7010 Kampala, Uganda; [email protected] (N.L.B.);[email protected] (B.B.)
* Correspondence: [email protected]
Received: 15 August 2019; Accepted: 2 October 2019; Published: 6 October 2019�����������������
Abstract: The factors that influence waste generation and management vary with country but there isa gap in the availability of waste data in Africa limiting the assessment of these factors for sustainability.Hence, this study was aimed at evaluating the drivers of waste generation, collection and disposal,and their impact on sustainability of Kampala as compared to the East African Community (EAC).Waste generation in Kampala was calculated using recorded waste collection efficiencies while data forNairobi and Dar es Salaam was obtained from existing literature. Waste quantities for disposal wererecorded daily at Kiteezi landfill from 2011 to 2017. Results showed that the major drivers of wastegeneration, collection and disposal in the EAC are population growth, vehicle capacity and the needfor disposal respectively. Waste generation rate in Kampala increased from 0.26 to 0.47 kg/capita/dayand the annual waste quantity increased significantly (p < 0.5) by 48% from 227,916 to 481,081 tonscorresponding to a 54% population increase. Waste collection efficiency increased from 30% to 64%and hence waste for disposal increased significantly (p < 0.5), with a mean of 15,823 tons/month;but varied significantly (p < 0.5) with the city division. The most (5120 tons) and least (3472 tons) wasteper month was collected from the Central and Nakawa divisions respectively. Additionally, KampalaCapital City Authority collected significantly more waste than private collectors for all study years.Waste is disposed of at the Kiteezi landfill despite exhausted capacity. Future projections showedthat by 2030, annual waste would increase by approximately 60% for Kampala and Nairobi and by74% for Dar es Salaam. Dar es Salaam generated the highest amount of waste, five times more thanKampala. More investment needs to be made towards the reduction of waste disposal and strategiesdeveloped for the reuse and recycling of waste.
Keywords: sustainability; waste management; East African Community; Kampala; waste generation;Kiteezi landfill
1. Introduction
Sustainable management of municipal solid waste (MSW) continues to be a challenge for themajority of African cities. Although Africa is the least urbanized continent, it currently has the highestrates of urbanization and urban population growth [1–3]. African cities are expanding rapidly with
Sustainability 2019, 11, 5523; doi:10.3390/su11195523 www.mdpi.com/journal/sustainability
Sustainability 2019, 11, 5523 2 of 16
the continent’s urban population projected to triple from 470 million in 2015 to 1.2 billion, by 2050 [4].With this tripling of the urban population, the generation rates of MSW are expected to increasemore than three-fold further amplifying the challenge of managing this waste. Sub-Saharan Africa isprojected to be the world’s fastest-growing region for waste by 2050 during which waste generationwill peak [5]. Moreover, the urbanization happening in Africa is poorly planned [6] further limitingthe efficiency of managing MSW.
The impacts of improper waste management only get worse with increasing population,which generates more waste. Therefore, the increased rates of MSW generation in Africa are expected totranslate to greater environmental impacts in a region that is already struggling to manage its existingwaste. Yet, challenges are faced at every level of the waste management chain [7]. Importantly, despitedisposal being the least preferred option for waste management in the waste hierarchy [8], it is themost prevalent practice in Africa [9]. The prevalent use of disposal for managing MSW is a concernsince waste disposal tends to magnify the numerous environmental and human health challengespresented by waste and its management. Specifically, open dumps, which are the commonest disposalmethods in Africa [9], create the biggest threats to the environment and human health.
The inadequate management of MSW is one of the principal challenges for African cities achievingthe ambitious sustainable development goals (SDGs). The subsequent waste hazard created playsa crucial role in slowing down the continent’s progress towards sustainable development as wastemanagement is embedded in several targets of the SDGs [10]. To mention but a few, by 2030, it isanticipated that (1) there would be a substantial reduction in the number of deaths and illnessesfrom hazardous chemicals and air, water and soil pollution and contamination; (2) reduction of ‘theadverse per capita environmental impact of cities including, paying special attention to air quality andmunicipal and other waste management and (3) the respective governments would ensure availabilityand sustainable management of water and sanitation for all [10]. Since waste is a major sourceof hazardous chemicals and contaminants [11], improper waste disposal most certainly adverselyaffects the availability of safe water resources and sanitation. Accordingly, the impact of poor wastemanagement in Africa is clearly not limited to only the resources that are directly affected, but also hasserious implications regarding sustainable development as a whole. The management of MSW can beviewed as a component of the environmental management process that has a direct bearing on a city’sattractiveness and its social, economic and political development [7], thus encompassing the threepillars of sustainability [12].
Sustainability entails processes and services that meet the needs of the current generations withoutcompromising the ability to serve future generations [13]. In 2015, the United Nations, during thetransition from the millennium development goals (MDGs) to SDGs, brought to attention the need forunlocking development blockages so as to achieve prosperity that is sustainable for both present andfuture generations. As waste management presents a major blockage to sustainable development inAfrica [7,14], the urgent need to improve MSW management in the region cannot be overemphasized.Nevertheless, for effective improvement, a comprehensive understanding of the present conditionis essential to guide the plans for processes, services and practices that conserve the quality of theenvironment and human health while ensuring equitable growth, which would enhance the movetowards sustainable development. The past and current states of MSW management give valuableindications of the future situations [7], which would be helpful in planning for sustainability as theyhighlight the challenges and opportunities that can be harnessed for improvement.
Additionally, although waste management in Africa is receiving more research attention andprocesses along the waste management chain have been described for several countries, the driversof these processes and their link to sustainability is still lacking. However, for effectiveness,the surrounding operational environment of the waste management processes, which comprisesof the external influences [2] that serve as drivers to the processes should receive as much attention asthe processes themselves. Increased attention to the MSW management process drivers is importantto develop relevant strategies and innovations for the integration of waste into the sustainable
Sustainability 2019, 11, 5523 3 of 16
development strategies of cities [7]. Moreover, there is still a gap in the quantity and quality of data onthe generation and management of solid waste in Africa, which has been accurately described as scantyif not poor by Mohee and Simelane [7]. Hence the study of trends and their drivers is still limited inthe waste management of Africa, and yet they would be useful in projecting for future management.Moreover, since MSW generation rates, composition and management across countries [2], evaluation ofindividual countries or regions would ultimately serve to improve the efficiency of those countries.
Furthermore, closely linked to sustainability is the concept of circular economy. Circular economyhas been defined as “a regenerative system in which resource input and waste, emission, and energyleakage are minimized by slowing, closing, and narrowing material and energy loops” [15].Both sustainability and circular economy have shared concerns about the current states of technology,industrial production and consumption, which are likely to put future generations at risk [15].Additionally, both concepts highlight the importance of adequately incorporating environmentaland social aspects within economic progress. The concept of circular economy is gaining increasingimportance in solving several sustainability issues [15–17] and the development of circular economieshas great potential in improving waste management [18] and actually enhancing the move towardssustainability. However, the potential of circular economy in improving management of MSW isunrealized in the East African Community (EAC) and therefore needs more attention in the pursuitfor sustainability.
On this background, the aim of this study was to evaluate the drivers of the current wastegeneration, collection and disposal practices in Kampala, Uganda in the context of the EAC andexamine the impact of the drivers on the city’s sustainability. The potential for developing a circulareconomy within the region for improved waste management has also been discussed in this study.The study serves as a benchmark for the cities of EAC, which is useful for evaluating the performance ofwaste services and encourage efficiency and innovation [2] to increase the move towards sustainability.It will serve as a useful reference for policy makers and financial planners for improvement of theregion’s waste management.
After this introduction, Section 2 details the materials and methods used to achieve the aims ofthe study, Section 3 presents the results of the study and Section 4 shows the discussion of these results,especially highlighting the policy implications of the findings. Finally, Section 5 provides the mainconclusions from this study.
2. Materials and Methods
2.1. Study Area
2.1.1. East African Community
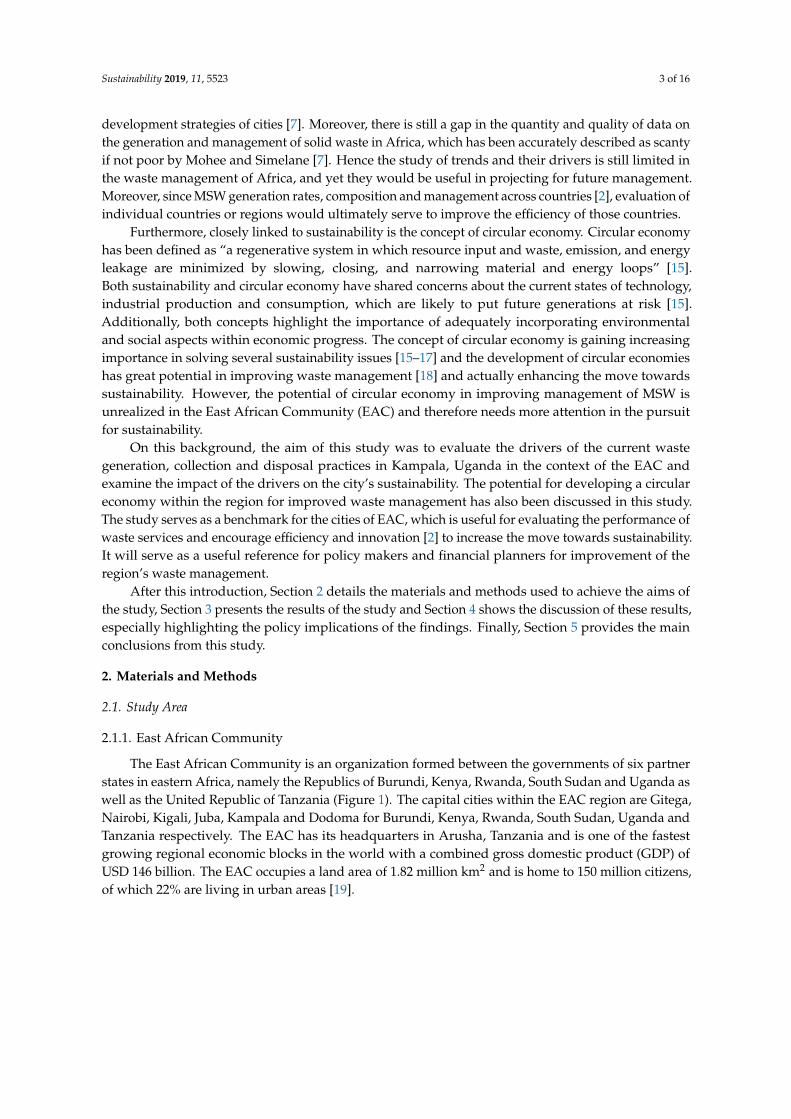
The East African Community is an organization formed between the governments of six partnerstates in eastern Africa, namely the Republics of Burundi, Kenya, Rwanda, South Sudan and Uganda aswell as the United Republic of Tanzania (Figure 1). The capital cities within the EAC region are Gitega,Nairobi, Kigali, Juba, Kampala and Dodoma for Burundi, Kenya, Rwanda, South Sudan, Uganda andTanzania respectively. The EAC has its headquarters in Arusha, Tanzania and is one of the fastestgrowing regional economic blocks in the world with a combined gross domestic product (GDP) ofUSD 146 billion. The EAC occupies a land area of 1.82 million km2 and is home to 150 million citizens,of which 22% are living in urban areas [19].
Sustainability 2019, 11, 5523 4 of 16
Sustainability 2019, 11, x FOR PEER REVIEW 4 of 16
Figure 1. The map of East African community. Source: https://cherutokosgey.wordpress.com.
2.1.2. Kampala
Kampala is the capital city of Uganda and is situated within the Greater Kampala Metropolitan Area (GKMA), which also covers inner suburbs, peripheral towns and peri-urban extensions towards the east and south-west districts of Mukono and Entebbe respectively. The GKMA occupies a surface area of about 970 km2, defined by a 20 km radius from the centre of Kampala city, of which an area of 189 km2 is covered by the city. As the only city in Uganda, Kampala is the centerpiece of economic, political and social transformation [20] in the country hosting 46% of all formal employment. It is Uganda’s main industrial and commercial hub contributing approximately 65% of the country’s GDP [21]. Consequently, although the city was originally planned for less than 500,000 people, it currently hosts a resident population of about 1.9 million (10% of the country’s population) with a population density of 7928 persons per km2 [21]. Moreover, the city has twice as many people during daytime hours due to transient visitors and commercial workers. The GDP per capita of Kampala city is 1530 USD at circa.
Kampala has five divisions: Central (central business district), Makindye, Nakawa, Kawempe and Rubaga. The city is administered on behalf of the Central Government by the Kampala Capital City Authority (KCCA), a legal corporate entity established by the Ugandan Parliament. KCCA is responsible for the collection, transportation, treatment and safe disposal of the waste generated within the city as mandated by the Public Health Act Cap 281 and the Local Governments Act. In conducting its duties, KCCA is mandated by the Kampala City Council Solid Waste Management Ordinance of 2000 to ensure that solid waste is collected and conveyed to treatment installations in a manner that satisfies both public health and environmental conservation requirements.
2.1.3. The Kiteezi Landfill
Kiteezi landfill is the only sanitary landfill in Uganda and is currently managed by KCCA. The landfill is located in the peri-urban Kiteezi, 13 km from Kampala city centre at latitude: 0°25′0′’ and longitude: 32°34′00′’ [22,23]. Access to the landfill from the city is through the Kampala-Gayaza road (approximately 9 km) and then onto Buwambo road for 4 km [24]. Waste from Kampala city and the nearby peri-urban areas in the Wakiso district is disposed of at the landfill free of charge. The landfill location receives two seasons of rainfall (March to May and September to November) and has two dry seasons (December to February and June to August).
2.2. Data Collection
Waste quantities generated in Kampala were obtained by calculations based on waste collection efficiency record of KCCA and the quantities of waste delivered to Kiteezi landfill for disposal. Waste quantities for disposal were recorded daily from 2011 to 2017 at the landfill. Existing literature was
Figure 1. The map of East African community. Source: https://cherutokosgey.wordpress.com.
2.1.2. Kampala
Kampala is the capital city of Uganda and is situated within the Greater Kampala MetropolitanArea (GKMA), which also covers inner suburbs, peripheral towns and peri-urban extensions towardsthe east and south-west districts of Mukono and Entebbe respectively. The GKMA occupies a surfacearea of about 970 km2, defined by a 20 km radius from the centre of Kampala city, of which anarea of 189 km2 is covered by the city. As the only city in Uganda, Kampala is the centerpiece ofeconomic, political and social transformation [20] in the country hosting 46% of all formal employment.It is Uganda’s main industrial and commercial hub contributing approximately 65% of the country’sGDP [21]. Consequently, although the city was originally planned for less than 500,000 people, itcurrently hosts a resident population of about 1.9 million (10% of the country’s population) with apopulation density of 7928 persons per km2 [21]. Moreover, the city has twice as many people duringdaytime hours due to transient visitors and commercial workers. The GDP per capita of Kampala cityis 1530 USD at circa.
Kampala has five divisions: Central (central business district), Makindye, Nakawa, Kawempe andRubaga. The city is administered on behalf of the Central Government by the Kampala CapitalCity Authority (KCCA), a legal corporate entity established by the Ugandan Parliament. KCCA isresponsible for the collection, transportation, treatment and safe disposal of the waste generated withinthe city as mandated by the Public Health Act Cap 281 and the Local Governments Act. In conductingits duties, KCCA is mandated by the Kampala City Council Solid Waste Management Ordinance of2000 to ensure that solid waste is collected and conveyed to treatment installations in a manner thatsatisfies both public health and environmental conservation requirements.
2.1.3. The Kiteezi Landfill
Kiteezi landfill is the only sanitary landfill in Uganda and is currently managed by KCCA.The landfill is located in the peri-urban Kiteezi, 13 km from Kampala city centre at latitude: 0◦25′0′′
and longitude: 32◦34′00′′ [22,23]. Access to the landfill from the city is through the Kampala-Gayazaroad (approximately 9 km) and then onto Buwambo road for 4 km [24]. Waste from Kampala cityand the nearby peri-urban areas in the Wakiso district is disposed of at the landfill free of charge.The landfill location receives two seasons of rainfall (March to May and September to November) andhas two dry seasons (December to February and June to August).
2.2. Data Collection
Waste quantities generated in Kampala were obtained by calculations based on waste collectionefficiency record of KCCA and the quantities of waste delivered to Kiteezi landfill for disposal.
Sustainability 2019, 11, 5523 5 of 16
Waste quantities for disposal were recorded daily from 2011 to 2017 at the landfill. Existing literaturewas then used to obtain data on the GDP and population of Kampala city during the study years aswell as waste data of Nairobi and Dar es Salaam.
2.2.1. Waste Generation Data
Since there was a paucity of information on waste quantities at sources, waste generated inKampala city was obtained by calculations based on the waste quantities received at Kiteezi landfilland the collection records from KCCA using equation 1 below. The percentages of waste collectedmonthly from the city were obtained from the records of KCCA and directly translated to collectionefficiencies as collection percentage. The calculations were done for each month and the totals obtainedas the annual quantities. The use of this calculation enabled us to obtain data on waste generation,which is limited but presents the limitation of excluding the waste quantities that are collected but arenot taken to the landfill for disposal.
Total waste generated =waste quantities f or disposal
collection percentage∗ 100 (1)
2.2.2. Waste Disposal Data
The quantity of waste received at Kiteezi landfill was recorded daily from 2011 to 2017 withthe following details: date, the truck number plate, the waste quantity and the owner of the trucki.e., either KCCA or private waste collector. Waste delivered by KCCA was further categorizedaccording to the division of the city from which it had been collected. To determine waste quantities,the trucks delivering waste to the landfill drove over a weighbridge before and after offloading thewaste; the weight of the waste was calculated as the difference in the weight of the truck beforeand after the waste was taken out. Up until 2012, waste quantities were determined using thisweighbridge. However, after 2012, the weighbridge broke down and waste quantities were determinedby estimations based on the truck types and their capacities. To make these estimations, all garbagetrucks that delivered waste to the landfill were weighed on a standardized weighbridge when emptyand when filled with waste as a baseline to determine the net weights of waste that can be carried bythe trucks. The procedure for obtaining the net weight was done three times for each truck and theaverage net weight calculated. After that, each time a truck delivered waste at the landfill, the netweight determined in this procedure was recorded as the waste quantity.
Although the use of estimates in this study had a limitation of either under or over estimation ofthe actual waste quantities, it was useful for collecting data even when faced with the challenge of thenon-functional weigh bridge, which could not be repaired due to financial constraints.
2.3. Data Analysis
Data analysis was done using IBM SPSS statistics version 25. Before conducting ANOVA,the assumptions for ANOVA were tested. The assumption of normality and nonexistence of outlierswere met for each combination of factors. Normality was tested for using the Shapiro-Wilk test.The assumption for the homogeneity of variance was not met for when the test was using all thedata but was met for the different years; a Levene’s test of equality of error variances was used.Univariate ANOVA was then conducted to determine the differences in waste quantities in differentyears, from the five divisions and by the different waste collectors (KCCA or private companies).Means were separated using Fischer’s Least Significant Difference (LSD) at 5% significance level.An independent samples t-test was conducted to determine if there was a difference in waste quantitiescollected in the two seasons of weather. Projections for waste generation in the cities of Kampala,Nairobi and Dar es Salaam were done based on population projections using the correlations betweenpast waste quantities and population.
Sustainability 2019, 11, 5523 6 of 16
3. Results
3.1. Waste Generation Trends in Kampala
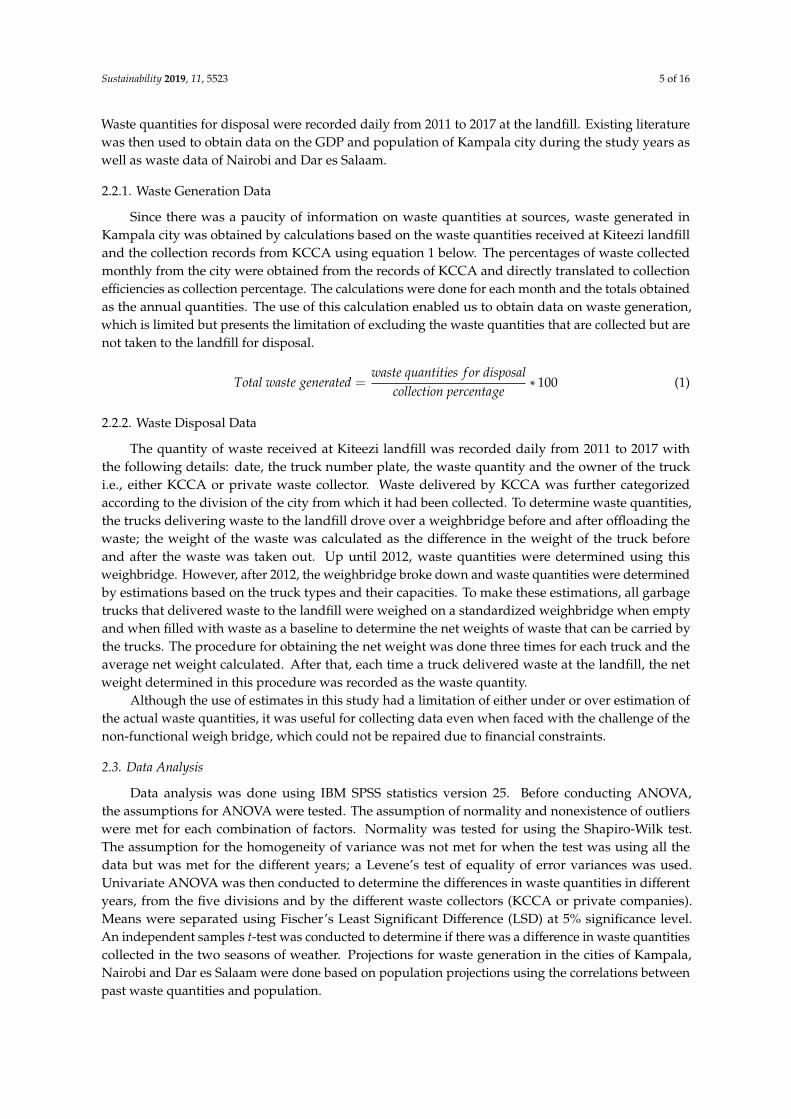
The rate of waste generation in Kampala increased from 0.26 to 0.47 kg/capita/day over the sevenyears of the study, with an average annual increase of 0.03 kg/capita/day. Consequently, the totalannual waste volumes generated in the city also increased significantly from 407,890 to 785,214 tons inthe seven years representing a 48% increase. This increase in the waste quantities corresponded toa 53.5% population increase within the same period. Per capita gross domestic product (GDP) waspositively correlated with per capita waste generation for the 2011 to 2014 period. However, from 2015,the per capita waste generation continued to increase despite the fluctuations in the GDP (Figure 2).
Sustainability 2019, 11, x FOR PEER REVIEW 6 of 16
The rate of waste generation in Kampala increased from 0.26 to 0.47 kg/capita/day over the seven years of the study, with an average annual increase of 0.03 kg/capita/day. Consequently, the total annual waste volumes generated in the city also increased significantly from 407,890 to 785,214 tons in the seven years representing a 48% increase. This increase in the waste quantities corresponded to a 53.5% population increase within the same period. Per capita gross domestic product (GDP) was positively correlated with per capita waste generation for the 2011 to 2014 period. However, from 2015, the per capita waste generation continued to increase despite the fluctuations in the GDP (Figure 2).
Figure 2. Trend of waste generation and per capita gross domestic product (GDP) in Kampala.
3.2. Waste Generation in EAC Cities
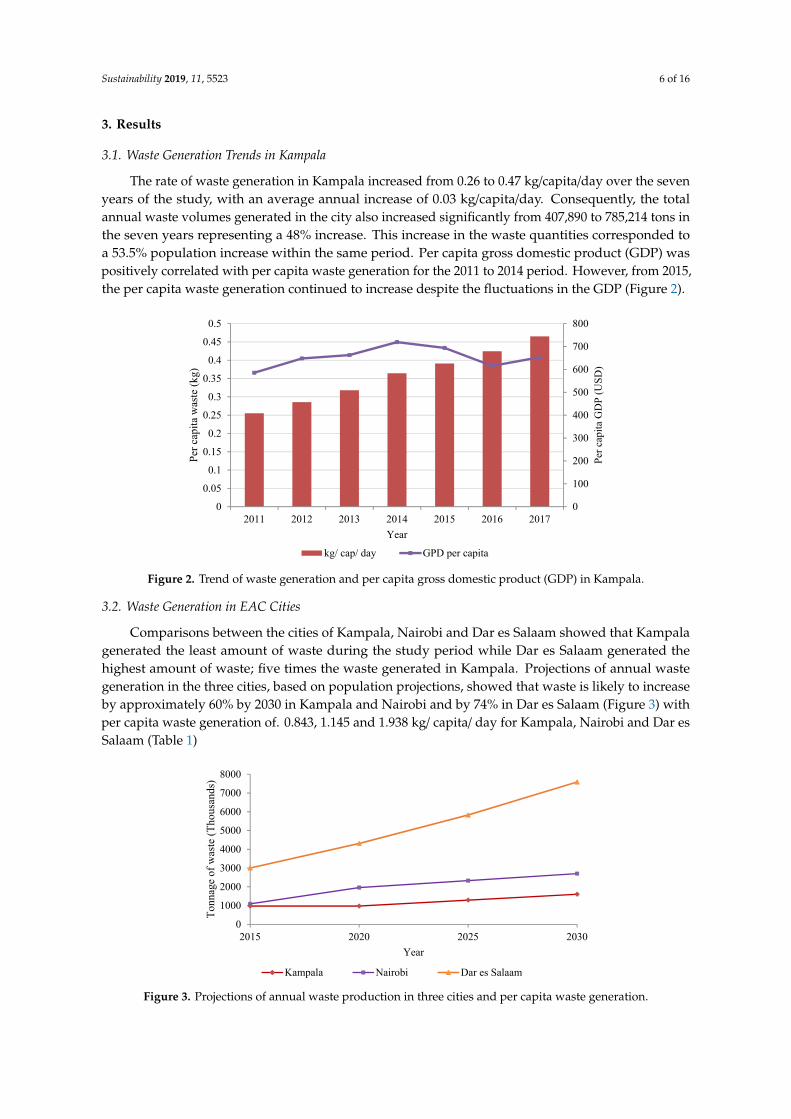
Comparisons between the cities of Kampala, Nairobi and Dar es Salaam showed that Kampala generated the least amount of waste during the study period while Dar es Salaam generated the highest amount of waste; five times the waste generated in Kampala. Projections of annual waste generation in the three cities, based on population projections, showed that waste is likely to increase by approximately 60% by 2030 in Kampala and Nairobi and by 74% in Dar es Salaam (Figure 3) with per capita waste generation of. 0.843, 1.145 and 1.938 kg/ capita/ day for Kampala, Nairobi and Dar es Salaam (Table 1)
0
100
200
300
400
500
600
700
800
0
0.05
0.1
0.15
0.2
0.25
0.3
0.35
0.4
0.45
0.5
2011 2012 2013 2014 2015 2016 2017
Per c
apita
GD
P (U
SD)
Per c
apita
was
te (k
g)
Year
kg/ cap/ day GPD per capita
Figure 2. Trend of waste generation and per capita gross domestic product (GDP) in Kampala.
3.2. Waste Generation in EAC Cities
Comparisons between the cities of Kampala, Nairobi and Dar es Salaam showed that Kampalagenerated the least amount of waste during the study period while Dar es Salaam generated thehighest amount of waste; five times the waste generated in Kampala. Projections of annual wastegeneration in the three cities, based on population projections, showed that waste is likely to increaseby approximately 60% by 2030 in Kampala and Nairobi and by 74% in Dar es Salaam (Figure 3) withper capita waste generation of. 0.843, 1.145 and 1.938 kg/ capita/ day for Kampala, Nairobi and Dar esSalaam (Table 1)Sustainability 2019, 11, x FOR PEER REVIEW 7 of 16
Figure 3. Projections of annual waste production in three cities and per capita waste generation.
Table 1. Projected waste generation rates of the three East African Community (EAC) cities.
City Per capita Waste Generation (kg/cap/day)
2015 2020 2025 2030 Kampala 0.391 0.561 0.709 0.843 Nairobi 0.677 1.044 1.094 1.145
Dar es Salaam 1.612 1.761 1.863 1.938
3.3. Waste Collection and Disposal
Waste collection efficiency in Kampala increased from 30% in 2010 [22] to a current rate of 64%. The total waste quantities delivered at Kiteezi landfill for disposal significantly (p < 0.05) varied with the year and with the collector. Additionally, the interaction between the year and collector also had a significant (p < 0.05) difference on the waste quantities. The total annual waste increased from 227,916 tons in 2011 to 481,081 tons in 2017 (Table 2). Pairwise comparisons showed that total waste quantities for all years were statistically different from each other apart from quantities recorded in 2012 and 2013.
Table 2. Total and mean waste delivered to Kiteezi landfill in seven years.
Total Waste Mean 95% Confidence Interval
Lower Bound Upper Bound
Year
2011 227,916 12,662 11,956 13,368 2012 327,998 13,667 13,055 14,278 2013 344,593 14,358 13,747 14,969 2014 380,900 15,871 15,259 16,482 2015 371,273 15,470 14,858 16,081 2016 430,067 17,919 17,308 18,531 2017 481,081 20,045 19,434 20,656
Collector KCCA 1,637,077 20,075 19,741 20,410
Private collectors 926,751 11,351 11,017 11,686 KCCA = Kampala Capital City Authority.
For all the study years, KCCA delivered significantly (p < 001, LSD = 1251) more waste than the private collectors delivering. Starting 2016, the waste delivered by KCCA started to significantly decline while there was an exponential increase in the waste delivered by the private collectors
0
1000
2000
3000
4000
5000
6000
7000
8000
2015 2020 2025 2030
Tonn
age
of w
aste
(Tho
usan
ds)
Year
Kampala Nairobi Dar es Salaam
Figure 3. Projections of annual waste production in three cities and per capita waste generation.
Sustainability 2019, 11, 5523 7 of 16
Table 1. Projected waste generation rates of the three East African Community (EAC) cities.
CityPer Capita Waste Generation (kg/cap/day)
2015 2020 2025 2030
Kampala 0.391 0.561 0.709 0.843Nairobi 0.677 1.044 1.094 1.145
Dar es Salaam 1.612 1.761 1.863 1.938
3.3. Waste Collection and Disposal
Waste collection efficiency in Kampala increased from 30% in 2010 [22] to a current rate of 64%.The total waste quantities delivered at Kiteezi landfill for disposal significantly (p < 0.05) varied withthe year and with the collector. Additionally, the interaction between the year and collector also hada significant (p < 0.05) difference on the waste quantities. The total annual waste increased from227,916 tons in 2011 to 481,081 tons in 2017 (Table 2). Pairwise comparisons showed that total wastequantities for all years were statistically different from each other apart from quantities recorded in2012 and 2013.
Table 2. Total and mean waste delivered to Kiteezi landfill in seven years.
Total Waste Mean95% Confidence Interval
Lower Bound Upper Bound
Year
2011 227,916 12,662 11,956 13,368
2012 327,998 13,667 13,055 14,278
2013 344,593 14,358 13,747 14,969
2014 380,900 15,871 15,259 16,482
2015 371,273 15,470 14,858 16,081
2016 430,067 17,919 17,308 18,531
2017 481,081 20,045 19,434 20,656
CollectorKCCA 1,637,077 20,075 19,741 20,410
Private collectors 926,751 11,351 11,017 11,686
KCCA = Kampala Capital City Authority.
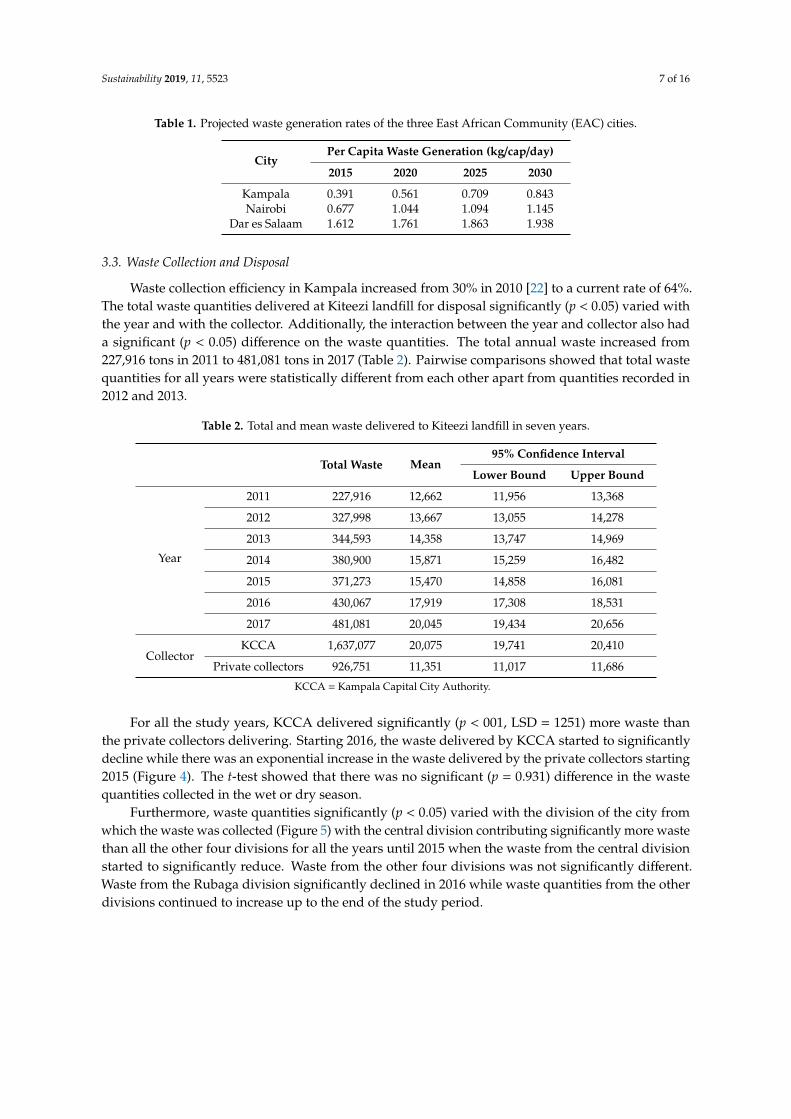
For all the study years, KCCA delivered significantly (p < 001, LSD = 1251) more waste thanthe private collectors delivering. Starting 2016, the waste delivered by KCCA started to significantlydecline while there was an exponential increase in the waste delivered by the private collectors starting2015 (Figure 4). The t-test showed that there was no significant (p = 0.931) difference in the wastequantities collected in the wet or dry season.
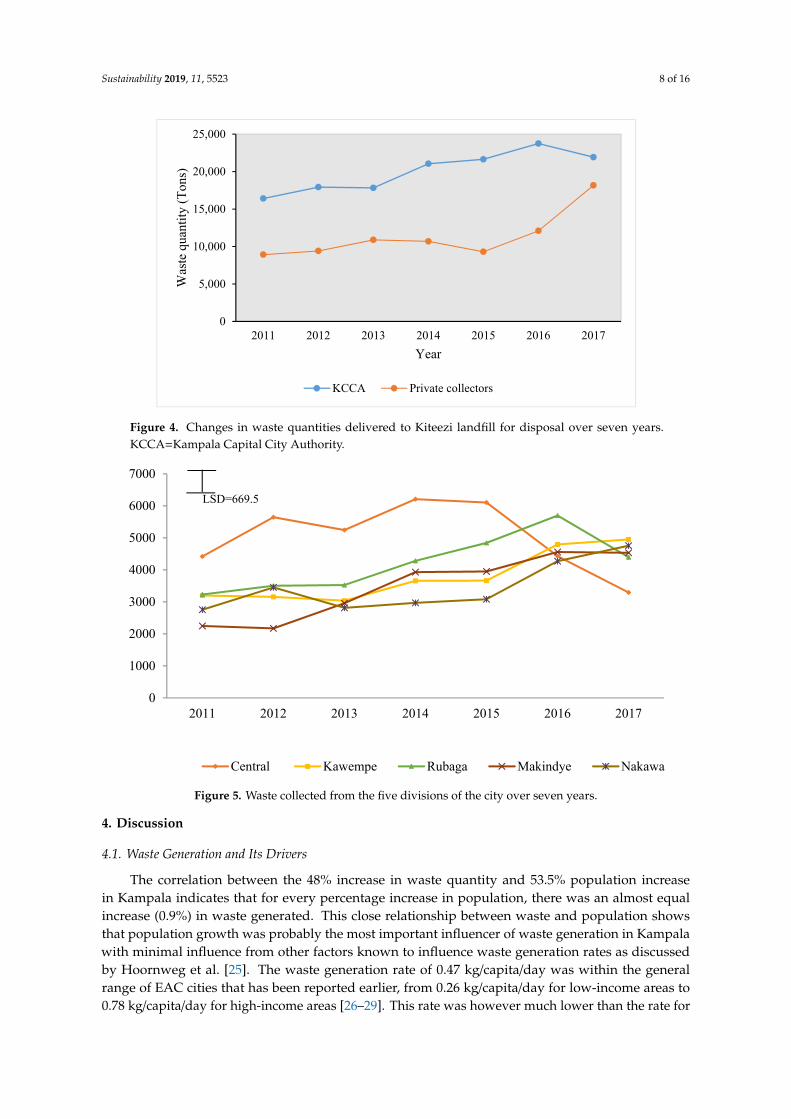
Furthermore, waste quantities significantly (p < 0.05) varied with the division of the city fromwhich the waste was collected (Figure 5) with the central division contributing significantly more wastethan all the other four divisions for all the years until 2015 when the waste from the central divisionstarted to significantly reduce. Waste from the other four divisions was not significantly different.Waste from the Rubaga division significantly declined in 2016 while waste quantities from the otherdivisions continued to increase up to the end of the study period.
Sustainability 2019, 11, 5523 8 of 16
Sustainability 2019, 11, x FOR PEER REVIEW 8 of 16
starting 2015 (Figure 4). The t-test showed that there was no significant (p = 0.931) difference in the waste quantities collected in the wet or dry season.
Figure 4. Changes in waste quantities delivered to Kiteezi landfill for disposal over seven years. KCCA=Kampala Capital City Authority.
Furthermore, waste quantities significantly (p < 0.05) varied with the division of the city from which the waste was collected (Figure 5) with the central division contributing significantly more waste than all the other four divisions for all the years until 2015 when the waste from the central division started to significantly reduce. Waste from the other four divisions was not significantly different. Waste from the Rubaga division significantly declined in 2016 while waste quantities from the other divisions continued to increase up to the end of the study period.
Figure 5. Waste collected from the five divisions of the city over seven years.
4. Discussion
4.1. Waste Generation and Its Drivers
0
5,000
10,000
15,000
20,000
25,000
2011 2012 2013 2014 2015 2016 2017
Was
te q
uant
ity (T
ons)
Year
KCCA Private collectors
0
1000
2000
3000
4000
5000
6000
7000
2011 2012 2013 2014 2015 2016 2017
Central Kawempe Rubaga Makindye Nakawa
LSD=669.5
Figure 4. Changes in waste quantities delivered to Kiteezi landfill for disposal over seven years.KCCA=Kampala Capital City Authority.
Sustainability 2019, 11, x FOR PEER REVIEW 8 of 16
starting 2015 (Figure 4). The t-test showed that there was no significant (p = 0.931) difference in the waste quantities collected in the wet or dry season.
Figure 4. Changes in waste quantities delivered to Kiteezi landfill for disposal over seven years. KCCA=Kampala Capital City Authority.
Furthermore, waste quantities significantly (p < 0.05) varied with the division of the city from which the waste was collected (Figure 5) with the central division contributing significantly more waste than all the other four divisions for all the years until 2015 when the waste from the central division started to significantly reduce. Waste from the other four divisions was not significantly different. Waste from the Rubaga division significantly declined in 2016 while waste quantities from the other divisions continued to increase up to the end of the study period.
Figure 5. Waste collected from the five divisions of the city over seven years.
4. Discussion
4.1. Waste Generation and Its Drivers
0
5,000
10,000
15,000
20,000
25,000
2011 2012 2013 2014 2015 2016 2017
Was
te q
uant
ity (T
ons)
Year
KCCA Private collectors
0
1000
2000
3000
4000
5000
6000
7000
2011 2012 2013 2014 2015 2016 2017
Central Kawempe Rubaga Makindye Nakawa
LSD=669.5
Figure 5. Waste collected from the five divisions of the city over seven years.
4. Discussion
4.1. Waste Generation and Its Drivers
The correlation between the 48% increase in waste quantity and 53.5% population increasein Kampala indicates that for every percentage increase in population, there was an almost equalincrease (0.9%) in waste generated. This close relationship between waste and population showsthat population growth was probably the most important influencer of waste generation in Kampalawith minimal influence from other factors known to influence waste generation rates as discussedby Hoornweg et al. [25]. The waste generation rate of 0.47 kg/capita/day was within the generalrange of EAC cities that has been reported earlier, from 0.26 kg/capita/day for low-income areas to0.78 kg/capita/day for high-income areas [26–29]. This rate was however much lower than the rate for
Sustainability 2019, 11, 5523 9 of 16
high-income areas highlighting that income factors still had a limited influence on waste generation inKampala. Similarly, the differences in waste quantities between the cities of Kampala, Nairobi andDar es Salaam could be attributed to population differences mainly and to income differences to alesser extent. Kampala, which had the lowest population and GDP of the three cities, generated theleast amount of waste. A similar observation of population growth being the main driver of wastegeneration was reported for Nairobi by Kasozi and Blottnitz [30].
Although several factors influence waste generation rates, namely population increase,urbanization, economic growth, per capita income and the overall industrialization [25],population growth was still the major factor influencing waste generation in Kampala and theEAC. Economic influence is limited because most households in the EAC cities are generallypoor as the high rate of urbanization and population growth mostly translates into informalsettlements, which accommodate a significant percentage of the unemployed urban population [21].However, despite the fact that economic growth has not yet reached a point of significant influence onwaste generation, the influence of economic factors in the cities of Kampala and Nairobi, could not becompletely ruled out, especially with increasing income levels. The correlation between GDP and percapita waste in Kampala up to 2014 shows that GDP might have contributed to the increase of wastegeneration in the city but the continued increase in waste generation thereafter, despite fluctuations inthe GDP, shows that the influence of income levels is still limited.
An exception is Dar es Salaam where both population and economic growth are influencing wastegeneration rates in significant ways. The city has a population of over 4 million and is the third fastestgrowing city in Africa and the ninth fastest in the world [31]. The rapid economic growth is reflectedin the waste generation, which has increased threefold over the past 16 years [32]. Moreover, the urbanpopulation in Dar es Salaam is expected to reach approximately 10 million by the year 2030 [32] withan estimated fourfold increase in the waste generated.
The increasing waste generation in the EAC calls for careful urban planning so that the waste doesnot grow to levels, which may render the cities inhabitable. Population growth being the major driverfor waste generation in the region means that effective planning for waste management necessitatesadequate inclusion of current and projected populations. Since sustainability requires that the needsof the future generations will be met, projecting future population sizes and planning for the propermanagement of their waste is prudent. The population growth rate is hence a good indication of wastegeneration increase rates, other factors held constant, since the two rates are almost equal in this study.Therefore, while planning for waste management, authorities can equate each percentage increase inpopulation to a percentage increase in waste quantity as a first step, and then proceed to account tofurther increases in waste that are due to economic factors.
Additionally, it is essential that urban authorities in the EAC pay more attention to adoptingthe concept of circular economy in their policy agendas for waste management. Circular economyhas an objective of maximizing the value got out of products at each point of their lives as opposedto conventional waste management, which is aimed at minimizing the costs of collection anddisposal [16]. In so doing, circular economies turn goods that are at the end of their service lives intoresources and thereby minimizing waste [17,18]. As such, it prevents the loss of items that still havevalue as well as reduces the need and cost of manufacturing new products while reducing waste.Additionally, processing of items for reuse generates jobs and saves energy [16].
The development of circular economies for waste management requires people to reuse whatthey can, recycle what cannot be reused, repair what is broken and remanufacture what cannot berepaired [16]. In this respect, the major opportunity for the development of a circular economy inKampala lies in the fact that due to low income levels, there is a lot of reuse and repair as well asrecycling to a limited extent. Reuse and repair of products mainly takes place at the household levelbut is still limited for the waste generated at commercial centers. However, although several countriesare adopting the concept of the circular economy in their policies, especially the European Union,Africa in general and the EAC are still lagging behind. Therefore, although reuse and repair may be
Sustainability 2019, 11, 5523 10 of 16
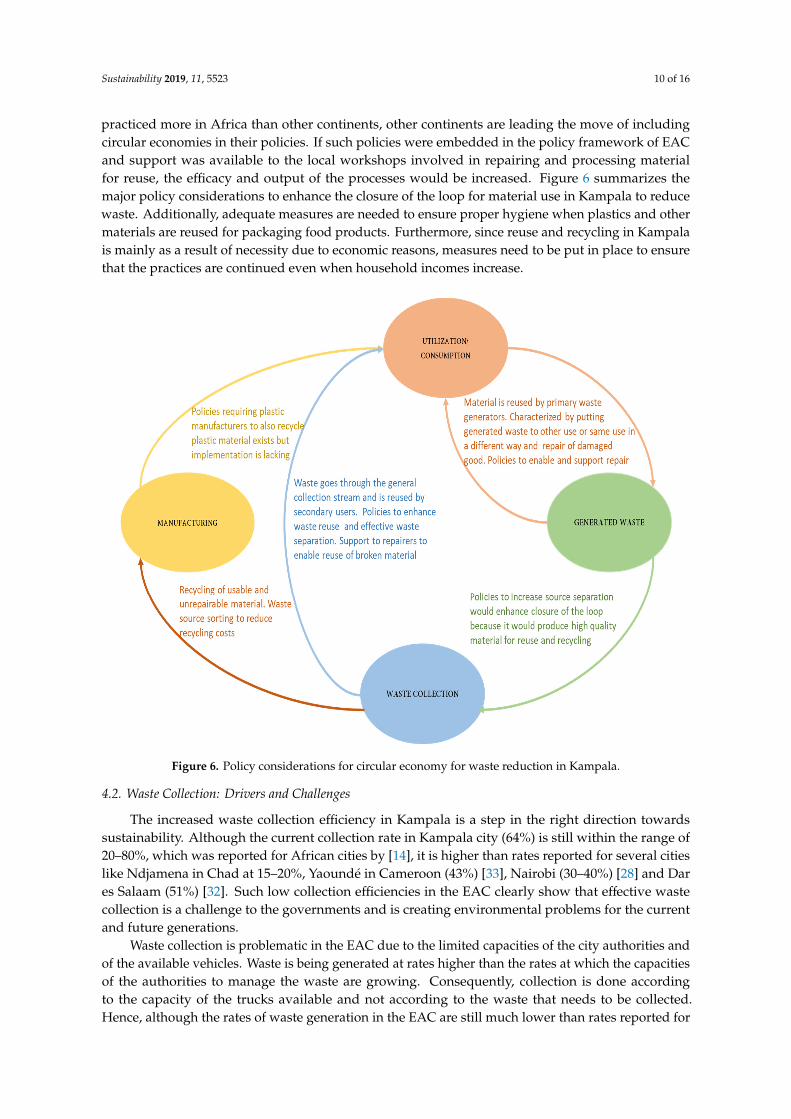
practiced more in Africa than other continents, other continents are leading the move of includingcircular economies in their policies. If such policies were embedded in the policy framework of EACand support was available to the local workshops involved in repairing and processing materialfor reuse, the efficacy and output of the processes would be increased. Figure 6 summarizes themajor policy considerations to enhance the closure of the loop for material use in Kampala to reducewaste. Additionally, adequate measures are needed to ensure proper hygiene when plastics and othermaterials are reused for packaging food products. Furthermore, since reuse and recycling in Kampalais mainly as a result of necessity due to economic reasons, measures need to be put in place to ensurethat the practices are continued even when household incomes increase.
Sustainability 2019, 11, x FOR PEER REVIEW 10 of 16
repaired [16]. In this respect, the major opportunity for the development of a circular economy in Kampala lies in the fact that due to low income levels, there is a lot of reuse and repair as well as recycling to a limited extent. Reuse and repair of products mainly takes place at the household level but is still limited for the waste generated at commercial centers. However, although several countries are adopting the concept of the circular economy in their policies, especially the European Union, Africa in general and the EAC are still lagging behind. Therefore, although reuse and repair may be practiced more in Africa than other continents, other continents are leading the move of including circular economies in their policies. If such policies were embedded in the policy framework of EAC and support was available to the local workshops involved in repairing and processing material for reuse, the efficacy and output of the processes would be increased. Figure 6 summarizes the major policy considerations to enhance the closure of the loop for material use in Kampala to reduce waste. Additionally, adequate measures are needed to ensure proper hygiene when plastics and other materials are reused for packaging food products. Furthermore, since reuse and recycling in Kampala is mainly as a result of necessity due to economic reasons, measures need to be put in place to ensure that the practices are continued even when household incomes increase.
Figure 6. Policy considerations for circular economy for waste reduction in Kampala.
4.2. Waste Collection: Drivers and Challenges
The increased waste collection efficiency in Kampala is a step in the right direction towards sustainability. Although the current collection rate in Kampala city (64%) is still within the range of 20–80%, which was reported for African cities by [14], it is higher than rates reported for several cities like Ndjamena in Chad at 15–20%, Yaoundé in Cameroon (43%) [33], Nairobi (30–40%)[28] and Dar es Salaam (51%) [32]. Such low collection efficiencies in the EAC clearly show that effective waste collection is a challenge to the governments and is creating environmental problems for the current and future generations.
Figure 6. Policy considerations for circular economy for waste reduction in Kampala.
4.2. Waste Collection: Drivers and Challenges
The increased waste collection efficiency in Kampala is a step in the right direction towardssustainability. Although the current collection rate in Kampala city (64%) is still within the range of20–80%, which was reported for African cities by [14], it is higher than rates reported for several citieslike Ndjamena in Chad at 15–20%, Yaoundé in Cameroon (43%) [33], Nairobi (30–40%) [28] and Dares Salaam (51%) [32]. Such low collection efficiencies in the EAC clearly show that effective wastecollection is a challenge to the governments and is creating environmental problems for the currentand future generations.
Waste collection is problematic in the EAC due to the limited capacities of the city authorities andof the available vehicles. Waste is being generated at rates higher than the rates at which the capacitiesof the authorities to manage the waste are growing. Consequently, collection is done accordingto the capacity of the trucks available and not according to the waste that needs to be collected.Hence, although the rates of waste generation in the EAC are still much lower than rates reported for
Sustainability 2019, 11, 5523 11 of 16
developed countries (1.22 kg/capita/day) [14], the waste poses a significant challenge to the authoritiesdue to such restricted resources and capacity. Therefore, to improve waste management, it is inevitablethat resources available to authorities are increased. Waste management needs to receive more priorityin the resources planning especially in national and city budgets. The utilization of the allocatedresources should also be closely monitored to ensure that they are used for the intended purposes.
Waste collected by the private collectors increased due to more efforts of KCCA to include theprivate sector in the waste management process. KCCA engaged three concessionaires, through apublic–private partnership to collect and transport waste to Kiteezi landfill so as to improve wastecollection efficiency. While the benefits of private sector inclusion in public service is still not agreedupon [34], the increase in the waste collection efficiency in Kampala is mostly attributed to this inclusionof private collectors in the waste collection processes. An important measure to increase waste collectionis the increase in the number of collection vehicles or number of trips made per vehicle. However, withlimited institutional capacity, more inclusion of the private sector in the waste collection process couldpotentially serve to increase the waste quantities collected. Nonetheless, for optimum functioning ofthe private sector in waste management, better policy framework should be developed [34] to regulateprivate actors and ensure that the public’s needs are met. Specifically, provision of incentives to privatewaste collectors would be useful in increasing their efficiency during waste collection. With properpolicies in place, city authorities can then focus their limited resources on ensuring that the privateactors meet their end of the contracts.
Besides, the inclusion of the private sector, increased waste collection in Kampala could alsobe attributed to the numerous improvements in the city including recruitment of over 1000 staff,infrastructure development and reconstruction of over 170 km of road network. Since waste collectionefficiency is influenced by the accessibility of areas and the ease of retrieval of waste, these improvementscan correctly be expected to have improved collection efficiency within the city. The bring wastecollection system is used in Kampala where the waste generators have to take their waste to a particularcollection point. In the commercial areas like markets, these areas are well defined and people candispose of waste at any time. However, in residential areas, residents have to take the waste to thecollection vehicles at the time of collection. This waste collection system is useful for ensuring thecollection of waste from areas that cannot be reached by the vehicles. However, it discourages peoplewho are far from the collection points from taking their waste to these points leading to the disposal ofthe waste in abandoned areas or water channels.
On the other hand the increase in waste collection observed in Kampala, it did not match theincrease in the generated waste quantities leaving a significant 36% of the waste uncollected. This gapin waste collection can be attributed to mainly the limited capacity of waste collection vehicle and toseveral gaps in infrastructural developments in the city. Despite the infrastructure within the centraldivision having been significantly transformed, informal slum settlements characterized by temporarydwellings and poor access roads and drainage infrastructure have proliferated in the low lying areas ofthe city. Poor road networks and a large number of extensive slums hinder access to and recoveryof waste reducing the collection efficiency [28,35]. Additionally, MSW collection services are alsointerrupted by traffic congestion, which is very common in Kampala.
The variations in the waste quantities collected from the different divisions of the city couldbe attributed to the differential informal waste picking. Although waste quantities from the centraldivision of Kampala were initially more than waste from the other divisions, they started to decrease in2015 due to more waste being picked from the streets by informal waste pickers. The central division isconcentrated with businesses and institutions that generate very high quantities of recyclable material,which waste pickers can sell. Waste is also picked off the trucks after it is collected reducing theamount that eventually reaches the landfill. This has tremendously reduced the amount of wastefrom the division and the waste continues to reduce as more people get involved in waste picking.However, well-coordinated and managed efforts to increase the separation of wastes at the sourcewould enhance the removal of recyclables, which would greatly reduce the waste destined for disposal.
Sustainability 2019, 11, 5523 12 of 16
This waste picking creates a further gap in the amount of waste that is accounted for because sincethe recyclables are quickly collected on the streets in the central division, these amounts are missingfrom the estimations of waste generation. Additionally, waste picked on the trucks creates a categoryof waste that is not being accounted for because even though it is collected from the source, it nevermakes it to waste disposal sites. Hence, waste measurement at disposal sites does not capture the totalamount of waste initially collected. More research is needed to improve the documentation of wastequantities at all levels of the waste chain.
The lack of relationship between waste received at the Kiteezi landfill and the season or month inthis study is contrary to other studies that show that collected waste is lower during the wet seasonsand festive seasons. This lack of relationship could be due to a fixed number of trucks being used tocollect waste and to the fact that waste quantities were estimated using truck types, which could causevariations in the actual waste quantities.
4.3. Waste Disposal
The trend of ever increasing waste quantities for disposal in Kampala city creates an ever growingneed for more land to dispose of the waste. Consequently, due to limited land availability coupledwith limited institutional capacity to establish new disposal sites as required, there is continued use ofexisting sites beyond their capacities creating a major sustainability dilemma. For instance, the Kiteezilandfill occupied an area of 29 acres when it was established in 1996 but was extended by 6 acres in2007 [23,24] as a short-term arrangement to extend the landfill lifespan for two years [22]. However, thelandfill continues to be used beyond its capacity ending up with conditions similar to an open dumpalthough it was constructed as a sanitary landfill. Since the trend of increasing waste quantities fordisposal is typical for the EAC, most of the waste disposal sites are similarly being used beyond theircapacities. For example, Dandora dump in Nairobi and the only municipal landfill located at Nyanzain Kigali [36], which were deemed full in 2001 and 2013 respectively, continue to be used. Yet withmore waste being generated in the face of limited resources to construct sanitary landfills, the existingsites are likely to continue being used despite the environmental impacts caused.
The continued use of more land for waste disposal creates a growing threat to all land resourcesparticularly soil and water and consequently human health. With more land being used for disposalparticularly beyond its carrying capacity, the risk of soil and water resources being exposed todirect contact with waste and subsequent leachates reduces the sustainability of waste disposal sites.Additionally, the current disposal trend creates a situation where humans have to compete with wastefor settlement and productive agricultural land as well as for safe water. This has resulted to morepeople rapidly occupying areas adjacent to landfills without due attention to the impact that thelandfills may have on their health and wellbeing. This situation, coupled with the expanding disposalareas, continuously puts the health of people at risk.
However, the environmental cost of disposal in terms of the measures of water and soil productivitylost to the waste disposal sites has not as yet received full attention and has not been studied adequatelyin Africa. Methodology for quantifying the loss of environmental resources to waste disposal is stilllacking. Determining the quantities and rates of loss of these resources to waste disposal would bebeneficial in highlighting the magnitude of the situation and may increase the attention paid to wastedisposal management in Africa.
Overall, the best practice for sustainability of waste management in Africa would be the reductionof waste that is eventually disposed of. However, since there are no official transfer stations forwaste in most African countries [32], huge amounts of recyclable waste are taken directly to thedisposal sites. Nevertheless, it is paramount that the maximum possible efforts start being madetowards achieving more recycling and reducing the quantities of waste that are disposed of. This couldstart with well-coordinated and managed efforts to increase the separation of wastes at the source,which would reduce the disposal of recyclable and reusable materials. Effective waste separationnecessitates treating waste as a resource and hence designing circular economies for resource efficiency,
Sustainability 2019, 11, 5523 13 of 16
which in turn calls for policies that permit a shift from conventional waste management to integratedand comprehensive resource management [37].
Another issue for consideration for more efficient resource recovery is the engagement of thegeneral public in the waste management plans and strategies [38], which is key to the success of wastemanagement and achieving the goal of livable cities in EAC countries. In particular, effort shouldbe made to educate and sensitize the waste generators about the impacts of their waste on city’senvironment and livability and what they can do or change to achieve sustainable development goal oftheir city. Since most disposal sites in developing African countries are generally located in peri-urbanareas to manage waste from the cities, city dwellers are often not fully aware of or concerned about theimpacts of their waste disposal.
4.4. Progress Towards Sustainable Waste Management in Kampala
In 1997, Kampala City Council (KCC) designed a framework to reform policies aimed atmoving the delivery of services to the private sector so as to ensure service quality and coverage.Subsequently, in 1999, an action plan to manage MSW was developed to identify opportunities for theprivate sector to get involved in the management of and planning for municipal waste. To operationalizethis plan, the Kampala Solid Waste Management ordinance was developed and put in place by KCC in2000 putting the responsibility of safe waste collection and disposal to the generator (polluter paysprinciple) through well-established systems by the local authority (KCCA) and/or its agents (privatesector). It also prioritized private sector participation along the entire waste value chain guided byclear standard operating procedures and fulfillment of contractual obligations to ensure inclusive,effective and efficient service delivery with due consideration of public health and environmentalpollution control.
With the establishment of KCCA in 2011, the initial focus was placed on massive city awarenesscampaigns and the clean-up of widespread waste heaps and backlogs. At a strategic level, an integratedwhole chain model was adopted with a multi-stakeholder participatory approach. This approachensures a strong focus on establishing systems, equipment and infrastructure for collection andtransport and safe disposal and treatment coupled with public participation through; education andawareness campaigns, regulation and enforcement and waste segregation at source.
However, with the projected increase in both the resident and transient population in Kampalacity, the waste accumulation rate is expected to increase beyond the existing capacity for collection andtransport. Moreover, the Kiteezi landfill has exceeded its design capacity and the current operations arenot optimized to facilitate materials and resources recovery, adequate leachate treatment and pollutioncontrol, as well as efficient utilization of space (through soil cover and compaction).
Consequently, KCCA has acquired 135 acres of land in the peri-urban area of Dundu in theMukono district to establish a state-of-the-art facility for integrated waste disposal and treatment as wellas materials and resource recovery. Completion of this facility will potentially reduce environmentalissues at the Kiteezi landfill and increase the move towards sustainable waste disposal in the city.However, effective waste sorting and recycling would be helpful in ensuring sustainability of the newsite and increase its life span. It is also important that the crucial lessons learnt from the Kiteezi landfillshould be fully incorporated into the management of the new landfill.
5. Limitations of the Study
It was notably observed that there is a general difficulty in obtaining reliable waste generation datafor the EAC. Most available data is acquired from estimates because measurements at waste sourcesare not carried out in most African countries; and hence gives values that are less than the actualamounts. Additionally, some portion of the generated waste does not go through the general stream ofcollection and disposal and is therefore not accounted for in the estimates. Furthermore, the diversenature of EAC cities with some unreachable areas means that waste generated in those areas is notfully accounted for. However, since this waste eventually ends up in the environment, it is important
Sustainability 2019, 11, 5523 14 of 16
to determine as much as possible the actual values of the total waste generated. Scientific researchprovides a good route through which the availability and quality of data can be increased in the EACregion. However joint research, which is developed to solve the issues faced by the authorities wouldenhance the linkage between research and industry increasing the effectiveness of the research [39].Additionally, the use of technologies like remote sensing and weighbridges can go a long way in aidingthe acquisition of accurate waste data and hence more investment in these should be considered.
6. Conclusions
The most significant drivers for waste generation, collection and disposal found in this study arepopulation growth, capacity of collection vehicles and the need for disposal respectively. These drivershighlight the inefficiencies in the MSW management practices in the EAC and clearly show thatMSW management is a significant hindrance to achieving sustainable development in the region.Major challenges for proper waste collection and disposal are created by the large quantities of wastegenerated and magnified by requirements for financial and vehicle capacities beyond those availableto city authorities. Consequently, the waste management practices are not aligned to the wastemanagement requirements. Moreover, the challenges are likely to worsen with the projected 60% and74% increase in the waste generation for Kampala and Nairobi and for Dar es Salaam respectively.
Waste generation in Kampala increased by 48% over seven years in response to a 54% increase inpopulation. This means that adequate considerations of the population growth rates should be donewhile planning for waste management. Although waste collection efficiency increased by 34% duringthe study period, the increase did not match with the increase in the waste quantities but dependedon the vehicles available for waste collection. This mismatch indicates that there is still a significantamount of waste (36%) left uncollected, and so better strategies for increasing the amount of wastecollected are required.
Since, the involvement of private waste collectors increased the total quantities of waste collectedin Kampala, there is need for policies that provide incentives to such collectors to increase wastecollection. However, increased waste collection needs to be matched with proper management of thecollected waste and better management and maintenance of waste disposal sites. Contrarily, wastecontinues to be disposed of at Kiteezi landfill irrespective of the landfill’s exceeded capacity due to theneed for space to dispose of the waste generated in the city. Waste quantities delivered to Kiteezi haveincreased from 227,916 to 480,081 tons per year within the study period and yet the capacity of thelandfill was exhausted in 2009. Such use of disposal sites beyond their capacities, as is common in theEAC, puts pressure on the land, and therefore creates an urgent need to reduce the waste quantitiesthat end up in disposal sites. Development of circular economies is crucial in the efforts to reducewaste within the EAC. Planning for better reuse, reduce and recycling strategies of waste is needed.Policies that would sustain circularity and encourage the different actors to get more involved in theprocesses of waste management that are higher up in the hierarchy.
The use of estimates of waste quantities in this study indicates the lack of accurate waste dataand highlights a critical gap in the management of waste within the EAC. More research focusedon quantifying waste at each stage of the waste management chain and setting up measures for theacquisition of accurate waste generation data will be an important starting point for improving wastemanagement in the region. Furthermore, accurate data are important in proper waste managementplanning and for this waste management authorities need to make efforts in the acquisition andrecording of accurate waste quantity data. The estimates, like the ones provided in this study,provide good baselines for further data collection efforts.
Author Contributions: Conceptualization, S.A., B.M. and E.S.; Data curation, S.A. and B.B.; Formal analysis,S.A.; Funding acquisition, B.M. and E.S.; Investigation, S.A. and B.B.; Methodology, S.A., B.M., E.S. and N.L.B.;Project administration, B.M.; Resources, B.M., E.S. and N.L.B.; Software, S.A.; Supervision, B.M., E.S. and N.L.B.;Validation, B.M. and B.B.; Visualization, S.A. and B.B.; Writing—original draft, S.A.; Writing—review & editing,S.A., B.M., E.S., N.B. and B.B.
Sustainability 2019, 11, 5523 15 of 16
Funding: This research received no external funding.
Acknowledgments: We acknowledge the management of the Kiteezi landfill for sharing the waste collection data.We thank Sandra Diamond-Tissue and Zhong-Hua Chen for their valuable support during this study and JaniceVaz and Sophia Namuddu for proofreading the manuscript on several occasions.
Conflicts of Interest: We wish to draw the attention of the Editor to the employment of some authors in KCCA,which may be considered as potential conflicts of interest. We confirm that the manuscript has been read andapproved by all named authors and that there are no other persons who satisfied the criteria for authorship butare not listed. We further confirm that the order of authors listed in the manuscript has been approved by all ofus. We confirm that we have given due consideration to the protection of intellectual property associated withthis work and that there are no impediments to publication, including the timing of publication, with respect tointellectual property. In so doing we confirm that we have followed the regulations of our institutions concerningintellectual property.
References
1. Cohen, B. Urbanization in developing countries: Current trends, future projections, and key challenges forsustainability. Technol. Soc. 2006, 28, 63–80. [CrossRef]
2. Simões, P.; Marques, R.C. On the economic performance of the waste sector. A literature review. J. Environ.Manag. 2012, 106, 40–47. [CrossRef] [PubMed]
3. Hoornweg, D.; Bhada-Tata, P. What a Waste: A Global Review of Solid Waste Management; World Bank:Washington, DC, USA, 2012.
4. United Nations Department of Economic Social Affairs. World Urbanization Prospects: The 2014 Revision;(ST/ESA/SER.A/366); United Nations: New York, NY, USA, 2015.
5. Hoornweg, D.; Bhada-Tata, P.; Kennedy, C. Environment: Waste production must peak this century. Nat. News2013, 502, 615. [CrossRef] [PubMed]
6. Onibokun, A.; Kumuyi, A. Governance and waste management in Africa. In Managing the Monster:Urban Waste and Governance in Africa; Onibokun, A.G., Ed.; IDRC: Ottawa, ON, CA, 1999.
7. Mohee, R.; Simelane, T. Future Directions of Municipal Solid Waste Management in Africa; Africa Institute ofSouth Africa: Pretoria, South Africa, 2015; pp. 1–5, 107–133.
8. Gertsakis, J.; Lewis, H. Sustainability and the Waste Management Hierarchy. A Discussion Paper;EcoRecycle: Victoria, Australia, 2003.
9. Waste Atlas. Available online: http://www.atlas.d-waste.com/ (accessed on 20 October 2016).10. United Nations, Sustainable Development Goals. Available online: https://www.un.org/
sustainabledevelopment/ (accessed on 12 November 2018).11. Lee, G.F.; Jones-Lee, A. Impact of Municipal and Industrial Non-Hazardous Waste Landfills on Public Health and
the Environment: An Overview; G. Fred Lee & Associates: California, CA, USA, 1994; pp. 15–18.12. Pope, J.; Annandale, D.; Morrison-Saunders, A. Conceptualising sustainability assessment. Environ. Impact
Assess. Rev. 2004, 24, 595–616. [CrossRef]13. Brundtland, G.H. Our common future—Call for action. Environ. Conserv. 1987, 14, 291–294. [CrossRef]14. Achankeng, E. Globalization, Urbanization and Municipal Solid Waste Management in Africa. In Proceedings
of the Africa on a Global Stage, African Studies Association of Australasia and the Pacific, Flinders University,Adelaide, Australia, 1–3 October 2003.
15. Geissdoerfer, M.; Savaget, P.; Bocken, N.M.; Hultink, E.J. The Circular Economy–A new sustainabilityparadigm? J. Clean. Prod. 2017, 143, 757–768. [CrossRef]
16. Stahel, W.R. The circular economy. Nat. News 2016, 531, 435. [CrossRef]17. Pires, A.; Martinho, G. Waste hierarchy index for circular economy in waste management. Waste Manag.
2019, 95, 298–305. [CrossRef]18. Falcone, P.M. Tourism-Based Circular Economy in Salento (South Italy): A SWOT-ANP Analysis. Soc. Sci.
2019, 8, 216. [CrossRef]19. East African Community, Overview of EAC. Available online: https://www.eac.int/overview-of-eac
(accessed on 7 January 2017).20. Sabiiti, E.N.; Katongole, C.B.; Katuromunda, S.; Sengendo, H.; Basalirwa, C.P.; Atukunda, G.; Nambuubi, S.K.
Assessing Urban and Peri-Urban Agriculture in Kampala, Uganda. In Building Urban Resilience; Padhgam, J.,Jabbour, J., Eds.; United Nations Environment Programme: Nairobi, Kenya, 2014.
Sustainability 2019, 11, 5523 16 of 16
21. Uganda Bureau Of Statistics. The National Population and Housing Census 2014-Main Report; Uganda BureauOf Statistics: Kampala, Uganda, 2014.
22. Kampala City Council. Environmental Impact Assessment for Proposed Landfill Gas Flaring CDM Project atMpererwe Landfill Site, Kiteezi; World Bank: Washington, DC, USA, 2008.
23. Mboowa, D.; Kabenge, I.; Banadda, N.; Kiggundu, N. Energy potential of Municipal Solid Waste in Kampala,a Case Study of Kiteezi Landfill Site. Afr. J. Environ. Waste Manag. 2017, 4, 190–194.
24. Mugisa, D.J.; Banadda, N.; Kiggundu, N.; Asuman, R. Lead uptake of water plants in water stream at Kiteezilandfill site, Kampala (Uganda). Afr. J. Environ. Sci. Technol. 2015, 9, 502–507.
25. Hoornweg, D.; Bhada-Tata, P.; Kennedy, C. Peak waste: When is it likely to occur? J. Ind. Ecol. 2015,19, 117–128. [CrossRef]
26. Kaseva, M.E.; Mbuligwe, S.E. Appraisal of solid waste collection following private sector involvement inDar es Salaam city, Tanzania. Habitat Int. 2005, 29, 353–366. [CrossRef]
27. Okot-Okumu, J.; Nyenje, R. Municipal solid waste management under decentralisation in Uganda. Habitat Int.2011, 35, 537–543. [CrossRef]
28. Rotich, H.K.; Yongsheng, Z.; Jun, D. Municipal solid waste management challenges in developingcountries–Kenyan case study. Waste Manag. 2006, 26, 92–100.
29. Scheinberg, A. Value added: Modes of sustainable recycling in the modernisation of waste managementsystems. Ph.D. Thesis, Wageningen University, Wageningen, The Netherlands, November 2011.
30. Kasozi, A.; Blottnitz, H. Solid Waste Management in Nairobi: A Situation Analysis. 2010. EcoPost Sustainableliving. Available online: http://www.ecopost.co.ke/assets/pdf/nairobi_solid_waste.pdf (accessed on21 December 2017).
31. World Population Review. Available online: http://worldpopulationreview.com/world-cities/dar-es-salaam-population/ (accessed on 20 November 2018).
32. International Solid Waste Association, Report on Immediate Upgrades for the Pugu KinyamweziLandfill and Planning for Construction of Sanitary Landfills in Dar Es Salaam, Tanzania. 2017.Available online: http://www.waste.ccacoalition.org/sites/default/files/files/4.1.5._upgrade_of_the_pugu_dumpsite_and_construction_of_sanitary_lfs_in_dar_es_salaam.pdf (accessed on 14 June 2018).
33. Parrot, L.; Sotamenou, J.; Dia, B.K. Municipal solid waste management in Africa: Strategies and livelihoodsin Yaoundé, Cameroon. Waste Manag. 2009, 29, 986–995. [CrossRef]
34. Simões, P.; Cruz, N.F.; Marques, R.C. The performance of private partners in the waste sector. J. Clean. Prod.2012, 29, 214–221. [CrossRef]
35. Alavi Moghadam, M.R.; Mokhtarani, N.; Mokhtarani, B. Municipal solid waste management in Rasht City,Iran. Waste Manag. 2009, 29, 485–489. [CrossRef]
36. Isugi, J.; Niu, D. Research on Landfill and Composting Guidelines in Kigali City, Rwanda Based on China’sExperience. Int. Proc. Chem. Biol. Environ. Eng. 2016, 94, 24–25.
37. Wilts, H.; Von Gries, N.; Bahn-Walkowiak, B. From Waste Management to Resource Efficiency—The Needfor Policy Mixes. Sustainability 2016, 8, 622. [CrossRef]
38. Guerrero, L.A.; Maas, G.; Hogland, W. Solid waste management challenges for cities in developing countries.Waste Manag. 2013, 33, 220–232. [CrossRef] [PubMed]
39. Morone, P.; Falcone, P.M.; Tartiu, V.E. Food waste valorisation: Assessing the effectiveness of collaborativeresearch networks through the lenses of a COST action. J. Clean. Prod. 2019, 238, 117868. [CrossRef]
© 2019 by the authors. Licensee MDPI, Basel, Switzerland. This article is an open accessarticle distributed under the terms and conditions of the Creative Commons Attribution(CC BY) license (http://creativecommons.org/licenses/by/4.0/).