Embed Size (px)
Citation preview

Status-Quo Bias:
Mere Labeling Matters
State University – Higher School of Economics June 4, 2009
Maya Bar-Hillel and Avital Moshinsky

The well-known resistance to changing the status quo is multiply determined. Some reasons for it are completely justified:
• It may be better to begin with.
• It may be too costly to change (e.g., “transaction costs”; “responsibility costs”).

But several behavioral tendencies also serve the SQ:
Laziness (mental, too)
Omission bias, or asymmetric regret
Routines and habits

Decision aversion
"Chicago were looking for someone to take [Fermi's] place. ... they asked me if I wanted to know the salary. 'Oh, no!' I said. "I've already decided to stay at Caltech. ... Besides, I've decided not to decide any more; I'm staying at Caltech for good." (Feynman,1985, p. 236).

• Also, judgmental errors:
• Transaction costs may only seem too high.
• More pertinent to this study: The SQ may only seem better
• Insofar as these are systematic – they are sources of bias.

How best to test for a “pure” SQ bias?
The status quo is to policies or states of affairs as the endowment effect is to goods.
The endowment effect is most cleanly shown in controlled studies where Ss are endowed with a good at random.
Chocolate bar vs. coffee mug example.

Endowing Ss at random with policies is not as easy, obviously.
A common research strategy:
Hypothetical choice among hypothetical states of affairs (e.g., Zeckhauser and Samuelson).
Result: A state is more popular when presented as the SQ.

Another strategy: “natural experiments”
(from: Johnson & Goldstein, Defaults and donation decisions Transplantation, 78(12) )
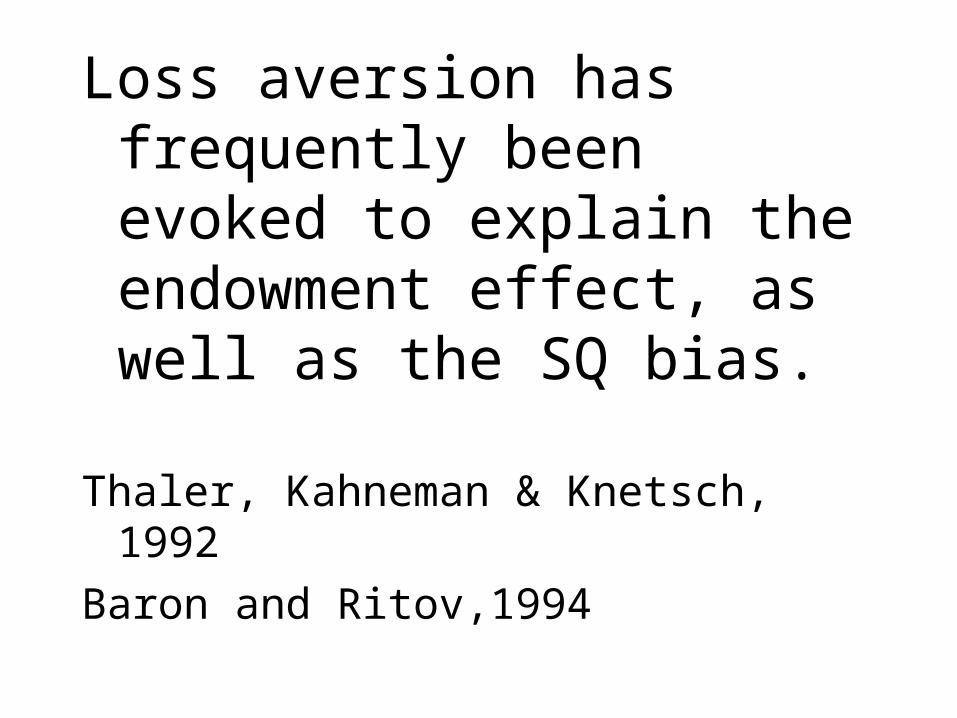
Loss aversion has frequently been evoked to explain the endowment effect, as well as the SQ bias.
Thaler, Kahneman & Knetsch, 1992
Baron and Ritov,1994

Researchers have also stated that ownership directly affects valuation.
Strahilevitz & Lowenstein, 1998
Thaler, Kahneman & Knetsch, 1992
But this has not been tested directly, it has just been inferred from the SQ’s advantage in choice.

How could valuation be affected by loss aversion? ?
When comparing two options, A and B, their comparative pros and cons may be considered. The comparison is reference dependent (i.e., it does not necessarily come out the same if carried out from a position of having A, or having B, or having neither).

E.g., when contemplating an exchange of A for B, the advantages of A that would be given up in the exchange are losses, because one already had them. In contrast, the advantages of B one acquires in the exchange constitute gains.
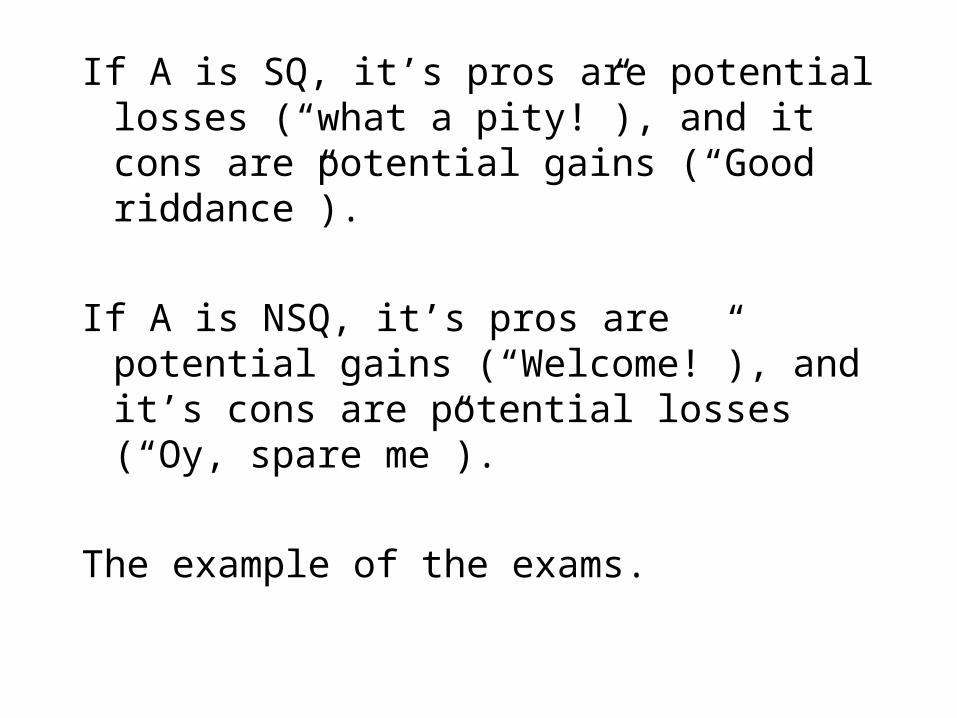
If A is SQ, it’s pros are potential losses (“what a pity!”), and it cons are potential gains (“Good riddance”).
If A is NSQ, it’s pros are potential gains (“Welcome!”), and it’s cons are potential losses (“Oy, spare me”).
The example of the exams.

Consequently, A's advantages loom larger when considered from the point of view of A versus from the point of view of B (since "losses loom larger than corresponding gains”).
Whereas the reverse is true for A’s disadvantages (or for B’s advantages).

So we should be able to see a status quo bias even without any choice or decision. Just being the SQ should enhance an option’s attractiveness.
We call this hypothesized effect: Status Quo Label Bias -- SQLB.
Status Quo Label Bias
Definition:
• The difference between the attractiveness of some alternative when it is the SQ and when it is not.

Some caveats:
SQLB does not predict that the status quo will always be liked more than an alternative; only that an alternative will be liked more when it is the status quo.

SQLB can occur even when the status quo is not preferred to some alternative; it merely contributes to a status quo bias.
SQLB is not a bias of choice or decision, it is bias in judgment (whereas the SQB is a bias of choice).

A double pan balance metaphor
In a perfect pan balance, the order in which objects are placed on the pans does not matter. But if the fulcrum is rusty, the second pan needs to overcome the weight on first pan and the friction. This is SQ bias in choice.
If adding a tiny sticker that says “SQ” lowers the pan which holds it – that is the SQLB.
The present study shows:
• There is an SQLB: policies are liked better when they are accompanied by the SQ label.
• The magnitude of the SQLB is predictable from that of loss aversion.
• SQLB occurs even when alternative mechanisms are obviated -- but not when loss aversion is blocked.

The study.To mimic the endowment effect studies,
we “endowed” Ss with policies at random.
How? By choosing issues on which we assumed (and verified) that Ss did not know the true state of affairs.

Participants and Procedure.
Respondents: About 900 undergraduate students from The Hebrew University (53% female; most 21 - 25 years old).
They were approached after lectures in their lecture rooms and asked to stay behind and answer a short questionnaire. In exchange, one respondent (determined by lottery), would win a monetary prize.
Prizes (in NIS) were about 2-times-N (rounded up), where N was the number of Ss remaining in the lecture hall. The average prize was about 100 NIS (~$25).
Students were assigned at random to questionnaires, and queried about a single policy issue.
The questionnaire rarely took more than 10 minutes to complete.

Tasks. The questionnaires concerned 2 alternative
proposals on some issue. Tasks, in order, were:
1. Think of and list the pros and cons of either the SQ policy or of its alternative (but not of both), and to rate the importance of each consideration they listed on a scale from 1 ("not so important") to 4 ("very important").
2. Which policy do you consider to be better?3. Rate each policy separately, on a scale of 1
("very bad") to 6 ("very good").
(On a later page) Ss were asked whether they knew which the prevailing policy
really was, and then debriefed.

No decision making was involved, either hypothetical or real.
Just evaluation .
Is there still a status quo label bias?
(In the following, A will denote the policy which, as SQ, Ss favored more).

Percent of respondents who prefer A (listed) to B, when:
A prevailsB prevails
Advertising alcohol (restricted)
Arts and crafts (7 vs. 5)
in school (5 vs. 3)
Affirmative action in HU (yes)
Feeding alley cats (allowed)
Prostitution (with restrictions)
Rescuing people (mandatory)
Rottweilers (mostly prohibited)
Child testimony, sex crimes (not like adults)
Statute of limitations, civil (only 2-tier)

Percent of respondents who prefer A (listed) to B, when:
A prevailsB prevails
Advertising alcohol (restricted)9255
Arts and crafts (7 vs. 5)
in school (5 vs. 3)
87
86
57
66
Affirmative action in HU (yes)8363
Feeding alley cats (allowed)8159
Prostitution (with restrictions)7156
Rescuing people (mandatory)7042
Rottweilers (mostly prohibited)6755
Child testimony, sex crimes (not like adults)
6262
Statute of limitations, civil (only 2-tier)5956

Percent of (almost 900) respondents who think policy A is better, when it is labeled SQ (left
bars), and when it is not (right bars).

The overall effect was 73% favoring the favorite policy when it was labeled SQ compared to 56% favoring it when it was not.
A similar picture emerges with the attractiveness ratings.
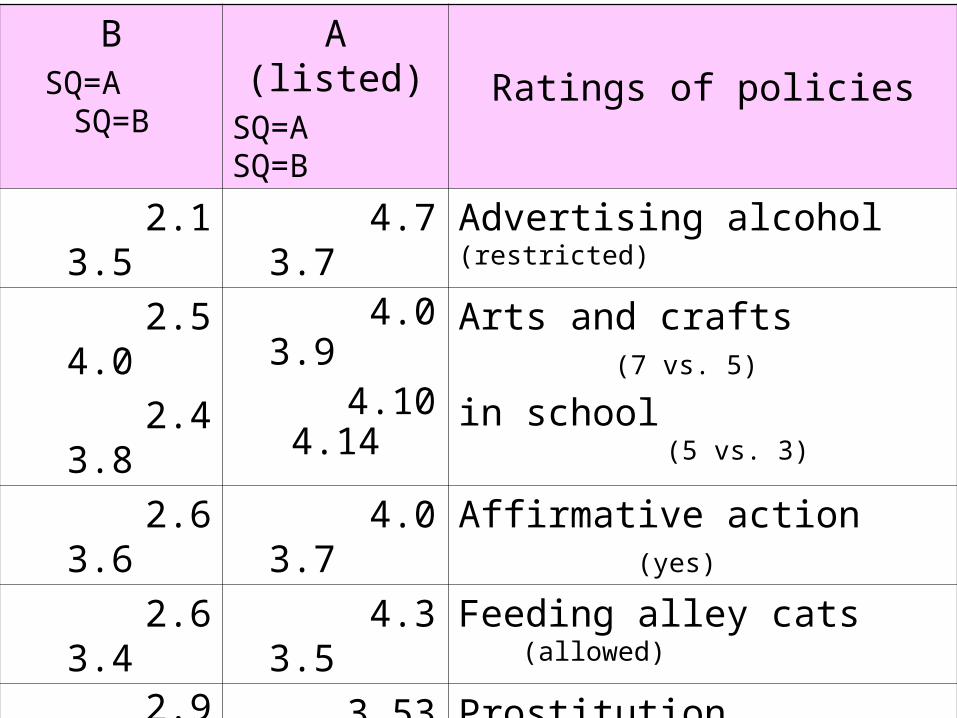
Ratings of policies
A (listed)SQ=A SQ=B
BSQ=A SQ=B
Advertising alcohol (restricted)4.7 3.72.1 3.5
Arts and crafts (7 vs. 5)
in school (5 vs. 3)
4.0 3.94.10 4.14
2.5 4.0
2.4 3.8
Affirmative action (yes)4.0 3.72.6 3.6
Feeding alley cats (allowed)4.3 3.52.6 3.4
Prostitution (with restrictions)3.53 3.512.9 3.4
Rescuing people (mandatory)4.1 3.33.3 3.9
Rottweilers (prohibited)3.7 3.83.1 3.0
Child testimony (not like adults)3.90 3.853.2 3.4
Statute of limitations (more uniform)3.7 3.83.3 3.4

Overall, there were 16 “successes” in 20 opportunities.
On average A policies rated 4 as SQ and only 3.7 as NQS; B polices rated 3.5 as SQ and only 2.9 as NSQ (both highly significant).
Are there alternative explanations?

The mere ownership effect.Beggan, 1992
“I like it because it is mine”.
System justification theoryJost and colleagues
“What is – is right”

These are real effects.
But do they explain the present effect?
We tested whether the actual template used triggers a presumption that SQ is better.

22 students were given the following question
Suppose you are told that: "The prevailing policy in Israel is such-and-such [sic]."
In addition you are told that: "A suggestion has been made to change it to so-and-so".
What does this formulation make you think?- The prevailing policy is the better one.
2- The proposed alternative is the better one. 20

For another 29 Israeli students, after the same opening sentences, the question was replaced by:
Which of the following inferences seems to you more reasonable?
- The prevailing policy is probably better, because those who decided in its favor must have had their reasons. 3
The prevailing policy is probably not so good, because people are considering replacing it.
26

33 others were asked instead :
-Which of the following inferences seems to you more reasonable?
The prevailing policy is probably good, because those who decided in its favor must have had their reasons, which can be trusted. (14)
The prevailing policy is probably not so good, because those who decided in its favor must have had their reasons, which cannot be trusted. (19)
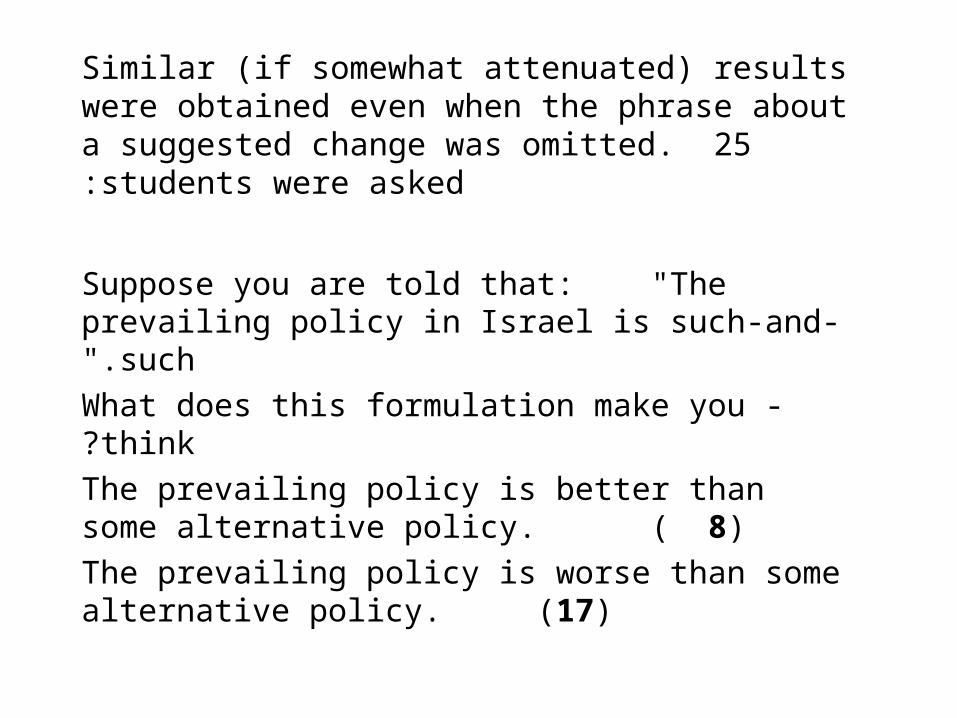
Similar (if somewhat attenuated) results were obtained even when the phrase about a suggested change was omitted. 25 students were asked:
Suppose you are told that: "The prevailing policy in Israel is such-and-such".
- What does this formulation make you think?
The prevailing policy is better than some alternative policy. ( 8)
The prevailing policy is worse than some alternative policy. (17)
Finally, 109 Ss were told, in the very same words as in the study described: "A certain policy prevails in Israel regarding the [advertising of alcohol on TV]. A suggestion has been made to introduce some changes in it".
In addition to not saying who raised the challenge, this formulation does not say what the prevailing policy is, nor what the proposed changes are. Since one can hardly list the pros and cons of a policy that is not specified, no such list was requested.

Respondents were asked to state which policy they judged to be better (task 2), and to rate each of the 2 policies on a scale of 1 to 6, as before (task 3).
This was done with the 3 issues that showed the largest SQLB (alcohol, arts & crafts, mandatory rescue), and for a 4th, “generic”, issue.

PolicyNumber choosin
g SQ
Number choosing NSQ
Rating of SQ
Rating of NSQ
N
Advertising alcohol
19113.83.430
Arts & crafts in school
13153.83.928
Rescuing people in peril
14143.83.628
"Such-and-such "11123.53.723
Total52% 48%3.73.6109

The same was found even with no mention of a challenge.
PolicyNumber choosing
SQ
Number choosing
NSQ
Rating of SQ
Rating of NSQ
N
Advertising alcohol18153.83.733
Arts & crafts in school
11203.84.228
Rescuing people in peril
21143.83.628
"Such-and-such " 9253.24.336
Total44% 56%3.74.0109

We can reject “presumption in favor of the SQ”.
There either is the reverse presumption – or none.
This, in spite of preserving all the social cues.

Why were results different in the actual study (as shown in Tables 1 and 2)?
Because the non-specific template provided no “grist for the loss-aversion mill”.
And the SQLB as we hypothesized it results from loss aversion -- so may not appear where there is no loss aversion.

A policy’s attractiveness is related to the balance of its pros and cons.
The policies’ attractiveness ratings were positively correlated with their net (weighted) balance of pros and cons.
Pearson’s r=0.65, when policies were the units.
Pearson’s r=0.52, when participants were the units.
• Both highly significant

Recall:
Losses are pros of the SQ,
and cons of the NSQ
Gains are cons of the SQ,
and pros of the NSQ

We weighted each listed pro or con by the importance weight given it by the participant, and calculated losses and gains as in the previous slide.

The correlation between the magnitude of the SQLB and that of loss aversion was 0.59 for the popularity measure, and 0.72 for the attractiveness measure.
The magnitude of the SQLB can be predicted from the magnitude of loss aversion.

Thank you for your attention!