Embed Size (px)
Citation preview

1
EXECUTIVE COMPENSATION, FIRM PERFORMANCE AND RISK IN THE FINANCIAL CRISIS PERIOD 2006-2009
Dr. Chandra Shekhar BhatnagarSenior LecturerDepartment of Management StudiesThe University of the West IndiesSt [email protected]
Mr. Quinn AR TrimmPost Graduate StudentThe University of the West Indies, St. [email protected]/655-4919#38 Railway Road, Princes Town
Mr. Surendra ArjoonDepartment of Management StudiesThe University of the West IndiesSt [email protected]

2
EXECUTIVE COMPENSATION, FIRM PERFORMANCE AND RISK IN THE FINANCIAL CRISIS PERIOD 2006-2009
Chandra Shekhar BhatnagarQuinn AR Trimm
ABSTRACT
We explore the Agency and Managerial Power theories to explain the relationship among the various components of executive compensation, firm performance and unsystematic risk in the US financial sector. Institutions in the financial sector listed on the NASDAQ that have been in existence from the pre-financial crisis period January 03, 2006 to the post-financial crisis period December 27 2009 are examined. We find that the Agency theory does not fully explain the behavior of executives and their risk appetite. Managerial power theory fares better in this regard, as managers are focused mostly on their base salary. The data analysis shows that stock options are not significantly influenced by unsystematic risk; instead the base salary of executives has been significantly influenced by market risk and firm performance.
Keywords: Executive compensation, firm performance, market risk, unsystematic risk, Agency Theory, Managerial Theory

3
I. INTRODUCTION
Emerging from the economic debacle of the 2007-2008 financial crisis, the focus
placed on executive compensation disclosed that the US CEO/worker pay gap
stood at 301-1 in 2003, as compared to only 42-1 in 1982 (Matsumura & Shin,
2005). With executive compensation becoming synonymous with the ‘agency
problem’ (Quinn, 1999), many scholars have concluded that equity based
incentives like stock options and restricted stock can reduce agency costs by
aligning CEO risk preferences and shareholders’ interests (Core et al. 2003).
Furthermore, the application of performance-linked remuneration has been
viewed as a tool for aligning the interests of directors and shareholders, actively
encouraged by institutional investors and the Securities and Exchange
Commission (SEC) in the USA (Dalton et al, 2007).
The uncertainty surrounding the Agency Theory, executive compensation,
unsystematic risk, firm accounting performance motivates this study and attempts
to explore the underlying relationship between them, if any.
II. EXECUTIVE COMPENSATION, FIRM PERFORMANCE AND RISK:
A RECAP
The majority of empirical studies concerning executive compensation hinges on
the Agency Theory. In this model incentive alignment as a control mechanism is
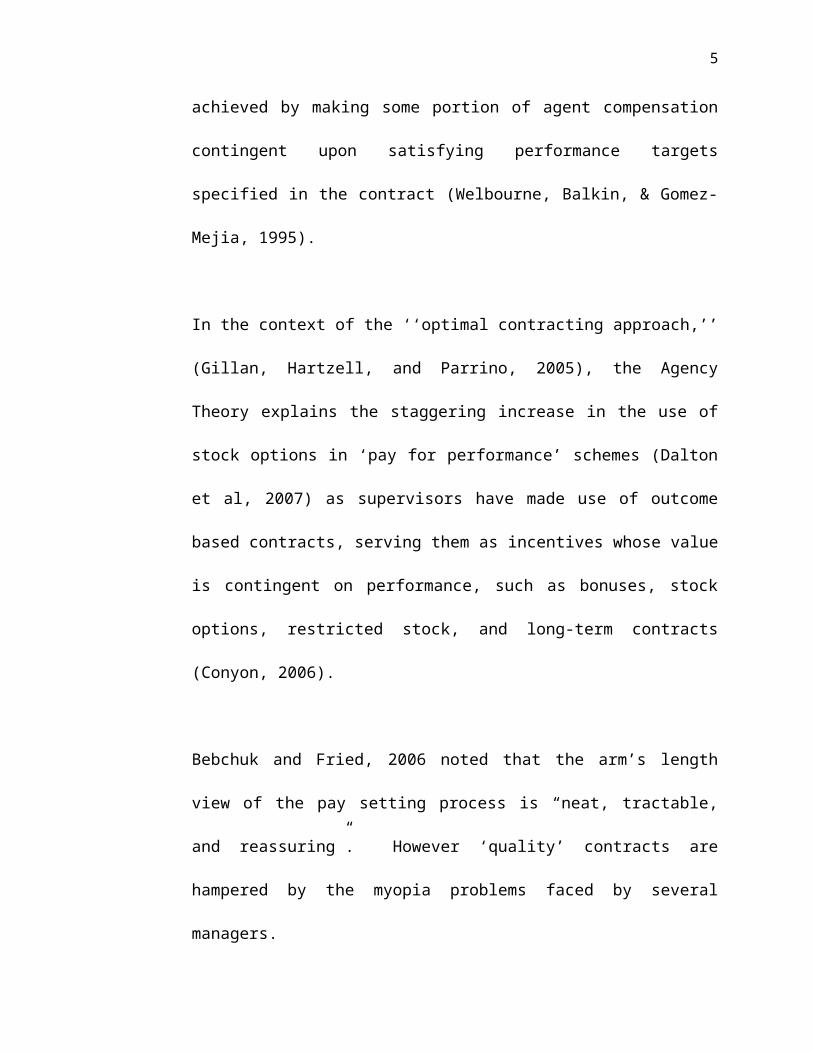
achieved by making some portion of agent compensation contingent upon

4
satisfying performance targets specified in the contract (Welbourne, Balkin, &
Gomez- Mejia, 1995).
In the context of the ‘‘optimal contracting approach,’’ (Gillan, Hartzell, and
Parrino, 2005), the Agency Theory explains the staggering increase in the use of
stock options in ‘pay for performance’ schemes (Dalton et al, 2007) as
supervisors have made use of outcome based contracts, serving them as incentives
whose value is contingent on performance, such as bonuses, stock options,
restricted stock, and long-term contracts (Conyon, 2006).
Bebchuk and Fried, 2006 noted that the arm’s length view of the pay setting
process is “neat, tractable, and reassuring”. However ‘quality’ contracts are
hampered by the myopia problems faced by several managers.
The Managerial Power Theory presents an alternative approach to optimal
contracting. It postulates that the CEO has a good deal of control over the board,
and this control includes the power to determine a major portion of his own
compensation. In effect, this allows managers to focus a larger percentage of
their compensation package away from performance based pay and toward more
stable forms of pay, such as base pay (Bebchuk and Fried, 2004; Grabke-Rundell
and Gomez-Mejia, 2002).
5
Finkelstein (1992) attributes this level of managerial power to a manager’s
prestige power. He maintains that prestige power is related to a manager’s ability
to absorb uncertainty from the institutional environment, and emphasizes the role
of outside directorships and education as key components of prestige. These
components of prestige, allow managers the appearance of achieving the
company’s long term goals, and high performance in the financial markets, thus
adding to their power.
Murphy, 1999 stated that most executive pay packages contain four basic
components, namely, base salary, annual bonus, stock options, and long-term
incentive plans (including restricted stock plans and multi-year accounting-based
performance plans).
According to Demsetz & Saidenberg (1999), CEOs tend to receive a smaller
fraction of their compensation as base pay and a larger fraction of same as annual
bonus, long-term compensation, and options. However, Romer (2006) revealed
that from 2001-2005 base pay and bonus increased their share in total
compensation.
A firm’s performance measures are usually either market-based or accounting-
based (Barro & Barro, 1990). Typical accounting measures include return on
assets, return on equity, and net income. Murphy (1999) also highlighted that
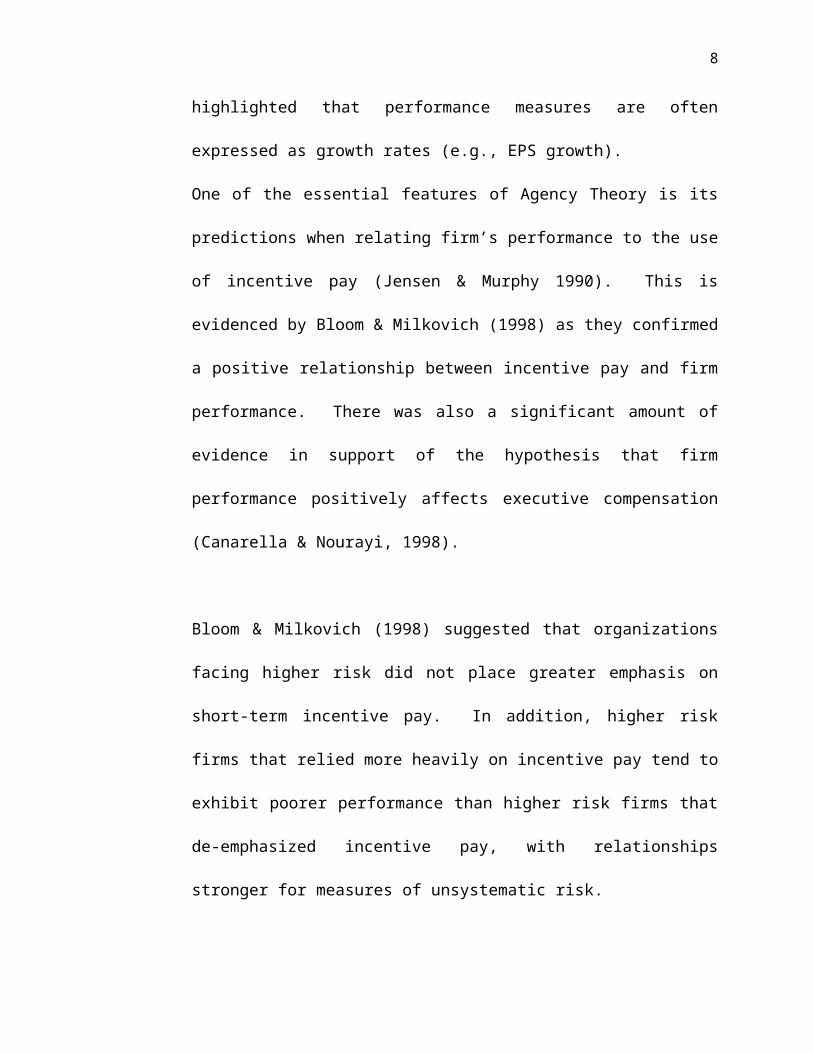
performance measures are often expressed as growth rates (e.g., EPS growth).

6
One of the essential features of Agency Theory is its predictions when relating
firm’s performance to the use of incentive pay (Jensen & Murphy 1990). This is
evidenced by Bloom & Milkovich (1998) as they confirmed a positive
relationship between incentive pay and firm performance. There was also a
significant amount of evidence in support of the hypothesis that firm performance
positively affects executive compensation (Canarella & Nourayi, 1998).
Bloom & Milkovich (1998) suggested that organizations facing higher risk did
not place greater emphasis on short-term incentive pay. In addition, higher risk
firms that relied more heavily on incentive pay tend to exhibit poorer performance
than higher risk firms that de-emphasized incentive pay, with relationships
stronger for measures of unsystematic risk.
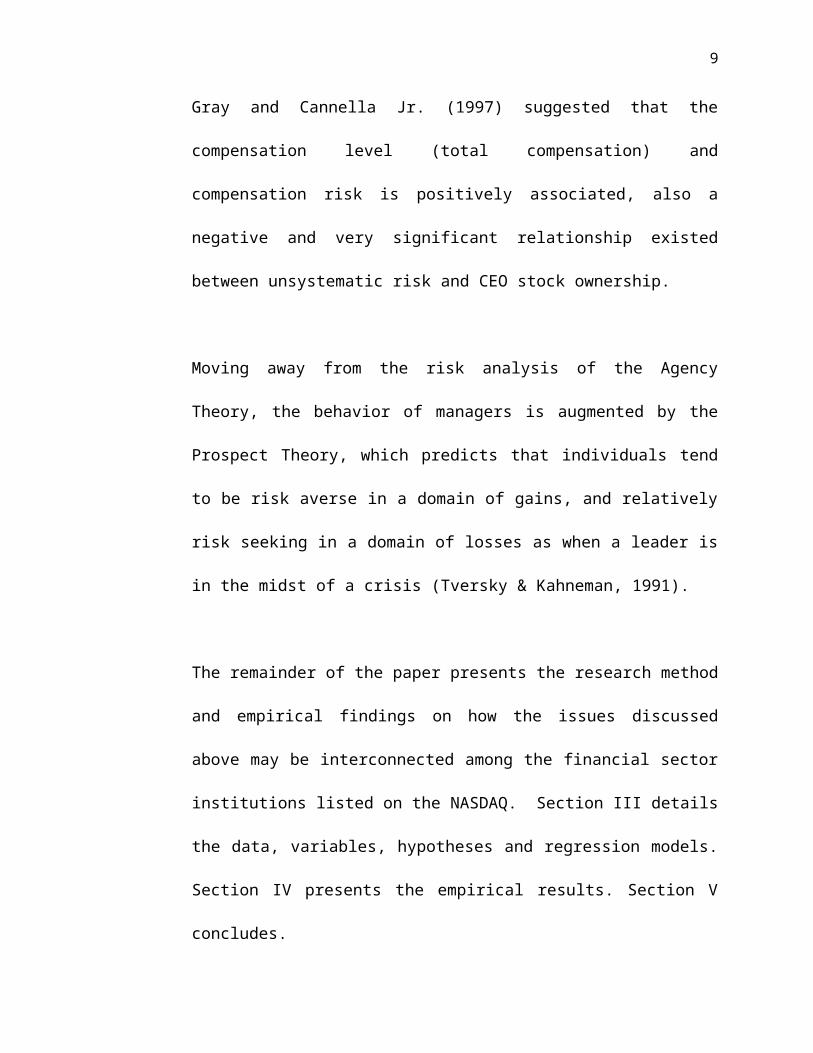
Gray and Cannella Jr. (1997) suggested that the compensation level (total
compensation) and compensation risk is positively associated, also a negative and
very significant relationship existed between unsystematic risk and CEO stock
ownership.
Moving away from the risk analysis of the Agency Theory, the behavior of
managers is augmented by the Prospect Theory, which predicts that individuals
tend to be risk averse in a domain of gains, and relatively risk seeking in a domain
of losses as when a leader is in the midst of a crisis (Tversky & Kahneman, 1991).

7
The remainder of the paper presents the research method and empirical findings
on how the issues discussed above may be interconnected among the financial
sector institutions listed on the NASDAQ. Section III details the data, variables,
hypotheses and regression models. Section IV presents the empirical results.
Section V concludes.
III. RESEARCH METHOD
A cross sectional study which relied on several data sources for secondary data
collection was employed to examine the effect of firm performance and total risk
on executive compensation. These included Google Finance (BA Stock),
NASDAQ Index and the Securities and Exchange Commission website (SEC).
The various stock price data were collected and analyzed to derive the variance of
stock and its beta (unsystematic risk).
Financial Institution’s executive compensation data from the Securities and
Exchange Commission website, specifically, the various companies’ 10K filings,
was broken into its component parts of base salary, annual bonus, long term
compensation and the value of options granted. Other firm specific and
accounting data (used in deriving financial ratios) were obtained from the SEC
website, specifically, the various companies’ Def 14A filings.
8
The periods under review were the pre-financial crisis period January 03, 2006 to
December 29, 2006, the financial crisis period January 08, 2007 to December 28,
2007, January 08, 2008 to December 29, 2008 and the post-financial crisis period
January 05, 2009 to December 27, 2009. A systematic random sample is taken to
gain a total of 120 Financial Institutions.
Multiple regression analysis (Simultaneous Method) was used to analyze the
relationship between the dependent variable (executive compensation) and
independent variables (firm accounting performance, market and unsystematic
risk). The data was duly treated using the first difference transformation to
achieve normality.
To examine the relationship among the firm performance, total risk, total
executive compensation and its constituent components, and the potency of the
relationship among these variables in financial institutions, the model specified
was to observe whether a relatively high level of firm performance should
accompany a firm’s executive compensation package. Thus, the first hypothesis
was proposed:
Hypothesis One:
The null Hypothesis: the regression coefficients of ROA, ROE, EPS and PE are
equal to zero.
Ho = ROA, ROE, EPS and PE = 0
9
The alternate Hypothesis: the regression coefficients of ROA, ROE, EPS and PE
are not equal to zero.
H1 = ROA, ROE, EPS and PE 0
To examine whether a relatively high level of unsystematic risk should
accompany the firm’s executive compensation package, the second hypothesis
was as follows:
Hypothesis Two:
The null Hypothesis: the regression coefficients of market risk and unsystematic
risk are equal to zero.
Ho: MKTR and UNSYSR = 0
The alternate Hypothesis: the regression coefficients of market risk and
unsystematic risk are not equal to zero.
H1: MKTR and UNSYSR 0
This hypothesis was tested using the same model that tested the first hypothesis.
Examining the effect of market risk and unsystematic risk on the various
components of executive compensation would provide supplementary findings
concerning the potency of the relationship between each component. Thus, the
relationship among the factors of executive compensation and the constituent
components of executive compensation was examined in each time period.

10
Regression Models
In order to test the hypotheses the parsimonious regression model was:
Compensation= a + 1(MKTR) + 2(UNSYSR) + 3(ROA) + 4 (ROE) + 5(EPS)
+ 6 (PE) + εi (1)
In this model, the independent variables MKTR, UNSYSR, ROA, ROE, EPS and
PE were represented by market risk, unsystematic risk, return on assets, return on
equity, earnings per share and price to earnings, respectively. The dependent
variable was total compensation.
In addition the components of executive compensation (base pay, annual bonus,
long-term compensation and equity based incentives/stock options) were also
analyzed as the dependent variables, listed in the models below.
Base Pay= a + 1(MKTR) + 2(UNSYSR) + 3(ROA) + 4 (ROE) + 5(EPS) + 6
(PE) + εi (1.a)
Annual Bonus= a + 1(MKTR) + 2(UNSYSR) + 3(ROA) + 4 (ROE) + 5(EPS)
+ 6 (PE) + εi (1.b)
Long term Compensation= a + 1(MKTR) + 2(UNSYSR) + 3(ROA) + 4 (ROE)
+ 5(EPS) + 6 (PE) + εi (1.c)

11
Stock Options= a + 1(MKTR) + 2(UNSYSR) + 3(ROA) + 4 (ROE) + 5(EPS)
+ 6 (PE) + εi (1.d)
Variables
Murphy (1999) outlined the components of executive compensation, and as such a
similar definition for executive compensation was followed. Thus the dependent
variable total executive compensation and its components (base pay, annual
bonus, long-term compensation and equity based incentives/stock options) were
analyzed.
The first independent variable was firm performance. Taking account of Murphy
(1985), that the wealth of managers is implicitly tied to firm performance and that
accounting based profit measures are significantly related to compensation
measures such as return on assets (ROA), return on equity (ROE), earning per
share (EPS) and price to earnings (PE) were used.
The second independent variable was firm risk. Considering the Market Model,
risk was represented by market risk (MKTR) and unsystematic risk (UNSYSR).
IV. EMPIRICAL RESULTS
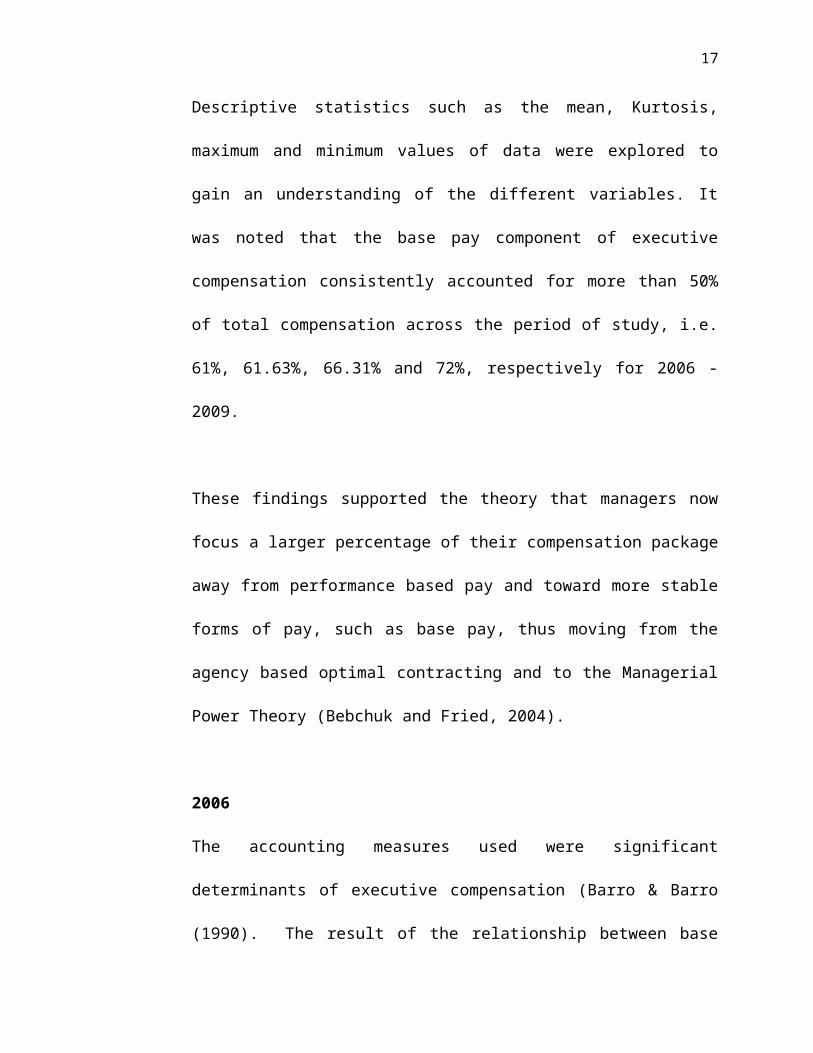
Descriptive statistics such as the mean, Kurtosis, maximum and minimum values
of data were explored to gain an understanding of the different variables. It was

12
noted that the base pay component of executive compensation consistently
accounted for more than 50% of total compensation across the period of study, i.e.
61%, 61.63%, 66.31% and 72%, respectively for 2006 - 2009.
These findings supported the theory that managers now focus a larger percentage
of their compensation package away from performance based pay and toward
more stable forms of pay, such as base pay, thus moving from the agency based
optimal contracting and to the Managerial Power Theory (Bebchuk and Fried,
2004).
2006
The accounting measures used were significant determinants of executive
compensation (Barro & Barro (1990). The result of the relationship between base
pay and firm performance (EPS) was highly significant as supported by Bloom &
Milkovich (1998). EPS was the only significant variable for compensation and its
components. These findings were supported by Murphy (1985) which stated the
wealth of managers is implicitly tied to firm performance and that accounting
based profit measures were significantly related to compensation.
In 2006 market risk was very significant (0.001), when bonus pay was the
dependent variable. These findings were supported by Bloom & Milkovich
(1998) as organizations facing higher risk did not place greater emphasis on short-

13
term incentive pay and thus move away from the conventions of Agency Theory
and its perceived risk attitudes of managers.
Unsystematic risk was very significant (0.018) with base pay as the dependent
variable (Bebchuk and Fried, 2004). However, it was noted that its beta value
was negative. When managers were expected to perform based on their prestige
and expert power in exchange for less pay at risk (greater base pay) they were
also expected to sufficiently protecting the interest of the shareholders (Appendix
1).
2007
While base pay continued its trend from the prior year, bonus salary, stock
options and base pay appeared to be influenced by firm performance (ROA &
EPS, EPS and ROE & EPS respectively), thus Hypothesis One (2007) was
supported by Bloom & Milkovich (1998) as they confirmed a positive
relationship between incentive pay and firm performance.
In 2007 market risk was very significant (0.001) when base pay was the
dependent variable. The results suggested that executives who accept more risk
in their compensation arrangements tend to be more highly compensated than
those executives with less risky arrangements (Gray and Cannella Jr., 1997). The
overflow of the 2006 bullish market can be attributed to these findings, as pay for
performance was heavily in use at the time (Appendix 2).

14
2008
The force of the financial crisis caused a severe downturn in the economy during
2008 which resulted in a collapse of the financial markets. This evident collapse
explained the findings that executive compensation was not determined by firm
performance for the period.
In 2008 market risk is significant for the dependent variables total compensation,
base pay, bonus and stock (0.000, 0.009, 0.000 and 0.000 respectively), however
unsystematic risk was not significant for any of the dependent variables. These
findings were supported by Tversky and Kahneman (1991). In light of the
spiraling economy, managers did not anticipate positive gains, rather they
anticipated losses to wealth, and as such they entered greater strategic risk on
behalf of the firm (Appendix 3).
2009
With the effects of the financial crisis wearing thin and the path set to economic
recovery by the US Government, both bonus salary and stock options continued
to be influenced by firm performance (ROA, ROE). Total compensation also
adopted this trend, influenced by firm performance (ROA) (Appendix 4).
These findings were similar to the results of 2007 and were therefore supported
by Conyon, 2006; Jensen & Murphy, 1990; Bloom & Milkovich, 1998 and Gray
and Cannella Jr., 1997.

15
V. CONCLUSIONS
In the bullish market for the year 2006, the results suggested that although stock
options were influenced by EPS, they were not influenced by market or
unsystematic risk in the pre-financial crisis period 2006; instead the base salary of
executives was influenced by firm performance (ROE, EPS and PE), market and
unsystematic risk. This showed that Agency Theory did not fully explain the
behavior of executives and their risk appetite. Managerial Power Theory
explained their behavior in 2006 as managers are focused mostly on their base
salary.
In the initial crisis period 2007, bonus salary was influenced by EPS and ROA.
While base pay was influenced by market risk, both base pay and bonus salary
were influenced by the performance measures ROA, ROE and EPS. These
findings again lend their support to the Managerial Power Theory.
In 2008 when the full effect of the crisis was felt, total compensation and its
components examined (except long term compensation) were significantly
influenced by market risk. Due to the downturn of the economy and seeming
economic failure, none of the tested performance indicators influenced any form
of compensation for the year 2008.
Finally, in 2009 with the US Government initiating the walk to economic and
market recovery, both forms of risk were indentified as determinants of executive

16
compensation, while only the performance indicators ROA and ROE influence
total compensation, bonus and stock. This was the only time period examined in
the study that evidenced the extensive use of performance based remuneration.
Managers are contracted based on the perceived value they can add to a company.
This is reflected in their base salary – their worth at face value. Upon evidence of
additional efforts (increased firm accounting performance) they are endowed with
bonuses, stock options and other long term benefits. However, for the years 2006
and 2007 this study does not have the evidence to fully support the dictum of the
Agency Theory. Managers did nothing to overtly jeopardize that which mattered
most – their base salary. With the bullish market of 2007 managers did not
appear to be “risk-seeking” and their base salaries increased. In 2008 however,
the financial crisis took full effect. This caused the level of executive
compensation to decline, and in 2009 managers tried to rebuild the market by
taking more risk.
Agency Theory simply states that the agent will not see eye to eye with the
principals so agents will do what they can (much to the disadvantage of the
principals) to get their executive compensation, taking on higher levels of
unsystematic risk to achieve higher ‘in the money’ stock options and working in
the short-term interest of the firm to boost the firm’s accounting performance
(EPS) moving past the firm’s benchmarked performance indicators and gaining a
profound annual bonus as they exceeded expectations.
17
This study seems to lend support to the otherwise proposed Managerial Power
Theory in association with executive compensation. These findings show that
unsystematic risk and firm accounting performance have minimal effect on the
level of executive compensation in 2007 and 2008. The Managerial Power
Theory points the way for the apparent deviation from the Agency Theory in this
study. According to the Managerial Power Theory, managers are given a
substantial amount of power allowing them to set their executive compensation
packages as they are determined by public perceptions, or ‘industry averages’.

18
REFERENCES
Bebchuk, Lucian A., and Jesse M. Fried. 2004. Pay without Performance: The Unfulfilled Promise of Executive Compensation. Cambridge and London: Harvard University Press.
Bebchuk, Lucian A., and Jesse M. Fried. 2006. Pay without Performance: Overview of the issues. Academy of Management Perspectives 20 (1):5-24.
Barro, J. and R. Barro. 1990. Pay, Performance and Turnover of Bank CEOs. Journal of Labor Economics, 448-481.
Bloom, Matt and George T. Milkovich. 1998. Relationships Among Risk, Incentive Pay, And Organizational Performance. Academy of Management Journal 41 (3):283-297.
Canarella, Giorgio and Mahmoud M. Nourayi. 1998. Executive compensation and firm performance: adjustment dynamics, nonlinearity and asymmetry. Managerial and Decision Economics 29 (4):293-315.
Conyon, Martin J. 2006. Executive Compensation and Incentives. Academy of Management Perspectives 20 (1):25-44.
Core, J. E., W. R. Guay, & D. F. Larcker. 2003. Executive equity compensation and incentives: A survey. Economic Policy Review 9 (1):27-50.
Dalton, Dan R., Michael A. Hitt, S. Trevis Certo and Catherine M Dalton. 2007. 1. The Fundamental Agency Problem and Its Mitigation: Independence, Equity, and the Market for Corporate Control. Academy of Management Annals, no.1:1-64.
Demsetz, Rebecca S., and Marc R Saidenberg. 1999. Looking Beyond The CEO: Executive Compensation At Banks. Federal Reserve Bank of New York,Staff Reports: 68.
Finkelstein, S. 1992. Power in top management teams: Dimensions. Measurement, and Validation. Academy of Management Journal, no.35:505-538.

19
Gillan, S. L., J. C., Hartzell, & R. Parrino. 2005. “Explicit vs. Implicit Contracts:Evidence from CEO Employment Agreements.” Working Paper, University ofTexas at Austin.
Grabke-Rundell, Arden, and Luis R. Gomez-Mejia. 2002. Power as a determinant of executive compensation. Human Resource Management Review 12 (1):3, 21.
Gray, Samuel and Albert Cannella Jr. 1997. The Role of Risk in Executive Compensation. Journal of Management 23 (4):517-540.
Jensen, Michael C., and Kevin J. Murphy. 1990. Performance Pay and Top-Management Incentives. Journal of Political Economy, 98 (2):225–64.
Matsumura, Ella and Jae Shin. 2005. Corporate Governance Reform and CEO Compensation: Intended and Unintended Consequences. Journal of Business Ethics 62 (2):101-113.
Murphy, K.J. 1985. Corporate Performance and Managerial Remuneration: An Empirical Analysis. Journal of Accounting and Economics 7 (1-3):11-42.
Murphy, Kevin J. 1999. Executive Compensation. Handbook of labor economics 3B:2485-2563, Handbooks in Economics 5. Amsterdam; New York and Oxford: Elsevier Science, North-Holland.
Quinn, Michael. 1999. The Unchangeable – Director and Executive Remuneration Disclosure in Australia. 10 Austr. J. Corp. L. 2, 4.
Romer, David A. 2006. The determinants of executive compensation in the commercial banking industry Degree of Doctor in Business Administration, Dissertation, Louisiana Tech University.
Tversky, Amos; Kahneman, Daniel. 1991. Loss Aversion in Riskless Choice: AReference-Dependent Model. Quarterly Journal of Economics 106 (4):1039-61.
Welbourne, T., Balkin, D., & Gomez-Mejia, L. 1995. Gainsharing and mutual monitoring. Academy of Management Journal, no.38:689-724.

20
APPENDICES
PRE-FINANCIAL CRISIS PERIOD JANUARY 03, 2006 TO DECEMBER 29, 2006
ModelStandardized Coefficients
t Sig.BetaTOTAL COMPENSATION (Constant) 0.038 0.97
EPS 0.403 4.003 0.000BASE PAY (Constant) 0.158 0.875
ROE -0.415 -3.139 0.002
EPS 0.536 6.098 0.000PE -0.242 -2.824 0.006
MKTR 0.275 3.329 0.001
UNSYSR -0.192 -2.41 0.018BONUS PAY (Constant) 0.003 0.997
EPS 0.254 2.532 0.013
MKTR 0.216 2.288 0.024LONG TERM COMPENSATION (Constant) 0.065 0.949STOCK (Constant) 0.006 0.995
EPS 0.454 4.477 0.000Appendix 1
Appendix 2

21
THE FINANCIAL CRISIS PERIOD JANUARY 08, 2007 TO DECEMBER 28, 2007
ModelStandardized Coefficients
t Sig.BetaTOTAL COMPENSATION
(Constant) 0.03 0.976
EPS 0.739 4.926 0.000BASE PAY (Constant) 0.107 0.915
ROE 0.699 2.02 0.046
EPS 0.546 4.115 0.000
MKTR 0.263 3.307 0.001BONUS (Constant) -8.98E-04 0.999
ROA 0.975 2.567 0.012
EPS 0.847 5.761 8.12E-08LONG TERM COMPENSATION (Constant) 0.096 0.923STOCK
(Constant) 0.005 0.996
EPS 0.712 4.634 0.000
Appendix 3
22
THE FINANCIAL CRISIS PERIOD JANUARY 08, 2008 TO DECEMBER 29, 2008
Model
Standardized Coefficients
t Sig.BetaTOTAL COMPENSATION
(Constant) 0.04 0.968
MKTR 0.405 4.648 0.000BASE PAY
(Constant) 0.078 0.938
MKTR 0.243 2.667 0.009BONUS
(Constant) 0.012 0.991
MKTR 0.336 3.708 0.000LONG TERM COMPENSATION
(Constant) 0.008 0.994STOCK
(Constant) 0.026 0.98
MKTR 0.399 4.567 0.000
Appendix 4

23
THE POST-FINANCIAL CRISIS PERIOD JANUARY 05, 2009 TO DECEMBER 27, 2009.
ModelStandardized Coefficients
t Sig.BetaTOTAL COMPENSATION (Constant) -8.74E-01 0.384
ROA 0.787 3.059 0.003
MKTR 0.304 3.262 0.002BASE PAY (Constant) -1.327 0.188
MKTR 0.418 4.569 0.000BONUS (Constant) -0.109 0.914
ROA 0.646 2.31 0.023
ROE -0.537 -2.238 0.028
UNSYSR -0.269 -2.148 0.034LONG TERM COMPENSATION (Constant) -0.222 0.825
MKTR 0.296 2.873 0.005STOCK (Constant) -0.787 0.433
ROA 1.13 4.489 0.000
ROE -0.968 -4.483 0.000UNSYSR -0.31 -2.751 0.007