Embed Size (px)
Citation preview
Stay Vane and Wicket Gate Relationship Study
US Army Corpsof Engineers
Prepared By:
US Army Corps of Engineers Portland District
Hydroelectric Design Center
January 19, 2005
HYDR
OEL
ECTR
IC
DESI
GN
CEN
TER
PR
EP
AR
ED
BY
Lower Granite Dam Stay Vane and Wicket Gate Improvement Study EXECUTIVE SUMMARY
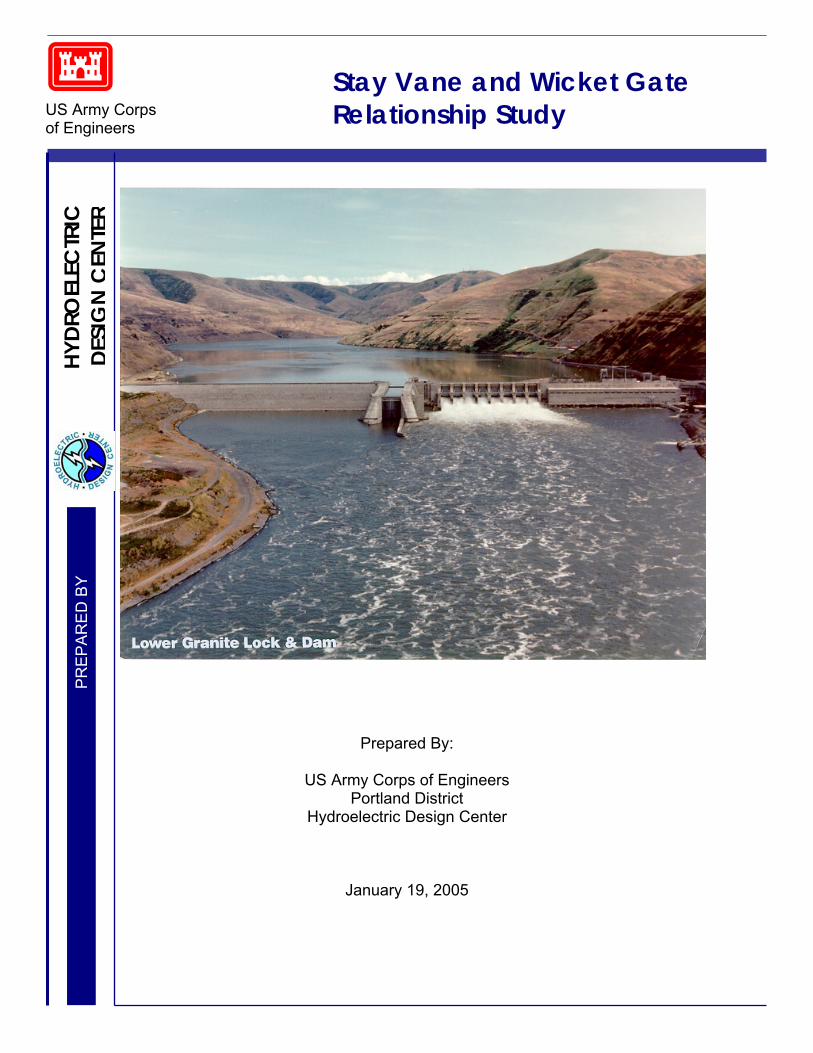
This report evaluates potential environmental and performance gains that can be achieved in a Kaplan turbine through non-structural modifications to stay vane and wicket gate assemblies. This summary is based primarily on data and conclusions drawn from models and studies of Lower Granite Dam. Prior hydraulic studies of stay vane and wicket gates on turbine models of McNary, Lower Granite, and Bonneville power houses have shown that the arrangement of the stay vanes and wicket gates can have significant effects on the environmental properties and performance of a hydro-generating unit. In order to better understand the correlation between the hydraulic shapes of the stay vanes and wicket gates and both environmental and turbine performance, a computational fluid dynamics (CFD) model was created. VA Tech (turbine manufacturer) was contracted to create a prototype-scale computer model of a Lower Granite turbine unit. VA Tech and the TSP (Turbine Survival Program) design team examined CFD models of the original stay vane wicket gate combination and three concept designs. All three designs involved slight to moderate profile changes to the basic shape of the existing stay vane. All three designs utilized multiple stay vane profiles to better match the different flow characteristics of the different sections of the stay ring. The design selected from these tests, called variant 2, estimated a 51% reduction in local hydraulic losses through the stay vane wicket gate region with minimal structural changes to the existing stay vane. The CFD model also predicted a performance improvement from rotating the wicket gate location 1.08° clockwise from existing. In order to further increase the environmental performance, the TSP design team requested that the design recommended by the CFD study, Variant 2, be modified to minimize the gap between the stay vanes and the wicket gates. The gap between the stay vane and wicket gate is a location of potentially harmful acceleration and pressure changes. VA Tech created a stay vane, Variant 2A, which was the same as the optimal CFD design on the leading edge. However the trailing edge had an extension to decrease the gap flow between the stay vane and wicket gate. VA Tech performed model tests of the stay vane Variant 2A and the Original design. The existing Lower Granite unit 4 model was utilized for these performance tests. The performance testing of Variant 2A with the original wicket gate arrangement predicted a turbine efficiency improvement in the range of 0.5 to 0.7%. With Variant 2A defined and model tested, US Army Corps of Engineers Research and Development Center (ERDC) proceeded to perform environmental tests.
CENWP- HDC-P i
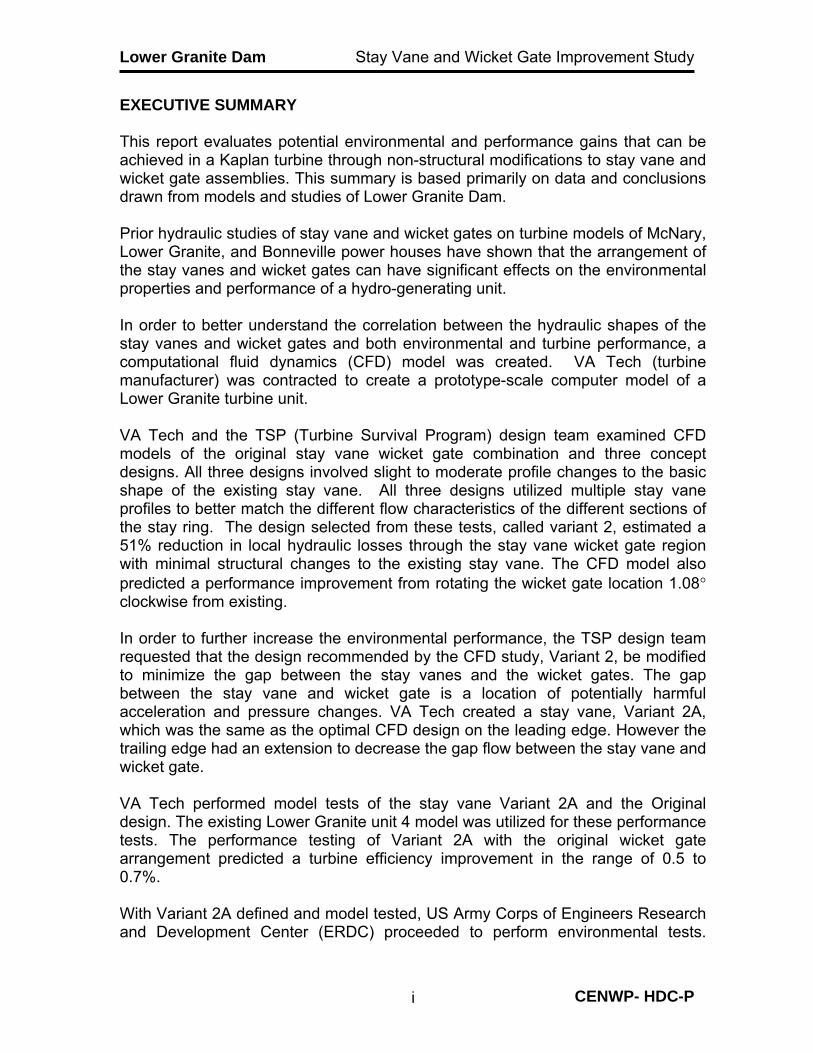
Lower Granite Dam Stay Vane and Wicket Gate Improvement Study ERDC used neutrally buoyant beads and cameras to determine environmental characteristics of the original stay vane wicket gate system, Variant 2, and Variant 2A. ERDC used bead impact and abrupt directional changes (shear events) in the bead path as parameters to evaluate potential fish injury events. From these tests, Variant 2A was predicted to be the option with the best potential environmental performance. These investigations show minor modifications to the stay vane wicket gate system resulted in estimated operation efficiency increases of 0.5 to 0.7 percent for Lower Granite Kaplan turbines. Minor changes in the profile and configuration of the stay vane and wicket gate appear to result in reduced environmental impact and improved quality of flow for fish passage. The relatively low cost of the proposed modification to the stay vanes and the large environmental and hydraulic performance increases may make this a positive addition to any rehabilitation. We expect that similar gains may be found at all the Lower Snake and Columbia River projects. Based on these investigations, this study recommends:
1. A proof of concept at Lower Granite Dam to establish predicted improvements for the existing turbine and to further refine the stay vane wicket gate designs for fish passage.
2. Consideration of the stay vane wicket gate systems in any future turbine rehabilitation studies.
CENWP- HDC-P ii

Lower Granite Dam Stay Vane and Wicket Gate Improvement Study
DESIGN TEAM MEMBERS Name Office Symbol Title Function Phone George Medina CENWP-PM-F Project Mgr. Project Mgt. 503-808-4355 Rod Wittinger CENWP-HDC-P Mech. Engr. P.I. 503-808-4280 Robert Davidson CEERD-HC-N Hyd. Engr P.I. 601-634-3052 Rock Peters CENWP-PM-E Biologist Support 503-808-4777 Martin Ahmann CENWW-ED-H-D Hyd. Engr. Support 509-527-7538 Tom Carlson PNNL Biologist. Support 503-417-7562 Karen Kuhn CENWP-EC-HD Hyd. Engr. Support 503-808-4897 Ryan Sollars CENWP-HDC-P Mech. Engr. Report 503-808-4284 Chris Polinsky CENWP-HDC-P Mech. Engr. Report 503-808-4201 Dan Lundy CENWP-HDC-P S.T.E.P Report 503-808-4231
CENWP- HDC-P iii

Lower Granite Dam Stay Vane and Wicket Gate Improvement Study
INDEX Page EXECUTIVE SUMMARY ....................................................................................... i PART 1 – INTRODUCTION..................................................................................1
1.1 Purpose of this study...................................................................................1 1.2 Background .................................................................................................1 1.3 Study Criteria and Assumptions ..................................................................1
PART 2 – CFD Modeling of Stay Vane and Wicket Gate Interaction...............3
2.1 Description ..................................................................................................3 2.2 Design of the Improved SVWG System by CFD Study ...............................3 2.3 CFD results .................................................................................................6 2.4 Gap Flow.....................................................................................................7 2.5 Wicket Gate Cascade Rotation ...................................................................9 2.6 Stay Vane Trailing Edge Extension ...........................................................10 2.7 CFD Recommendations ............................................................................11
PART 3 – Performance Modeling of Stay Vane Wicket Gate Interaction .....12
3.1 Description ................................................................................................12 3.2 Performance Model Test ...........................................................................13 3.3 Performance Model Test Results ..............................................................13 3.4 Physical Model Conclusion........................................................................15
PART 4 – Flow Quality Modeling of Stay Vane Wicket Gate Interaction ......15
4.1 Bead Impact modeling background ...........................................................15 4.2 Bead Impact Model ...................................................................................16 4.3 Physical Model Bead Impact Test .............................................................16 4.4 Physical Model Bead Impact Results ........................................................17 4.5 ERDC Bead Impact Model Recommendations..........................................20
PART 5 – Conclusions and Recommendations .............................................21
PART 6 – Appendix A: Enclosures..................................................................22
Figures 16 to 21 CD – Electronic Files TSP Stay Vane and Wicket Gate relationship study, 2005 Lower Granite ERDC Stay Vane Study, 2004 VA Tech Stay Vane Modification CFD Study, 2002
CENWP- HDC-P 1
Lower Granite Dam Stay Vane and Wicket Gate Improvement Study LIST OF TABLES Table 1-Comparison of variant local loss reductions to original design, VA Tech
Stay Vane Mod CFD Study, Dec. 2002 .........................................................7 Table 2-ERDC Bead Impact Results, 17660 CFS, Lower Granite ERDC Stay
Vane Study 2004 .........................................................................................18 Table 3-ERDC Bead Impact Results, 22750 CFS, Lower Granite ERDC Stay
Vane Study 2004 .........................................................................................19 LIST OF FIGURES Figure 1- Typical Kaplan turbine ...........................................................................2 Figure 2-Computer generated model of intake and turbine distributor, VA Tech
Stay Vane Modification CFD Study, Dec 2002 ..............................................3 Figure 3-Overview of flow angles at stay vane leading edges, VA Tech Stay
Vane Modification CFD Study, Dec. 2002 .....................................................4 Figure 4-Stay Vane Variations, VA Tech Stay Vane Modification CFD Study,
Dec. 2002 ......................................................................................................5 Figure 5-Comparison of CFD model of original SVWG configuration and Variant
1 at Operation Point 1, (Typical), VA Tech Stay Vane Modification CFD Study, Dec. 2002 ...........................................................................................6
Figure 6-CFD model of Gap Flow, VA Tech Stay Vane Mod CFD Study, Dec. 2002...............................................................................................................7
Figure 7-Predicted Gap Flow Rate for different variants, VA Tech Stay Vane Mod CFD Study, Dec. 2002...................................................................................8
Figure 8-Typical Rotation of the Wicket Gate Cascade, VA Tech Stay Vane Mod CFD Study, Dec. 2002...................................................................................9
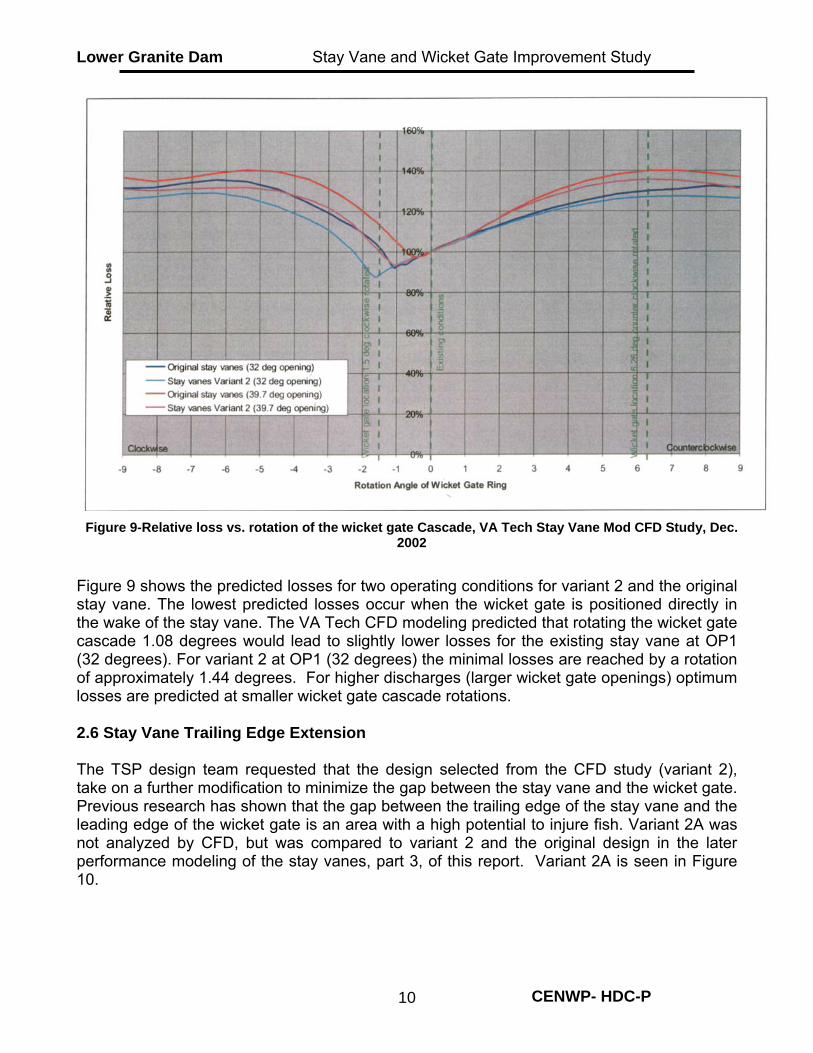
Figure 9-Relative loss vs. rotation of the wicket gate Cascade, VA Tech Stay Vane Mod CFD Study, Dec. 2002................................................................10
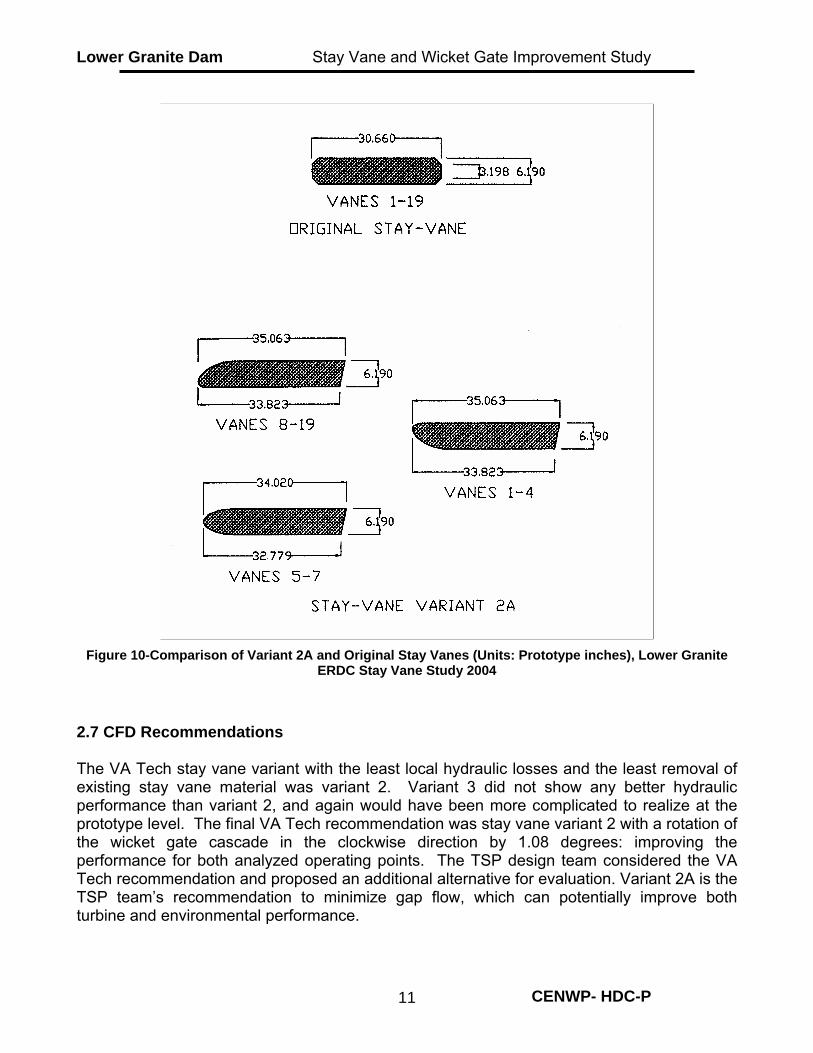
Figure 10-Comparison of Variant 2A and Original Stay Vanes (Units: Prototype inches), Lower Granite ERDC Stay Vane Study 2004 .................................11
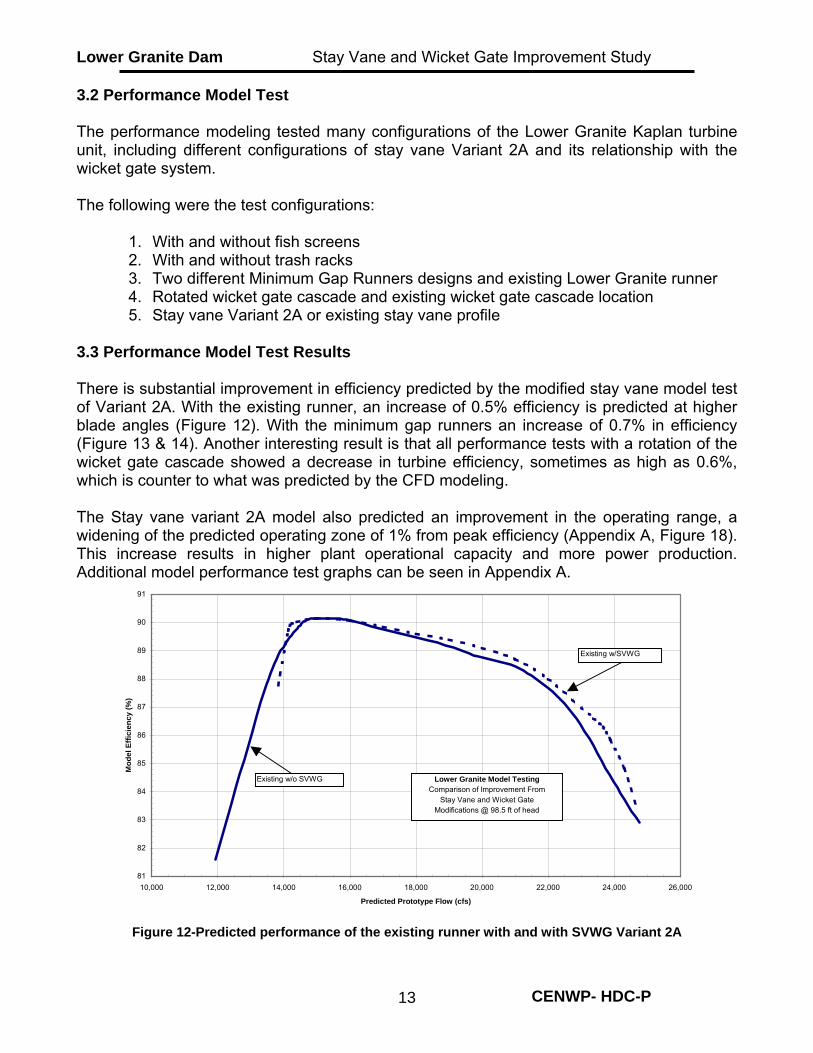
Figure 11-Lower Granite performance model .....................................................12 Figure 12-Predicted performance of the existing runner with and with SVWG
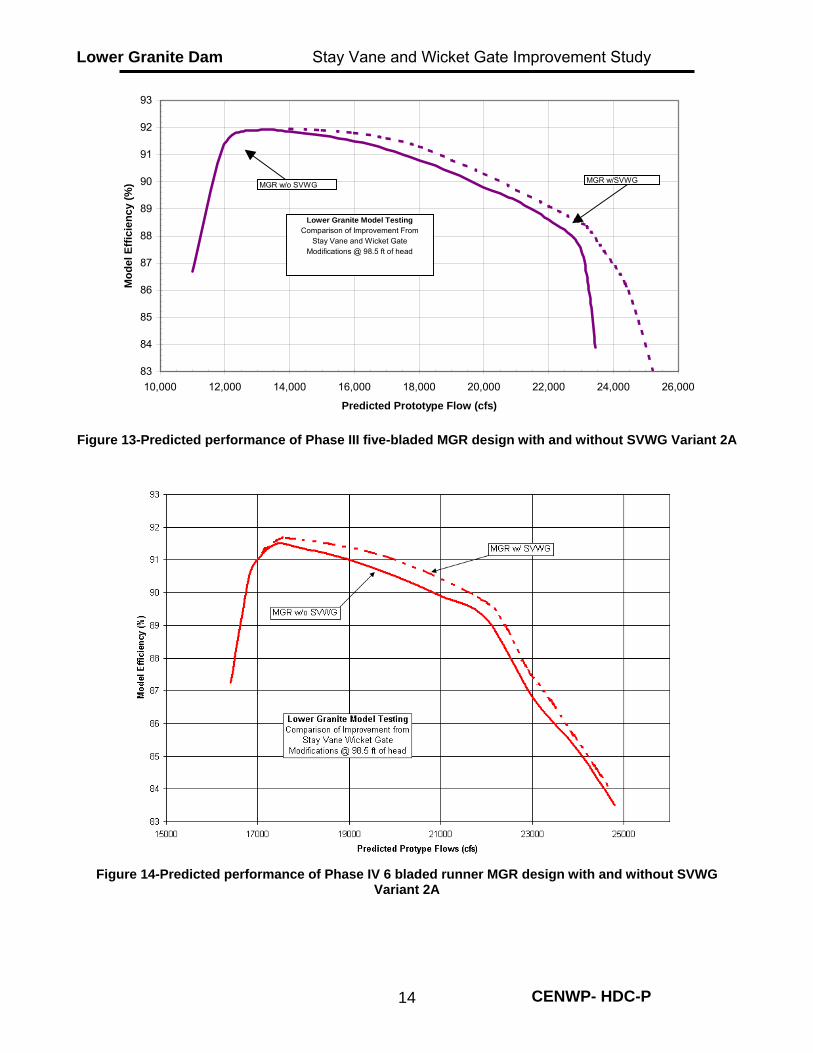
Variant 2A....................................................................................................13 Figure 13-Predicted performance of Phase III five-bladed MGR design with and
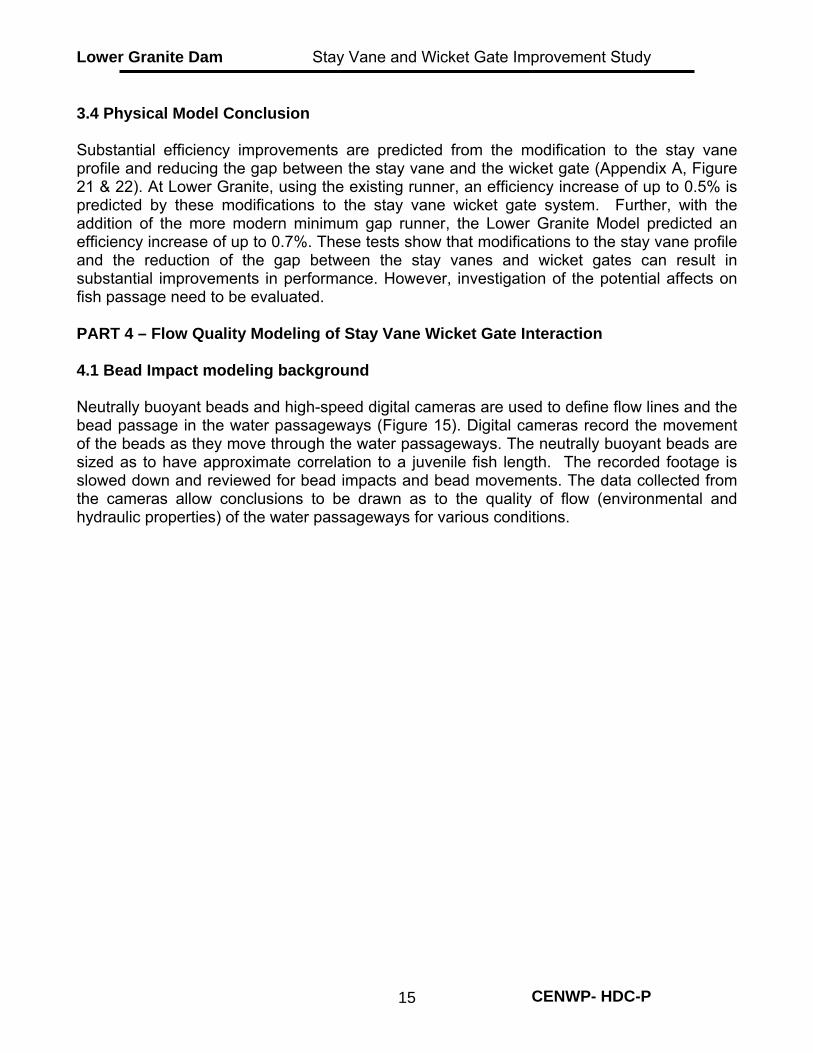
without SVWG Variant 2A............................................................................14 Figure 14-Predicted performance of Phase IV 6 bladed runner MGR design with
and without SVWG Variant 2A.....................................................................14 Figure 15-Setup of high-speed film cameras and Model at ERDC......................16 Figure 16-Graph provided by VA TECH based on Lower Granite Phase IV Stay
Vane Modifications Report, Vol. 1. June 2002. ...........................................22 Figure 17-Model Efficiency vs Prototype discharge. Graph by VA TECH based on
Lower Granite Phase IV Stay Vane Modifications Report, Vol. 1. June 2002......................................................................................................................23
Figure 18-Graph provide by VA TECH based on Lower Granite Phase IV Stay Vane Modifications Report, Vol. 1. June 2002. ...........................................24
Figure 19- Lower Granite Model (Variant 2A) .....................................................25 Figure 20 - ERDC Model views, Lower Granite ERDC Stay Vane Study, 2004..26
CENWP- HDC-P 2
Lower Granite Dam Stay Vane and Wicket Gate Improvement Study Figure 21 - Gap between stay vane and wicket gate, 17663 CFS. .....................27 Figure 22 - Gap between stay vane and wicket gate, 22,750 CFS. ....................28
CENWP- HDC-P 3
Lower Granite Dam Stay Vane and Wicket Gate Improvement Study PART 1 – INTRODUCTION 1.1 Purpose of this study The purpose of this study is to provide preliminary design guidance on environmental and machine performance gains that can be achieved through hydraulic and structural modifications to the stay vane wicket gate (SVWG) system for Kaplan turbines. This study was sponsored by the Turbine Survival Program in cooperation with the Department of Energy (DOE), Hydro Optimization Team (HOT), and the Federal Columbia River Power System (FCRPS). 1.2 Background Prior hydraulic modeling of stay vane and wicket gates on turbine models of McNary, Lower Granite, and Bonneville turbines have shown that the stay vanes and wicket gates can have significant effects on the environmental properties and performance of a turbine unit. Streamlining the SVWG configuration by modifying the leading and trailing edge of the stay vane reduces flow separation and turbulence. Streamlining also reduces the potential for, and the severity of, strikes by passing fish. Both of these effects would reduce injuries and mortalities of turbine-passed fish. Stay vane and wicket gate (SVWG) systems (Figure 1 and Figure 19) are generally designed for a broad range of operating heads and flows. Environmental restrictions in the Columbia river basin currently require operation within ±1% of maximum efficiency of a turbine at any operating hydraulic head. The ±1% efficiency limitation results in limited flow conditions for which the SVWG system is not necessarily optimized. This limited band of operation can create non-ideal flow conditions that are more likely to cause physical impacts and shear events with the fish passing through a turbine unit. The installation of fish diversion devices upstream from the SVWG further compounds non-ideal flow conditions through a turbine unit. The limited operating range, poor flow quality, and the desire to improve environmental performance prompted the study of the SVWG configurations. SVWG configurations can utilize more than one hydraulic shape of stay vane depending on the flow separation and flow angle with respect to the inlet angle of the stay vanes and scroll case. Lower Granite turbine units, which are the basis for this study, were originally designed with only one shape of stay vane. The hydraulic shape of existing stay vanes can be modified to improve hydraulic performance. 1.3 Study Criteria and Assumptions Basic assumptions and criteria forming the basis of this report are:
• Non-technical aspects of each alternative are not addressed. • Effects on O&M costs are not specifically addressed, nor are economic effects such as
power production or increased grid capabilities. • Numerical modeling using CFD is a tool to evaluate the SVWG systems • ERDC hydraulic modeling process is suitable for identifying flow quality improvements
over the existing configuration.
CENWP- HDC-P 1
Lower Granite Dam Stay Vane and Wicket Gate Improvement Study
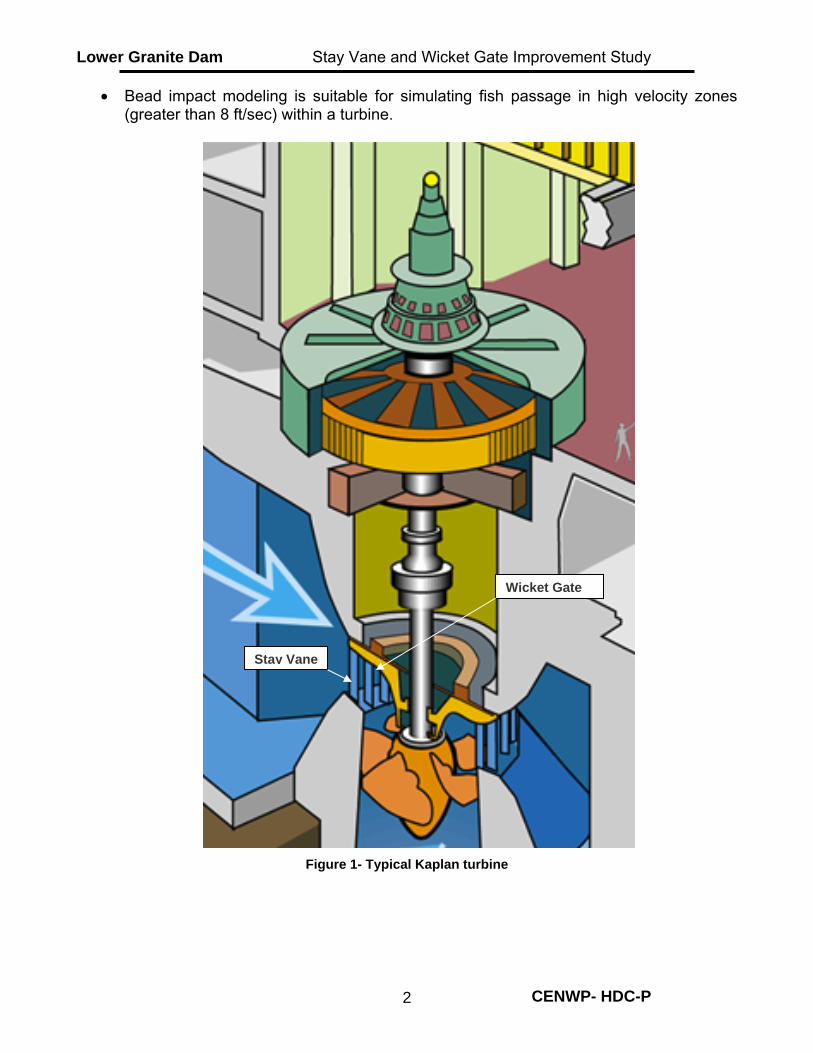
• Bead impact modeling is suitable for simulating fish passage in high velocity zones (greater than 8 ft/sec) within a turbine.
Wicket Gate
Stay Vane
Figure 1- Typical Kaplan turbine
CENWP- HDC-P 2
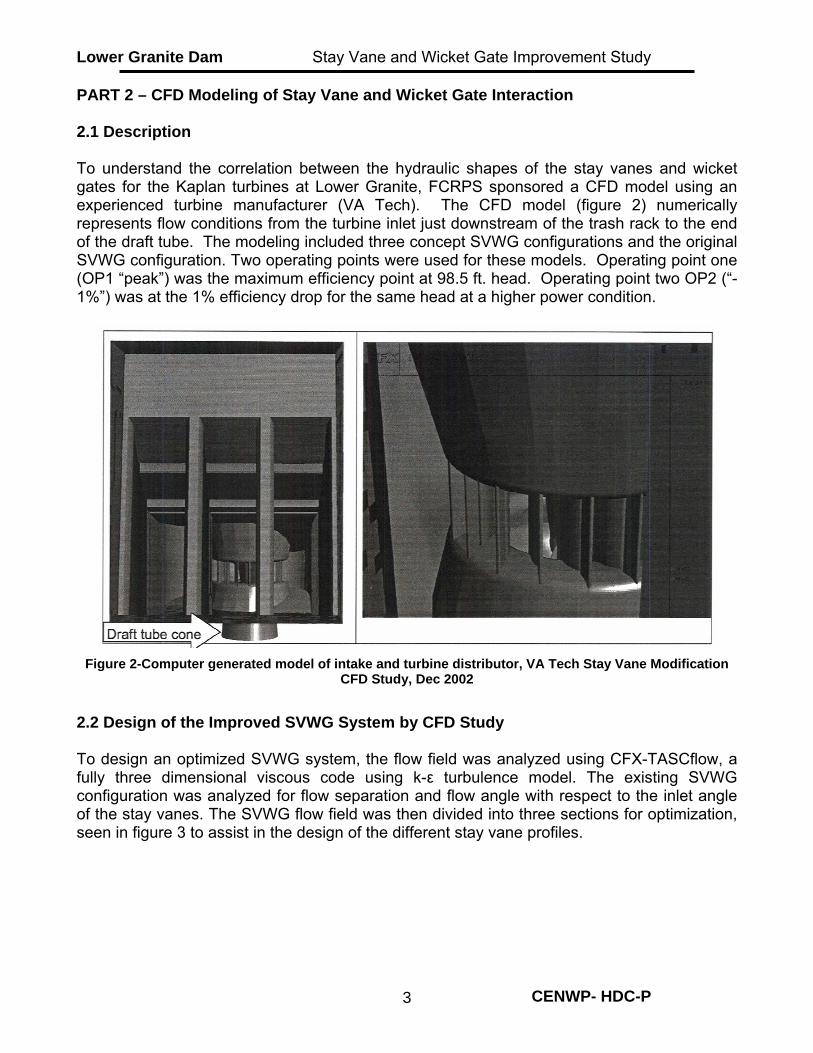
Lower Granite Dam Stay Vane and Wicket Gate Improvement Study PART 2 – CFD Modeling of Stay Vane and Wicket Gate Interaction 2.1 Description To understand the correlation between the hydraulic shapes of the stay vanes and wicket gates for the Kaplan turbines at Lower Granite, FCRPS sponsored a CFD model using an experienced turbine manufacturer (VA Tech). The CFD model (figure 2) numerically represents flow conditions from the turbine inlet just downstream of the trash rack to the end of the draft tube. The modeling included three concept SVWG configurations and the original SVWG configuration. Two operating points were used for these models. Operating point one (OP1 “peak”) was the maximum efficiency point at 98.5 ft. head. Operating point two OP2 (“-1%”) was at the 1% efficiency drop for the same head at a higher power condition.
Figure 2-Computer generated model of intake and turbine distributor, VA Tech Stay Vane Modification
CFD Study, Dec 2002
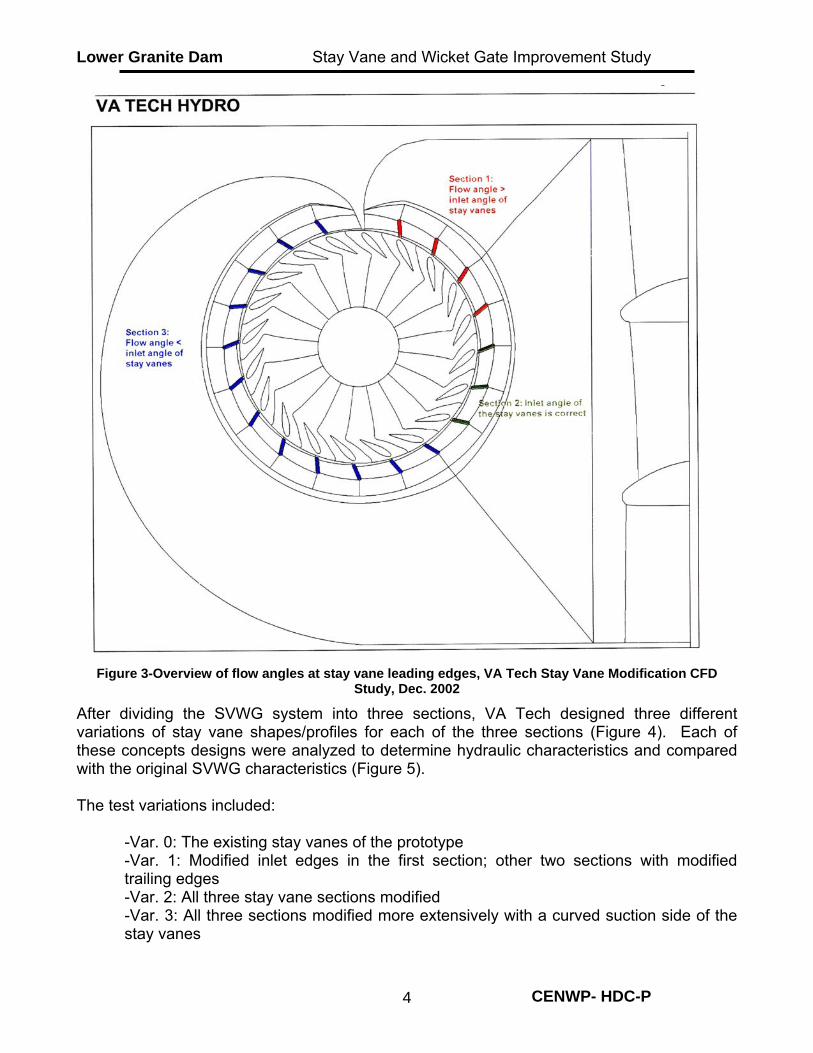
2.2 Design of the Improved SVWG System by CFD Study To design an optimized SVWG system, the flow field was analyzed using CFX-TASCflow, a fully three dimensional viscous code using k-ε turbulence model. The existing SVWG configuration was analyzed for flow separation and flow angle with respect to the inlet angle of the stay vanes. The SVWG flow field was then divided into three sections for optimization, seen in figure 3 to assist in the design of the different stay vane profiles.
CENWP- HDC-P 3
Lower Granite Dam Stay Vane and Wicket Gate Improvement Study
Figure 3-Overview of flow angles at stay vane leading edges, VA Tech Stay Vane Modification CFD
Study, Dec. 2002
After dividing the SVWG system into three sections, VA Tech designed three different variations of stay vane shapes/profiles for each of the three sections (Figure 4). Each of these concepts designs were analyzed to determine hydraulic characteristics and compared with the original SVWG characteristics (Figure 5). The test variations included: -Var. 0: The existing stay vanes of the prototype
-Var. 1: Modified inlet edges in the first section; other two sections with modified trailing edges -Var. 2: All three stay vane sections modified -Var. 3: All three sections modified more extensively with a curved suction side of the stay vanes
CENWP- HDC-P 4

Lower Granite Dam Stay Vane and Wicket Gate Improvement Study The different combinations of variants in stay vanes analyzed are seen in Figure 3.
Figure 4-Stay Vane Variations, VA Tech Stay Vane Modification CFD Study, Dec. 2002
CENWP- HDC-P 5

Lower Granite Dam Stay Vane and Wicket Gate Improvement Study
Figure 5-Comparison of CFD model of original SVWG configuration and Variant 1 at Operation Point 1,
(Typical), VA Tech Stay Vane Modification CFD Study, Dec. 2002
2.3 CFD results The final results from the CFD analysis of the three new variants of the stay vanes are listed in Table 1. The percentages given are a relative reduction in losses compared to the existing stay vane configuration (variation 0) losses in the distributor.
CENWP- HDC-P 6
Lower Granite Dam Stay Vane and Wicket Gate Improvement Study
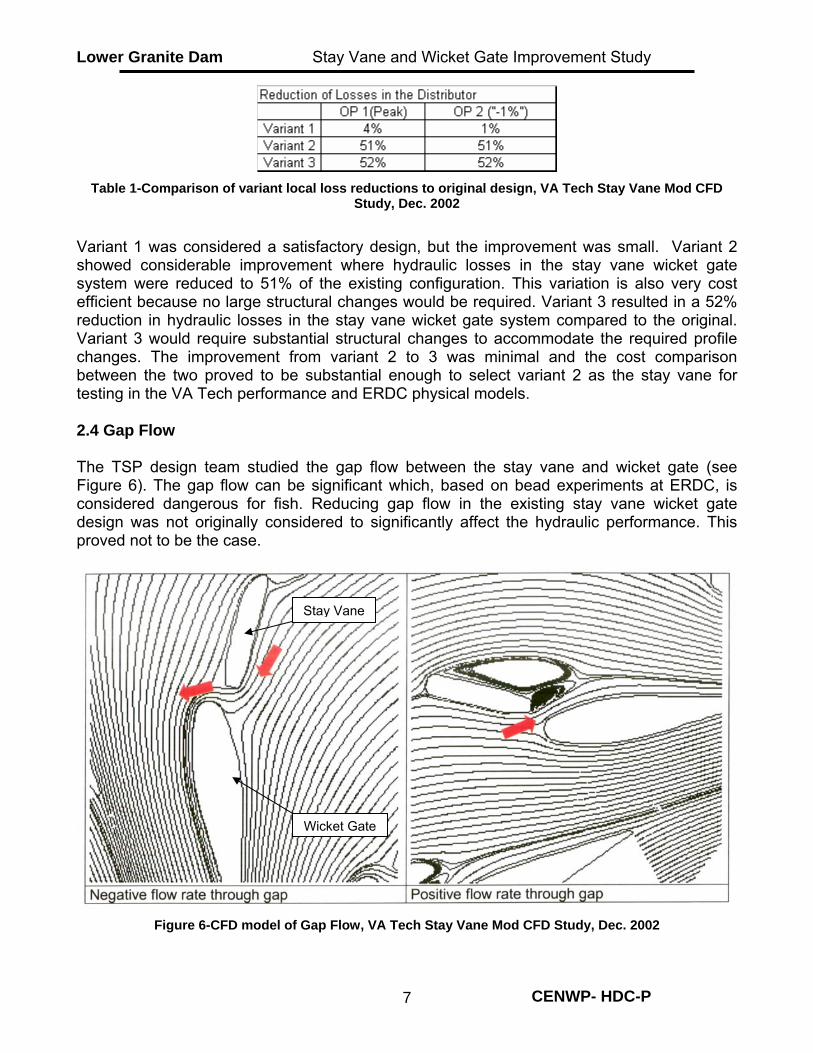
Table 1-Comparison of variant local loss reductions to original design, VA Tech Stay Vane Mod CFD
Study, Dec. 2002
Variant 1 was considered a satisfactory design, but the improvement was small. Variant 2 showed considerable improvement where hydraulic losses in the stay vane wicket gate system were reduced to 51% of the existing configuration. This variation is also very cost efficient because no large structural changes would be required. Variant 3 resulted in a 52% reduction in hydraulic losses in the stay vane wicket gate system compared to the original. Variant 3 would require substantial structural changes to accommodate the required profile changes. The improvement from variant 2 to 3 was minimal and the cost comparison between the two proved to be substantial enough to select variant 2 as the stay vane for testing in the VA Tech performance and ERDC physical models. 2.4 Gap Flow The TSP design team studied the gap flow between the stay vane and wicket gate (see Figure 6). The gap flow can be significant which, based on bead experiments at ERDC, is considered dangerous for fish. Reducing gap flow in the existing stay vane wicket gate design was not originally considered to significantly affect the hydraulic performance. This proved not to be the case.
e
e
Figure 6-CFD model of
Wicket Gat
Stay Van
Gap Flow, VA Tech Stay Vane Mod CFD Study, Dec. 2002
CENWP- HDC-P 7
Lower Granite Dam Stay Vane and Wicket Gate Improvement Study
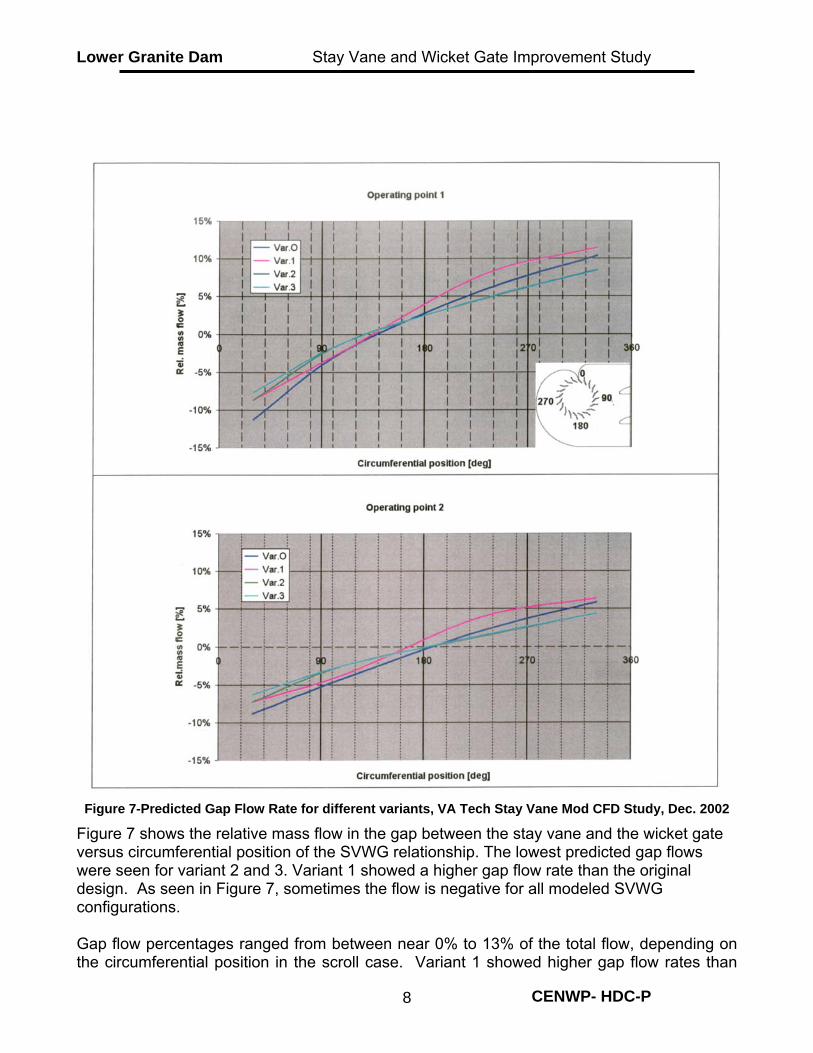
Figure 7-Predicted Gap Flow Rate for different variants, VA Tech Stay Vane Mod CFD Study, Dec. 2002
Figure 7 shows the relative mass flow in the gap between the stay vane and the wicket gate versus circumferential position of the SVWG relationship. The lowest predicted gap flows were seen for variant 2 and 3. Variant 1 showed a higher gap flow rate than the original design. As seen in Figure 7, sometimes the flow is negative for all modeled SVWG configurations. Gap flow percentages ranged from between near 0% to 13% of the total flow, depending on the circumferential position in the scroll case. Variant 1 showed higher gap flow rates than
CENWP- HDC-P 8

Lower Granite Dam Stay Vane and Wicket Gate Improvement Study the original stay vane. This higher flow rate was due to the thinner trailing edge design of variant 1. The thinner stay vane tailing edge resulted in a larger gap between the stay vane trailing edge and the wicket gate leading edge. From these gap flow studies it can be seen that the closer the stay vane is to the leading edge of the wicket gate, the less the flow will take that passage. A longer stay vane would result in the reduced gap and therefore potentially have a beneficial effect on environmental performance by reducing severe hydraulic conditions and chance of strike for turbine-passed fish. 2.5 Wicket Gate Cascade Rotation The position of the wicket gate cascade relative to the axis of the unit can be changed. The optimum cascade rotation for the wicket gate depends on the specific speed of the unit, profile of the stay vane trailing edge, and the wicket gate opening. Because of the different variables, the best operational wicket gate cascade rotation is a compromise between the ideal location for part load operation and the ideal location for full load operation (Figure 8). To investigate whether the original wicket gate is at the best operational location, VA Tech modeled rotating the wicket gate cascade in 10 steps of 0.9 degrees in both directions from the original location. From the lowest loss point found in these ten steps, rotating in 0.18-degree steps further refined the model to the point of the smallest losses.
Figure 8-Typical Rotation of the Wicket Gate Cascade, VA Tech Stay Vane Mod CFD Study, Dec. 2002
CENWP- HDC-P 9
Lower Granite Dam Stay Vane and Wicket Gate Improvement Study
Figure 9-Relative loss vs. rotation of the wicket gate Cascade, VA Tech Stay Vane Mod CFD Study, Dec.
2002
Figure 9 shows the predicted losses for two operating conditions for variant 2 and the original stay vane. The lowest predicted losses occur when the wicket gate is positioned directly in the wake of the stay vane. The VA Tech CFD modeling predicted that rotating the wicket gate cascade 1.08 degrees would lead to slightly lower losses for the existing stay vane at OP1 (32 degrees). For variant 2 at OP1 (32 degrees) the minimal losses are reached by a rotation of approximately 1.44 degrees. For higher discharges (larger wicket gate openings) optimum losses are predicted at smaller wicket gate cascade rotations. 2.6 Stay Vane Trailing Edge Extension The TSP design team requested that the design selected from the CFD study (variant 2), take on a further modification to minimize the gap between the stay vane and the wicket gate. Previous research has shown that the gap between the trailing edge of the stay vane and the leading edge of the wicket gate is an area with a high potential to injure fish. Variant 2A was not analyzed by CFD, but was compared to variant 2 and the original design in the later performance modeling of the stay vanes, part 3, of this report. Variant 2A is seen in Figure 10.
CENWP- HDC-P 10
Lower Granite Dam Stay Vane and Wicket Gate Improvement Study
Figure 10-Comparison of Variant 2A and Original Stay Vanes (Units: Prototype inches), Lower Granite
ERDC Stay Vane Study 2004
2.7 CFD Recommendations The VA Tech stay vane variant with the least local hydraulic losses and the least removal of existing stay vane material was variant 2. Variant 3 did not show any better hydraulic performance than variant 2, and again would have been more complicated to realize at the prototype level. The final VA Tech recommendation was stay vane variant 2 with a rotation of the wicket gate cascade in the clockwise direction by 1.08 degrees: improving the performance for both analyzed operating points. The TSP design team considered the VA Tech recommendation and proposed an additional alternative for evaluation. Variant 2A is the TSP team’s recommendation to minimize gap flow, which can potentially improve both turbine and environmental performance.
CENWP- HDC-P 11
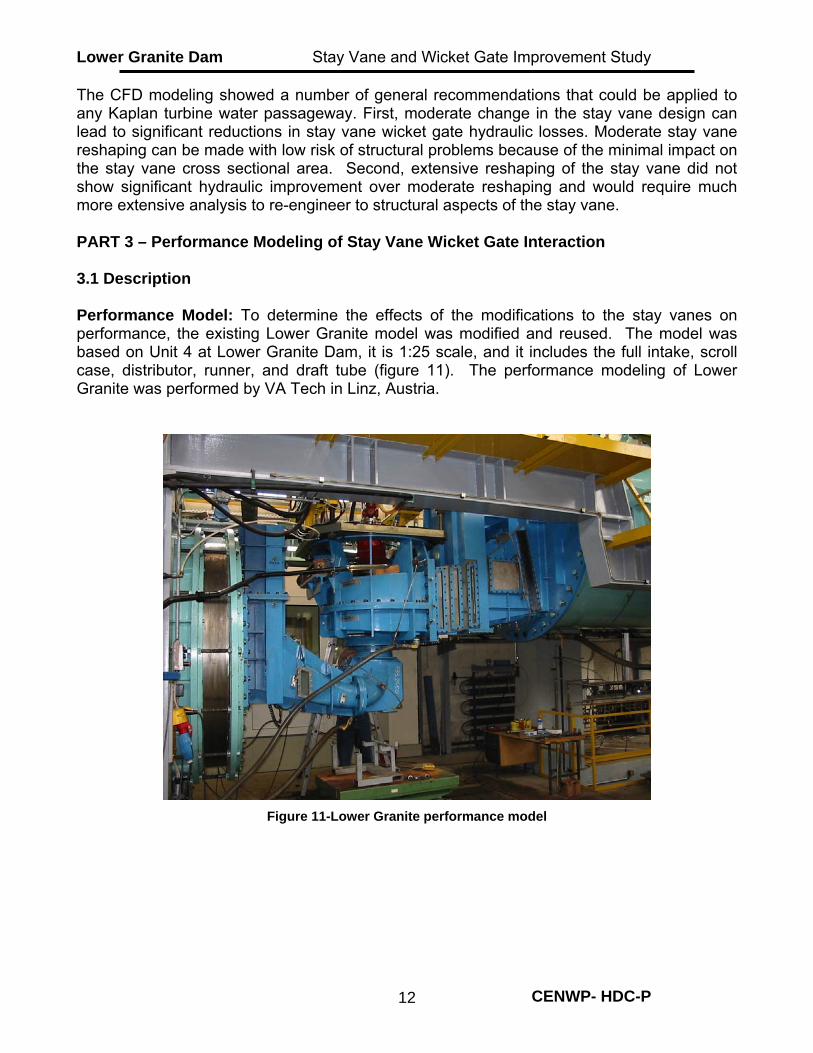
Lower Granite Dam Stay Vane and Wicket Gate Improvement Study The CFD modeling showed a number of general recommendations that could be applied to any Kaplan turbine water passageway. First, moderate change in the stay vane design can lead to significant reductions in stay vane wicket gate hydraulic losses. Moderate stay vane reshaping can be made with low risk of structural problems because of the minimal impact on the stay vane cross sectional area. Second, extensive reshaping of the stay vane did not show significant hydraulic improvement over moderate reshaping and would require much more extensive analysis to re-engineer to structural aspects of the stay vane. PART 3 – Performance Modeling of Stay Vane Wicket Gate Interaction 3.1 Description Performance Model: To determine the effects of the modifications to the stay vanes on performance, the existing Lower Granite model was modified and reused. The model was based on Unit 4 at Lower Granite Dam, it is 1:25 scale, and it includes the full intake, scroll case, distributor, runner, and draft tube (figure 11). The performance modeling of Lower Granite was performed by VA Tech in Linz, Austria.
Figure 11-Lower Granite performance model
CENWP- HDC-P 12
Lower Granite Dam Stay Vane and Wicket Gate Improvement Study 3.2 Performance Model Test The performance modeling tested many configurations of the Lower Granite Kaplan turbine unit, including different configurations of stay vane Variant 2A and its relationship with the wicket gate system. The following were the test configurations:
1. With and without fish screens 2. With and without trash racks 3. Two different Minimum Gap Runners designs and existing Lower Granite runner 4. Rotated wicket gate cascade and existing wicket gate cascade location 5. Stay vane Variant 2A or existing stay vane profile
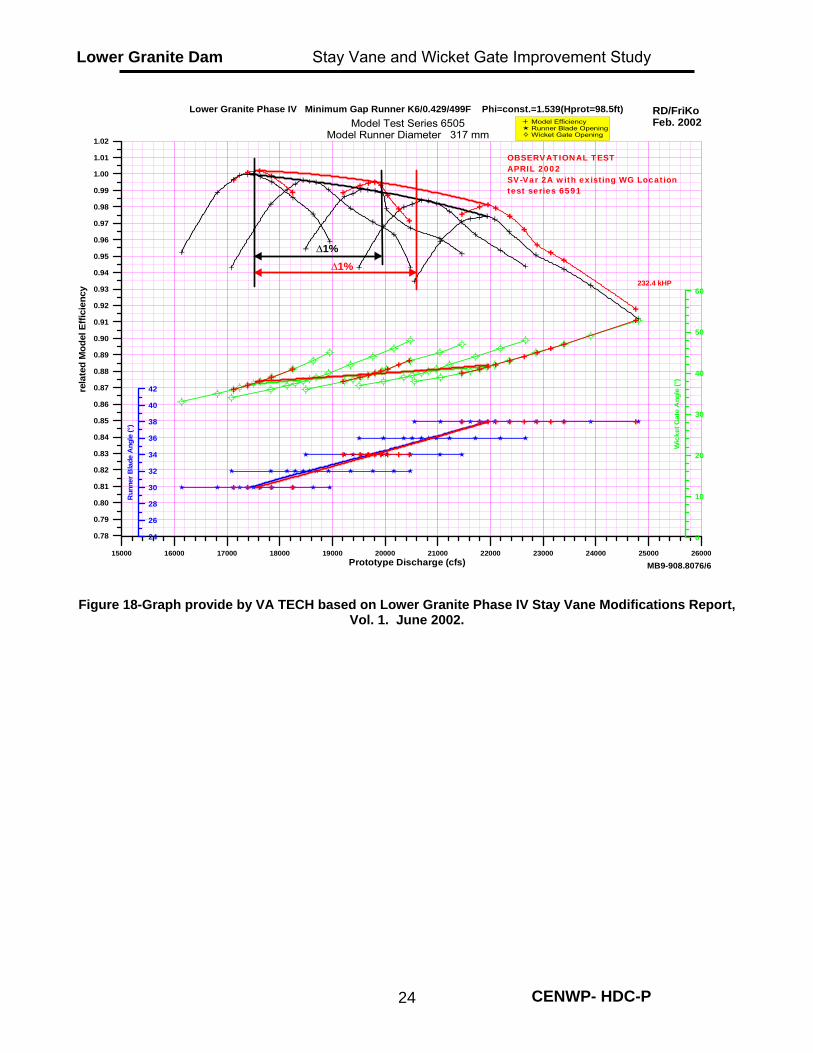
3.3 Performance Model Test Results There is substantial improvement in efficiency predicted by the modified stay vane model test of Variant 2A. With the existing runner, an increase of 0.5% efficiency is predicted at higher blade angles (Figure 12). With the minimum gap runners an increase of 0.7% in efficiency (Figure 13 & 14). Another interesting result is that all performance tests with a rotation of the wicket gate cascade showed a decrease in turbine efficiency, sometimes as high as 0.6%, which is counter to what was predicted by the CFD modeling. The Stay vane variant 2A model also predicted an improvement in the operating range, a widening of the predicted operating zone of 1% from peak efficiency (Appendix A, Figure 18). This increase results in higher plant operational capacity and more power production. Additional model performance test graphs can be seen in Appendix A.
81
82
83
84
85
86
87
88
89
90
91
10,000 12,000 14,000 16,000 18,000 20,000 22,000 24,000 26,000
Predicted Prototype Flow (cfs)
Mod
el E
ffici
ency
(%)
Existing w/o SVWG
Existing w/SVWG
Lower Granite Model TestingComparison of Improvement From
Stay Vane and Wicket GateModifications @ 98.5 ft of head
Figure 12-Predicted performance of the existing runner with and with SVWG Variant 2A
CENWP- HDC-P 13
Lower Granite Dam Stay Vane and Wicket Gate Improvement Study
83
84
85
86
87
88
89
90
91
92
93
10,000 12,000 14,000 16,000 18,000 20,000 22,000 24,000 26,000
Predicted Prototype Flow (cfs)
Mod
el E
ffici
ency
(%) MGR w/SVWGMGR w/o SVWG
Lower Granite Model TestingComparison of Improvement From
Stay Vane and Wicket GateModifications @ 98.5 ft of head
Figure 13-Predicted performance of Phase III five-bladed MGR design with and without SVWG Variant 2A
Figure 14-Predicted performance of Phase IV 6 bladed runner MGR design with and without SVWG
Variant 2A
CENWP- HDC-P 14
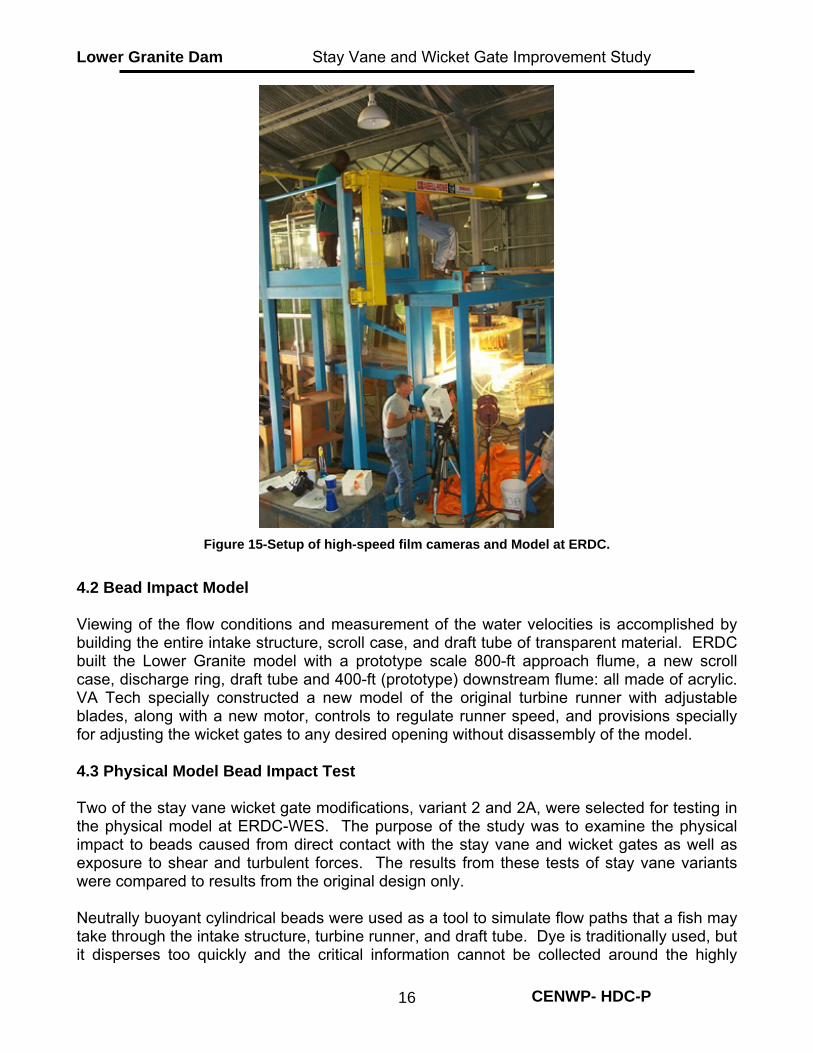
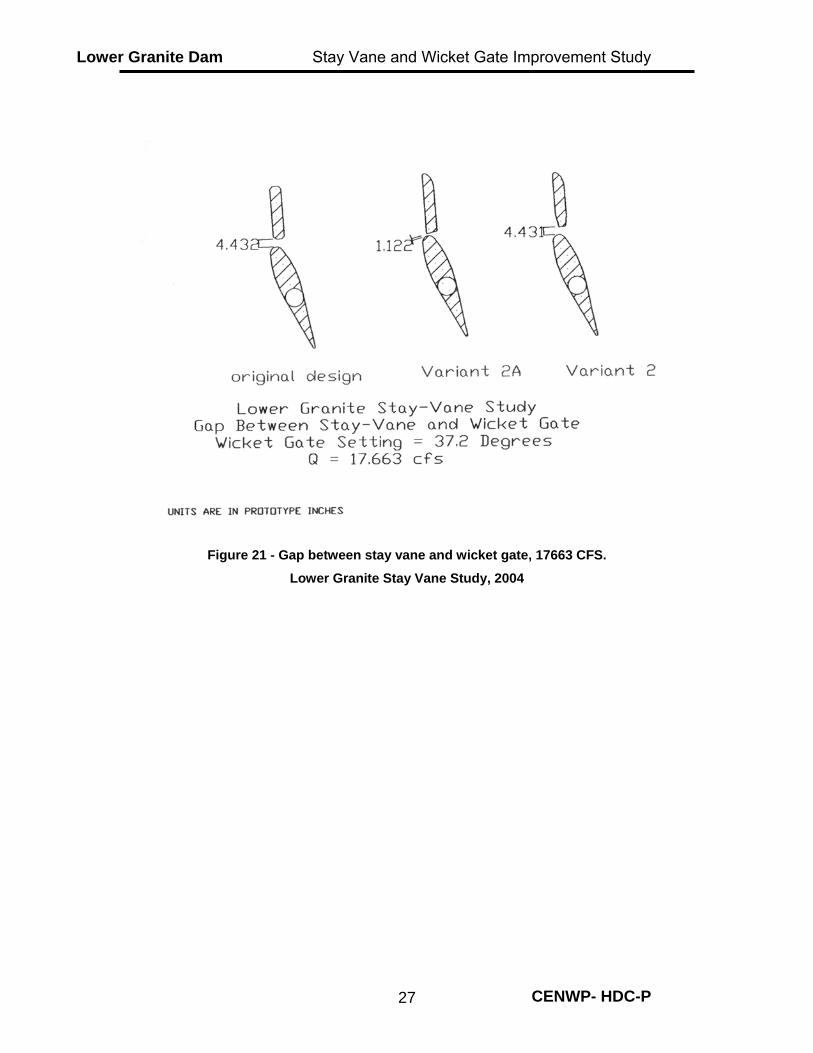
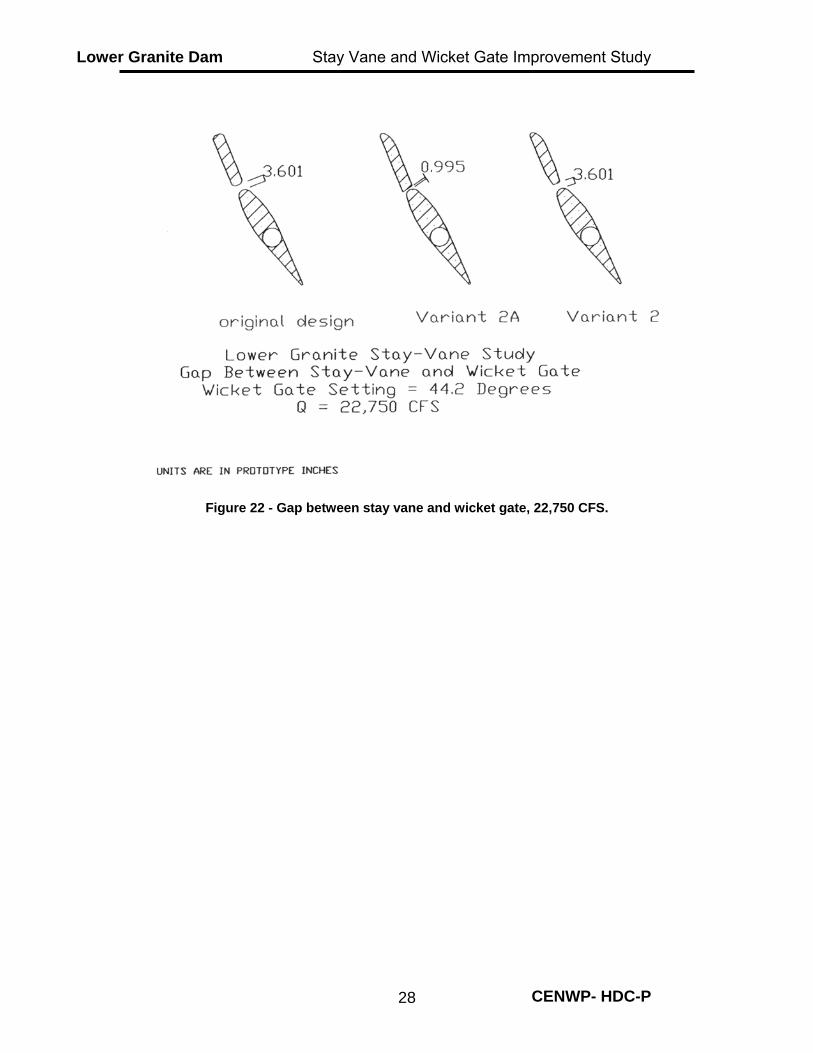
Lower Granite Dam Stay Vane and Wicket Gate Improvement Study 3.4 Physical Model Conclusion Substantial efficiency improvements are predicted from the modification to the stay vane profile and reducing the gap between the stay vane and the wicket gate (Appendix A, Figure 21 & 22). At Lower Granite, using the existing runner, an efficiency increase of up to 0.5% is predicted by these modifications to the stay vane wicket gate system. Further, with the addition of the more modern minimum gap runner, the Lower Granite Model predicted an efficiency increase of up to 0.7%. These tests show that modifications to the stay vane profile and the reduction of the gap between the stay vanes and wicket gates can result in substantial improvements in performance. However, investigation of the potential affects on fish passage need to be evaluated. PART 4 – Flow Quality Modeling of Stay Vane Wicket Gate Interaction 4.1 Bead Impact modeling background Neutrally buoyant beads and high-speed digital cameras are used to define flow lines and the bead passage in the water passageways (Figure 15). Digital cameras record the movement of the beads as they move through the water passageways. The neutrally buoyant beads are sized as to have approximate correlation to a juvenile fish length. The recorded footage is slowed down and reviewed for bead impacts and bead movements. The data collected from the cameras allow conclusions to be drawn as to the quality of flow (environmental and hydraulic properties) of the water passageways for various conditions.
CENWP- HDC-P 15
Lower Granite Dam Stay Vane and Wicket Gate Improvement Study
Figure 15-Setup of high-speed film cameras and Model at ERDC.
4.2 Bead Impact Model Viewing of the flow conditions and measurement of the water velocities is accomplished by building the entire intake structure, scroll case, and draft tube of transparent material. ERDC built the Lower Granite model with a prototype scale 800-ft approach flume, a new scroll case, discharge ring, draft tube and 400-ft (prototype) downstream flume: all made of acrylic. VA Tech specially constructed a new model of the original turbine runner with adjustable blades, along with a new motor, controls to regulate runner speed, and provisions specially for adjusting the wicket gates to any desired opening without disassembly of the model. 4.3 Physical Model Bead Impact Test Two of the stay vane wicket gate modifications, variant 2 and 2A, were selected for testing in the physical model at ERDC-WES. The purpose of the study was to examine the physical impact to beads caused from direct contact with the stay vane and wicket gates as well as exposure to shear and turbulent forces. The results from these tests of stay vane variants were compared to results from the original design only. Neutrally buoyant cylindrical beads were used as a tool to simulate flow paths that a fish may take through the intake structure, turbine runner, and draft tube. Dye is traditionally used, but it disperses too quickly and the critical information cannot be collected around the highly
CENWP- HDC-P 16
Lower Granite Dam Stay Vane and Wicket Gate Improvement Study turbulent area of the stay vanes and wicket gates. Because individual fish behavior within a turbine cannot be predicted the assumption was made that fish have a greater tendency to follow flow lines in high velocity zones of turbine water passage. For data comparison, the beads were released below the bulkhead slot, which is the same release area used in previous prototype fish release experiments (Appendix A, Figure 20). Release of the beads below the bulkhead slot also gives the widest distribution of beads. The bead releases were conducted in groups of 25 to 50 until 350 were captured on film using 8mm video cameras and high-speed digital video cameras. A grading criterion was developed by ERDC to assess both impact events and shear events. A shear event is defined as a sudden change in direction with no contact. Each bead recorded on video was analyzed to identify impacts and sudden changes in direction. The level of impact and level of sudden directional changes, each bead was recorded and graded. For further information on the bead impact grading method, refer to “Lower Granite ERDC Stay-Vane Study 2004.” 4.4 Physical Model Bead Impact Results Individual results were recorded for each intake bay. Results of the bead releases were also recorded as percentages and scores for each intake bay, and recorded under the following categories by:
• Percent of beads passed with no contact or sudden direction change • Percent of beads that made severe contact with a surface • Percent of beads that had a severe change in direction • Bead contact score • Bead direction change score • Bead product score • Percent of gap passage
The bead contact grading system was as follows:
• 1 = Very Severe (Direct, hard contact causing a severe change in direction) • 2 = Severe (Direct contact with change in direction) • 3 = Moderate Strike (light contact with change in direction) • 4 = Glancing Strike (makes contact with surface with little change in direction) • 5 = Touching (Bead travels with slight bump of surface or sliding along surface) • 6 = No contact with any surface
Each bead was also evaluated by looking for abrupt changes in direction, which could indicate areas of high shear. The grading system for bead change in direction (shear events) was as follows:
• 1 = Severe sudden change in direction • 2 = Moderate sudden change in direction • 3 = Small sudden change in direction • 4 = No significant change in direction
CENWP- HDC-P 17
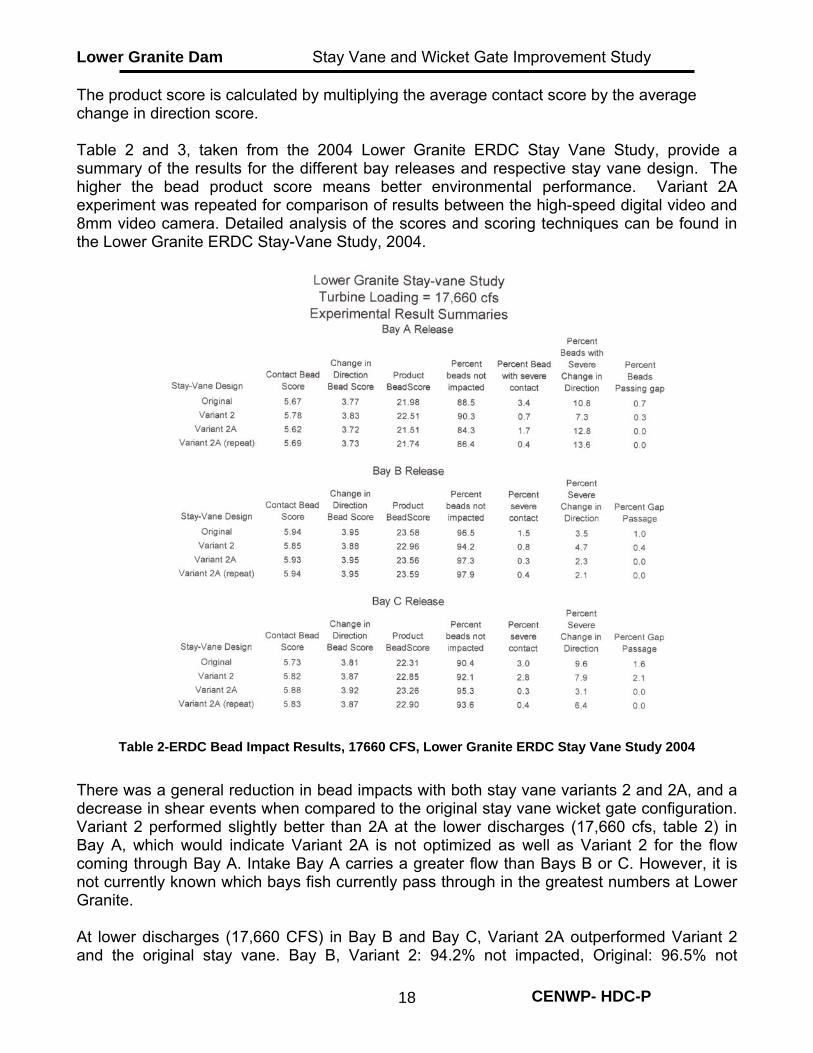
Lower Granite Dam Stay Vane and Wicket Gate Improvement Study The product score is calculated by multiplying the average contact score by the average change in direction score. Table 2 and 3, taken from the 2004 Lower Granite ERDC Stay Vane Study, provide a summary of the results for the different bay releases and respective stay vane design. The higher the bead product score means better environmental performance. Variant 2A experiment was repeated for comparison of results between the high-speed digital video and 8mm video camera. Detailed analysis of the scores and scoring techniques can be found in the Lower Granite ERDC Stay-Vane Study, 2004.
Table 2-ERDC Bead Impact Results, 17660 CFS, Lower Granite ERDC Stay Vane Study 2004
There was a general reduction in bead impacts with both stay vane variants 2 and 2A, and a decrease in shear events when compared to the original stay vane wicket gate configuration. Variant 2 performed slightly better than 2A at the lower discharges (17,660 cfs, table 2) in Bay A, which would indicate Variant 2A is not optimized as well as Variant 2 for the flow coming through Bay A. Intake Bay A carries a greater flow than Bays B or C. However, it is not currently known which bays fish currently pass through in the greatest numbers at Lower Granite. At lower discharges (17,660 CFS) in Bay B and Bay C, Variant 2A outperformed Variant 2 and the original stay vane. Bay B, Variant 2: 94.2% not impacted, Original: 96.5% not
CENWP- HDC-P 18
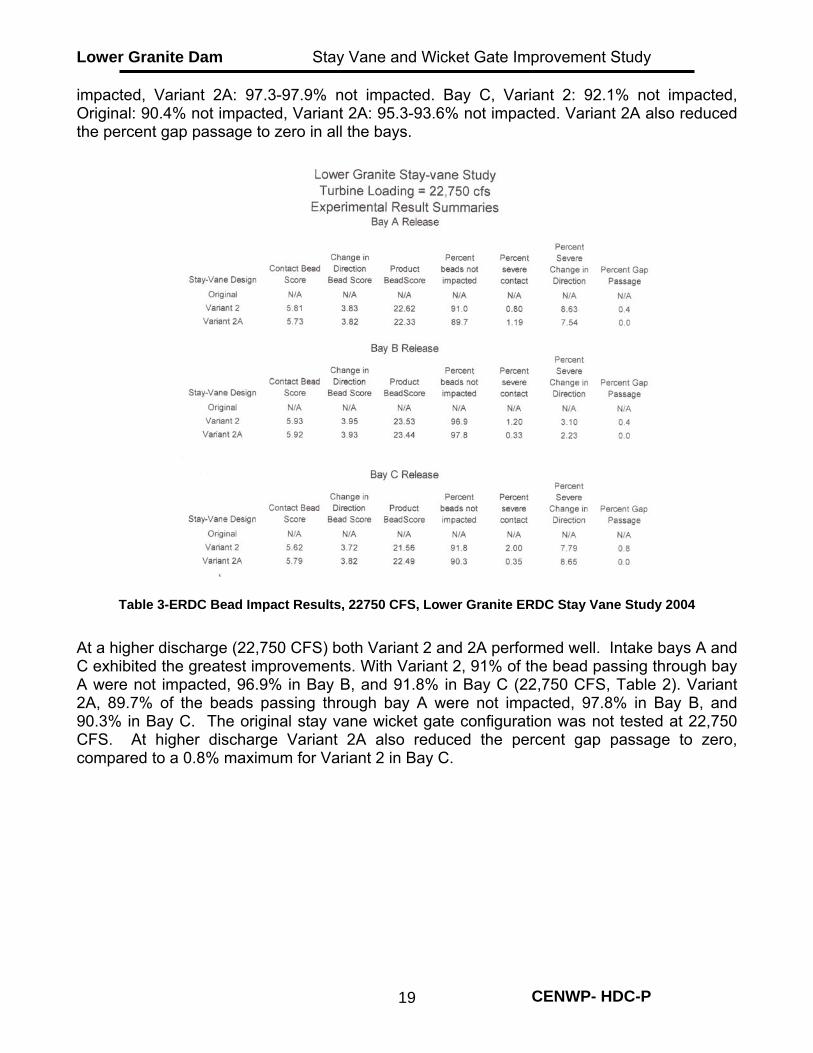
Lower Granite Dam Stay Vane and Wicket Gate Improvement Study impacted, Variant 2A: 97.3-97.9% not impacted. Bay C, Variant 2: 92.1% not impacted, Original: 90.4% not impacted, Variant 2A: 95.3-93.6% not impacted. Variant 2A also reduced the percent gap passage to zero in all the bays.
Table 3-ERDC Bead Impact Results, 22750 CFS, Lower Granite ERDC Stay Vane Study 2004
At a higher discharge (22,750 CFS) both Variant 2 and 2A performed well. Intake bays A and C exhibited the greatest improvements. With Variant 2, 91% of the bead passing through bay A were not impacted, 96.9% in Bay B, and 91.8% in Bay C (22,750 CFS, Table 2). Variant 2A, 89.7% of the beads passing through bay A were not impacted, 97.8% in Bay B, and 90.3% in Bay C. The original stay vane wicket gate configuration was not tested at 22,750 CFS. At higher discharge Variant 2A also reduced the percent gap passage to zero, compared to a 0.8% maximum for Variant 2 in Bay C.
CENWP- HDC-P 19
Lower Granite Dam Stay Vane and Wicket Gate Improvement Study 4.5 ERDC Bead Impact Model Recommendations Stay vane variant 2A was the recommendation. The bead modeling predicts significant improvement in fish passage by modification to the stay vanes. Variant 2A reduced the severe contacts and sudden changes in direction and completely removes the gap flow. The bead modeling also showed the need for further study before those units such as at Lower Granite are rehabilitated. Variant 2A should be further researched to optimize flow going through Bay A, as both Variant 2 and the original design outperformed Variant 2A in Bay A. This optimization should improve both fish passage and turbine efficiency.
CENWP- HDC-P 20

Lower Granite Dam Stay Vane and Wicket Gate Improvement Study PART 5 – Conclusions and Recommendations Conclusions:
• Substantial improvement in both environmental conditions and turbine performance are predicted from these investigations of modifications to stay vane profile and SVWG gap. At Lower Granite, using the existing runner, a nominal efficiency increase of 0.5% is predicted by these modifications to the stay vane wicket gate system. Further, with the addition of the more modern minimum gap runner, the Lower Granite Model predicted an efficiency increase of up to 0.7%. From these tests it was shown that small modifications can result in substantial improvements in environmental and hydraulic performance.
• CFD can be used to identify differences in design characteristics. However, model testing is necessary to quantify the magnitudes.
• Bead impact modeling can provide insight into the flow quality of a turbine unit. Bead modeling allows the characteristics of the flow to be quantified and analyzed.
Recommendations:
• When the Lower Granite units are rehabilitated, the stay vanes should be modified to gain the improvements seen in these tests. Some additional study will be needed to further optimize flow going through Bay A.
• The improvements predicted at Lower Granite may also be possible at other Lower Snake and Columbia River projects. Many of the dams on the Columbia River and Lower Snake River share similar designs; some are even the same design. When Lower Snake and Columbia River dams are being investigated for improvement or rehabilitation, modification to the stay vane wicket gate system should be an important topic for consideration. The relatively low cost of the proposed modification to the stay vanes and the large environmental and hydraulic performance increases may make this a positive addition to any rehabilitation.
CENWP- HDC-P 21
Lower Granite Dam Stay Vane and Wicket Gate Improvement Study PART 6 – Appendix A: Enclosures
MB9-908.8077/210000 11000 12000 13000 14000 15000 16000 17000 18000 19000 20000 21000 22000 23000 24000 25000 26000
Prototype Discharge (cfs)
0.90
0.91
0.92
0.93
0.94
0.95
0.96
0.97
0.98
0.99
1.00
1.01
1.02
1.03
rela
ted
Mod
el E
ffici
ency
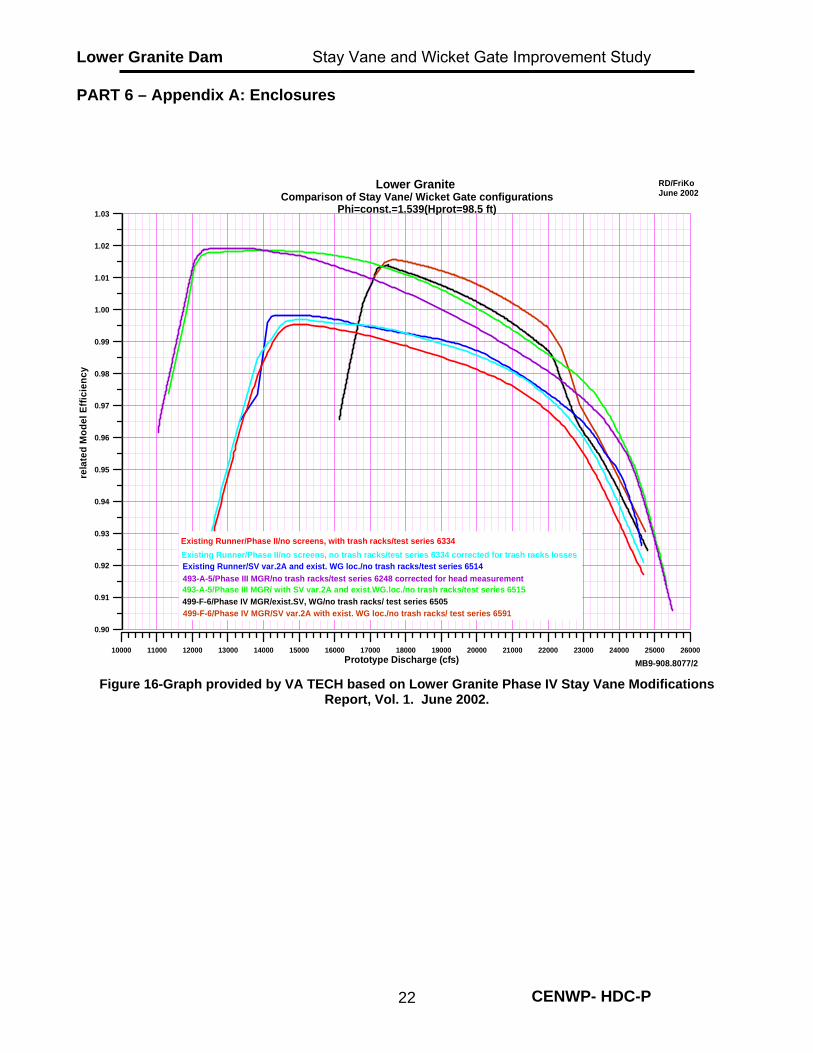
Lower GraniteComparison of Stay Vane/ Wicket Gate configurations
Phi=const.=1.539(Hprot=98.5 ft)
RD/FriKoJune 2002
499-F-6/Phase IV MGR/exist.SV, WG/no trash racks/ test series 6505499-F-6/Phase IV MGR/SV var.2A with exist. WG loc./no trash racks/ test series 6591
493-A-5/Phase III MGR/ with SV var.2A and exist.WG.loc./no trash racks/test series 6515
Existing Runner/SV var.2A and exist. WG loc./no trash racks/test series 6514493-A-5/Phase III MGR/no trash racks/test series 6248 corrected for head measurement
Existing Runner/Phase II/no screens, with trash racks/test series 6334Existing Runner/Phase II/no screens, no trash racks/test series 6334 corrected for trash racks losses
Figure 16-Graph provided by VA TECH based on Lower Granite Phase IV Stay Vane Modifications
Report, Vol. 1. June 2002.
CENWP- HDC-P 22

Lower Granite Dam Stay Vane and Wicket Gate Improvement Study
MB9-908.8077/110000 11000 12000 13000 14000 15000 16000 17000 18000 19000 20000 21000 22000 23000 24000 25000 26000
Prototype Discharge (cfs)
0.90
0.91
0.92
0.93
0.94
0.95
0.96
0.97
0.98
0.99
1.00
1.01
1.02
1.03
rela
ted
Mod
el E
ffici
ency
Lower Granite
Comparison of Stay Vane/ Wicket Gate configurationsPhi=const.=1.4906(Hprot=105ft)
RD/FriKoJune 2002
499-F-6/Phase IV MGR/exist.SV, WG/no trash racks/ test series 6505493-A-5/Phase III MGR/ with SV var.2A and exist.WG.loc./no trash racks/test series 6515
Existing Runner/SV var.2A and exist. WG loc./no trash racks/test series 6514
Existing Runner/Phase II/no screens, with trash racks/test series 6334Existing Runner/Phase II/no screens, no trash racks/test series 6334 corrected for trash racks losses
493-A-5/Phase III MGR/no trash racks/test series 6248 corrected for head measurement
Figure 17-Model Efficiency vs Prototype discharge. Graph by VA TECH based on Lower Granite Phase
IV Stay Vane Modifications Report, Vol. 1. June 2002.
CENWP- HDC-P 23
Lower Granite Dam Stay Vane and Wicket Gate Improvement Study
MB9-908.8076/615000 16000 17000 18000 19000 20000 21000 22000 23000 24000 25000 26000
Prototype Discharge (cfs)
0.78
0.79
0.80
0.81
0.82
0.83
0.84
0.85
0.86
0.87
0.88
0.89
0.90
0.91
0.92
0.93
0.94
0.95
0.96
0.97
0.98
0.99
1.00
1.01
1.02
rela
ted
Mod
el E
ffici
ency
0
10
20
30
40
50
60
Wic
ket G
ate
Ang
le (°
)
24
26
28
30
32
34
36
38
40
42
Run
ner B
lade
Ang
le (°
)
Lower Granite Phase IV Minimum Gap Runner K6/0.429/499F Phi=const.=1.539(Hprot=98.5ft)Model Test Series 6505
Model Runner Diameter 317 mmModel EfficiencyRunner Blade OpeningWicket Gate Opening
RD/FriKoFeb. 2002
OBSERVATIONAL TESTAPRIL 2002SV-Var 2A with existing WG Locationtest series 6591
232.4 kHP
∆1%∆1%
Figure 18-Graph provide by VA TECH based on Lower Granite Phase IV Stay Vane Modifications Report, Vol. 1. June 2002.
CENWP- HDC-P 24

Lower Granite Dam Stay Vane and Wicket Gate Improvement Study
Wicket Gate
Stay Vane
Figure 19- Lower Granite Model (Variant 2A)
CENWP- HDC-P 25

Lower Granite Dam Stay Vane and Wicket Gate Improvement Study
AA
Figure 20 - ERDC Model views, Lower Granite ERDC Stay Vane Study, 2004
CENWP- HDC-P 26
Lower Granite Dam Stay Vane and Wicket Gate Improvement Study
Figure 21 - Gap between stay vane and wicket gate, 17663 CFS.
Lower Granite Stay Vane Study, 2004
CENWP- HDC-P 27
Lower Granite Dam Stay Vane and Wicket Gate Improvement Study
Figure 22 - Gap between stay vane and wicket gate, 22,750 CFS.
CENWP- HDC-P 28