Embed Size (px)
Citation preview

I .I I I I I· t_
I I
' I I I I I I I
Materials Department Iowa State Highway Commission
Ames, Iowa
STEAM CURING OF PORTLAND CEMENT CONCRETE AT ATMOSPHERIC PRESSURE
Richard R. Merritt and James W. Johnson
Project HR-40 of the Iowa Highway Research Board
For presentation at the 4lst Annual Meeting of the Highway Research Board, Washington, D.C.
January 8-12, 1962

11·
I I II I I .I I I I II I I I :1 .I I I II"
Merritt~Johnson
STEAM CURING OF PORTLAND CEMENT CONCRETE AT
ATMOSPRERIC PRESSURE
INTRODUCTION
The primary reason for using steam in the curing of concrete
is to produce a high early strengtho This high early strength is
very desirable to the manufacturers of precast and prestressed
concrete units~ which often require expensive forms or stress
beds. They want to remove the forms and move the units to
storage yards as soon as possibleo The minimum time between
casting and moving the units.is usually governed by the strength
of the concrete. Steam curing accelerates the gain in strength
at early ages$ but the uncontrolled use of steam may seriously
affect the growth in strength at later ageso
The research described in this report was prompted by the
need to establish realistic controls and specifications for the
steam curing of pretensioned~ prestressed concrete bridge beams
and concrete culvert pipe manufactured in central plants. The
complete project encompasses a series of laboratory and field
investigations conducted over a period of approximately three
yearso
The purpose of the laboratory investigations was to determine
some of the relationships between the development of concrete
strength and various details of the steam curing procedure. The
points of initial concern were:
1. The time delay between the mixing of the concrete and
the beginning of steam curing.
2. The rate of temperature rise of the concrete during \
steam curing.

I I I :1 I I
Merritt~Johnson
Jo The highest temperature attained by the concrete during
steam curingo
4. The length of time for which steam curing is continued·.
The work of investigating these items was performed in seven
laboratory series and one field serieso The specific purpose of'
each series ls as follows:
Serles I = Minimum Control
The steam curing procedure used in Serles I shows the effect
of the minimum control situation. Three steam curing periods and
five different steam curing temperatures were investigated. These
were as follows:
Time Temperature
18 hro 100 F. 42 hr. 125 F. 66 hro 150 Fo
17.5 F. 200 Fo
Series II - Maximum Control
In order to obtain maximum control over the steam curing
procedure it is necessary to specify limits for the following
variables.
1. Duration of steam curing
2. Maximum curing temperature
J. Time between mixing of the concrete and beginning of
steam curing (delay t":tmeY ·····
4. Maximum rate of temperature increase
5o Maximum rate of temperature decrease
In Series I the first two variables were investigated.
Series II A is concerned with the effect of the rate of temperature
d~crease, and Series II B with the effect of delay time. In Series
II c, the effect of the last four variables was investigated for

' I f I I. I ,, I I I I I I I\
-~' I;
I !'I
ll
Merritt-Johnson -J-
one steam curing periodo
Series III Two Cements and Two Aggregates
This series was set up to determine whether or not the steam
curing procedures might need to be changed if the brand of cement
or aggregate used were changedo Two brands of cement and two types
of coarse aggregate commonly used in Iowa were investigatedo
Series IV = Water=Cement Ratio
It is generally accepted that an increased water-cement ratio
results in a decreased compressive strengtho This series was set
up to determine what different effect, if any, an increase in
mixing water might have upon concrete subjected to conditions of
steam curingo
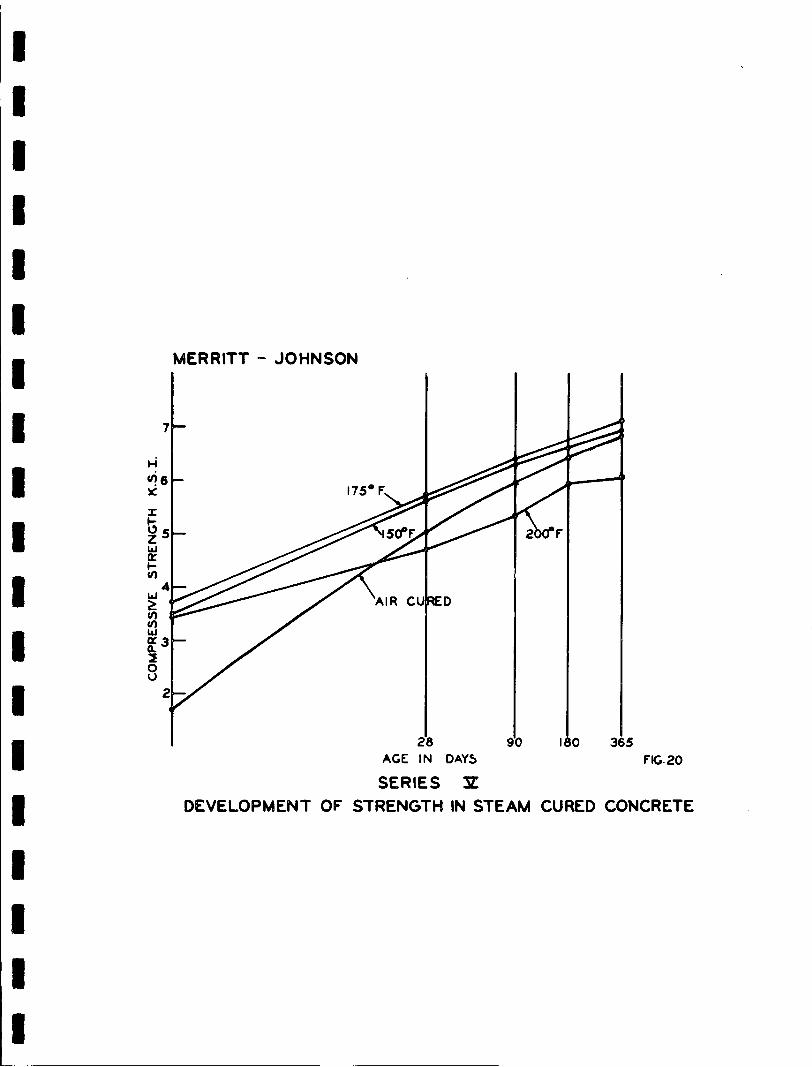
Series V Development of Strength in Steam Cured Concrete
This series was set up to study the effect of steam curing
upon concrete at several ages up to one year. Specimens were
cured at three temperatures ~ 150 F, 175 F, and 200 F. They were
tested at four ages - 28 days, 90 days, 180 days, and J65 dayso
Series VI
Molds for Concrete Test Specimens
In order to overcome the capping problem, personnel in the
Materials Department Laboratory developed a horizontal steel mold
with machined end plates which form the ends of the specimen.
Test specimens made in these molds do not require cappingo
Series VI was a laboratory investigation made for the purpose
of comparing the strength of concrete as determined from test
specimens made in the following four types of molds:
4I by 9 inch Vertical 42 by 9 inch Horizontal 6 by 12 inch Vertical 6 by 12 inch Horizontal

I I II I ,, i I I I I I I I'· I ,, I I ._,,.,
I t
Merritt-Joh!).son -4-
Series VII Temperature of Concrete When Tested
At a prestressed concrete plant tne test specimens are cured
with the beams, and they are not removed from the steam curing
until immediately before they are to be testedo This means that
the concrete specim~ns may h~ve a temperature of almost 150 F when
testedo This series was set up to determine what effect on strength
might be expected at this high ternperatureo
Series VIII - Field Studies
Series VIII was set up to study the steam curing procedures
in use in two commercial plants~ and to determine the type and
degree of control that would be feasible for field work, to deter
mine the degree of uniformity of test results that might be expected,
to study the inspection problems peculi~r to steam cured, precast
concrete construction, and to find solutions to these problemso
I~

I I -:
I I I I I ,,
' I ' .1 11
I 1: I..,
I I I
Merritt-Johns on -5=
GENERAL CONCLUSIONS
Specific conclusions concerning particular details of steam
curing procedure are to be found with the test data for each
serieso The general conclusions obtained from the project as
a whole can best be summarized by the requirements for the
steam curing of precast concrete units as stated in the 1960
Standard Specifications of the Iowa State Highway Commissiono
The pertinent part of this specification is as follows:
"The initial temperature of the concrete shall not be
raised above 100 F for a minimum of two hours after
the units have been casto- After the two hour period,
the temperature of the concrete may be raised to a
maximum temperature of 150 F in increments not to
exceed 25 F per houro The maximum temperature shall
be held for a period sufficient to develop the required
strengths as specified in 2407005 (Prestressed Units:4500
psi). The units shall be cooled in increments not to
exceed 20 F per hour by reducing the amount of heat
appliedo In all cases~ the units shall be kept covered
for a minimum period of 24 hours after casting o o • After
the units have been removed from the casting bed, they
shall be protected as necessary to avoid cooling at a rate
greater than 20 F per houro 00
This specification contains a safety factoro Under controlled
conditions in the laboratory it was found that a curing temperature
of 175 F is not harmful to the concrete~ and that the rate of
temperature rise after t"wo hours may safely be as much as 50 F
per hour.

I._
I
' I ·1 j
I I. a I ·1·
:I II
' II I' 1: I I
Merritt~Johnson
The specification takes into account the difficulty of obtaining
the same accuracy of temperature control in the manufacturing
plant as can be obtained in the laboratory. This does not imply
a criticism of the methods _or workmanship to be found in precast
concrete plantso
GENERAL PROCEDURE
Each test series is reported separately in this report.
Details concerning the materials and procedures are presented
with the test data for each individual series. The following
information relates to the entire projecto
lo All of the materials used in this project complied witb
the Standard Specifications of the Iowa State Highway
Commissiono
2. The value of a particular steam curing procedure was
judged principally on the basis of the compressive
strength of concrete at age one day and at age 28 days.
J. Steam curing in the laboratory was done in a concrete
block enclosure in which the temperature was automati
cally controlled to within 1 Fo of the intended tempera
ture. The rate of temperature rise was controlled within
4 F. per hour. The temperature of the atmosphere inside
the steam chamber and of the concrete specimens was
determined by thermocouples and was automatically recorded
every 6 minutes.
4. Unless otherwise specified~ control specimens prepared
in the laboratory were cured in a standard moist room
maintained at 100 per cent humidity and 7J.4 F ± 3 F.

I I I I ·1
I I I I I 1 I i I ,,.
1· I ·1 ,.
Merritt=Johnson -7=
5o For this project the important variables were considered
to be curing temperature, delay time, and the rate of
temperature riseo In the laboratory tests, steam curing
time did not exceed 18 hours, except in Series Io
6. During this project extra effort was made to cast uniform
specimens. A standard was devised for casting the speci
mens and was as follows:
Vertical Molds: Fill mold in three equal lifts, rod each
lift 25 times with a 5/8 inch~ rounded nose~ steel rod.
After each lift has been rodded~ hammer two sides of the
mold five blows each with a rubber mallet. Finish top
with a minimum of troweling.
Horizontal Molds: Fill mold in two equal lifts, rod each
lift 25 times with a 1 inch, rounded nose, wooden rod.
Hammer the ends and two ··sides of the mold 15 blows each
with a rubber mallet. Finish top with a minimum of
trowelingo
?. In the laboratory series~ where vertical molds were used,
the one, two, and three day specimens were capped with
sulphuro Specimens tested at later ages were capped
with neat cement.
EQUIPMENT
The major items of equipment used in the laboratory and field
experiments are described in the following:
Steam Chamber: This is a concrete block enclosure with a
concrete slab roof and flooro The interior is approximately
3 fto by 5 ft. in area, and 4 ft. high. It has a 3 ft. by 3 ft.

I ,, I I ., I I I ,, 'I I I I, ,, I I II . , I
Merritt-Johnson -8-
tight fitting door on one sideo The inside is lined with a hard
asphalt cemento Steam may be introduced through a coil of copper
tubing with small holes drilled at regular spacing, and water is
removed through a drain in the flooro
Steam Controls: The temperature of the chamber was controlled
to within 1 Fo by means of a temperature sensitive valve and
thermostato These controls are from the Johnson Service Company,
Series 8000 It is operated by'air·pressure from an outside sourceo
With this valve, the temperature of the steam chamber could be
controlled to any desired temperature from 100 Fo to 240 Fo
The rate of temperature rise was controlled by a pressure
regulator from the Fisher Governor Companyo This regulator ls
just ahead of the temperature sensitive valveo The rate of
temperature rise could be controlled by varying the outlet
pressure to within 4 F/hro of the rate desired. The pressure
used depended on the rate of temperature rise desired and the
load in the stearri chamber.
Steam Generator: Steam w§s generated in an automatic boil~r ·
fitted with a pressure regulator. This boiler was manufactured
by the Lattner Company and rated at JHPo Normally the boiler was
operated with an internal pressure of approximately 8 psle
Mixer: Laboratory specimens were prepared in a Type SKG
Lancaster batch mixer with counter current mixing. This mixer
has a capacity of a 300 lbo batcho
Temperature Recording Device: ·A 12 channel Brown poten
tiometer was used which recorded the temperature of each of
12 locations every 6 minutes on a strip chart •
Testing Machine: All the specimens cast in the laboratory
series and part of the specimens cast in the field studies were

I I I I I I I I I I I I ,, I I I I I I
Merritt-Johnson -9-
tested on a 400,000 lbo compression testing machineo The remaining
specimens were tested in the field on a semi~portable 200,000 Ib.
compression testing machinea
Molds:: All the specimens made in the laboratory, except
Series VI, were cast in vertical 6 by 12 inch moldso These molds
were made from seamless steel tube 9 and were mounted on machined,
cast iron base plates. All specimens fnade in the field were cast
in horizontal 6 by 12 inch molds. These molds were made from
seamless steel tube, and were fitted with a machined$ cast iron
plate on each endo

--------------~----
Fig . 1
Inside of Steam Chamber Boiler and Boiler Controls
Fig. 2
I ~ 0 I

-----------------~-
Fig. J
Laboratory Mixer
Fig. 4
Potentiometer and Steaming Controls
I I-' I-' I

11 I I I I I I I I I I I I I I I I I I
-12-
Fig. 5
Labora tory Testing Ma chi ne - 400,000 lb. Riehle
Portable Field Testing Machine
200,000 lb. Forney
Fig. 6

I -13-
I I I I I
I
I I Fig. 7
I Four types of molds used
I II I ' I I I ii -- ' '""' I I Fig. 8
I Disassembled horizontal mold
I

I I I I I I I I I I I I I I I I I I ,,
Merritt-Johnson -14-
Series I
MINIMUM CONTROL
The steam curing procedure used in Series I represents
the minimum control situationo Three steam curing periods and
five different curing temperatures were investigated. These
are as follows:
Time Temperature
18 hours 100 Fo 42 hours 125 Fo 66 hours 150 Fo
175 F. 200 F.
Materials and Procedures
Cement
Type o o o o o o o o o o o o I Blaine Specific Surface o • 3555 Cube Strength • • o . • . • 3 day 2035 psi
7 day 3122 psi
Aggregate
Sieve No.
it 1
3/4 1/2 3/8
4 8
16 JO 50
100 200
Specific Gravity o • . o
Percent Passing Sand Gravel
100 89 59 22
7.6 2.2 1.4
Cement 3014 Sand 2068 Gravel 2068
100 85 54 25 11
o.6

11
I I I I I I I I I I I I I I I I I I
Merritt-Johnson -15-
Proportions o • • •
Water-Cement Ratio.
Maximum Slump • 0 0 0 0
Mixing. • • 0 • 0 0 0 •
Molds • 0 0 0 0
1:2.16:2.21
o.41
2~ inches
In counter-current batch mixer Dry mix - 1 minute Wet mix - J minutes
6 by 12 inch vertical molds
Capping of Test Specimens • 1-2-J day tests with sulphur 7-14-28 day tests with neat
cement
Curing • 0 0 0 0 0 0 0 Steam - in steam chamber for period indicated, then in moist room until tested.
Control - in moist room until tested
Discussion of Tests
At each different combination of temperature and length of
steaming, approximately 24 specimens were made. Eight specimens
were tested at age one day~ two daysj or three days, depending
on the length of steaming. Eight were tested at age seven days,
and eight were tested at age twenty eight days. In all cases
as soon as steaming was complete the specimens were removed from
the steam chamber and stored in the moist room until they were
tested. An equal number of control specimens was made and placed
immediately in the moist room. These were given the standard
moist cure and were tested at the same ages as the steam cured
specimens.
During this series no effort was made to control the rate
of temperature rise of the concrete 9 and no delay time between
mixing and beginning of steaming was given. It was noticed,
however, that in all cases the specimens cast from the first
batch each day, had higher compressive strengths than specimens

I I I I I I I I I I I I I I I I I I ,.
Merritt-Johnson -16-
from the second batcho This may be explained by the fact that
specimens from the first batch actually had approximately JO
minutes delay time between mixing and beginning of steaming and I
the second batch had no delay at allo It was also noticed that
at steaming temperatures of 150 F, 175 F~ and 200 F, on days
when the rate of temperature rise was lower~ the compressive
strengths tended to be slightly highero
Discussion of Results
Even with the minimum of control used, the concrete gained
strength at an accelerated rate during the first few hours of
steaming. At all temperatures the concrete gained strength at
a diminishing rate between 18 and 66 hours of steaming. At
temperatures of 175 F and 200 F the concrete lost strength by
additional steaming past 4z· hourso By the end of 18 hours o~
steaming, the rate of gain in strength of concrete steam cured
at any temperature is less than the rate of gain in strength
of concrete which is moist curedo
The best early strengths were obtained after 18 hours of
steaming at temperatures of 125 F and 150 F. At these tempera
tures the 28 day strengths with any length of steaming were
about 75 percent of the 28 day control strengtho
At 175 F and 200 F the specimens showed severe swelling.
It is believed that this was c~used by the expansion of the
entrapped air during the time the concrete was still in the
plastic state.
- - 1

- - - -MERRITT -JOHNSON
,..; 6-Iii .:: I .... " z .... a: >-ell 4--
2 3
t-i Iii 6--,.:
I I-
" z .... tr >-ell
.... > iii ell .... a: a. ::; 0 u
IL I 2 3
- - - - -
CONTROL
STEAM CHAMBER AT 125°F
7 14 28
AGE IN DAYS FIG. I
CONTROL
STEAM CHAMBER AT 175°F
42 HR. STEAM
I 7 14
AGE IN DAYS
28
FIG.3
SERIES I MINIMUM CONTROL OF
- -
STEAM CURING
-
t-i 6-cri
"' I
- -
t) 5-- INCREASE IN STRENGTH z WITH LENGTH w OF STEAMING
- - - -
~ 4-- '> -----""'"'"-....- STEAM
.... > iii i!:l a: a. ::; 0 u
H <Ii
"' I t-
" z .... a: t-ell
.... > iii ell .... a: a. ::; 0 u
2 3
6-
5--INCREASE IN STRENGl'H TO 42 RS. STEAM
4--
3--
2
1L I I 2 3
STEAM CHAMBER AT 150°F
I I 7 14 28
AGE IN DAYS
FIG. 2
STEAM CHAMBER AT 200°F
18 HR. STEAM
7 14
AGE IN DAYS
FIG.4
-
-M~Ff'M-f'!. ~H'i'rsa'l'J - - - - - - - - - - - -
lL 220
~ 200 w Ct: \j w 0
w
180
160
~ 140 r-~ 120 LJ
~ roo w t- 80
60
0
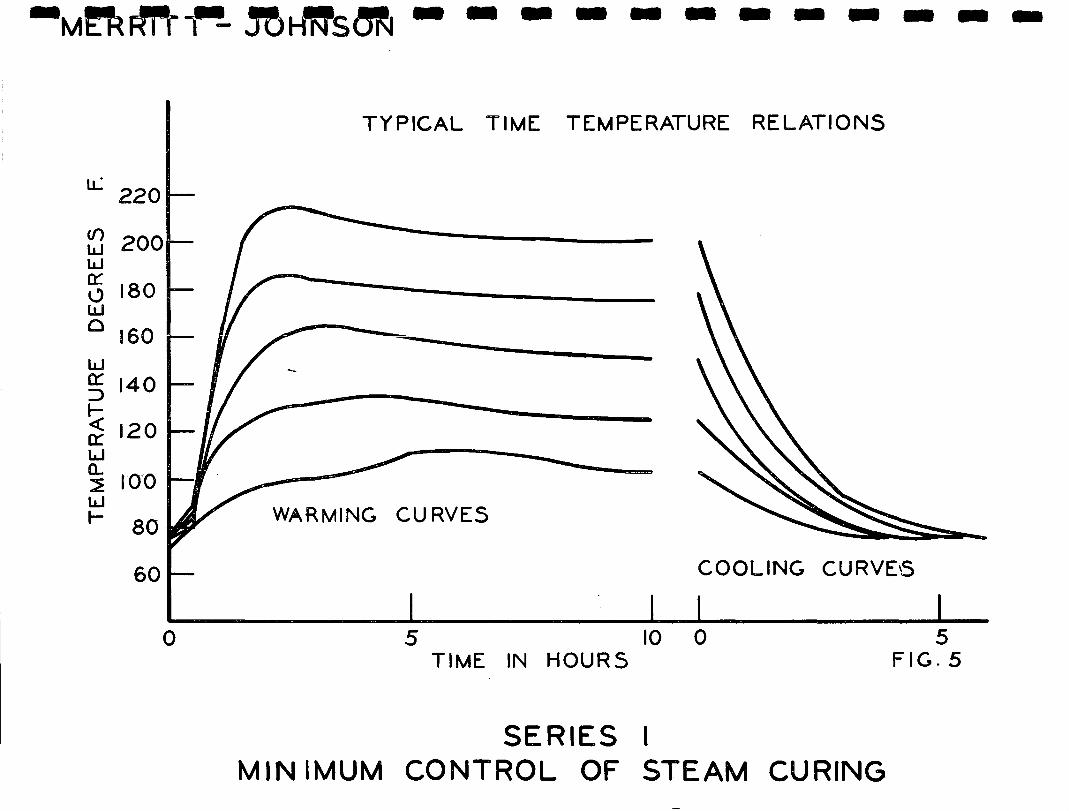
TYPICAL TIME TEMPERATURE RELATIONS
WARMING CURVES
COOLING CURVE'5
5 10 0 TIME IN HOURS
SERIES I MINIMUM CONTROL OF STEAM CURING
5 FIG. 5
_j

-N omin2.l Curing
Temperature (F.) 100 Warming Rate (F /hr.) 12 Steaming Time (hr.) 18
1-2-J Da;y:* Strength ~12sil Steam Cured 2082 No. of Tests 6 Control 1587 No. of Tests 6 1-2-3 Day* Steam Cured as a
Percent of Control 131
:Z-Da;y: Strength ~:esi~ Steam Cured 3897 No. of Tests 6 Control 4898 No. of Tests 6 7-Day Steam Cured as a
Percent of Control 80
28-Da;y: Strength (psi) Steam Cured 4923 No. of Tests 6 Control 6630 No. of Tests 6 28-Day Steam Cured as a
Percent of Control 74
- - - - - ··- -TABLE 1 ~ SERIES I
0 = t HOURS DELAY TIME
100 100 125 125 125 150 12 12 32 32 32 55 42 66 18 42 66 18
3058 3595 2704 3566 4036 2848 6 6 8 12 8 8
2705 3397 1672 2538 3368 1874 6 6 8 12 8 7
113 106 162 140 120 152
3645 3872 3793 3944 4058 3534 6 6 6 8 8 8
4737 4877 4692 4590 4820 4561 6 6 6 8 8 8
77 79 81 86 84 77
4675 4870 4821 4960 4953 4893 6 6 8 12 8 8
6870 6378 6087 6444 6406 6154 6 6 8 12 8 8
68 76 79 77 77 79
* 18 hours steam cured tested at age 1 day 42 hours steam cured tested at age 2 days 66 hours steam cured tested at age 3 days
- - - - - - - - - - -150 150 175 175 175 200 200 200
55 55 85 85 85 110 110 110 42 66 18 42 66 18 42 66
3741 4276 2229 2700 2623 1721 2154 1924 10 8 10 10 8 10 10 8
2954 3461 1502 2540 3201 1628 2707 3355 8 8 10 10 8 10 10 8
127 123 148 106 82 106 80 57
3986 4175 2470 2832 2740 1939 2203 2132 10 8 10 10 8 9 10 8
4607 4665 4772 4800 4713 4909 4941 4943 9 8 10 10 8 9 10 8
86 89 56 59 58 39 45 43
4704 4960 3021 3194 3041 2351 2309 1979 10 8 10 10 8 10 10 8
6483 6401 6605 6640 6467 6840 6713 7150 9 8 10 10 8 10 10 8
73 78 46 48 47 34 34 28

I I I I I I I I I I I I I I I I I I I
Merritt - Johnson -20-
Series II
MAXIMUM CONTROL
In order to obtain maximum control over the steam curing
procedure, it is necessary to specify limits for the following
variables.
lo Duration of steam curing 2o Maximum curing temperature 3o Time between mixing of the concrete
and beginning of steam curing (delay time) 4o Maximum rate of temperature increase So Maximum rate of temperature decrease
In Series I, the first two variables were examinedo
Series IIA is concerned with the effect of the rate of temperature
decrease, and Series IIB with the effect of delay timeo In
Series IIC the effect of the last four variables was investigated
for one steam curing periodo
Materials and Procedures
Cement
Type . o • o o o • • o .•
Blaine Specific Surfaceo o Cube Strengtho . . . o o .
Sieve No.
l~ 1
3/4 1/2 3/8
4 8
16 30 50
100 200
Aggregate
I 3485 3 day - 2250 psi 7 day - 3250 psi
Percent Passing Sand Gravel
100 89 58 22
7.7 2o2 L4
100 100
64 29 13
Oo7

I I I I I I I I I I I I I I I I I I I
Me+ritt - Johnson -21-
Specific Gravity o o o o Cement - 3ol4 Sand - 2068 Gravel - 2068
Proportions . . . . •. o
Water-Cement Ratio
Max irnurn S 1 ump
Mixing . . •..
Molds
1:2ol6:2o21
Oo41
2~ inches
In counter-current batch mixer Dry mix - 1 minute Wet mix - 2 minutes
Batch undisturbed for 5 minutes Second wet mix 2 minutes
6 by 12 inch vertical steel 1 cylinders
Capping of test specimens:
Curing o • • • • • o
Series IIA
1 day tests with sulphur 28 day tests with neat cement
Stearn - in steam chamber 18 hours, then in moist room until tested
Control - in moist room until tested
EFFECT OF RATE OF COOLING
Discussion of Tests
At prestressed concrete plants in Iowa, the casting beds
are not protected from the weathero Stearn curing is accomplished
by covering the beams with a single or double layer of tarpaulins.
Winter temperatures a.re frequently below freezing, and concrete
beams cool quite rapidly after the steam is shut off and the
tarpaulins removed. Series IIA was set up to determine the effect
of rapid cooling on the development of strength of the concrete
after the initial steam cure period.
This study wa.s divided into two parts. The major differences
between these two parts were the differences in rate of cooling and

11 I I I I I I I I I I I I
1' 1• , I
I I I
Merritt - J'ohnson ~22-
th~ difference in lowest temperature attainedo
In the first part, twelve specimens were cast on each of
three dayso Eight specimens were placed in the steam chamber
and steamed 18 hours at 150 .F'o The remaining four specim~ns
were placed in the moist room immediately after being cast.
'rhese were the control specimens o After the steaming was complete,
four of the specimens were placed .in the moist room, and four were
placed in a freezer maintained at minus 20 F. The cooling time
to reach freezing was 2o5 hourso The cooling time to minus 20 F.
was 11 hourso The maximum rate of temperature drop, which occurred
during the first hour in the freezer, was 72 F. per houro After
48 hours in the freezer the specimens were moved to the moist room.
"rhe warming time to 32 F" was two hours. The maximum rate of
temperature rise, which occurred during the first hour in the
moist room, was 38 Fo per houro The specimens that were moved
directly from the steam cha.mbe'r to the moist room c.ooled to 74 F o
in about 4 hourso The maximum rate of cooling of these specimens
was 38 Fo per houro
The specimens that were steamed only, and the control
specimens, were tested at ages 7 days and 28 dayso It was assumed
that hydration was stopped at temperatures below freezingo
Therefore, the specimens that had been frozen were broken at
ages 9 days and 30 dayso
In the second part of this series, twelve specimens were
cast on ea.ch of three dayso Eight were placed in the steam chamber
and steamed 18 hours a.t 150 Fo The remaining four specimens were
placed irmnedia.tely after casting, in the moist room as control
specimenso Aft.er the steaming was complete, four of the specimens

I
11 I I I I I I I I I I I I I I I I I I
Merritt ·- Johnson -23·-
were placed in the moist room, and four were plac.ed in the freezer
maintained at plus 25 F. The cooling time to freezing was 6 hours.
The maximum rate of cooling was 43 Fo per houro After 24 hours in
the freezer, t.he specimens were moved to the moist roomo The warming
time to constant temperature was about 4 hourso The maximum rate
of temperature rise was 30 Fo per houro The specimens that. were
moved directly from the steam chamber to the moist .room cooled to
75 Fo in about 4 hourso
The specime.ns that were steamed only, and the control specimens
were tested at ages 7 days and 28 dayso The specimens that had been
frozen were tested at ages 8 days and 29 days"
Discussion of Results
It may be noted that the average 7 day compressive strength
of the specimens frozen for 24 hours at plus 25 F. is sl.ightly
higher than the av;erage 7 day compressive strength of the specimens
steamed onlyo This is probably due to a combination of two fact.orso
One factor being that the specimens frozen at 25 F. were .actually
frozen only about 19 hours instead of the 24 hours assumed., thereby
allowing an additional 5 hours for the cement to hydrateo The
other factor being that hydration does not completely stop at the
freezing poinL The 7 day and 28 day strengths of the concrete
which was steamed only was approximately 68 percent of .the control
strengtho The strength of the concrete frozen in either part of
the test does not appreciably differ from the strength of the
concrete steamed onlyo Therefore, it is concluded that .the very
rapid cooling rate has little effect on the strength of the concrete.

-------------------
Control
Hours .Steamed (hr o) Temperature Steamed (F o) Delay Time (hr o) Warming Rate (F/hr.)
7 Day Strength (psi) 5158 NOo of Tests 12 7 Day Steam Cured as Percent of Control 100
28 Day Strength (psi) 6935 NOo of Tests 12 28 Day Steam Cured as
Percent of Control 100
TABLE 1 SERIES II A
Frozen 24 hrs. at + 25 F.
18 150
o 60
3713 6
72
4490 6
65
Frozen 48 hrs. at - 20 F.
18 150
o 60
3327 6
65
4568 6
66
Steamed only
18 150
o 60
3566 12
69
4614 12
67
:s: (!) Ii Ii I-'· rt rt
I rv ~ I

I I I I I I I I I I I I I I I I I I I
Merritt - Johnson
SERIES II B
EFFECT OF DEJ:.AY PERIOD
Discussion of Tests
-25-
The main ,factor considered in this part of Series II was
the delay time before steaming· was startedo Four steaming
temperatures were used - 125 F, 150 F, 175 F, and 200 F. All
specimens subjected to steaming were steamed a total of 18 hourso
The delay times used were one hour, three hours, and six hourso
Test results from Series I provided addit.iona.l information on
delay times of OoO hours and Oo5 hours.
On each day three batches of six specimens .each were mixedo
The time of mixing of each batch was such that .the desired delay
time of all batches was reached at 2:30 PoM. Steaming was then
started and continued until 8:30 A.M. the next morning. From
each batch, four specimens were placed in the steam chamber and
two were placed in the moist roomo Two steam cured and one moist
cured specimen from each batch were tested at age 24 hours and
28 dayso
Discussion of Results
The results show that a delay period of a few hours prior
to steam curing produces higher st . .reng·ths at all ages than if
the concrete were steamed immediately after being casto The
higher steam curing temperatures require longer delay periods
to produce the maximum strengtho At .125 Fo about .one hour delay,
and at 150 Fo and above about three hours delay appear to be
optimumo At age one day the greatest strength was obtained by

I II I I
I I I I I I I I I I I I I I 'I I
Merritt - Johnson -26-
steaming .at 175 F. after a three hour delayo At age 28 days the
specimens which had a six hour delay period had slightly higher
strengths than those which had only three hours delayo At age
28 days the highest strengths were produced with temperatures
of 125 F. and 150 Fo after a six hour delay prior to steaming.
The results of these tests agree very closely with those obtained
over similar work done by the U.S. Bureau of Reclamation. They
conclude in their report titled "Early Strength of Concrete as
Affected by St.earn Curing Temperatures 11, "A delay of 2 to 6 hours
prior to steam curing, depending upon the temperature, produced
strengths 15 to 40 percent. higher at age 24 hours than when steam
curing was started immediately after the concrete was placed."
In Series I the concrete was severely damaged during steaming
at the higher temperatures and showed very little strength gain
during subsequent moist room curing. In .this part of Series II,
at all temperatures, the specimens given the six hour delay prior
to steaming had the best gain in strength between the one day
test and the 28 day test.

-------------------MERRITT - JOHNSON
300-:c
:c90-I-\.) I-z "' LU z a:: LU ~250- a: 80
I-...J
II)
0 ...J a:: 0 I- a:: z I-0200- z u 0
\.) LL. 0 LL.
I-060-
~ 150 I-\.) z a:: LU LU ~50-a..
w a..
100
AGE ONE DAY
50-
I I 0 2
\HOURS I
30-
I I I I I 3 4 5 6 0 DELAY FIG. 6
SERIES ll 8 MAXIMUM CONTROL OF
EFFECT OF DELAY STEAM CURING TIME
175° F
AGE 28 DAYS
I I l I I 2 3 5 6 HOURS DELAY FIG. 7

I I I I I I I I I I I I I I I I I I I
MERRITT - JOHNSON
TIME-TEMPERATURE RELATION
IL 220
II) 200 w ~ 180 I.) w 0 160
~ 140 ::::> t;( 120 a:: w a.. 100 ::?; lJJ I- 80
60 WARMING CURVES COOLING CURVES
0 5 10 0 5 TIME IN HOURS FIG. 8
SERIES n: B MAXIMUM CONTROL OF STEAM CURING
EFFECT OF DELA'< TIME

-------------------SERIES II B
Nominal Curing Temperature (F) 125 125 125 150
Warming Rate (F/hr) 34 34 34 50 Steaming Time (hr) 18 18 18 18 Delay Time (hr) LO 3o0 6.0 1. 0
1 Day Strength (psi) Steam Cured 3003 3195 3321 2861 No. of Tests 8 8 8 8 Control 1380 1470 1585 1300 No. of Tests 4 4 4 4
1 Day Steam Cured as a percent of Control 217 217 210 220
28·Day Strength (psi) Steam Cured 5574 5753 6276 4805 No. of Tests 8 8 8 8 Control 6878 6590 6888 6584 No. of Tests 4 4 4 4
28 Day Steam Cured as a percent of control 81 88 91 73
TABLE I
150 150 175 175 50 50 50 50 18 18 18 18
3.0 600 LO 3.0
3506 3393 2150 3165 8 8 10 10
1292 1295 1146 1120 4 4 5 5
271 262 188 283
5698 5969 3238 4623 8 8 10 10
6535 6710 6147 6098 4 4 5 5
87 89 53 76
175 200 50 80 18 18
6.0 1. 0
3228 2988 10 8
1220 1660 5 4
265 180
4902 3559 10 8
6302 7072 5 4
78 50
200 200 80 80 18 18
3.0 6.0
3868 3785 8 8
1630 1722 4 4
237 220
4885 4996 8 8
7215 7235 4 4
68 69
~ ro ti ti f-'o rt rt
~ 0 ::r ::l Ul 0 ::l
I I\)
\.0 I

-------------------SERIES II B TABLE II
Information Secured from Series I
Nominal Curing Temperature (F) 100 100 125 125 150 150
Warming Rate (F/br) 18 18 32 32 55 55 Steaming Time (hr) 18 18 18 18 18 18 Delay Time (hr) OoO 0.5 0.0 Oo5 0.0 0.5
1 Day Strength (psi) Steam Cured 2030 2133 2670 2737 2715 2980 NOo of Tests 3 3 4 4 4 4 Control 1533 1640 1757 1612 1875 1873 NOo of Tests 3 3 4 4 4 4
1 Day Steam Cured as a percent 0£ .control 132 1.30 152 169 145 .. 159
...
28 Day strength (psi) Steam Cured 4910 4940 4885 4977 4630 5155 NOo of Tests 3 3 4 4 4 4 Control 6647 6613 6187 5967 6285 6022 NOo of Tests 3 3 4 4 4 4
28 Day Steam Cured as a Percent of Contro,l 74 75 79 83 74 86
175 175 200 85 85 110 18 18 18
o.o 0.5 o.o
2152 2306 1538 5 5 5
1460 1544 1604 .3 5 5
147 149 96
3014 3028 2184 5 5 5
6652 6558 6690 5 5 5
45 46 33
200 110
18 0.5
1904 5
1652 5
115
2518 5
6990 5
36
:s: <D Ii Ii I-'· rt rt
c:..i g. ::l (J)
0 ::l
I w 0 I

I I ,, I I I I I
I I I I I I I I I I
Merritt - Johnson -31-
SERIES II C
MAXIMUM CONTROL
Discussion of Tests
This part of Series II was set up to show the effect of
maximum control of steam curing procedureso That is, the rate
of temperature rise, the delay time, the length of .steaming,
and the rate of cooling were all controlled as closely as
possible. The rate .of temperature rise was varied to determine
the optimum rateo Four steaming temperatures were used - 125 F,
150 F, 175 F, and 200 F. Three different delay periods were
usedo At 125 F and 150 F delays of 4.0 hours, 2o0 hours and
OoO hours were usedo At 175 F and 200 F delays of 6.0 hours
3.0 hours, and OoO hours were used. The maximum warming rates
used were as shown in the following table:
Maximum 'Warming Rates
Degrees F per Hour
125 F 150 F 175 F 200 F 28°/hr 22°/hr 30°/hr 44°/hr 33°/hr 31°/hr 40°/hr 56°/hr 39° /hr 38°/hr 53"/hr
42°/hr
On each day three batches of six specimens each were mixed.
From each batch four specimens were placed in the steam chamber
and two were placed in the moist room. The time at which each
batch was mixed was such that the desired delay time had elapsed
at 2:30 PoM. At this time a controlled quantity of steam was
turned into the steam chambero The total length of steaming was
18 hours. After steaming was complete, the specimens were cooled.

I I I I I I I .I I I 1· I I I I I I I I
Merritt - Johnson -32-
at a specified rate. They were then stored in the moist room
until tested.. Two steam cured specimens and. one moist cured
specimen from each batch were tested at ages 24 hours and 28
days.
In all cases the maximum rate .of cooling was held as near
20 F. per hour as possible.
Discussion of Results
If the primary consideration is to be one or two day
strength, one particular set of steam curing procedures should
be used. But if a maximum 28-day strength.is desired along with
high early strength, then another set of steam curing procedures
should be used.
Consider first the case where it is desired to obtain .the
maximum early-age strength. The most important point of procedure
is the delay time before steaming is started. At the ·higher
temperatures a longer delay time should be used than a.t the lower
temperatures. Up to 150 F. about .two hours delay should be used.
Above 150 F. three hours should be used. The .optimum rate of
temperature rise is also a variable. At the lower temperatures
lower rates of temperature rise are optimum. Specifically, in
this series at 125 F. a temperature rise of 28 F. per ·hour gave
the best results. At .150 F, 31 F. per hour was best. At .175 F,
40 F. per hour gave the highest strengths of the series. And at
200 F, 44 F. per hour was best. These specific figures are not
necessarily optimum.
at definite optimums.
Too few warming rates were used to arrive
This work does indicate that the .optimum
ra'):e of temperature rise in the concrete is dependent upon the

I ,, I II'
I I· I
' I I I I I I ,, I I I I
Merritt - Johnson -33-
steaming temperature used. In general, the higher the steaming
temperature, the higher the optimum rate of temperature rise.
Now consider the case where it is desired to get the maximum
possible 28-day strength along with a high early strength. Here
again the most important point of procedure is the delay time
before steaming is started.
periods give better results.
In this case, however, longer delay
In this series the best results
were obtained with a delay of four hours when .. the concrete was
steamed at 125 F. and 150 F. and a delay of six hours when the
concrete was ste aned at 17 5 F. and 200 F. The rate of temperature
rise appears to have little effect upon the 28-day strength if
a delay of four hours .or more is used. If only a short delay
is used, then the trend seems to be that the lower the rate of
temperature rise the higher the 28-day strengths. The best
28-day strengths were obtained by steaming at .150 F. after.a
four hour delay and at .175 F. after a six hour delay.

- -· -MERRITT -JOHNSON
vi "' ' I
0
8
e
Z4 "' a: f-
"' "' > iii
"' "' g: 2 :::; 0 u
STEAM CHAMBER AT 125° F
---L~~~E~~~-~~--~---~:.~· DELAY
_____ i::'.'.: DELAY ----- '\ 4 HR. DELAY
22 HR. DELAY -
NO DELAYJ:
I DAY CONTROt.;:
LEGEND I DAY TEST
28 DAY TEST
~ ~ ~ MAX. TEMP. RISE-DEGREES ~l~R
9HOUR
'·-
I I.., z "' a:
8
..
STEAM CHAMBER AT 175°F
._ 6 HR. DELAY~
-":..~.:::-=.-:=---~....:: --3 HR. DELAY,.
---- ~O DELAY __ ,
3 HR. DELA~ - ---
:n 4 ;::=- -=--==: """!
j' 6 HR. DELAY
"' > iii
"' "' a: Q. :::;
~
32 '\ I DAY CONTROL
LEGEND
l~T
28 DAY TEST
~~0~~~~3~0,--~~~4~0:--~--''--~5~0~~
M AX. TEMP. RISE - DEGREES PER HOUR F!G II
I II.) z uJ
8
g'.4 "' uJ
"' "' "' uJ a: a.
62 u
-STEAM CHAMBER AT 150° F
~__'.::~~~'.L-~4 HR. DELAY
I::'"--:::.-=.::-..:::=-::::::-.;; 2 HR. DELAY
----------l'No DELAY
v HR. DELAY
-~===:::--=--:::::::='*";r:r4';" HR DELAY
~ODELAY
I DAY CONTROL l
LEGEND l~T
2~~"..IEjT
% 30 40 50 MAX. TEMP RISE - DEGREES PER HOUR
FIG 10
SERIES II C MAXIMUM CONTROL
..
8
;;j6
"' I
I I.., z "' a: :n 4
"' > iii
"' "' a: Q.
:::; 32
-
STEAM CHAMBER AT 200°F
6 HR. DELAY~ ~
'iii DAY CONTROL
LEGEND
I DAY TEST
28 DAY TEST
44 56 MAX. TEMP. RISE - DEGREES PER HOUR
FIG 12

- - -MERRITT -JOHNSON
<11200
"' ~18 '-' ~ 160
60
<11200 "' uJ
::'5 180
"' "1
0
0
-·,
TYPICAL TIME - TEMPERATURE RELATIONS
STEAM CHAMBER AT 12 5° F
WARMING CURVE COOLING CURVE
5 10 0 TIME IN HOURS FIG 13
TYPICAL TIME -TEMPERATURE RELATIONS STEAM CHAMBER AT 175° F.
WARMING CURVE COOLING CURVE
5 10 0 TIME IN HOURS FIG 15
5
5
-· ..
SERIES II C MAXIMUM CONTROL
. .,
::l200
"' a: '-' 180
"' "160 I
~140 :::> ~ 120 a: ~ 100 '.:!
"' I-
60
"' ~200 a: :;: 180
" 160
~ 14 :::>
~ ((
"' n_ '.:! ~ 80
60
0
0
- - - -
TYPICAL TIME - TEMPERATURE RELATIONS
STEAM CHAMBER AT 150° F.
WARMING CURVE COOLING CURVE
5 10 0 TIME IN HOURS FIG 14
TYPICAL TIME - TEMPERATURE RELATIONS STEAM CHAMBER AT 200° F
WARMING CURVE COOLING CURVE
5 10 0 TIME IN HOURS FIG 16
5
-

- - - -' -' - ---- -- .. - -( - - .. ,. - - -TABLE 1 - S~RIES II C
125 F. for ·18 HOURS
Warming Rate (F/hr) 28 28 28 C* 33 3·3 Dalay Time (hr) 0 2 4 0 2
1 - Day Strength (psi) 2864 3271 .3400 1713 2883 3396 No. of Tests 8 8 8 12 8 8 1 - Day Steam Cured
a Percent of Control 167 191 198 100 156 183
28 - Day Strength (ijai) 4838 5640 6108 6965 4845 5660 No. of Tests 8 8 8 .12 8 8 28 - Day Steam Cured as
a Percent of control 69 81 88 100 73 85
TABLE 2 - SERIES II C 150 F. for 18 HOURS
Warming Rate . (F /hr) 22 22 22 C* 3+ 31 Delay Time (hr) 0 2 4 0 2
l - Day Strength (psi) 3484'. 3924 3928 1697 328'1 3995 No. of Tests 8 8 8 12 8 8 1-Day Steam Cured as
a percent of control 205 231 231 100 202 246
~8 - Day Strength (psi) 5619 6584 6610 7176 5493 6380 No. of Tests 8 8 8 12 8 8 28 - Day Steam Cured as
a Percent of Control 78 92 92 100 77 90
* C - Control
33 C* 39 4 0
3506 1853 2920 8 11 8
189 100 164
5945 6628 4554 .. 8 12 ·8
90 100 67
31 C* 42 4 0
3871 1624 3501 8 12 8
238 100 192
6551 7099 5393 8 12 8
92 100 75
39 39 2 4
3219 3459 8 8
180 194
5363 5961 8 8
79 88
42 42 2 4
4011 3993 8 8
220 219
6460 6618 8 8
89 91
:;: CD
C*l1 11 - .....
1783 12
100
6764 12
100
·C*
1823 12
. 100
7228 12
100
rt' rt'
C..j
g. ::s rn 0 ::s
I w °' I

- - ·- - -· -· - .. -· - - - •· .... I- .. - -~ CD
TABLE 3 - SERIES II C Ii
175 F. for 18 HOURS Ii ..... rt rt
Warming Rate (F/hr) 30 30 30 C* 40 40 40 C* 53 53 53 C* Delay Time (hr) 0 3 6 0 3 6 0 3 6 c..i
0 O'
1 - Day Strength (psi) .3603 4129 4181 1841 3710 4360 4101 1777 ·3433 4320 4160 1724 ~ {I)
No. of Tests 7 7 8 12 7 8 8 12 8 8 5 11 0 ~
1 - Day Steam Cured as a Percent of Control 196 224 227 100 209 245 231 100 199 250 241 100
28 - Day Strength (psi) 4974 6056 6303 7122 4804 6029 5809 6943 4328 5990 6195 7172 No .. of Tests 8 8 8 12 8 8 8 12 6 8 8 11 28 - Day Stearn ·cured as
a Percent of Control 70 85 88 100 69 87 84 100 60 83 86 100
TABLE 4 - SERIES II C 200 'F'. f.or 18 HOURS
'--'
Warming Rate (F/hr) 44 44 44 C* 56 56 56 C* Delay Time (hr) 0 3 6 0 3 6
1 - Day Strength (psi) 3419 4045 .3823 1907 3054 4026 3770 1823 No. of Tests 8 8 .6 11 8 8 8 .12 1 - Day Stearn Cur~d as
a Percent of Control 179 212 200 100 167 221 207 100 28 - Day Strength (psi) 4416 5173 5082 6781· 3986 5208 5075 6789 No •. of Tests 8 8 6 11 7 8 8 12 28 - Day Steam Cured as
a Percent .of control 65 76 75 100 5.9 77 75 100
I w -..J
* c - Control I

I I I I I I I I I I I I I I I I I
Merritt - Johnson -38-
SERIES III
TWO CEMENTS AND TWO AGGREGATES
This series was set up to study how the steam curing procedures
might need to be changed for the various aggregatP.s or brands .o.f
c.ement that might be used. Specifically two brands of cement
were used and for the coarse aggregate a commonly used limestone
and gravel were used~
Materials and Procedures
Cement (Brand A)
Type . . . o • • o o o •
Blaine Specific Surface Cube Strength . . . . .
I 3485 3 day - 2250 psi 7 day - 3200 ·psi
Cement {Brand B)
Type . . . . . . . . . . Blaine Specific Surface Cube Strength . . . . •
Aggregate
Sieve No.
1 3/4 1/2 3/8
4 8
16 30 50
100 200
Sand
100 92 67 32 11
1. 7 LO
I 2820 3 day -7 day
2000 psi 3090 psi
Percent Passing Gravel Limestone
100 64 29 13
0.7
100 67 35 17
1. 7

I I I I I I I ,, I I I
' I I I
I I
Merritt - Johnson
Specific Gravity o o •
Proportions o o •. o o • o
Water Cement Ratio o o o
Maximum Slump o • • • o •
Cement 3ol4 Sand 2068 Gravel 2.68 Limestone 2o58 1:2ol6:2o21 0.41 2~ inches
Mixing: In counter-current batch mixer Dry mix - one minute Wet mix - two minutes Batch undisturbed for five minutes Second mix two minutes
Molds: 6 x 12 inch vertical steel cylinders with machined base plates o
Capping of Test Specimens: 1-day tests with sulphur 28-day tests with neat cement
Curing: Steam - In steam chamber for 18 hours, then in moist room until tested ..
Control - In moist room until tested.
Discussion of Tests
In this series all specimens were steamed 18 hours at a
-~9-
temperature of 150 Fo Delay times of OoO hours, 2o0 hours, and
4.0 hours were usedo In all cases the maximum rate of temperature
rise was held as near 30 Fo per hour as possible. The maximum
rate of cooling was held as near 20 F. per hour as possible ..
On each day three batches of six specimens each were mixedo
F'rom each batch, four specimens were placed in the steam chamber
and two spec.imens were placed in the moist roomo The time at which
each batch was mixed was such that the desired delay time had
elapsed at 2:30 P.M. At this time a controlled quantity of steam
was allowed to flow into the steam chamber. After steaming was
complete, the specimens were stored in the moist room until testedo
Two steam cured specimens and one moist cured specimen from each
batch were tested at ages 24 hours and 28 dayso
-- ------------ _J

I I I I I I I I I I I I I I II I I I I
Merritt - Johnson -40-
Discussion,of Results
The varying fact.ors studied in this series were delay time
between casting and steaming and the four various materials - two
brands of cement, limestone, and gravelo
In the mixes using cement '0A" the highest strengths at age
24 hours were attained after a two hour delay. With c~ment "B"
at age 24 hours, the highest strengths were attained after a ·four
hour delay. This difference may be due, .·at least in part, to the
fact that cement "A" is more finely ground than cement -''B" o At
age 28 days, in all cases except one, the highest strengths were
attained after the four hour delayo The exception was the com
bination .of cement 11 B11 and limestone aggregate where the highest
.28-day strength was attained after a ·two hour delay o
Using gravel, the highest 24-hour strength was obtained by
using c.ement "A" and a two hour delay o The highest 28-day strength
was obtained by using cement "A" and a four hour delayo
Using limestone, the highest 24-hour strength and 28-day
strength was .obtained by using .cement 1'B" and a four hour delay.
Using cement "A", the highest 24-hour strength was .obtained
by using gravel and a two hour delayo The highest 28-day strength
was obtained by using limestone a.nd a two hour delay.
Using cement "B", the highest 24-hour strength and 28-day
strength was obtained by using limestone and a four hour delay.
From this it is seen that the optimum steam curing procedures
are also dependent upon the materials being used.

I I I I I I I I I I
I I I I I I I I
MERRITT - JOHNSON
8
CEMENT: A AGGREGATE: A
_..----'\.28 DAY
_.....__ __ -'I DAY
I DAY CONTROL
CEMENT!A GREGATE:B
,,, .A..28 ·DAY
..
~---"-1 DAY
EMENT:B AGGREGATE: A
-_ .........
"'28 DAY
I DAY CONTROL I DAY C NTROL ..,.._. _ ___. __ _
EMENT:B AGGREGATE: B
2 DAY CONTROL
I DAY CONTROL
0 2 40 2 4 0 2 40 2 4 FIG.17 HOURS DELAY
SERIES lII TWO CEMENTS AND TWO AGGREGATES

I I I I I I I I 1. I I I I I I I I I I
MERRITT - JOHNSON
160 ~
~ 150 w a: 140 ~ w 0 130 l.J a: 120 ~ < 110 a:
~ 100 w I- 90
80
0
WARMI~ CURVES
TYPICAL RELATION OF TIME-TEMPERATURE
COOLING CURVES
1--sTEAM OFF
6 8 10 0 2 TIME IN HOURS
SERIES m TWO CEMENTS AND TWO AGGREGATES

----~--~-----------
COMPARISONS
Cement A A A Coarse Aggregage G G G Delay Time (hr) 0 2 4
1 - Day Strength (Esi} Steam Cured 3281 3995 3871 NOo of Tests 8 8 ~ Control All Delays 1624 Noo of Tests 12
1 - Day Steam ·cured as a Percent of Control 2.02 246 238
28-Day Strength (Esi) Steam Cured 5493 6380 6551 NOo of Tests 8 8 8 Control All Delays 7099 Noo of Tests 12
28-Day ·Steam Cured as a Percent of Control 77 90 92
TABLE 1 - SERIES III OF TWO CEMENTS AND TWO 'AGGREGATES
150 F. FOR 18 HOURS
A A A B B B LS LS LS G G G
0 2 4 0 2 4
3548 3960 3633 2923 3324 3728 6 6 8 8 8 8
All Delays 1659 All Oelays 1091 10 12
214 239 219 268 305 342
5828 7000 6736 4819 5429 6064 6 6 8 8 7 8
All Delays 6908 All Delays 6206 10 12
84 101 97 78 87 98
B B LS LS
0 2
3169 3890 8 4
All Delays
300 368
5434 6703 8 4
All Delays
76 94
B LS
4
4069 8
1057 10
385
7240 8
7147 10
101
~ CD Ii Ii I-'· rt rt
y g. !:l [ll
0 !:l
I ~ w I

I I I I I I I I I I I I I I I I I I I
Merritt - Johnson -44-
SERIES IV
WATER - CEMENT RATIO
It is generally accepted that concrete will have decreased
strength with an increase in mixing water. This series was set
.up to determine what different effect, if any, an increase in
mixing water might have upon c.encrete subjected to conditions
of steam curing.
Materials and Procedures
Cement
Type . ., . . . . • . . o .•
Blaine Specific Surface ... Cube Strength o . • o " " •
Sieve Noo
1 3/4 1/2 3/8
4 8
16 30 50
100 200
Aggregate
I 2820 3 day - 2000 psi 7 day - 3090 psi
Percent Passing Sand Limestone
100 92 67 32 11
1.7 LO
100 67 35 17
1. 7
Specific Gravity .. o " • Cement 3.14 Sand 2.68 Limestone 2. 58
Proportions " " . • .1:2.16:2.21
Water-Cement Ratio
Maximum Slump • . •
0.416 0.456 2~ inches (w/c - 0.416) 5~ inches (w/c - 0.456)

I I I I I I I I I I I I I I I I I I I
Merritt - Johnson
Mixing: In counter-current batch mixer Dry mix 1 .minute
Molds:
Wet .mix 2 minutes Batch undistrubed for 5 minutes Second mix 2 minutes
6 x 12 inch vertical steel cylinders with machined base plates
Capping of Test Specimens: 1-day tests with sulphur 28-day tests with neat cement
Curing: Steam In steam chamber for 18 hours then in moist room until tested
Control - In moist room until tested
Discussion -0f Tests
Three temperatures were used - 150 F, 175 F, and 200 F.
-45-
Delay times between casting and steaming.of two hours, four hours,
and six hours were used at each temperature. At each combination
of ·steam curing procedures concrete was mixed at a two inch slump
and a five inch slumpo The only difference between the two mixes
was the quantity of mixing water.
All specimens were steamed 18 hourso The maximum rate of
temperature rise of the concrete was held as near 30 F. per hour
as possible for a steaming temperature .of 150 F, 35 F. per hour
for 175 F, and 40 Fo per hour for 200 F. From previous work these
rates of temperature rise seem to be about.optimum. The maximum
rate of cooling was held to 20 Fo per hour.or less. The·24 hour
test specimens with a .six hour delay were tested immediately at
the end of steamingo Other work, reported later in this paper,
shows that all things being equal except the temperature at the
time of testing, the cooler concrete has a slightly higher compress-
ive strength than the warmer concreteo No attempt was made in
this series to consider this difference. All .other specimens had

I I I I I
I I II
I I I I I I I I I I
I I
I
Merritt - Johnson -46-
two hours or more cooling time.
On each day three batches of six specimens each were mixed.
From each batch four specimens were placed .in the steam chamber
and two were placed in the moist room. The time at which ea~h
batch was mixed was such that the desired delay time had. elapsed
at 2:30 P.M. At this time a c.ontrolled quantity of steam was
allowed to flow into the steam chambero After steaming was
complete, the specimens were stored in the moist room until
tested. Two steam cured specimens and one moist cured specimen
from each batch were tested at ages 24 hours and 28 days.
Discussion of Results
The results were very nearly as expected.
crete with the greater slump had lower strength.
That is, the con
At .age one day
the higher slump concrete showed less reduction in strength when
steamed at 175 F. than ·When steamed at either 150 F. or 200 F. In
most cases the higher slump c.oncrete showed a greater reduction
.in strength at age 28 days than at age one day.

I I I I I I I I I I I I I I I I I I I
MERRITT - JOHNSON
200-
Cl)
LI.I 175-LIJ a: ~ 0
LI.I 150-a: ::> !;c ffi 125-Q. 2 L&J ~
100-
2
TYPICAL TIME - TEMPERATURE RELATION
WARMING CURVES
I I I I I 4 6 8 10 0 2
TIME IN HOURS
SERIES m Ef'f'ECT OF WATER-CEMENT RATIO
flG.19
6

-------------------TABLE 1 - SERIES IV
. EFFECT OF WATER - CEMENT RATIO 18 HOURS STEAM CURING
Curing Temperature (F) 150 150 150 C* 175 175 175 Warming Rate (F/hr) 35 35 35 40 40 40 Delay Time (hr) 2 4 6 2 ,4 6
W/C = Oo416 1 - Day Strength (psi) 3860 4200 1076 3861 42.18 4170 NOo of Tests 8 8 10 6 8 8 1 - Day Steam·cured as
a Percent of Control 359 391 100 341 372 •368
28-Day Strength (psi) 6725 7166 7298 7401 5382 6473 6580 NOo of Tests 8 8 6 10 6 8 8 28 - Day Stearn Cured as
a Percent of Control 91 .97 99 100 74o5 90 91
w{._c = Oo456 1 - Day Strength (psi) 3205 3.268 3146 838 3690 3813 3598 NOo of Tests 6 8 8 10 6 6 4 1 - Day Stearn Cured as
a Percent of Control 383 390 376 100 435 450 424
28 - Day Strength (psi) 5800 6078 5900 6146 5435 5628 5667 Noo of Tests 9 8 10 12 6 6 6 28 - Day Steam Cured .as
a Percent of Control 94 99 96 100 87 90 90.5
* C - Control
C* 200 200 38 38
2 4
1131 4000 4350 11 8 6
100 361 393
7222 5140 5~00
11 8 8
100 69.5 74
849 3474 3502 8 8 6
100 437 441
6267 4826 5025 9 8 8
100 74 77
200 38
6
3949 8
357
5-549 8
75
3433 8
432
4874 8
75
:3: <D Ii Ii I-'· rt
C* rt
-
1106 11
100
7396 12
100
795 11
100
6507 12
100
I
'-! g. ::s I'll 0 ::s
I .j::::. 00 I

I I I I I I I
I I
I I I I I I I I I I
1•
Merritt - Johnson
SERIES V
DEVELOPMENT OF STRENGTH IN STEAM CURED CONCRETE
49
This series was set up to study the effects of steam curing
upon concrete at several ages up to one year. Specimens were
cured at three temperatures - 150 F, 175 F, and 200 F. They were
tested at four ages - 28 days, 90 days, 180 days, and 365 days.
In this series all specimens were stored out of doors after
the first 28 hours.
The steam cured specimens were stored outside because this
treatment approximates that given to precast steam cured units
at commercial plants. The control specimens were stored outside
rather than.in the moist room so that any difference between the
two sets of specimens could be attributed to the steam curing.
Materials and Procedures
Cement
Type . . . . . . . . . I Blaine Specific surface .. 3485 Cube Strength ....... 3 day 2250
7 day 3200 Aggregate
Sieve No. Percent Passing Sand Gravel
1 100 3/4 64 1/2 29 3/8 13
4 100 0.7 8 89
16 59 30 22 50 7.7
100 2.2 200 1.4

I I I I
I I I I I I I I I I I I I I
Merritt - Johnson
Specific Gravity ... Cement 3.14 Sand 2.68 Gravel 2.68
Proportions. 1:2.16:2.21
Water-Cement Ratio 0.41
Maximum Slump ... 2~ inches
Mixing: In counter-current batch mixer Dry mix 1 minute Wet mix 2 minutes Batch undisturbed for 5 minutes Second mix 2 minutes
Molds: 6 by 12 vertical steel cylinders with machined base plates
Capping of Test Specimens: All tests with neat cement
50
Curing: Steam - In steam chamber 18 hours, then out of doors until 7 days before testing.
Control-In laboratory air for 28 hours, then out of doors until 7 days before testing; in moist room 7 days before testing.
Discussion of Tests
On each day two batches of eight specimens each were cast.
The first batch was completed three hours before steaming was
started and the second batch was completed two hours before
steaming was started. From each batch four specimens were steam
cured and four were air cured.
The steam cure was as follows: . The specimens were placed in
the steam chamber and after the desired delay time a controlled
quanitity of steam was allowed to flow into the steam chamber .
. The maximum rate of temperature rise was held as near as possible
to 25 F per hour for a steaming temperature of 150 F, 30 F per

I I I I I I I I I I I I I I I I I I I
Merritt - Johnson 51
hour for 175 F and 35 F per hour for 200 F. Total steaming time
was 18 hours. The cooling of the specimens was. held as near 20 F
per hour as possible. At age about 28 hours the steam cured
specimens were stored upright on the ground out of doors.
The cure of control specimens consisted of standing in
laboratory air, covered with plastic, for abcht 28 hours, after
which the specimens were stored in the same manner as the steam
cured.
Seven days before testing the specimens were moved to the
moist room to bring them to a uniform temperature and moisture
condition. One steam cured and one control specimen from each
batch were tested at each of the four ages.
Discussion of Results
It was observed that in the first four series the steam
cured specimens did not develop 28-day strengths equal to the
strength of the control specimens. This difference varied from
10 percent to 30 percent, with the greatest difference noted when
the curing was done at 175 F and 200 F and with a zero delay time.
In this series the specimens steam cured at 150 F and 175 F
had strengths equal to or greater than the control specimens at
all ages. The specimens steam cured at 200 F had strengths
slightly lower than the control specimens at all ages.
I I I I I I I
MERRITT - JOHNSON
I 7
I M 11?6 :.:::
J:
I t; zS LaJ a: ....
I en
4 LiJ ~ en en
I LaJ D:J Q.. ~ 0 u
I 2
I 28
AGE IN DAY~
90 I 0 365 F'IG.20
SERIES JZ:
I DEVELOPMENT OF STRENGTH IN STEAM CURED CONCRETE
I I I I

I I I I I I I I I I I I I I I I I I
!1
MERRITT - JOHNSON
Cl) w ~ 200 \!> ~ 180
~ 160 ::> !;i: 140 11'.: ~ 120 2 ~ 100
TYPICAL TIME - TEMPERATURE RELATIONS
WARMING CURVES
80 COOLING CURVES
600~~~~~~~~~~~~~~11,--~I~~~~~~~'~ 5 10 0 5 Tl ME IN HOURS FIG.21
SERIES ll DEVELOPMENT OF STRENGTH IN STEAM CURED CONCRETE

-------------------
TABLE I - SERIES V
STRENGTH AT AGES 28 TO 365 DAYS
STEAM CURED 18 HOURS
Curing Temperature (F) 150 150 150 150 175 175 175 Warming Rate (F /hr) 25 25 25 25 29 29 29 Delay Time (hr) 2 2 2 2 2 2 2
Test Age (days) 28 90 180 365 28 90 180
Stearn Cured Str. (psi) 5606 6443 6588 6955 5710 6330 6483 No. of Tests 8 8 8 8 7 7 7
Control Str. (psi) 4956 5969 6183 6713 4933 5857 6467 No. of Tests 8 8 8 8 7 7 7
Stearn cured as a Percent of Control 113 108 107 104 116 108 100
175 200 200 29 36 36
2 2 2
365 28 90
7117 4733 5366 7 8 8
6883 528.4- 6079 7 8 8
103 90 88
200 36
2
180
5981 8
6605 8
91
200 36
2
365
6070 8
7073 8
86
:s: ro Ii Ii ..... rt rt

I I I
·I I I,
I I I I I I I I I I I I I
Merritt - Johnson 55
SERIES VI
MOLDS FOR CONCRETE TEST SPECIMENS
At prestressed concrete plants in Iowa it is customary for
the plant superintendent to notify the inspector when he plans to
transfer the stress to the concrete. The inspector then tests a
number of 6 by 12 .inch concrete specimens, which have been curing
with the beams. This he does on a semi-portable compression test
machine at the plant. If the strength of the concrete specimens
is at least 4500 psi, the stress transfer is permitted. The
important point in this procedure is .that the test specimens
should remain with the beams for as long as possible before
testing.
vertical steel cylinder molds were first used for the 6 by
12 inch specimens, and it was necessary to cap the top of each
specimen. The caps were made from neat cement, and the plane
surface was obtained with glass plates. This was done shortly
after the cylinders were molded, and they were then placed with
the beams for steam curing. Good technique and considerable care
was required by this method, and the results were sometimes
unsatisfactory.
In order to overcome the capping ·problem, personnel in the
Materials Department laboratory developed a horizontal steel
mold with machined end plates which form the ends of the cylinder.
Test specimens made in these molds do not require capping.
Series VI consisted of a laboratory investigation made for

I I I I I I I I I I I I I I I I I
Merritt - Johnson 56
the purpose of comparing the strength of concrete as determined
from test specimens made in the following four types of molds:
4~ by 9 inch Vertical 4~ by 9 inch Horizontal 6 by 12 inch vertical 6 by 12 inch Horizontal
Two groups of tests were made. The first using 8000 psi
concrete; the second using 3000 psi concrete.
The specimens made in the 6 by 12 inch vertical molds were
prepared according to ASTM specifications and the strength of
these specimens should.be considered the standard against which
the strength of specimens prepared in the other molds may be
compared. Concrete.test specimens prepared in 6 by 12 inch
horizontal molds will have an indicated strength which is
93 to 97 percent of the strength of specimens containing
concrete from the same batches, but prepared in vertical molds.

--------------------
Group Type of Mold
A 4~ by 9 vertical
4~ by 9 Horizontal
6 by 12 vertical
6 by 12 Horizontal
B 4~ by 9 Vertical
4~ by 9 Horizontal
6 by 12 Vertical
6 by 12 Horizontal
TABLE I - SERIES VI
MOLDS FOR CONCRETE TEST SPECIMENS
28 - Day No. of Tests Strength (psi)
8541 3-0
8128
7894 30
7658 30
3290
3089
3201 30
2964 30
Coefficient of variation (%)
2.3
2.6
2.6
3.7
7.6
5.4
7.8
5.9
Percent of Standard
108
103
100
97
103
97
100
93
:3: CD Ii Ii ...... rt rt
Ul -...]
-- _J

I I I I I I I I I I I I I I I I I I I
Merritt - Johnson 58
SERIES VII
TEMPERATURE OF CONCRETE WHEN TESTED
At a prestressed concrete plant the test specimens are cured
with the beams, and they are not removed from the steam curing
until immediately before they are to be tested. This means that
the concrete specimens may have a temperature of almost 150 F
when tested. This series was set up to determine what effect on
strength might be expected at this high temperature.
Discussion of Tests
In order to evaluate the effect of temperature at the time
of the test on the apparent strength of test specimens, two limited
experiments were performed.
In the first experiment, the test specimens were steam cured
for 18 hours at 150 F. Half of these specimens were tested
immediately after being taken from the steam chamber and half
were cooled .to 80 F before being tested. Two different systems
were used to cool the specimens. With one system they were cooled
to 80 F in one hour, and with the other system they were cooled to
80 F irt three hours.
In the second experiment, two batches of six specimens each
were cast each day. These specimens were also steam cured at
150 F for 18 hours. At the end of steaming eight specimens were
removed from the steam chamber. Four of these were tested im
mediately and four were placed in a water bath and cooled to 80 F
,

1-----1 I I
,1
I I I I I I I I I I 'I I I II
Merritt - Johnson 59
in one hour. After this hour they were removed from the water
bath and tested immediately. The four specimens left in the steam
chamber were steamed during this additional hour. They were then
removed from the steam chamber and tested immediately.
Discussion of Results
From the results it appears that the temperature of the
concrete at the time of testing does have a slight effect on
the compressive strength. Under the particular conditions of
these experiments the difference averages about 5 percent or
about 175 psi - the cooler specimens having the higher strengths.

- - - - - - - - - -I \- ·- - - - l- - - -
Group.No.
Temperature at Test (F)
Age at Test (hr)
Cooling Time (hr)
Average Strength (psi)
Number of Tests
Strength at 150 F. as a Percent of 80 F. Strength
TABLE 1 - SERIES VII
1 1 1
150 00 80
20 21 23
0 1 3
3481 3625 3936
20 12 8
96.0, 88.5
2 2
150 80
20 21
0 1
3214 3447
16 16
93.2
2
150
21
0
3276
16
95.0
:s: CD t'i t'i I-'· rt rt
C.j 0 ::r ::s en 0 ::s
°' 0

I I I I I I I I I I I. I I I I I I I I
Merritt - Johnson 61
SERIES VIII
FIELD STUDIES
Series VIII was set up to study the steam curing procedures
.in use in commercial plants, and to determine the type and degree
of control that would be feasible for field work. It was also
desired to determine the degree of uniformity of test results that
might be expected at a commercial plant and to study the inspection
problems peculiar to steam cured, precast concrete construction
and to find solutions to these problems.
Field studies were made at two prestressed concrete plants.
In this paper they will be referred to as Plant A and Plant B.
Materials and Procedures
Plant A
Cement
Type. . . . . . . . . Blaine Specific Surface . Cube Strength . . . . . .
Aggregate
Sieve
1 3/4 3/8
4 8
16 30 50
100 200
1 3450 3 day 2750 psi 7 day 3560 psi
Percent Passing Sand Gravel
100 82
100 33 97 2 78 0 60 35 10
1.2 0.4

I Merritt - Johnson
I I I I I I I I I I I I I I I I I I
Specific Gravity .. Cement 3.14 Sand 2.66 Gravei 2.68
Proportions .... 1:1.93:2.35
Water-Cement Ratio. 0.35
Maximum Slump . . . 3 inches
62
Pozzolith Type 3 .. ~ lb. per sack cement
Mixing.
Molds .
. . In transit-mix trucks
6 by 12 inch horizontal steel cylinders with machined end plates
Curing ....... Steam - Cured with bridge
.PLANT B
Cement
beams until tested Control - Covered with plastic
membrane 2 days then in moist room until tested
Type . . . . . . . . . . . 1 Blaine Specific Surface .. 3400 Cube Strength ....... 3 day 2400 psi
7 day 3500 psi
Aggregate
Sieve Percent Passing Sand Gravel
1 3/4 3/8
4 8
30
100 94 90 72 27
Specific Gravity .. Cement 3.14 Sand 2.69 Gravel 2.63
Proportions ..... 1:2.18:2.41
100 93 37
5 2

., I I I I I I I I I I I I I I I I I I
Merritt - Johnson 63
Water-Cement Ratio. 0.26
Maximum Slump . . . 3 inches
Pozzolith Type 8 .. ~ pound per sack cement
Mixing. In transit-mix trucks
\ Molds 6 by 12 inch horizontal steel
cylinders with machined end plates
Curing ....... Steam - Cured with bridge beams until tested
Control-Covered with plastic membrane 2 days then stored under water until tested
Discussion of Tests
Plant A
On each day five batches of concrete were used to cast a line
of beams. Four specimens were made from each of the five batches.
Three of the four specimens were placed along the line where concrete
from the same batch was placed. The fourth specimen was moist cured.
On each of four days a thermocouple was placed in the center of
one steam cured specimen from each batch. On the same four days a
thermocouple was placed about three inches deep in the top of the
beam at each of five stations along the length of the line. See
Figure 1 A. A set of typical results is summarized in Table 3.
On each of three other days a thermocouple was placed in the
center of one steam cured specimen from each batch. The specimens
were distributed along the line in the same five positions as before.
On these three days, five thermocouples were distributed through the
cross-section of the beam as shown in Figure 1 B. Typical results
are summarized.in Table 4.

I I I I I I I I I I I I I I I I I I_ ,-
Merritt - Johnson 64
At the end of the steaming cycle, which was age about 45 hours,
one or two specimens from each of the five stations were tested.
All other steam cured specimens and all moist cured specimens were
tested at age 28 days.
Plant B
The discussion of tests at plant B is identical to that of
plant A with one exception. At plant B temperatures were recorded
and specimens cured at only four stations along the length of the
line instead of five stations. Typical results of the steam
curing temperatures are summarized in Table 5 and Table 6.
Discussion of Results
Plant A
After the beams were cast a period of two hours was allowed
to elapse before the steam was turned onto the line. The increase
in temperature during the first two hours was due only to the heat
of hydration. In only one case the temperature reached 100 F before
age two hours. The maximum rate of temperature rise of the concrete
varied from 12 F per hour to 39 F per hour. The maximum tempera
tures attained during the several cycles recorded varied from 151 F
to 173 F.
After about 15 hours of steaming the canvas covers were
removed and the forms were stripped off the beams•. The maximum
temperature drop during stripping varied from 16 F to 40 F. The
time required for stripping was about 2.5 hours. To reduce this

I I I I I I I I I I I I I I I I I I I
Merritt - Johnson 65
temperature drop it was suggested that only half of the line be
uncovered at a time and that steam be supplied to the other half.
This procedure is now being used. After stripping, steaming was
continued for about 12 hours. The canvas covers were left in
place for about 12 hours after the steam was shut off to control
the cooling rate. The cooling rate varied from 3 F per hour to
11 F per hour.
The control of distribution of steam along the length of the
line was very good. The maximum difference in temperature along
the line varied from 3 F to 10 F. The conclusion that the degree
of control here is good is borne out by the fact the difference
1-n compressive strength along the line is very :;'§mall.
' The distribution of steam around the beams was good also.
The difference .in temperature through the cross-section av~raged
only 5 F. At this plant the deck plates of the casting bed are
supported about three inches above the concrete floor slab. This
allows steam to circulate all the way around the beams.
Plant B
Immediately after the casting of the beams was complete, the
line was covered and the steam was turned on. The maximum rate
of temperature rise of the concrete varied from 7 F per hour to
13 F per hour. The maximum temperature attained during the
several cycles recorded varied from 129 F to 165 F. The normal
average temperature was about 130 F.

I I I I I I I I I I I I I I I I I I I
Merritt -·Johnson 66
After about 15 hours of steaming the canvas covers were
removed and the forms were stripped off the beams. The maximum
temperature drop during stripping varied from 8 F to 12 F. The
time required for stripping was about three hours. In most cycles
the steam was turned off while any work was being done on an
adjacent line. The total time of interruption of steaming was
from four hours to nine hours. After the steaming was completed,
the canvas covers were left in place as long as possible to reduce
the rate of cooling. The maximum rate of cooling was 5 F per hour.
The control of distribution of steam along the line was good.
It should be noted that the compressive strengths at station one
shows somewhat lower than at the other three stations. This is
explained by the fact that the concrete at station one was the
last to be placed and had no delay time at all.
The distribution of steam around the beam was not as good
as at plant A. Here the forms set directly on the concrete floor
slab. The only path open to the steam then is up and over the top
of the beam and down. The temperature through the cross-section
was fairly uniform except for the lower flange of the beam on the
side opposite from the steam line.

I 28
I Sta. Sta. Sta. Sta. Sta. i 2 3 4 5
I Line 1
I I
rd Line 2 <I) 1-1 r:t: ~
I t> rd Line 3 lj
I Line 4
I Figure lA
I I I 0
5
I These Figures show the distri-
I 0 bution of thermocouples used in 4 the field study both along .the
line and through the cross-section.
I I 0
3
I 0 0 1 2
Figure lB
~Steam Line I 'I I

I I I I I I I I I I I I I I I I I I I
Fig. 2
General view of a Prestressed Concrete Plant in Iowa
Instruction Board Fig . 3
De t a iled i ns truction s covering all anticipat ed steam curing situa tions a r e posted her e .
-68-

I I I I I I I I I I I I I I I I I I I
Fig . 4
Point of distribution of steam to any part of the plant .
Fig . 5
View at the center of a line showing a beam on casting bed , steam line, and va lves to direct steam eithe r way from center .
- 69-
-------------------TABLE I - SERIES VIII :s:
<D Ii Ii
PLANT A I-'· rt-rt-
station Station Station Station Station ~
1 2 3 4 5 0 ::T ::s u~
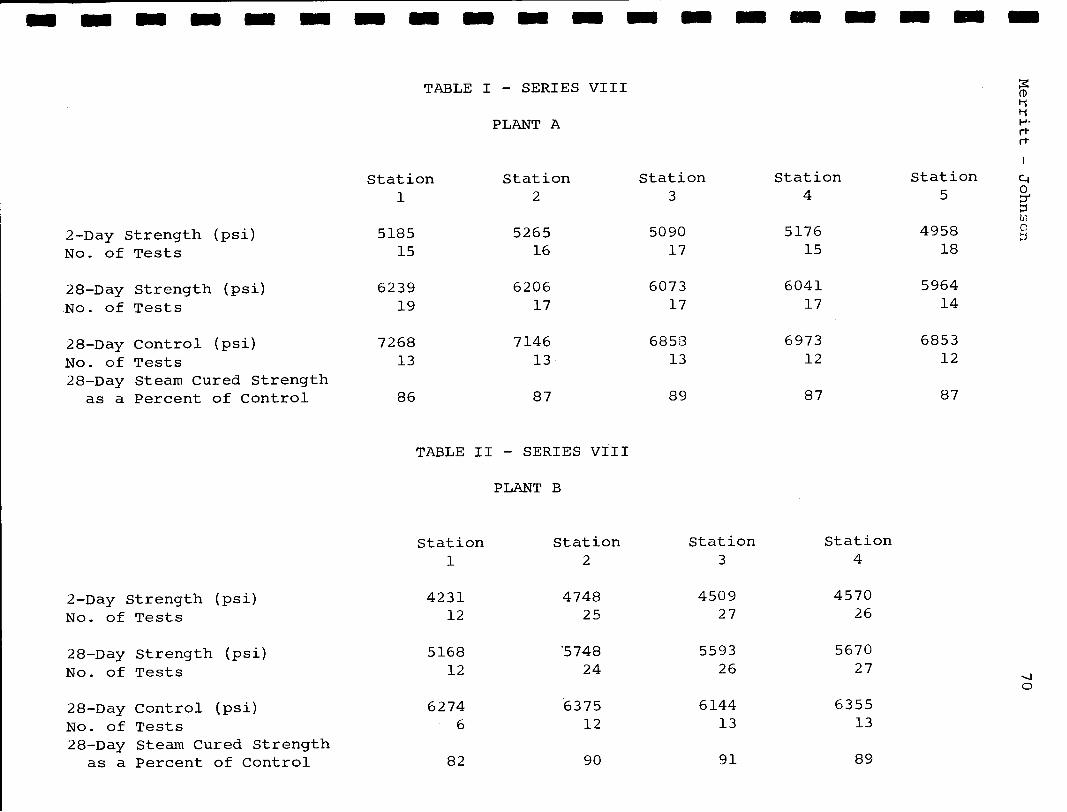
2-Day Strength (psi) 5185 5265 5090 5176 4958 CJ ::-.i
No. of Tests 15 16 17 15 18
28-Day Strength (psi) 6239 6206 6073 6041 5964
No. of Tests 19 17 17 17 14
28-Day Control (psi) 7268 7146 6858 6973 6853
No. of Tests 13 13 13 12 12
28-Day Stearn Cured Strength as a Percent of Control 86 87 89 87 87
TABLE II - SERIES VIII
PLANT B
Station Station station Station 1 2 3 4
2-Day Strength (psi) 4231 4748 4509 4570
No. of Tests 12 25 27 26
28-Day Strength (psi) 5168 '5748 5593 5670
No. of Tests 12 24 26 27 '1 0
28-Day control (psi) 6274 6375 6144 6355
No. of Tests 6 12 13 13
28-Day Stearn Cured Strength as a Percent of Control 82 90 91 89

-~-----------------TABLE III - SERIES VIII :s:
ro Ii Ii
PLANT A I-'· rt
Typical Time - Temperature Relations rt
Along Length of Line c..i
Time After Place- Station Station Station Station Station 0 ::r'
ment of Concrete (hr) 1 2 3 4 5 ::s en 0 ::s
0 80 80 82 82 79 5 125 129 120 132 120
10 154 157 146 161 153 15 156 159 154 163 155 20 150 156 144 160 150 25 136 146 139 146 133 30 .132 139 127 148 123 35 116 119 116 126 104 40 90 88 90 91 80
TABLE IV - SERIES VIII
PLANT A Typical Time-Temperature Relations
Through Cross-Section of Beam
Time After Place- Station Station Station Station Station ment of Concrete (hr) 1 2 3 4 5
0 80 80 81 83 82 5 131 140 126 136 148
10 166 173 171 173 175 15 166 172 166 171 175 20 135 132 141 140 133 25 159 161 160 168 155 -...]
30 144 141 148 152 140 1--'
35 122 114 126 126 118 40 101 92 104 103 98

-------------------TABLE V - SERIES VIII ~
CD ti 11
PLANT B I-'· rt
Typical Time - Temperature Relations rt
Along Length of Line 4
Time After Place- Station Station Station Station 0 ·~
ment of Concrete (hr) 1 2 3 4 ::s Ul 0 ::s
0 95 97 96 97 5 121 132 132 128
10 123 132 135 131 15 130 139 141 137 20 122 131 131 130 25 131 140 138 136 30 119 131 129 127 35 117 134 130 127 40 95 100 102 116
TABLE VI - SERIES VIII
PLANT B Typical Time - Temperature Relations
Through Cross-Section of Beam
Time After Place- station Station Station Station Station ment of Concrete (hr) 1 2 3 4 5
0 99 98 97 100 96 5 124 127 129 129 132
10 124 134 134 137 137 15 128 135 138 139 140 20 123 127 129 132 133 25 119 120 122 122 -....]
30 118 122 123 123 N
35 111 113 119 119


![New York Post · %]` 8`RfOMV`UM T_ 3TV`XfUb '`dKO\MF 'd\`Ud` fUb %`d]UTXT^F 8\O`dMTOfM` I\XX dTUbKdM fNd\`UM\_\d NMKbF TU f\O_XTI e`]fJ\TO M]OTK^]TKM RTOM\TUN T_ M]` -`I mTOZ 9\MF](https://img.pdfslide.net/doc/110x75/5f160eb5161ca011701be113/new-york-post-8rfomvum-t-3tvxfub-dkomf-dud-fub-dutxtf-8odmtofm.jpg)


![[Zelda.com.br] oo t_-_taiwan](https://img.pdfslide.net/doc/110x75/558fc2a51a28abe7668b4773/zeldacombr-oo-t-taiwan.jpg)