Embed Size (px)
Citation preview

Steamboat Springs Economic Summit 2010The Changing Tourism Environment
RRC Associates, an STR CompanyMay 20, 2010
Page 2
Outline• Sales Tax Revenue • Hotel Occupancy/Rate• MTRiP• Travel Intentions• Steamboat Summer • Ski Resort Industry• Observations

Page 3
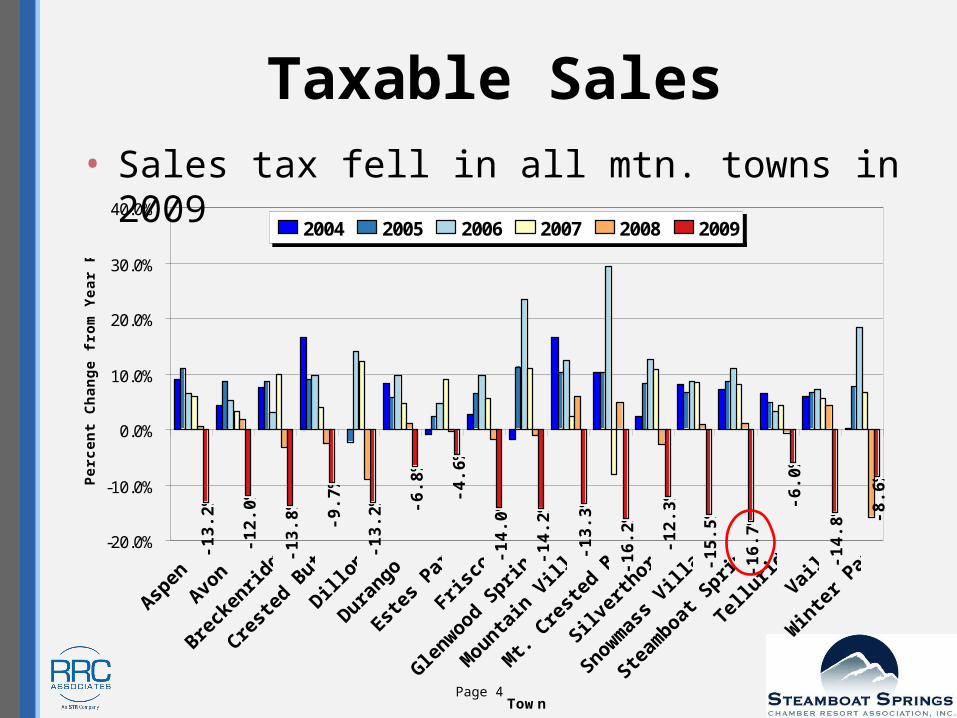
Sales and Lodging Tax• Mountain town sales tax down 12.3%
in 2009• Steamboat Springs taxable sales down
16.7% in 2009• Mountain town lodging tax down
19.1% in 2009• Steamboat Springs lodging tax down
23.4% in 2009
Page 4
Taxable Sales• Sales tax fell in all mtn. towns in 2009
-13.
2%
-12.
0%
-13.
8% -9.7
%
-13.
2%
-6.8
%
-4.6
%
-14.
0%
-14.
2%
-13.
3%
-16.
2% -12.
3%
-15.
5%
-16.
7%
-6.0
%
-14.
8%
-8.6
%
-20.0%
-10.0%
0.0%
10.0%
20.0%
30.0%
40.0%
Aspen
Avon
Brecke
nridge
Crested
ButteDillo
n
Durango
Estes P
ark
Frisco
Glenwood Sprin
gs
Mountain Villa
ge
Mt. Cre
sted Butte
Silvert
horne
Snowmass V
illage
Steamboat
Springs
Tellu
ride Vail
Winter Park
Town
Per
cen
t C
han
ge
fro
m Y
ear
Pri
or
2004 2005 2006 2007 2008 2009

Page 5
Lodging Taxable Sales• Lodging tax change more variable
Selected Mountain Towns Percent Change in Lodging Taxable Sales from Year Prior
-24.
8%
7.9%
-17.
8%
1.8%
-15.
4% -9.9
%
-8.1
%
-3.5
%
-35.
0%
-11.
5%
-14.
2%
-22.
2%
-19.
8%
-23.
4%
-22.
4%
-19.
6%
-20.
5%
-40.0%
-20.0%
0.0%
20.0%
40.0%
60.0%
80.0%
Aspen
Avon
Brecke
nridge
Crested
ButteDillo
n
Durango
Estes P
ark
Frisco
Glenwood Sprin
gs
Mountain Villa
ge
Mt. Cres
ted Butte
Silvert
horne
Snowmass V
illage
Steamboat
Springs
Tellu
ride
Vail
Winter Park
Town
Per
cen
t C
han
ge
fro
m Y
ear
Pri
or
2004 2005 2006 2007 2008 2009

Page 6
Share of Sales Tax by SeasonShare of Taxable Sales by Season, Selected Mountain Towns
41.7%
58.3%
0.0%
10.0%
20.0%
30.0%
40.0%
50.0%
60.0%
70.0%
80.0%
90.0%
Snowmass V
illage
Vail
Winter P
ark
Mt. Cres
ted B
utte
Mountain V
illage
Brecke
nridge
Avon
Steamboat
Springs
Dillon
Aspen
Frisco
Tellu
ride
Silvert
horne
Glenwood S
prings
Durango
Crested
Butte
Estes P
ark
Sh
are
of
Taxa
ble
Sal
es b
y S
easo
n
Share of Taxable Sales May to Oct
Share of Taxable Sales Nov to Apr

Page 7
Outline• Sales Tax Revenue • Hotel Occupancy/Rate• MTRiP• Travel Intentions• Steamboat Summer • Ski Resort Industry• Observations

Page 8
Total United States% Change YTD by Week
2.3%
-3.6%
12.6%
5.5%
2.4%
5.7% 6.4%
-4.3% -4.4%
-0.4%
1.4%
-2.4% -1.5% -0.8%
-10%
-5%
0%
5%
10%
15%
Mar YTD 4/3 4/10 4/17 4/24 5/1 5/8
Occupancy % Chg ADR % Chg
Most recent data shows US hotel occupancy rising, ADR following

Page 9
Total United States% Change 12 Mos Ended March
-3.8
-6.4
-0.1
-6.5
-2.9
-5.8
-8.1
-13.5
2.8 3.1
-16
-12
-8
-4
0
4
Supply Demand Occupancy ADR RevPAR
2009 2010
For past 12 months, all US indicators down

Page 10
Resort Properties% Change 12 Mos Ended March
1.5
-7.2-8.6
-3.2
-11.5
1.5
-2.2-3.6
-9.6-12.8
-20
-10
0
10
Supply Demand Occupancy ADR RevPAR
2009 2010
2009 generally worse for resort hotels, but over past 12 months,
indicators were less down for resort hotels than for total US

Page 11
Resort Properties% Change March 2010 YTD
1.7
-11.6-13.1
-11.8
1.44.5
3.1
-4.6-1.7
-23.3-25
-20
-15
-10
-5
0
5
10
Supply Demand Occupancy ADR RevPAR
2009 2010
Demand and occupancy were up in first three months of 2010 for resort hotels. Rates and
RevPAR still negative, but improving.

Page 12
Occupancy/ADR % Change 12 Mos Ended March
-2.9
-6.5-5.5
-7.8
-3.7
-7.4
-11.6
-8.8
-11
-1.7
-9.6
-2.5
-15
-10
-5
0
5
Urban Suburban Airport Interstate Resort Small Metro
Occupancy ADR
Resort hotels down similar to other
location segments

Page 13
Occupancy/ADR % Change March 2010 YTD
3.44.9
-3.2
3.1
-2.3
-4.7-6.0
-8.0
-0.4
-4.6
-1.2
5.9
-15
-10
-5
0
5
10
Urban Suburban Airport Interstate Resort Small MetroOccupancy ADR
Resort hotel performance mixed compared to other
segments over past 3 months

Page 14
Mtn. Town vs. US ADR
$215$229
$245$262
$240
$91 $98 $104 $107$98
$0
$50
$100
$150
$200
$250
$300
2005 2006 2007 2008 2009
Year
AD
R
MTRiP ADRU.S. ADR
-
-

Page 15
Outline• Sales Tax Revenue • Hotel Occupancy/Rate• MTRiP• Travel Intentions• Steamboat Summer • Ski Resort Industry• Observations

Page 16
MTRiP Data• MTRiP collects reservation data from
hotels and property managers from 13 western mountain destinations
• Booking windows continue to shorten, as consumers wait to plan their trips until the last minute
• Lodging properties need to be increasingly nimble and creative

Page 17
MTRiP Data• Overall, last winter ADR was down, but
looking up for this summer
2008/09 2009/10 Change
Occupancy – last 6 months
40.3% 40.9% +1.4%
Occupancy – next 6 months
12.5% 12.6% +0.9%
ADR – last 6 months
$305 $287 -5.8%
ADR – next 6 months
$168 $173 +3.4%

Page 18
Outline• Sales Tax Revenue • Hotel Occupancy/Rate• MTRiP• Travel Intentions• Steamboat Summer • Ski Resort Industry• Observations

Page 19
Travel Intentions Survey
• Quarterly survey of business and leisure travelers
• Nationally representative sample of 3,806 respondents
• Explores current sentiment, past travel behavior, and future travel intent

Page 20
Confidence in Stability of Job
48%
35%
17%
39% 40%
20%
0%
10%
20%
30%
40%
50%
60%
Very confident Somewhat confident Not at all confident
HOW CONFIDENT ARE YOU IN THE STABILITY OF YOUR JOB OVER THE NEXT 12 MONTHS
Perc
ent R
espo
ndin
gConfidence Level in Stability of Job by Incidence of Mountain Travel
Mountain Travel in Past 12 Months
No Mountain Travel in Past 12 Months
Page 21
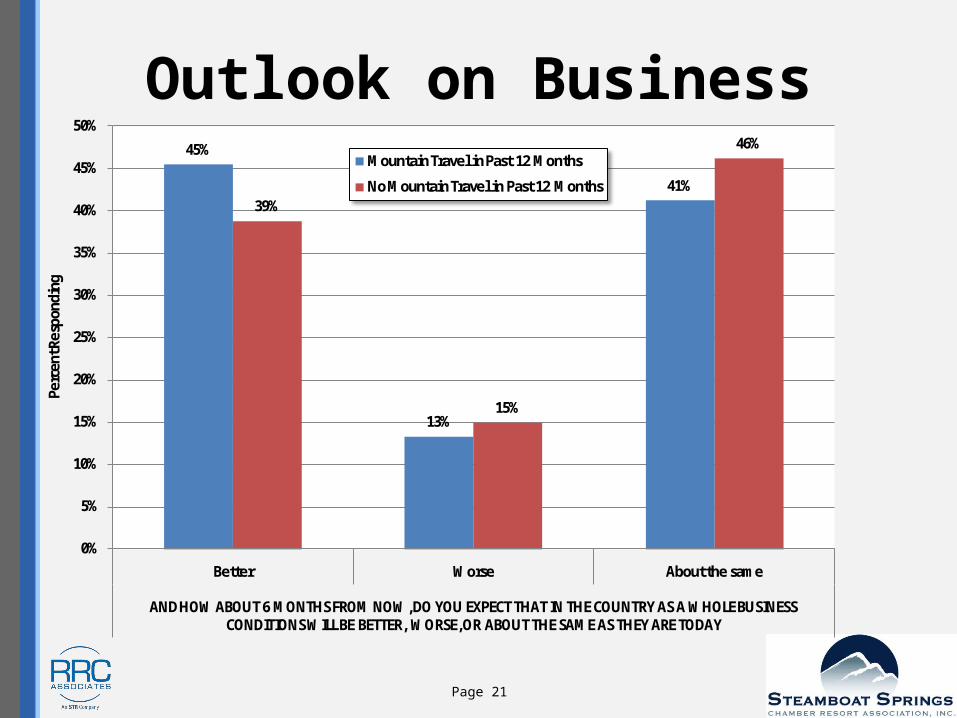
45%
13%
41%39%
15%
46%
0%
5%
10%
15%
20%
25%
30%
35%
40%
45%
50%
Better Worse About the same
AND HOW ABOUT 6 MONTHS FROM NOW, DO YOU EXPECT THAT IN THE COUNTRY AS A WHOLE BUSINESS CONDITIONS WILL BE BETTER, WORSE, OR ABOUT THE SAME AS THEY ARE TODAY
Perc
ent R
espo
ndin
gPerceived Outlook for Business by Incidence of Mountain Travel
Mountain Travel in Past 12 Months
No Mountain Travel in Past 12 Months
Outlook on Business
Page 22
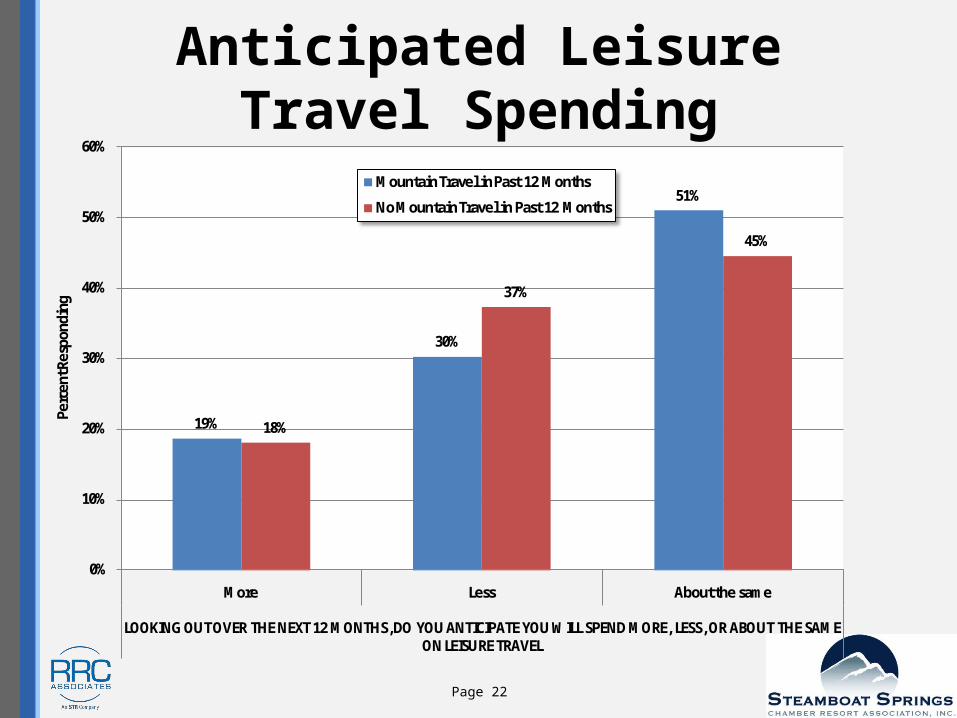
19%
30%
51%
18%
37%
45%
0%
10%
20%
30%
40%
50%
60%
More Less About the same
LOOKING OUT OVER THE NEXT 12 MONTHS, DO YOU ANTICIPATE YOU WILL SPEND MORE, LESS, OR ABOUT THE SAME ON LEISURE TRAVEL
Perc
ent R
espo
ndin
gAnticipations Regarding Leisure Travel Spend
by Incidence of Mountain Travel
Mountain Travel in Past 12 Months
No Mountain Travel in Past 12 Months
Anticipated Leisure Travel Spending

Page 23
0%
5%
10%
15%
20%
25%
30%
Less than $25,000
$25,000 -$34,999
$35,000 -$49,999
$50,000 -$74,999
$75,000 -$99,999
$100,000 -$149,999
$150,000 -$199,999
$200,000 -$249,999
$250,000 or more
Perc
ent R
espo
ndin
g
Average Household Income
Annual Houeshold Income by Incidence of Mountain Travel
No Mountain Travel in Past 12 Months
Mountain Travel in Past 12 Months
Average Household IncomeMountain Travel in Past 12 Months 101,924$ No Mountain Travel in Past 12 Months 78,757$
Household Income of Travelers

Page 24
22% 21% 22%20%
16%
42%
22%
17%
9%10%
0%
5%
10%
15%
20%
25%
30%
35%
40%
45%
$1000 and Under $1001 to $2000 $2001 to $4000 $4001 to $6000 More than $6000
WHAT WAS THE TOTAL AMOUNT YOUR HOUSEHOLD SPENT ON ALL TRAVEL COMPONENTS FOR THE LEISURE TRIPS YOU HAVE TAKEN IN THE PAST 12 MONTHS
Perc
ent R
espo
ndin
g
Amount Spent on Leisure Travel Over Past 12 Monthsby Incidence of Mountain Travel
Mountain Travel in Past 12 Months
No Mountain Travel in Past 12 Months
Spending on Leisure Travel in Past 12 Months
Page 25
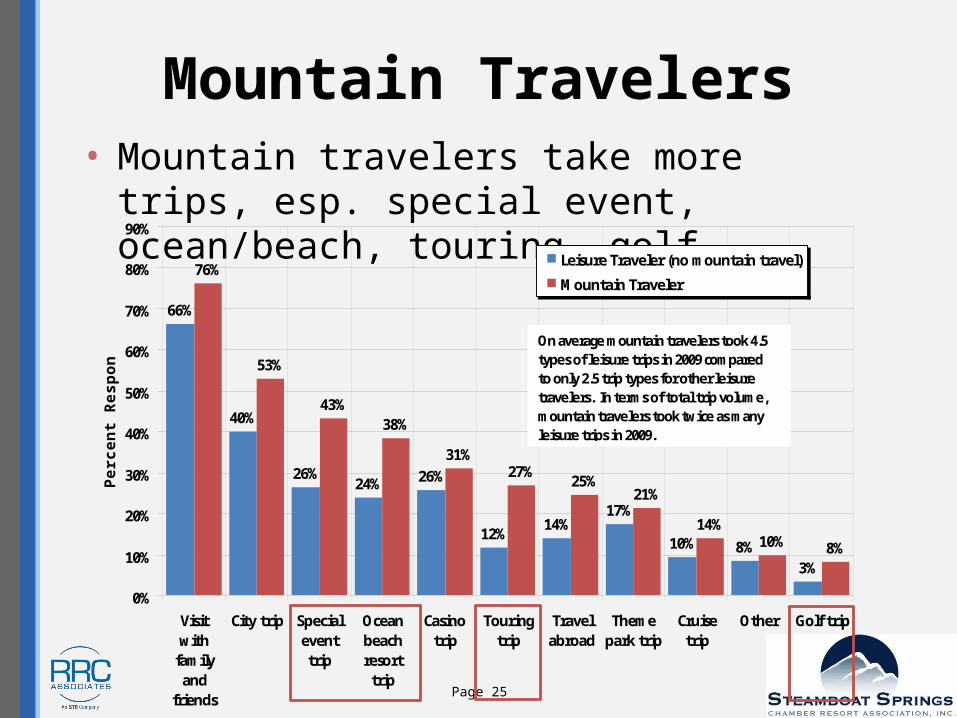
Mountain Travelers• Mountain travelers take more trips, esp.
special event, ocean/beach, touring, golf
66%
40%
26%24% 26%
12%14%
17%
10% 8%3%
76%
53%
43%38%
31%27%
25%21%
14%10% 8%
0%
10%
20%
30%
40%
50%
60%
70%
80%
90%
Visitwith
familyand
friends
City trip Specialeventtrip
Oceanbeachresort
trip
Casinotrip
Touringtrip
Travelabroad
Themepark trip
Cruisetrip
Other Golf trip
Perc
ent
Resp
ondi
ng
Leisure Traveler (no mountain travel)
Mountain Traveler
On average mountain travelers took 4.5 types of leisure trips in 2009 comparedto only 2.5 trip types for other leisure travelers. In terms of total trip volume, mountain travelers took twice as many leisure trips in 2009.

Page 26
Outline• Sales Tax Revenue • Hotel Occupancy/Rate• MTRiP• Travel Intentions• Steamboat Summer • Ski Resort Industry• Observations

Page 27
Steamboat Summer• Summer visitors have positive
impression of amenities/things to do, the town in general, and friendly people
• Weaknesses include air transportation, shopping/retail mix, prices, and nightlife
• Stay an average of 5.3 nights• 58% have made previous summer visit• 42% have made previous winter visit• Mainly families and empty nesters

Page 28
Outline• Sales Tax Revenue • Hotel Occupancy/Rate• MTRiP• Travel Intentions• Steamboat Summer • Ski Resort Industry• Observations

Page 29
US Ski Season 2009/10• Total skier visits of 59.7 million, up 4.2%
from 2008/09• All regions were up except Northeast;
all regions above 10-year average• Snowfall down and/or variable• Days open declined by 2 days nationally• Visitation generally down in the early
season, up after New Year’s and up strongly starting President’s Weekend

Page 30
US Ski Season 2009/10• Overnight visitation, international
visitation, percent paid tickets, and ticket yield all up slightly
• Lesson volumes increased• Snowboarding inched up, to 32.5%• Capital expenditures projected to rise• Demographics continue to be
challenging• Overall a positive season by many
measures
Page 31
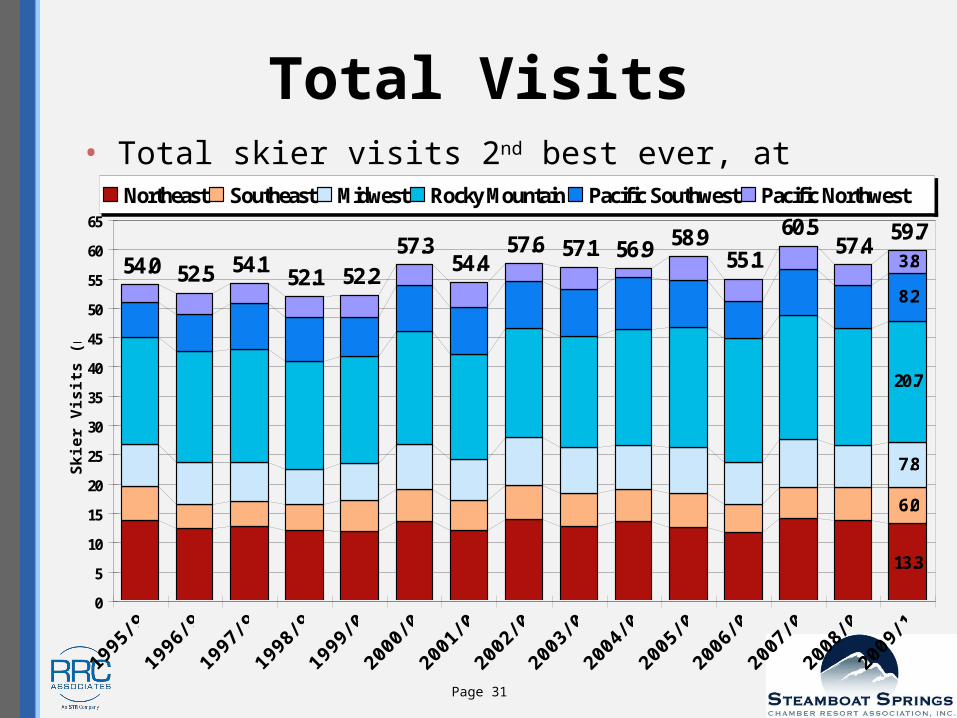
Total Visits• Total skier visits 2nd best ever, at 59.7 million
54.0 52.5 54.152.1 52.2
57.354.4
57.6 57.1 56.9 58.955.1
60.557.4
59.7
13.3
6.0
7.8
20.7
8.2
3.8
0
5
10
15
20
25
30
35
40
45
50
55
60
65
1995
/96
1996
/97
1997
/98
1998
/99
1999
/00
2000
/01
2001
/02
2002
/03
2003
/04
2004
/05
2005
/06
2006
/07
2007
/08
2008
/09
2009
/10
Skie
r Vis
its (m
illio
ns)
Northeast Southeast Midwest Rocky Mountain Pacific Southwest Pacific Northwest

Page 32
Total Visits by Region• All regions above their 10-year average
12
.5
5.8
7.8
20
.7
7.9
4.1
11.8
4.9
7.2
20
.8
6.5
3.8
14
.3
5.2
8.1
21
.3
7.6
4.0
13
.7
5.7 7
.2
20
.0
7.1
3.6
13
.3
6.0 7
.8
20
.7
8.2
3.8
13.2
5.57.6
19.8
7.8
3.60
5
10
15
20
25
Northeast Southeast Midwest RockyMountain
PacificSouthwest
PacificNorthwest
Skie
r Vis
its (m
illio
ns)
2005/06 2006/07 2007/08 2008/09 2009/10 10-season avg.
Page 33
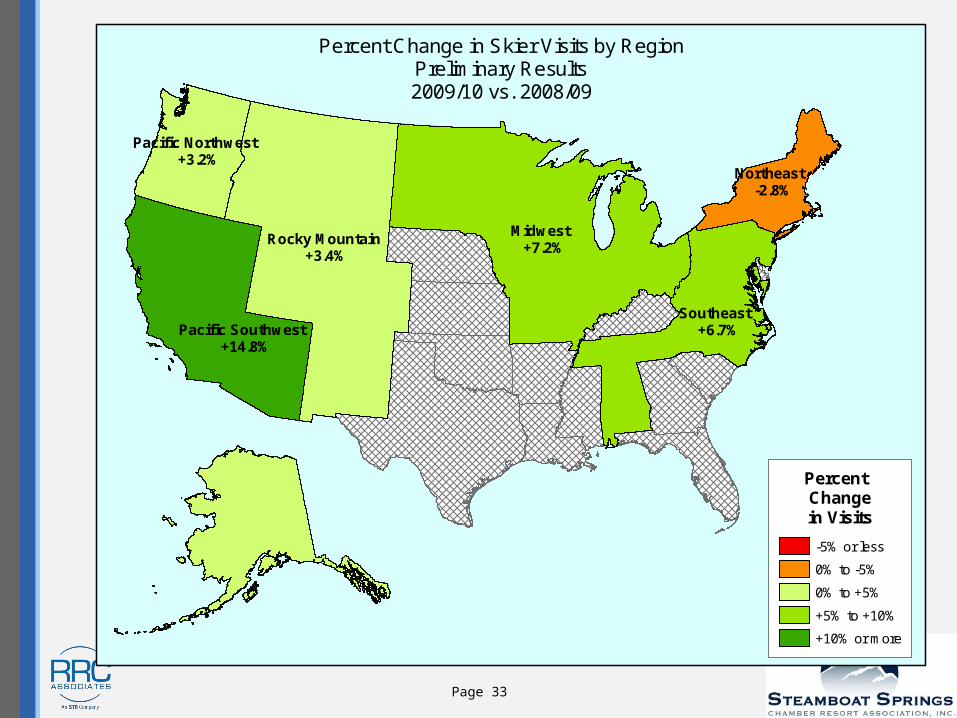
Regional Level MapNortheast
-2.8%
Rocky Mountain+3.4%
Pacific Northwest+3.2%
Midwest+7.2%
Southeast+6.7%Pacific Southwest
+14.8%
Percent Change in Skier Visits by RegionPreliminary Results2009/10 vs. 2008/09
Percent Changein Visits
-5% or less
0% to -5%
0% to +5%
+5% to +10%
+10% or more

Page 34
Skier Visits by State• Top 5 states account for over half of
total US skier visits
California12.2%
Vermont6.8%
Utah6.8%
New York6.7%
Wisconsin4.1%
Idaho2.6%
All Other States (20)10.7%
Pennsylvania6.0%
Michigan3.7%
New Hampshire3.6%
Oregon2.8%
New Mexico1.7%
Montana2.2%Massachusetts
2.4%Minnesota2.4%
Washington2.9%
Colorado20.2%
Maine2.2%

Page 35
Cumulative Visits by TOS• Caught up to prior year by mid-FebCumulativ e Skier Visits by Time of Season,
2009/10 v s. 2008/09
-12.2%
-3.9%
0.5%
3.6% 4.2%
0.0
10.0
20.0
30.0
40.0
50.0
60.0
70.0
Thru Dec 18 Thru Jan 3 Thru Feb 15 Thru Mar 28 Total Season
Skie
r Vis
its (M
illio
ns)
-14%
-12%
-10%
-8%
-6%
-4%
-2%
0%
2%
4%
6%
Perc
ent C
hang
e
Cumulative skier visits 2009/10Cumulative skier visits 2008/09Cumulative percent change

Page 36
8.76
9.64
8.76
9.29
10.50
9.87 10.07 9.65 9.59
10.04
9.22
10.37 9.88
-
2.00
4.00
6.00
8.00
10.00
12.00
1996/97 1997/98 1998/99 1999/00 2000/01 2001/02 2002/03 2003/04 2004/05 2005/06 2006/07 2007/08 2008/09
To
tal
Act
ive
Do
mes
tic
Ski
ers/
Sn
ow
bo
ard
ers
(in
mil
lio
ns)
Season
Total Active Domestic Skiers/Snowboarders:1996/97 to 2008/09
Only about a 1% annual rate of growth in participants since 1996/97
Total ACTIVE Domestic Skiers/Snowboarders:1997/1998 to 2008/2009

Page 37
Outline• Sales Tax Revenue • Hotel Occupancy/Rate• MTRiP• Travel Intentions• Steamboat Summer • Ski Resort Industry• Observations
Page 38
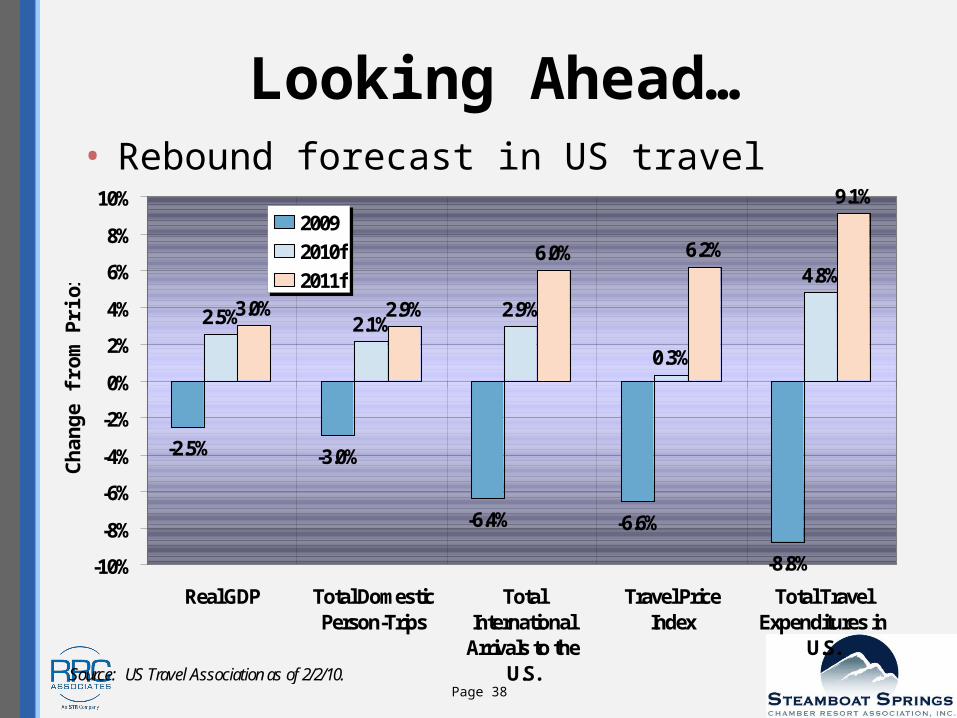
Looking Ahead…• Rebound forecast in US travel
Forecast of Selected Economic and Travel Indicators2009 - 2011
-2.5% -3.0%
-6.4% -6.6%
-8.8%
2.5% 2.1%2.9%
0.3%
4.8%
3.0% 2.9%
6.0% 6.2%
9.1%
-10%
-8%
-6%
-4%
-2%
0%
2%
4%
6%
8%
10%
Real GDP Total DomesticPerson-Trips
TotalInternational
Arrivals to theU.S.
Travel PriceIndex
Total TravelExpenditures in
U.S.
Cha
nge
from
Prio
r Yea
r
2009
2010f
2011f
Source: US Travel Association as of 2/2/10.

Page 39
US Hotel Forecast• Gradual recovery forecasted (esp. 2011)
3.7%
2.8%
0.3%
-0.3
%
-4.4
%
-8.6
%
1.3% 1.8%
4.2% 5.
5% 7.5%
6.2%
2.7%
-8.8
%
-2.1
%
3.5%
8.1% 8.4%
7.8%
5.9%
-1.9
%
-16.
7%
-0.9
%
5.4%
-20%
-15%
-10%
-5%
0%
5%
10%
2004 2005 2006 2007 2008 2009 2010P 2011P
Year
ly C
hang
e
Occupancy
ADR
RevPAR

Page 40
Observations• Taxable sales and lodging tax were
down in nearly all mountain communities in 2009
• Steamboat’s sales tax base is less seasonal than other mountain communities
• Hotel occupancies and rates are generally improving, with mountain communities showing limited strength
• Mountain ADRs are predicted to rise over next 6 months

Page 41
Observations• Skier/snowboarder visits were up
despite a decline in days of operation and snowfall
• Short booking lead time demands creativity, constant monitoring, and pro-active tactics to address anticipated low points
• Mountain travelers are active and engaged
• Macro-economic indicators are positive

THANK YOU!
RRC Associatesan STR Company
www.rrcassoc.com