Embed Size (px)
Citation preview
Page 107
Insta
lla
tio
n a
nd
Te
sti
ng
Chapter 6
Steel Piers
Resistance Pier Design Examples
Calculate Foundation Load – Two Story Residence
Calculate Maximum Pier Spacing for Design Example 1
Adjusting for Pier Buckling in Weak Soil
Determine Foundation Load – Single Story Slab on Grade
Determining Maximum Pier Spacing
Calculate the Foundation Load and Determine Pier Spacing –
Three Story Office Building
Estimating Drive Cylinder and Lifting Ram Pressures
Determining Force Applied to Pier
Earth Contact Products, LLC reserves the right to change design features, specifications and products without notice, consistent with our
efforts toward continuous product improvement. Please check with Engineering Department, Earth Contact Products to verify that you are
using the most recent information and specifications.
Page 108
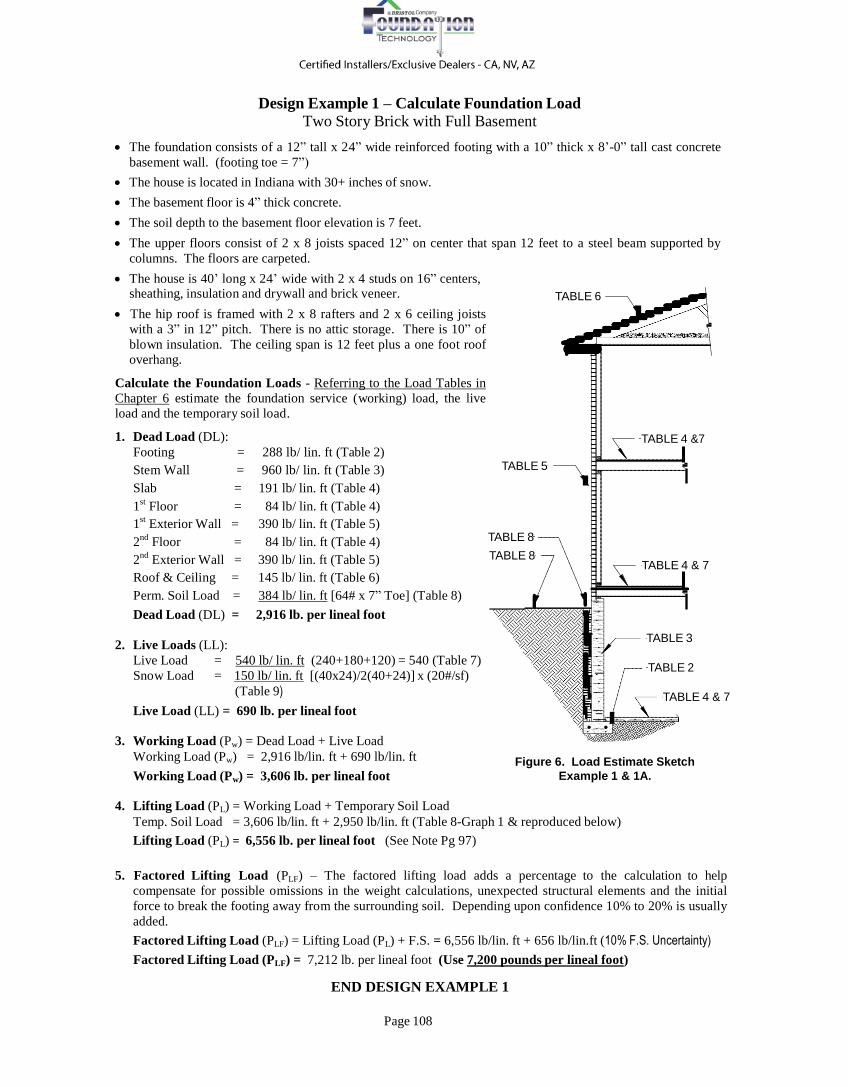
Design Example 1 – Calculate Foundation Load Two Story Brick with Full Basement
The foundation consists of a 12” tall x 24” wide reinforced footing with a 10” thick x 8’-0” tall cast concrete
basement wall. (footing toe = 7”)
The house is located in Indiana with 30+ inches of snow.
The basement floor is 4” thick concrete.
The soil depth to the basement floor elevation is 7 feet.
The upper floors consist of 2 x 8 joists spaced 12” on center that span 12 feet to a steel beam supported by
columns. The floors are carpeted.
The house is 40’ long x 24’ wide with 2 x 4 studs on 16” centers,
sheathing, insulation and drywall and brick veneer.
The hip roof is framed with 2 x 8 rafters and 2 x 6 ceiling joists
with a 3” in 12” pitch. There is no attic storage. There is 10” of
blown insulation. The ceiling span is 12 feet plus a one foot roof
overhang.
Calculate the Foundation Loads - Referring to the Load Tables in
Chapter 6 estimate the foundation service (working) load, the live
load and the temporary soil load.
1. Dead Load (DL):
Footing = 288 lb/ lin. ft (Table 2)
Stem Wall = 960 lb/ lin. ft (Table 3)
Slab = 191 lb/ lin. ft (Table 4)
1st
Floor = 84 lb/ lin. ft (Table 4)
1st
Exterior Wall = 390 lb/ lin. ft (Table 5)
2nd
Floor = 84 lb/ lin. ft (Table 4)
2nd
Exterior Wall = 390 lb/ lin. ft (Table 5)
Roof & Ceiling = 145 lb/ lin. ft (Table 6)
Perm. Soil Load = 384 lb/ lin. ft [64# x 7” Toe] (Table 8)
Dead Load (DL) = 2,916 lb. per lineal foot
2. Live Loads (LL):
Live Load = 540 lb/ lin. ft (240+180+120) = 540 (Table 7)
Snow Load = 150 lb/ lin. ft [(40x24)/2(40+24)] x (20#/sf)
(Table 9)
Live Load (LL) = 690 lb. per lineal foot
TABLE 5
TABLE 8
TABLE 8
TABLE 6
TABLE 4 &7
TABLE 4 & 7
TABLE 3
TABLE 2
TABLE 4 & 7
3. Working Load (Pw) = Dead Load + Live Load
Working Load (Pw) = 2,916 lb/lin. ft + 690 lb/lin. ft
Working Load (Pw) = 3,606 lb. per lineal foot
Figure 6. Load Estimate Sketch
Example 1 & 1A.
4. Lifting Load (PL) = Working Load + Temporary Soil Load
Temp. Soil Load = 3,606 lb/lin. ft + 2,950 lb/lin. ft (Table 8-Graph 1 & reproduced below)
Lifting Load (PL) = 6,556 lb. per lineal foot (See Note Pg 97)
5. Factored Lifting Load (PLF) – The factored lifting load adds a percentage to the calculation to help
compensate for possible omissions in the weight calculations, unexpected structural elements and the initial
force to break the footing away from the surrounding soil. Depending upon confidence 10% to 20% is usually
added.
Factored Lifting Load (PLF) = Lifting Load (PL) + F.S. = 6,556 lb/lin. ft + 656 lb/lin.ft (10% F.S. Uncertainty)
Factored Lifting Load (PLF) = 7,212 lb. per lineal foot (Use 7,200 pounds per lineal foot)
END DESIGN EXAMPLE 1
Page 109
TABLE 10. Ranges for Typical Average Residential
Building Loads* Building Construction
(Basement or Crawlspace & Footing)
Estimated Foundation Load Range
(DL = Dead – LL = Live) One Story
Wood/Metal/Vinyl Walls with Wood Framing on Basement or Crawlspace and Footing
DL 1,250 – 1,500 lb/ft LL 300 – 475 lb/ft
One Story
Masonry Walls with Wood Framing on Basement or Crawlspace and Footing
DL 1,500 – 2,000 lb/ft LL 300 – 475 lb/ft
Two Story Wood/Metal/Vinyl Walls with Wood Framing on Basement or Crawlspace and Footing
DL 1,400 – 1,900 lb/ft LL 600 – 950 lb/ft
Two Story 1st Masonry, 2nd Wood/Metal/Vinyl – Wood Framing, Basement or Crawlspace & Footing
DL 1,650 – 2,200 lb/ft LL 600 – 950 lb/ft
Two Story Masonry Walls with Wood Framing on Basement or Crawlspace and Footing
DL 1,900 – 2,500 lb/ft LL 600 – 950 lb/ft
Pe
rim
ete
r W
eig
ht
(lb
/ft)
Insta
lla
tio
n a
nd
Te
sti
ng
Design Example 1A – Calculate Foundation Load – “Quick and Rough” Method Two Story Brick with Full Basement
The house is 40’ long x 24’ wide with an 8’-
0” tall cast concrete basement wall.
The house is located in Indiana with 30+
inches of snow.
The basement floor is concrete.
The soil depth at the basement is 7 feet.
1. Estimate the Dead Load and Live Load on
the footing:
A. Using Table 10 from Chapter 5, select the
column that most closely identifies the
foundation construction. In this case the
third column is selected because the house
has a basement with a concrete slab floor.
B. Second, determine which of the five rows
most closely describes the structure. In
this case the closest match is the lowest
row. (shaded) The construction of the
house consists of two story framed
construction with brick veneer siding.
C. The Dead Load for a typical two story house of this description ranges from 1,900 to 2,500 lb/lin.ft and the
Live Load averages between 600 and 950 lb/lin.ft. Based upon viewing the house and how robust is the
construction and amount of contents, load selections are chosen within the ranges given.
D. The Snow Load is estimated at 150 lb/ lin. ft [(40’x24’)/2(40+24’)] x (20#/sf) (Chapter 5, Table 9)
Dead Load (DL) = 2,200 lb/lin.ft (selected) Live Load (LL) = 750 lb/lin.ft (selected) Snow Load 150 lb/lin.ft
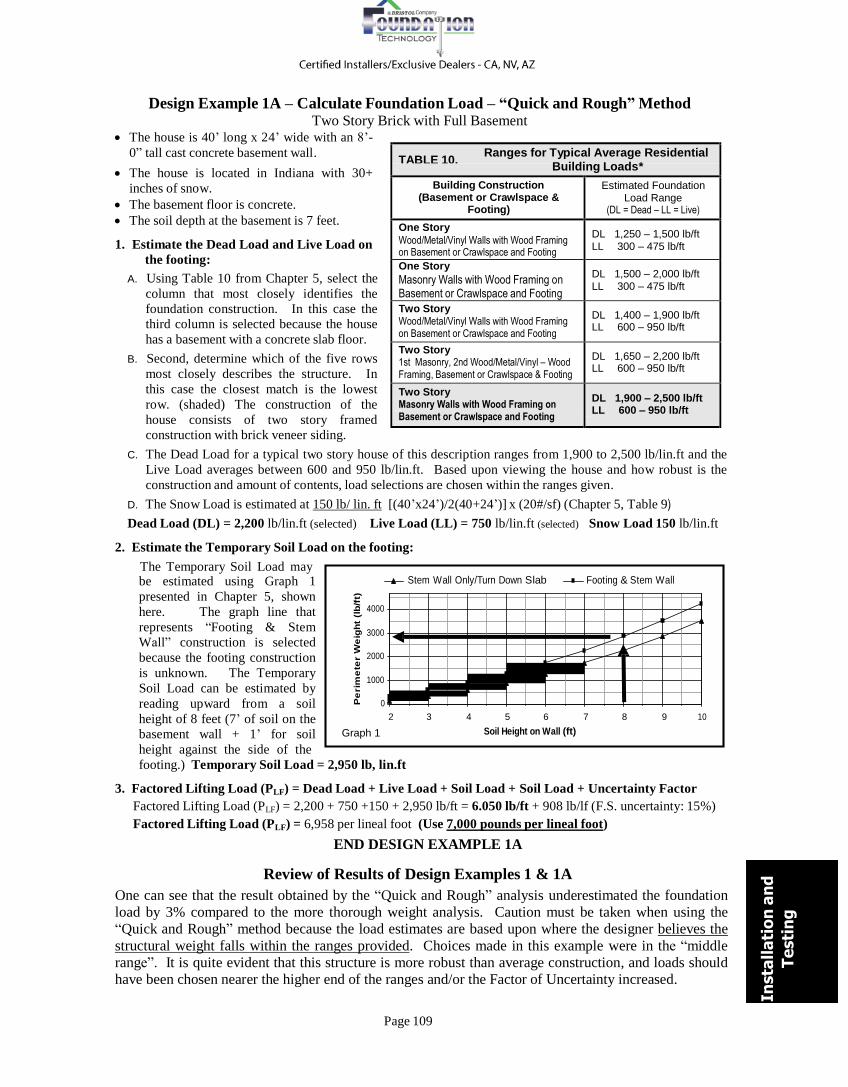
2. Estimate the Temporary Soil Load on the footing:
The Temporary Soil Load may
be estimated using Graph 1
presented in Chapter 5, shown
here. The graph line that
represents “Footing & Stem
Wall” construction is selected
because the footing construction
is unknown. The Temporary
Soil Load can be estimated by
reading upward from a soil
height of 8 feet (7’ of soil on the
basement wall + 1’ for soil
height against the side of the
4000
3000
2000
1000
0
Graph 1
Stem Wall Only/Turn Down Slab Footing & Stem Wall
2 3 4 5 6 7 8 9 10
Soil Height on Wall (ft)
footing.) Temporary Soil Load = 2,950 lb, lin.ft
3. Factored Lifting Load (PLF) = Dead Load + Live Load + Soil Load + Soil Load + Uncertainty Factor
Factored Lifting Load (PLF) = 2,200 + 750 +150 + 2,950 lb/ft = 6.050 lb/ft + 908 lb/lf (F.S. uncertainty: 15%)
Factored Lifting Load (PLF) = 6,958 per lineal foot (Use 7,000 pounds per lineal foot)
END DESIGN EXAMPLE 1A
Review of Results of Design Examples 1 & 1A
One can see that the result obtained by the “Quick and Rough” analysis underestimated the foundation
load by 3% compared to the more thorough weight analysis. Caution must be taken when using the
“Quick and Rough” method because the load estimates are based upon where the designer believes the
structural weight falls within the ranges provided. Choices made in this example were in the “middle
range”. It is quite evident that this structure is more robust than average construction, and loads should
have been chosen nearer the higher end of the ranges and/or the Factor of Uncertainty increased.
Page 110
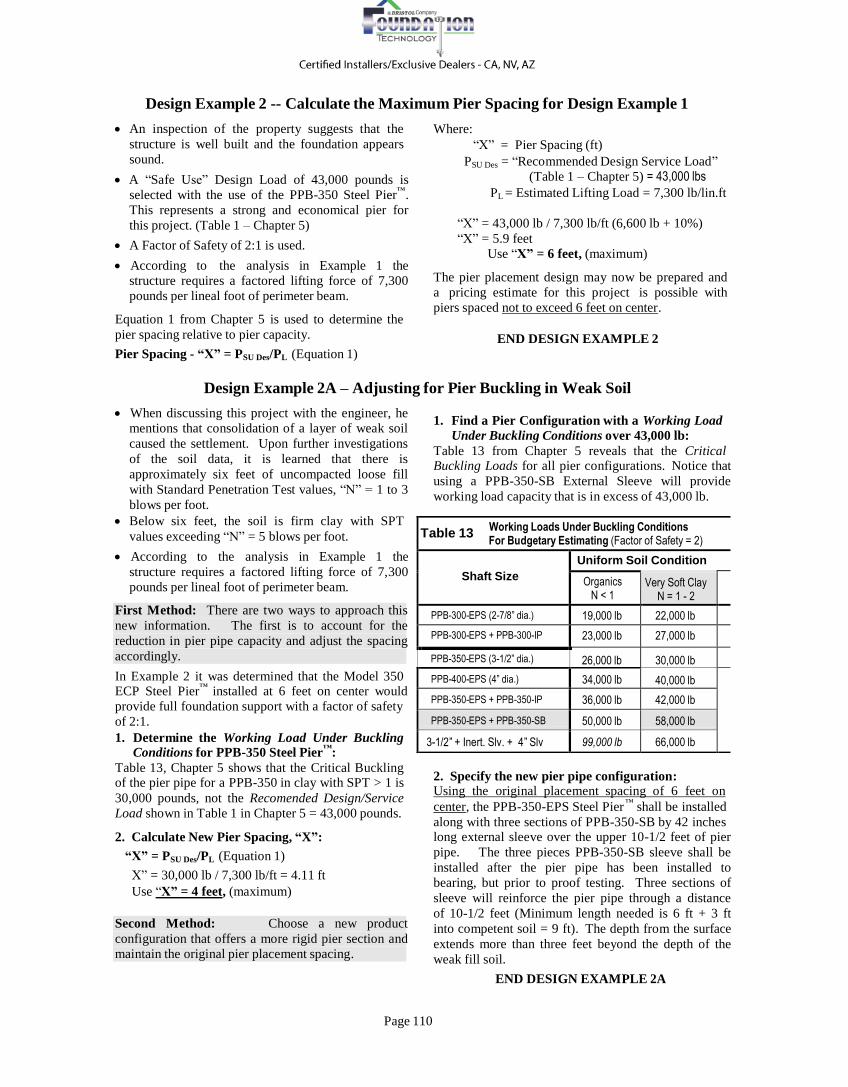
Table 13 Working Loads Under Buckling Conditions For Budgetary Estimating (Factor of Safety = 2)
Shaft Size
Uniform Soil Condition
Organics N < 1
Very Soft Clay N = 1 - 2
PPB-300-EPS (2-7/8” dia.) 19,000 lb 22,000 lb
PPB-300-EPS + PPB-300-IP 23,000 lb 27,000 lb
PPB-350-EPS (3-1/2” dia.) 26,000 lb 30,000 lb
PPB-400-EPS (4” dia.) 34,000 lb 40,000 lb
PPB-350-EPS + PPB-350-IP 36,000 lb 42,000 lb
PPB-350-EPS + PPB-350-SB 50,000 lb 58,000 lb
3-1/2” + Inert. Slv. + 4” Slv 99,000 lb 66,000 lb
Design Example 2 -- Calculate the Maximum Pier Spacing for Design Example 1
An inspection of the property suggests that the
structure is well built and the foundation appears
Where:
“X” = Pier Spacing (ft) sound.
A “Safe Use” Design Load of 43,000 pounds is
selected with the use of the PPB-350 Steel Pier™
.
This represents a strong and economical pier for
this project. (Table 1 – Chapter 5)
A Factor of Safety of 2:1 is used.
According to the analysis in Example 1 the
structure requires a factored lifting force of 7,300
pounds per lineal foot of perimeter beam.
Equation 1 from Chapter 5 is used to determine the
pier spacing relative to pier capacity.
Pier Spacing - “X” = PSU Des/PL (Equation 1)
PSU Des = “Recommended Design Service Load”
(Table 1 – Chapter 5) = 43,000 lbs
PL = Estimated Lifting Load = 7,300 lb/lin.ft
“X” = 43,000 lb / 7,300 lb/ft (6,600 lb + 10%)
“X” = 5.9 feet
Use “X” = 6 feet, (maximum)
The pier placement design may now be prepared and
a pricing estimate for this project is possible with
piers spaced not to exceed 6 feet on center.
END DESIGN EXAMPLE 2
Design Example 2A – Adjusting for Pier Buckling in Weak Soil
When discussing this project with the engineer, he
mentions that consolidation of a layer of weak soil
caused the settlement. Upon further investigations
of the soil data, it is learned that there is
approximately six feet of uncompacted loose fill
with Standard Penetration Test values, “N” = 1 to 3
blows per foot.
Below six feet, the soil is firm clay with SPT
values exceeding “N” = 5 blows per foot.
According to the analysis in Example 1 the
structure requires a factored lifting force of 7,300
pounds per lineal foot of perimeter beam.
First Method: There are two ways to approach this
new information. The first is to account for the
reduction in pier pipe capacity and adjust the spacing
accordingly.
In Example 2 it was determined that the Model 350
ECP Steel Pier™
installed at 6 feet on center would
provide full foundation support with a factor of safety
of 2:1.
1. Determine the Working Load Under Buckling
Conditions for PPB-350 Steel Pier™
:
Table 13, Chapter 5 shows that the Critical Buckling of the pier pipe for a PPB-350 in clay with SPT > 1 is
30,000 pounds, not the Recomended Design/Service
1. Find a Pier Configuration with a Working Load
Under Buckling Conditions over 43,000 lb:
Table 13 from Chapter 5 reveals that the Critical Buckling Loads for all pier configurations. Notice that
using a PPB-350-SB External Sleeve will provide
working load capacity that is in excess of 43,000 lb.
2. Specify the new pier pipe configuration: Using the original placement spacing of 6 feet on
™
Load shown in Table 1 in Chapter 5 = 43,000 pounds. center, the PPB-350-EPS Steel Pier shall be installed
2. Calculate New Pier Spacing, “X”:
“X” = PSU Des/PL (Equation 1)
X” = 30,000 lb / 7,300 lb/ft = 4.11 ft
Use “X” = 4 feet, (maximum)
Second Method: Choose a new product
configuration that offers a more rigid pier section and
maintain the original pier placement spacing.
along with three sections of PPB-350-SB by 42 inches long external sleeve over the upper 10-1/2 feet of pier
pipe. The three pieces PPB-350-SB sleeve shall be
installed after the pier pipe has been installed to
bearing, but prior to proof testing. Three sections of
sleeve will reinforce the pier pipe through a distance
of 10-1/2 feet (Minimum length needed is 6 ft + 3 ft
into competent soil = 9 ft). The depth from the surface
extends more than three feet beyond the depth of the
weak fill soil.
END DESIGN EXAMPLE 2A
Page 111
Insta
lla
tio
n a
nd
Te
sti
ng
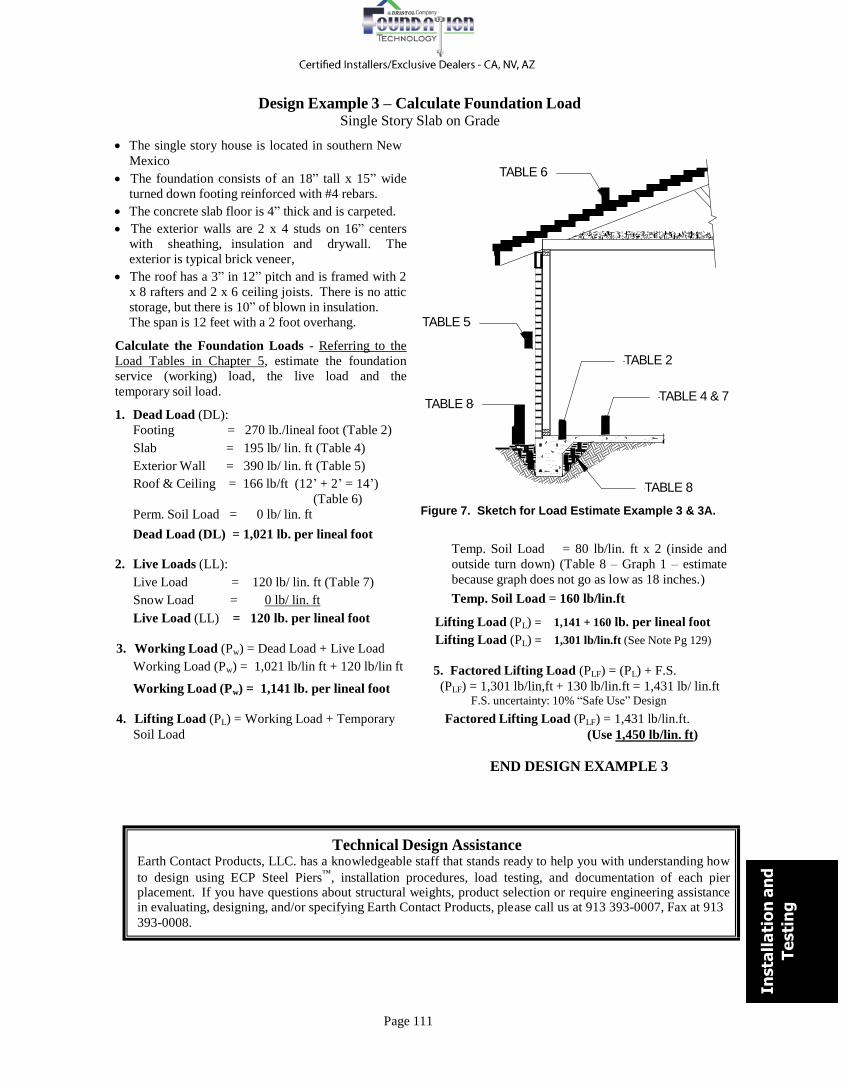
Design Example 3 – Calculate Foundation Load Single Story Slab on Grade
The single story house is located in southern New
Mexico
The foundation consists of an 18” tall x 15” wide
turned down footing reinforced with #4 rebars.
The concrete slab floor is 4” thick and is carpeted.
The exterior walls are 2 x 4 studs on 16” centers
with sheathing, insulation and drywall. The
exterior is typical brick veneer,
The roof has a 3” in 12” pitch and is framed with 2
x 8 rafters and 2 x 6 ceiling joists. There is no attic
storage, but there is 10” of blown in insulation.
The span is 12 feet with a 2 foot overhang.
Calculate the Foundation Loads - Referring to the
Load Tables in Chapter 5, estimate the foundation
service (working) load, the live load and the
temporary soil load.
1. Dead Load (DL):
Footing = 270 lb./lineal foot (Table 2)
Slab = 195 lb/ lin. ft (Table 4)
Exterior Wall = 390 lb/ lin. ft (Table 5)
Roof & Ceiling = 166 lb/ft (12’ + 2’ = 14’)
(Table 6)
TABLE 5 TABLE 8
TABLE 6 TABLE 2
TABLE 4 & 7
TABLE 8
Perm. Soil Load = 0 lb/ lin. ft
Dead Load (DL) = 1,021 lb. per lineal foot
2. Live Loads (LL):
Live Load = 120 lb/ lin. ft (Table 7)
Snow Load = 0 lb/ lin. ft
Live Load (LL) = 120 lb. per lineal foot
3. Working Load (Pw) = Dead Load + Live Load
Working Load (Pw) = 1,021 lb/lin ft + 120 lb/lin ft
Working Load (Pw) = 1,141 lb. per lineal foot
4. Lifting Load (PL) = Working Load + Temporary
Soil Load
Figure 7. Sketch for Load Estimate Example 3 & 3A.
Temp. Soil Load = 80 lb/lin. ft x 2 (inside and
outside turn down) (Table 8 – Graph 1 – estimate
because graph does not go as low as 18 inches.)
Temp. Soil Load = 160 lb/lin.ft
Lifting Load (PL) = 1,141 + 160 lb. per lineal foot
Lifting Load (PL) = 1,301 lb/lin.ft (See Note Pg 129)
5. Factored Lifting Load (PLF) = (PL) + F.S.
(PLF) = 1,301 lb/lin,ft + 130 lb/lin.ft = 1,431 lb/ lin.ft F.S. uncertainty: 10% “Safe Use” Design
Factored Lifting Load (PLF) = 1,431 lb/lin.ft.
(Use 1,450 lb/lin. ft)
END DESIGN EXAMPLE 3
Technical Design Assistance
Earth Contact Products, LLC. has a knowledgeable staff that stands ready to help you with understanding how
to design using ECP Steel Piers™
, installation procedures, load testing, and documentation of each pier placement. If you have questions about structural weights, product selection or require engineering assistance in evaluating, designing, and/or specifying Earth Contact Products, please call us at 913 393-0007, Fax at 913
393-0008.
Page 112
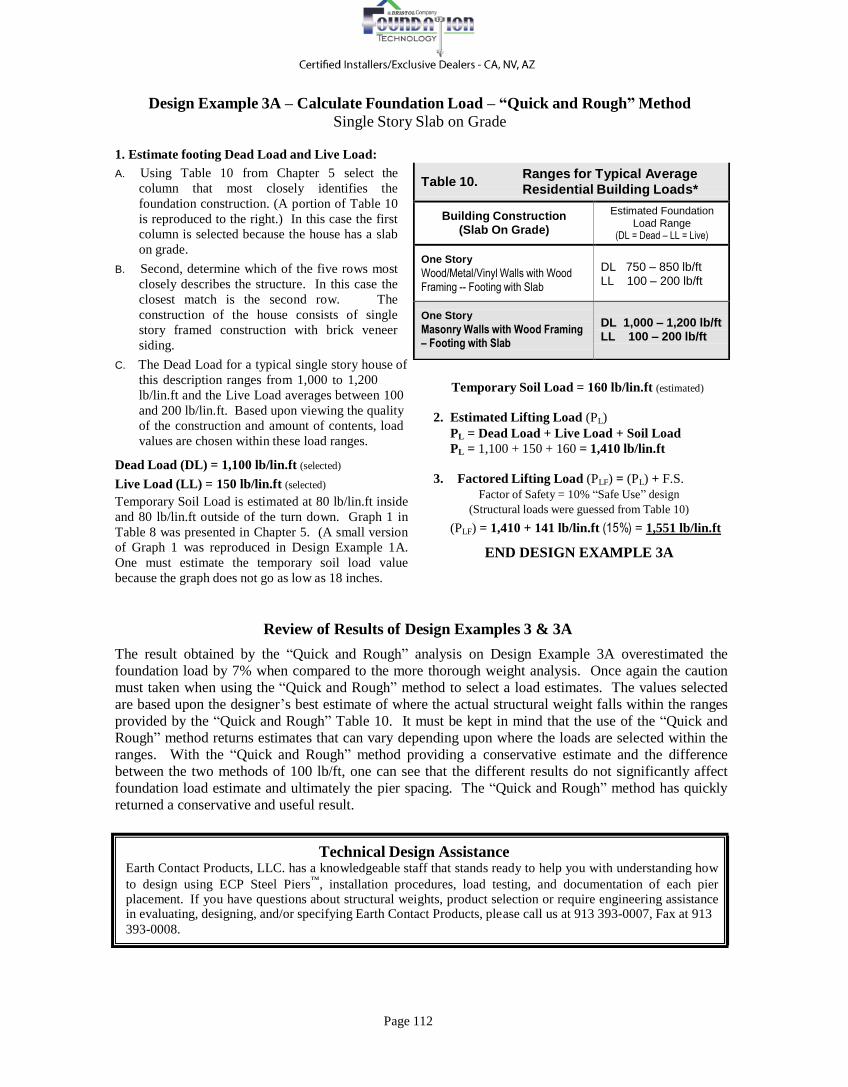
Table 10. Ranges for Typical Average Residential Building Loads*
Building Construction (Slab On Grade)
Estimated Foundation Load Range
(DL = Dead – LL = Live)
One Story
Wood/Metal/Vinyl Walls with Wood Framing -- Footing with Slab
DL 750 – 850 lb/ft
LL 100 – 200 lb/ft
One Story
Masonry Walls with Wood Framing – Footing with Slab
DL 1,000 – 1,200 lb/ft LL 100 – 200 lb/ft
Design Example 3A – Calculate Foundation Load – “Quick and Rough” Method
Single Story Slab on Grade
1. Estimate footing Dead Load and Live Load:
A. Using Table 10 from Chapter 5 select the
column that most closely identifies the
foundation construction. (A portion of Table 10
is reproduced to the right.) In this case the first
column is selected because the house has a slab
on grade.
B. Second, determine which of the five rows most
closely describes the structure. In this case the
closest match is the second row. The
construction of the house consists of single
story framed construction with brick veneer
siding.
C. The Dead Load for a typical single story house of
this description ranges from 1,000 to 1,200
lb/lin.ft and the Live Load averages between 100
and 200 lb/lin.ft. Based upon viewing the quality
of the construction and amount of contents, load
values are chosen within these load ranges.
Dead Load (DL) = 1,100 lb/lin.ft (selected)
Live Load (LL) = 150 lb/lin.ft (selected)
Temporary Soil Load is estimated at 80 lb/lin.ft inside
and 80 lb/lin.ft outside of the turn down. Graph 1 in
Table 8 was presented in Chapter 5. (A small version
of Graph 1 was reproduced in Design Example 1A.
One must estimate the temporary soil load value
because the graph does not go as low as 18 inches.
Temporary Soil Load = 160 lb/lin.ft (estimated)
2. Estimated Lifting Load (PL)
PL = Dead Load + Live Load + Soil Load PL = 1,100 + 150 + 160 = 1,410 lb/lin.ft
3. Factored Lifting Load (PLF) = (PL) + F.S.
Factor of Safety = 10% “Safe Use” design
(Structural loads were guessed from Table 10)
(PLF) = 1,410 + 141 lb/lin.ft (15%) = 1,551 lb/lin.ft
END DESIGN EXAMPLE 3A
Review of Results of Design Examples 3 & 3A
The result obtained by the “Quick and Rough” analysis on Design Example 3A overestimated the
foundation load by 7% when compared to the more thorough weight analysis. Once again the caution
must taken when using the “Quick and Rough” method to select a load estimates. The values selected
are based upon the designer’s best estimate of where the actual structural weight falls within the ranges
provided by the “Quick and Rough” Table 10. It must be kept in mind that the use of the “Quick and
Rough” method returns estimates that can vary depending upon where the loads are selected within the
ranges. With the “Quick and Rough” method providing a conservative estimate and the difference
between the two methods of 100 lb/ft, one can see that the different results do not significantly affect
foundation load estimate and ultimately the pier spacing. The “Quick and Rough” method has quickly
returned a conservative and useful result.
Technical Design Assistance Earth Contact Products, LLC. has a knowledgeable staff that stands ready to help you with understanding how
to design using ECP Steel Piers™
, installation procedures, load testing, and documentation of each pier placement. If you have questions about structural weights, product selection or require engineering assistance in evaluating, designing, and/or specifying Earth Contact Products, please call us at 913 393-0007, Fax at 913
393-0008.
Page 113
Heig
ht of S
teel R
ein
forc
ed
M
onolith
ic F
ooting
Insta
lla
tio
n a
nd
Te
sti
ng
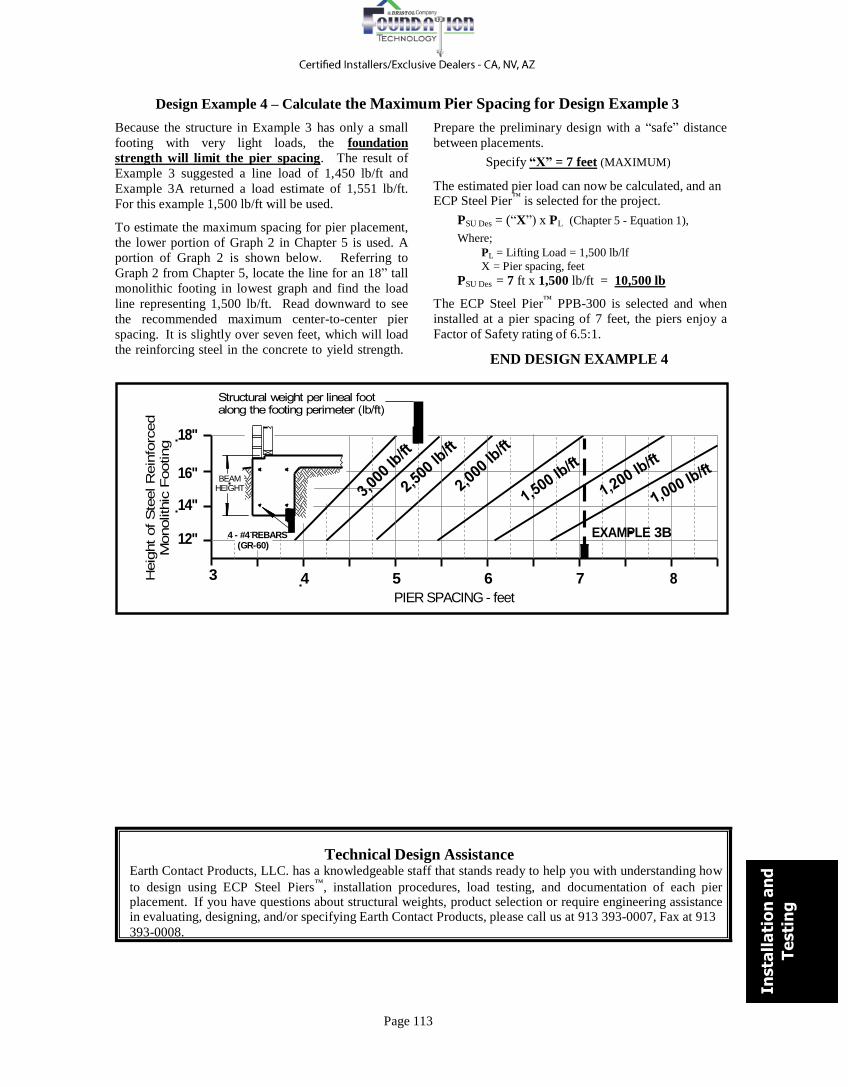
Design Example 4 – Calculate the Maximum Pier Spacing for Design Example 3
Because the structure in Example 3 has only a small
footing with very light loads, the foundation
strength will limit the pier spacing. The result of
Example 3 suggested a line load of 1,450 lb/ft and
Example 3A returned a load estimate of 1,551 lb/ft.
For this example 1,500 lb/ft will be used.
To estimate the maximum spacing for pier placement,
the lower portion of Graph 2 in Chapter 5 is used. A
portion of Graph 2 is shown below. Referring to
Graph 2 from Chapter 5, locate the line for an 18” tall
monolithic footing in lowest graph and find the load
line representing 1,500 lb/ft. Read downward to see
the recommended maximum center-to-center pier
spacing. It is slightly over seven feet, which will load
the reinforcing steel in the concrete to yield strength.
Prepare the preliminary design with a “safe” distance
between placements.
Specify “X” = 7 feet (MAXIMUM)
The estimated pier load can now be calculated, and an
ECP Steel Pier™
is selected for the project.
PSU Des = (“X”) x PL (Chapter 5 - Equation 1),
Where;
PL = Lifting Load = 1,500 lb/lf X = Pier spacing, feet
PSU Des = 7 ft x 1,500 lb/ft = 10,500 lb
The ECP Steel Pier™
PPB-300 is selected and when
installed at a pier spacing of 7 feet, the piers enjoy a
Factor of Safety rating of 6.5:1.
END DESIGN EXAMPLE 4
18"
Structural weight per lineal foot along the footing perimeter (lb/ft)
16"
14"
12"
BEAM
HEIGHT
4 - #4 REBARS (GR-60)
3
4 5 6 7
PIER SPACING - feet
EXAMPLE 3B
8
Technical Design Assistance Earth Contact Products, LLC. has a knowledgeable staff that stands ready to help you with understanding how
to design using ECP Steel Piers™
, installation procedures, load testing, and documentation of each pier placement. If you have questions about structural weights, product selection or require engineering assistance in evaluating, designing, and/or specifying Earth Contact Products, please call us at 913 393-0007, Fax at 913
393-0008.
Page 114
Table 8. Estimated Soil Loads on Footings
Permanent Soil Load on a Footing Toe – Wd
Soil Height Against Wall 2’ 4’ 6’ 7’ 8’ 9’ 10’ Soil Load per inch of Footing Width 18 lb 37 lb 55 lb 64 lb 73 lb 83 lb 92 lb
To determine the permanent soil load on a footing toe, multiply the actual width of the footing toe (in inches) by the unit weight shown above for the soil height against the wall.
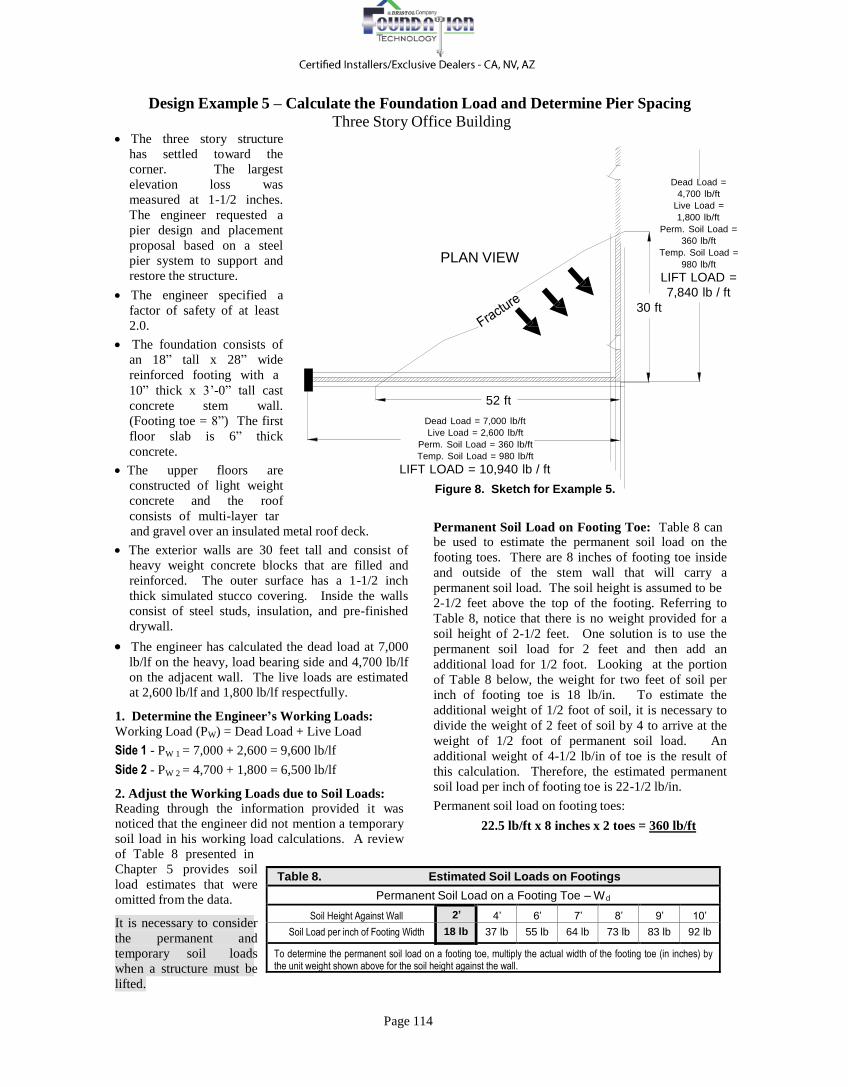
Design Example 5 – Calculate the Foundation Load and Determine Pier Spacing
Three Story Office Building The three story structure
has settled toward the
corner. The largest
elevation loss was
measured at 1-1/2 inches.
The engineer requested a
pier design and placement
proposal based on a steel
pier system to support and
restore the structure.
The engineer specified a
factor of safety of at least
2.0.
The foundation consists of
an 18” tall x 28” wide
reinforced footing with a
10” thick x 3’-0” tall cast
concrete stem wall.
(Footing toe = 8”) The first
floor slab is 6” thick
concrete.
The upper floors are
constructed of light weight
concrete and the roof
consists of multi-layer tar
PLAN VIEW
52 ft
Dead Load = 7,000 lb/ft
Live Load = 2,600 lb/ft
Perm. Soil Load = 360 lb/ft
Temp. Soil Load = 980 lb/ft
LIFT LOAD = 10,940 lb / ft
Figure 8. Sketch for Example 5.
Dead Load =
4,700 lb/ft
Live Load =
1,800 lb/ft
Perm. Soil Load =
360 lb/ft
Temp. Soil Load =
980 lb/ft
LIFT LOAD =
7,840 lb / ft
30 ft
and gravel over an insulated metal roof deck.
The exterior walls are 30 feet tall and consist of
heavy weight concrete blocks that are filled and
reinforced. The outer surface has a 1-1/2 inch
thick simulated stucco covering. Inside the walls
consist of steel studs, insulation, and pre-finished
drywall.
The engineer has calculated the dead load at 7,000
lb/lf on the heavy, load bearing side and 4,700 lb/lf
on the adjacent wall. The live loads are estimated
at 2,600 lb/lf and 1,800 lb/lf respectfully.
1. Determine the Engineer’s Working Loads:
Working Load (PW) = Dead Load + Live Load
Side 1 - PW 1 = 7,000 + 2,600 = 9,600 lb/lf
Side 2 - PW 2 = 4,700 + 1,800 = 6,500 lb/lf
2. Adjust the Working Loads due to Soil Loads:
Reading through the information provided it was
noticed that the engineer did not mention a temporary
soil load in his working load calculations. A review
of Table 8 presented in
Chapter 5 provides soil
load estimates that were
omitted from the data.
It is necessary to consider
the permanent and
temporary soil loads
when a structure must be
lifted.
Permanent Soil Load on Footing Toe: Table 8 can be used to estimate the permanent soil load on the
footing toes. There are 8 inches of footing toe inside
and outside of the stem wall that will carry a
permanent soil load. The soil height is assumed to be
2-1/2 feet above the top of the footing. Referring to
Table 8, notice that there is no weight provided for a
soil height of 2-1/2 feet. One solution is to use the
permanent soil load for 2 feet and then add an
additional load for 1/2 foot. Looking at the portion
of Table 8 below, the weight for two feet of soil per
inch of footing toe is 18 lb/in. To estimate the
additional weight of 1/2 foot of soil, it is necessary to
divide the weight of 2 feet of soil by 4 to arrive at the
weight of 1/2 foot of permanent soil load. An
additional weight of 4-1/2 lb/in of toe is the result of
this calculation. Therefore, the estimated permanent
soil load per inch of footing toe is 22-1/2 lb/in.
Permanent soil load on footing toes:
22.5 lb/ft x 8 inches x 2 toes = 360 lb/ft
Page 115
Pe
rim
ete
r W
eig
ht
(lb
/ft)
Insta
lla
tio
n a
nd
Te
sti
ng
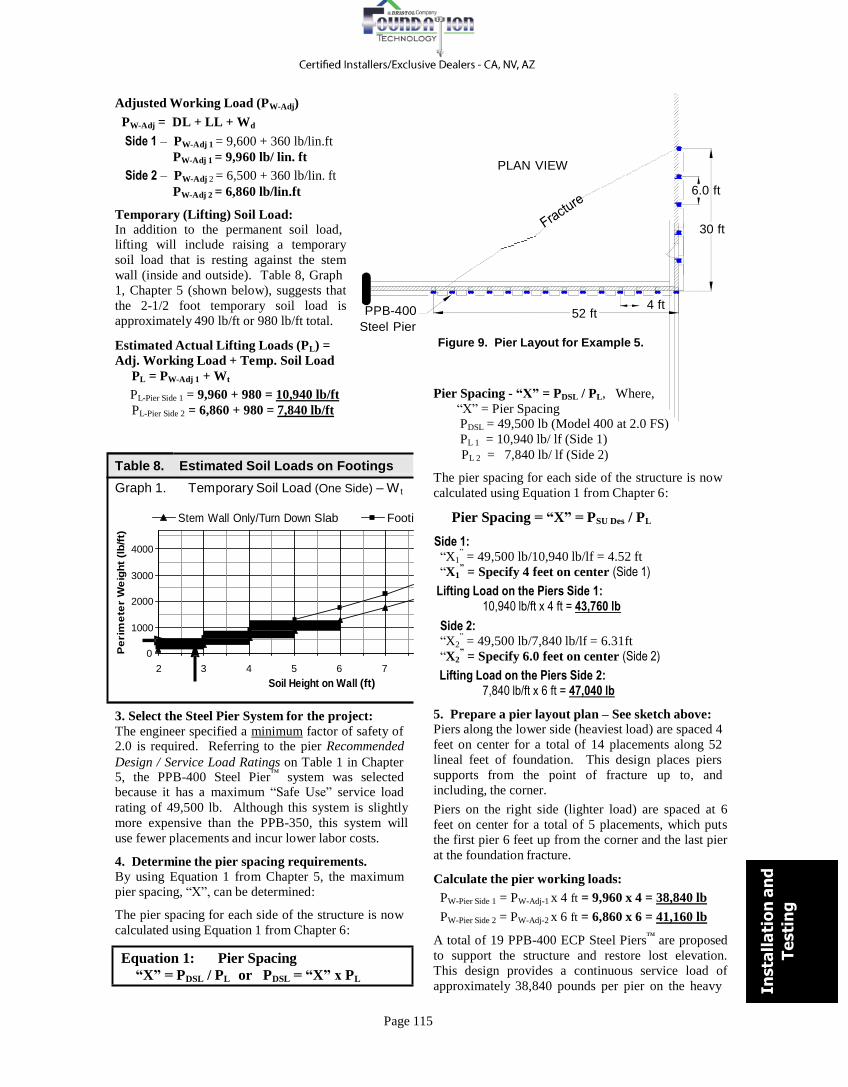
Adjusted Working Load (PW-Adj)
PW-Adj = DL + LL + Wd
Side 1 – PW-Adj 1 = 9,600 + 360 lb/lin.ft
PW-Adj 1 = 9,960 lb/ lin. ft
Side 2 – PW-Adj 2 = 6,500 + 360 lb/lin. ft
PW-Adj 2 = 6,860 lb/lin.ft
Temporary (Lifting) Soil Load: In addition to the permanent soil load, lifting will include raising a temporary
soil load that is resting against the stem
wall (inside and outside). Table 8, Graph
1, Chapter 5 (shown below), suggests that
the 2-1/2 foot temporary soil load is
approximately 490 lb/ft or 980 lb/ft total.
PPB-400
Steel Pier
PLAN VIEW
52 ft
4 ft
6.0 ft
30 ft
Estimated Actual Lifting Loads (PL) =
Adj. Working Load + Temp. Soil Load
PL = PW-Adj 1 + Wt
PL-Pier Side 1 = 9,960 + 980 = 10,940 lb/ft
PL-Pier Side 2 = 6,860 + 980 = 7,840 lb/ft Table 8. Estimated Soil Loads on Footings
Graph 1. Temporary Soil Load (One Side) – W t
Stem Wall Only/Turn Down Slab Footi
4000
3000
2000
1000
0
2 3 4 5 6 7
Soil Height on Wall (ft)
3. Select the Steel Pier System for the project:
The engineer specified a minimum factor of safety of 2.0 is required. Referring to the pier Recommended
Design / Service Load Ratings on Table 1 in Chapter
5, the PPB-400 Steel Pier™
system was selected because it has a maximum “Safe Use” service load
rating of 49,500 lb. Although this system is slightly
more expensive than the PPB-350, this system will
use fewer placements and incur lower labor costs.
4. Determine the pier spacing requirements. By using Equation 1 from Chapter 5, the maximum
pier spacing, “X”, can be determined:
The pier spacing for each side of the structure is now
calculated using Equation 1 from Chapter 6:
Equation 1: Pier Spacing
“X” = PDSL / PL or PDSL = “X” x PL
Figure 9. Pier Layout for Example 5.
Pier Spacing - “X” = PDSL / PL, Where,
“X” = Pier Spacing PDSL = 49,500 lb (Model 400 at 2.0 FS)
PL 1 = 10,940 lb/ lf (Side 1)
PL 2 = 7,840 lb/ lf (Side 2)
The pier spacing for each side of the structure is now
calculated using Equation 1 from Chapter 6:
Pier Spacing = “X” = PSU Des / PL
Side 1:
“X1”
= 49,500 lb/10,940 lb/lf = 4.52 ft
“X1”
= Specify 4 feet on center (Side 1)
Lifting Load on the Piers Side 1: 10,940 lb/ft x 4 ft = 43,760 lb
Side 2:
“X2”
= 49,500 lb/7,840 lb/lf = 6.31ft
“X2”
= Specify 6.0 feet on center (Side 2)
Lifting Load on the Piers Side 2: 7,840 lb/ft x 6 ft = 47,040 lb
5. Prepare a pier layout plan – See sketch above:
Piers along the lower side (heaviest load) are spaced 4
feet on center for a total of 14 placements along 52
lineal feet of foundation. This design places piers
supports from the point of fracture up to, and
including, the corner.
Piers on the right side (lighter load) are spaced at 6
feet on center for a total of 5 placements, which puts
the first pier 6 feet up from the corner and the last pier
at the foundation fracture.
Calculate the pier working loads:
PW-Pier Side 1 = PW-Adj-1 x 4 ft = 9,960 x 4 = 38,840 lb
PW-Pier Side 2 = PW-Adj-2 x 6 ft = 6,860 x 6 = 41,160 lb
A total of 19 PPB-400 ECP Steel Piers™
are proposed
to support the structure and restore lost elevation.
This design provides a continuous service load of
approximately 38,840 pounds per pier on the heavy
Page 116
side at the bottom of the sketch, and provides
continuous service load support of approximately
41,160 pounds per pier placement on the lighter side at the right side of the sketch.
The calculated working load values include the design
live and dead loads provided by the engineer along
with the permanent soil loads on the footing toes
added.
6. Determine the Service Load and Lifting Force Factor of Safeties for the Steel Pier Design:
The ECP Pier System Load Ratings” on Table 1 in
Chapter 5 for the PPB-400 Steel Pier™
system states that the “Safe Use” Recommended Design / Service Load rating is 49,500 pounds and the Ultimate-Limit Mechanical System Capacity is 99,000 pounds. This
capacity is divided by the Service Loads determined
Estimating Driving Cylinder Pressure: It is a good idea to calculate the estimated hydraulic pressure that will provide the required test load on the
pier, and an estimate of the hydraulic pressure
requirement to recover the lost elevation while all of
the project requirements and design data are at hand.
This is valuable information for the field technicians.
The ECP HYD-350-DC Drive Cylinder has a piston
area of 8.29 in2
as stated in Pier Installation, Load Testing & Project Documentation in Chapter 5. To determine the pressure on the drive cylinder to produce the Proof Load of 62,000 pounds, Equation 2 is used:
Equation 2: Hydraulic Cylinder Force
FCyl = Acyl x Pcyl
in Step 6.
Where: FCyl
= Cylinder force on pier = 62,000 lb Factor of Safety = Ult. Capacity/Service Load
F.S.1 = 99,000/38,840 = 2.5 (Side 1 - Working)
F.S.2 = 99,000/41,160 = 2.4 (Side 2 - Working)
The factor of safety for lifting the structure can also
be calculated:
This design satisfies the engineer’s minimum factor
of safety = 2.0, and also insures that there will be
sufficient pier capacity to break the footing loose
from the soil and lift the temporary soil load without
exceeding “Safe Use” design. Divide the Ultimate-
Limit Mechanical System Capacity by the Lifting
Load determined in Step 4.
Factor of Safety = Ult. Capacity/Lifting Load
F.S.L1 = 99,000/43,760 = 2.26 (Side 1- Lift)
F.S.L2 = 99,000/47,040 = 2.10 (Side 2 – Lift)
7. Determine Field Proof Test Force Requirement
for the Piers: The design calls for the piers to support a maximum continuous working load of up to 41,160 pounds
(From Step 6 – Side 2 Load). According to ECP
guidelines, it is recommended to perform a proof test
of each pile once the pile reaches firm bearing. The
ECP field proof test loading recommendation is to
load the pier to 1-1/2 times the anticipated working
load or until slight lifting of the foundation is
observed.
Proof Load = Working Load x 1.5
PT = 41,160 lb x 1.5 = 61,740 lb (Use Max. 62,000 lbs. for Proof Test)
Pcyl = Hydraulic Pressure, psi
Acyl = Effective Cylinder Area = 8.29 in2
(HYD-350-DC Cylinder = 8.29 in2)
Change Equation 2 to solve for the cylinder pressure:
Pcyl = FCyl / Acyl = 62,000 lb / 8.29 in2
Pcyl = 7,479 psi – Use 7,500 psi
Estimating Lifting Cylinder Pressures:
The necessary hydraulic pressure on the HYD-254 Lifting Ram that is sufficient to raise the structure is
determined in a similar manner.
Pcyl = FCyl / Acyl
Where: FCyl = Max. lift force on pier:
Side 1: 43,760 lb
Side 2: 47,040 lb
Pcyl = Hydraulic Pressure -- psi
Acyl = Effective Cylinder Area – 5.16 in2
(HYD-254 Ram Area = 5.16 in2)
Side 1: Pcyl = 43,760 lb / 5.16 in2
= 8,480
Pcyl = 8,500 psi
Side 2: Pcyl = 47,040 lb / 5.16 in2
= 9,125
Pcyl = 9,100 psi
The Proof Test pressure and the estimates for Lifting
Cylinder Pressures shall be supplied to the field
personnel to assist with the installation.
END DESIGN EXAMPLE 5
Technical Design Assistance Earth Contact Products, LLC. has a knowledgeable staff that stands ready to help you with understanding how
to design using ECP Steel Piers™
, installation procedures, load testing, and documentation of each pier placement. If you have questions about structural weights, product selection or require engineering assistance in evaluating, designing, and/or specifying Earth Contact Products, please call us at 913 393-0007, Fax at 913
393-0008.
Page 117
Cyli
nd
er
Fo
rce
lb x
1,0
00
500
1000
1500
2000
2500
3000
3500
4000
4500
5000
5500
6000
6500
7000
7500
8000
8500
9000
9500
10000
Insta
lla
tio
n a
nd
Te
sti
ng
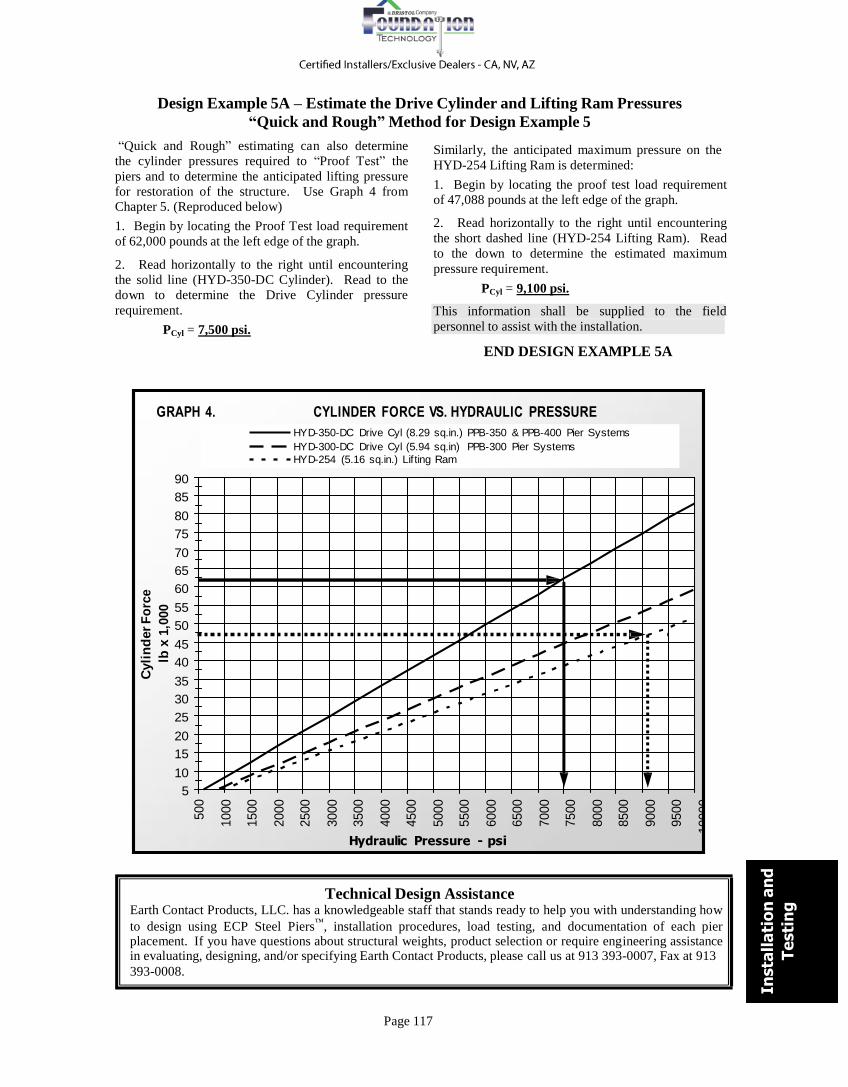
Design Example 5A – Estimate the Drive Cylinder and Lifting Ram Pressures
“Quick and Rough” Method for Design Example 5
“Quick and Rough” estimating can also determine
the cylinder pressures required to “Proof Test” the
piers and to determine the anticipated lifting pressure
for restoration of the structure. Use Graph 4 from
Chapter 5. (Reproduced below)
1. Begin by locating the Proof Test load requirement
of 62,000 pounds at the left edge of the graph.
2. Read horizontally to the right until encountering
the solid line (HYD-350-DC Cylinder). Read to the
down to determine the Drive Cylinder pressure
requirement.
PCyl = 7,500 psi.
Similarly, the anticipated maximum pressure on the
HYD-254 Lifting Ram is determined:
1. Begin by locating the proof test load requirement
of 47,088 pounds at the left edge of the graph.
2. Read horizontally to the right until encountering
the short dashed line (HYD-254 Lifting Ram). Read
to the down to determine the estimated maximum
pressure requirement.
PCyl = 9,100 psi.
This information shall be supplied to the field
personnel to assist with the installation.
END DESIGN EXAMPLE 5A
GRAPH 4. CYLINDER FORCE VS. HYDRAULIC PRESSURE
HYD-350-DC Drive Cyl (8.29 sq.in.) PPB-350 & PPB-400 Pier Systems
HYD-300-DC Drive Cyl (5.94 sq.in) PPB-300 Pier Systems
HYD-254 (5.16 sq.in.) Lif ting Ram
90
85
80
75
70
65
60
55
50
45
40
35
30
25
20
15
10
5
Hydraulic Pressure - psi
Technical Design Assistance Earth Contact Products, LLC. has a knowledgeable staff that stands ready to help you with understanding how
to design using ECP Steel Piers™
, installation procedures, load testing, and documentation of each pier placement. If you have questions about structural weights, product selection or require engineering assistance in evaluating, designing, and/or specifying Earth Contact Products, please call us at 913 393-0007, Fax at 913
393-0008.
Page 118
Cyli
nd
er
Fo
rce
lb x
1,0
00
500
1000
1500
2000
2500
3000
3500
4000
4500
5000
5500
6000
6500
7000
7500
8000
8500
9000
9500
1000
0
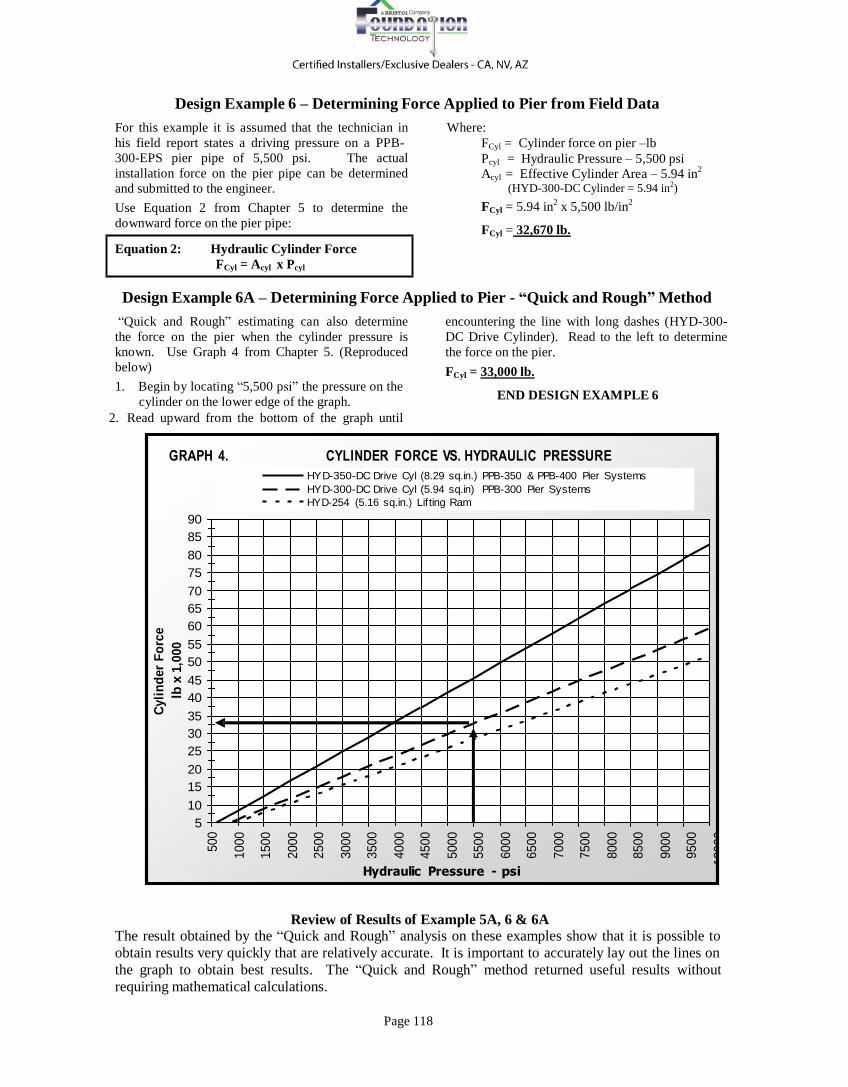
Design Example 6 – Determining Force Applied to Pier from Field Data
For this example it is assumed that the technician in
his field report states a driving pressure on a PPB-
300-EPS pier pipe of 5,500 psi. The actual
installation force on the pier pipe can be determined
and submitted to the engineer.
Use Equation 2 from Chapter 5 to determine the
downward force on the pier pipe:
Equation 2: Hydraulic Cylinder Force
FCyl = Acyl x Pcyl
Where:
FCyl = Cylinder force on pier –lb
Pcyl = Hydraulic Pressure – 5,500 psi
Acyl = Effective Cylinder Area – 5.94 in2
(HYD-300-DC Cylinder = 5.94 in2)
FCyl = 5.94 in2
x 5,500 lb/in2
FCyl = 32,670 lb.
Design Example 6A – Determining Force Applied to Pier - “Quick and Rough” Method
“Quick and Rough” estimating can also determine
the force on the pier when the cylinder pressure is
known. Use Graph 4 from Chapter 5. (Reproduced
below)
1. Begin by locating “5,500 psi” the pressure on the
cylinder on the lower edge of the graph.
2. Read upward from the bottom of the graph until
encountering the line with long dashes (HYD-300-
DC Drive Cylinder). Read to the left to determine
the force on the pier.
FCyl = 33,000 lb.
END DESIGN EXAMPLE 6
GRAPH 4. CYLINDER FORCE VS. HYDRAULIC PRESSURE
HYD-350-DC Drive Cyl (8.29 sq.in.) PPB-350 & PPB-400 Pier Systems
HYD-300-DC Drive Cyl (5.94 sq.in) PPB-300 Pier Systems
HYD-254 (5.16 sq.in.) Lif ting Ram
90
85
80
75
70
65
60
55
50
45
40
35
30
25
20
15
10
5
Hydraulic Pressure - psi
Review of Results of Example 5A, 6 & 6A
The result obtained by the “Quick and Rough” analysis on these examples show that it is possible to
obtain results very quickly that are relatively accurate. It is important to accurately lay out the lines on
the graph to obtain best results. The “Quick and Rough” method returned useful results without
requiring mathematical calculations.