Embed Size (px)
Citation preview

PHILIPPINES Country Report 2016
Philippine Iron and Steel Institute

Philippines: Key Economic Trends in 2016
GDP posted a 6.8% growth in 2016
• Robust private and household consumption coupled with an increase in capital
investments
• Growth was more balanced - private consumption, public and private
investment and resurgence in manufacturing and construction
• Resurgence in all sectors following presidential elections

GDP Growth by Sector, 2014-2016
2016 2015 2014
GROSS DOMESTIC PRODUCT 6.8 5.8 6.1
Agriculture, Fishery and Forestry (1.3) 0.2 1.9
Industry 8.0 6.0 7.5
Mining and Quarrying (0.3) (1.3) 3.5
Manufacturing 7.0 5.7 8.1
Construction 12.6 8.9 8.5
Electricity, Gas and Water 9.6 4.8 3.2
Services 7.5 6.7 6.0
Transport, Comm., Storage 5.9 7.9 6.6
Trade 7.3 6.9 6.0
Finance 7.7 5.7 6.7
Ownership of Dwelling and Real Estate 9.1 7.3 8.1
Private Services 6.9 8.0 4.2
Government Services 7.5 0.6 3.5

Key Economic & Monetary Indicators2016 2015
GDP P8.113T ($183.6) P7.579T ($171.5)
GNI P9.735T ($220.3) P9.109T ($206.1)
Inflation Rate 1.8% 1.4%
Interest Rate
Bank Lending Rate (annual ave.)5.64% 5.58%
Exchange Rate (per USD)
Average
End of year
P47.49
P49.81
P45.50
P47.23
Foreign Trade
Merchandise Exports Growth
Merchandise Imports Growth
Trade Balance
0.6%
16.6%
($34,079)
(13.1%)p
(3.2%) p
($21,698)p
Foreign Direct Investments $7.93B $5.72B
Balance of Payments ($420B) $2.616B
Source: Bangko Sentral ng Pilipinas (BSP) – The Philippine Central Bank Annual Report
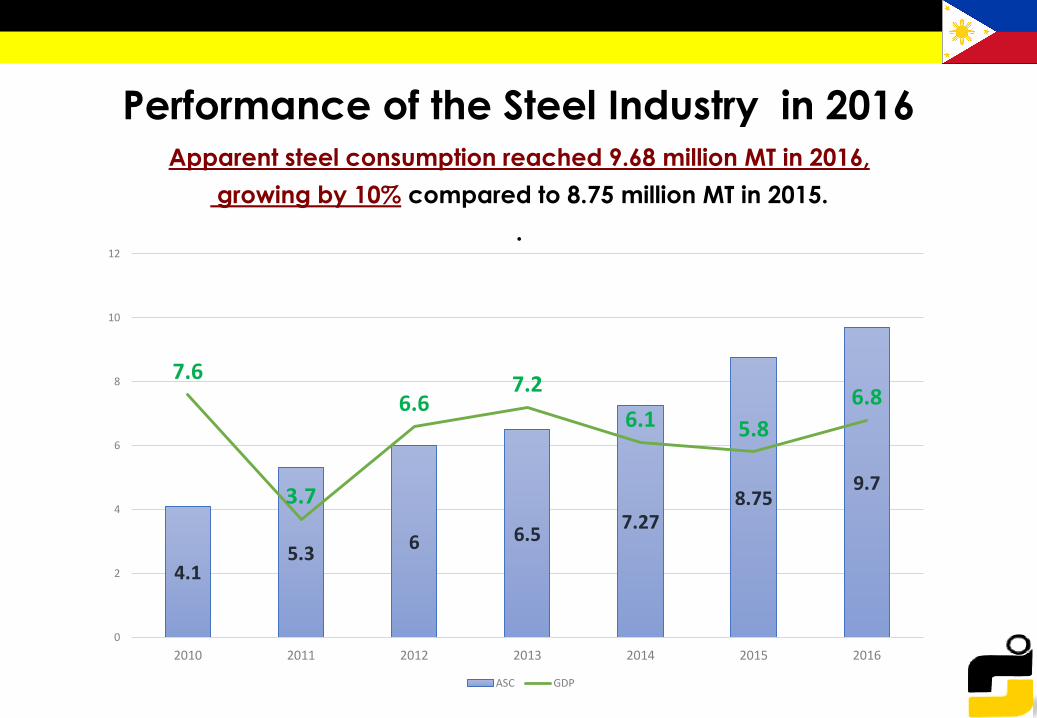
Performance of the Steel Industry in 2016Apparent steel consumption reached 9.68 million MT in 2016,
growing by 10% compared to 8.75 million MT in 2015.
.
4.15.3
6 6.57.27
8.759.7
7.6
3.7
6.67.2
6.1 5.8
6.8
0
2
4
6
8
10
12
2010 2011 2012 2013 2014 2015 2016
ASC GDP

Key Developments in 2016
STEEL DEMAND
• Increased demand for flat products to address ongoing
housing and reconstruction activities
• Increased demand for long products to supply private
residential and commercial developments
• Increased demand for construction steel to supply
government projects
STEEL SUPPLY
• Increase in semi-finished and finished steel products from
China
• Slight uptake in local billet production

Comparative Steel Demand
2016 2015
81%
9%
5%4%
1%
Construction
Light & Heavy Fabrication
Others
Packaging Ship building
81%
9%
5%4%
1%
Construction
Light & Heavy Fabrication
Others
Packaging Ship building

Summary of Key Steel Statistics
In Metric Tons Yr-Yr
2016 2015 Change
CRUDE STEEL PRODUCTION 1,075,182 968,022 11%
FINISHED STEEL PRODUCTION 5,791,038 5,683,251 2%
FINISHED STEEL IMPORT 5,497,958 4,917,559 11%
FINISHED STEEL EXPORT 100,000 100,000 0%
APPARENT STEEL CONSUMPTIONAdjusted for double counting
9,677,422 8,759,700 10%

Apparent Consumption:
SEMI-FINISHED STEELIn Metric Tons Yr-Yr
2016 2015 Change
BILLETS
Production 1,075,182 968,022 11%
Import 3,148,178 2,886,806 9%
Export -
Apparent Consumption 4,223,360 3,854,828 9%
SLABS
Production - -
Import -
Export - -
Apparent Consumption - -
Sources: Bureau of Customs (BOC), Department of Trade and Industry (DTI) and Industry Sources

Apparent Steel Consumption:
In Metric Tons Yr-Yr
2016 2015 Change
LONG PRODUCTS
Production1&2 4,346,038 4,013,251 8%
Import 1,922,200 1,798,036 7%
Export
Apparent Consumption 6,268,238 5,811,287 8%
FLAT PRODUCTS
Production1 0 0 0%
Import 3,509,184 3,048,413 15%
Export 100,000 100,000 0%
Apparent Consumption 3,409,184 2,948,413 15%
Total Long & Flat Products 9,677,422 8,759,700 10%
1 Covers hot rolled products only in order to avoid double counting
2 Excludes bar products converted from wire rods
Sources: Bureau of Customs (BOC), Department of Trade and Industry (DTI) and Industry Sources
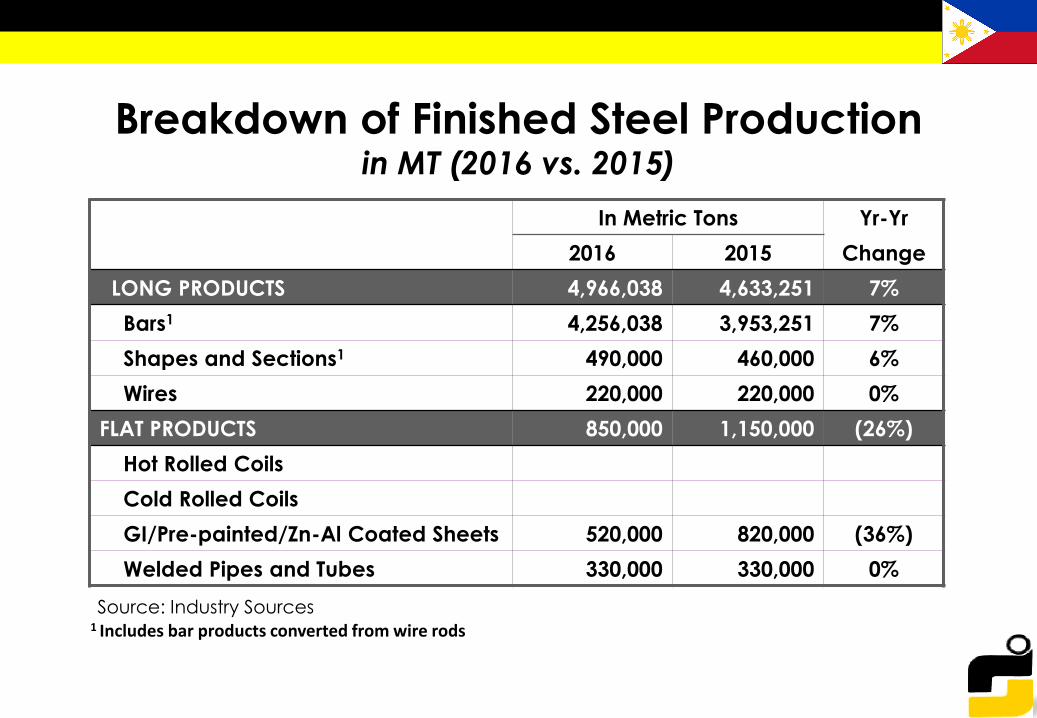
Breakdown of Finished Steel Productionin MT (2016 vs. 2015)
In Metric Tons Yr-Yr
2016 2015 Change
LONG PRODUCTS 4,966,038 4,633,251 7%
Bars1 4,256,038 3,953,251 7%
Shapes and Sections1 490,000 460,000 6%
Wires 220,000 220,000 0%
FLAT PRODUCTS 850,000 1,150,000 (26%)
Hot Rolled Coils
Cold Rolled Coils
GI/Pre-painted/Zn-Al Coated Sheets 520,000 820,000 (36%)
Welded Pipes and Tubes 330,000 330,000 0%
Source: Industry Sources1 Includes bar products converted from wire rods
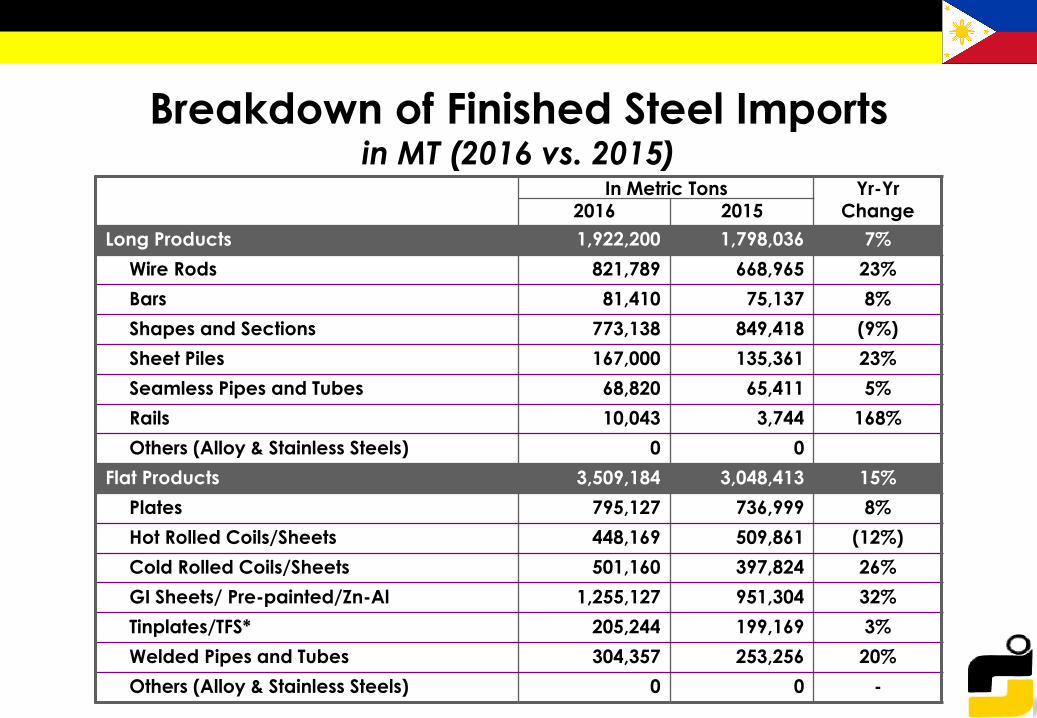
Breakdown of Finished Steel Importsin MT (2016 vs. 2015)
In Metric Tons Yr-Yr2016 2015 Change
Long Products 1,922,200 1,798,036 7%
Wire Rods 821,789 668,965 23%
Bars 81,410 75,137 8%
Shapes and Sections 773,138 849,418 (9%)
Sheet Piles 167,000 135,361 23%
Seamless Pipes and Tubes 68,820 65,411 5%
Rails 10,043 3,744 168%
Others (Alloy & Stainless Steels) 0 0
Flat Products 3,509,184 3,048,413 15%
Plates 795,127 736,999 8%
Hot Rolled Coils/Sheets 448,169 509,861 (12%)
Cold Rolled Coils/Sheets 501,160 397,824 26%
GI Sheets/ Pre-painted/Zn-Al 1,255,127 951,304 32%
Tinplates/TFS* 205,244 199,169 3%
Welded Pipes and Tubes 304,357 253,256 20%
Others (Alloy & Stainless Steels) 0 0 -

Breakdown of Finished Steel Exportsin MT (2016 vs. 2015)
In Metric Tons Yr-Yr
2016 2015 Change
Bars / Sections - -
Wires - -
Hot Rolled Coils/Sheets - -
Cold Rolled Coils/Sheets - -
GI Sheets/ Pre-painted/Zn-Al - -
Welded Pipes and Tubes 100,000 100,000 -
TOTAL 100,000 100,000

Philippine Economic Outlook for 2017
Government forecast is for GDP to grow 6.9% in 2017
However, there are downside risks arising from:
1. Power shortage (regional)
2. Natural calamities
3. Political distractions
The challenge to the Philippines:
1. China exports (all products)
2. Port congestion, timely delivery of finished goods
3. Shortage of skilled workers
4. Absorptive capacity of private and public sectors to build the required physical infrastructure

Steel Outlook for 2017
Steel demand to benefit from:
• Implementation of big-ticket government infrastructure
• Increased government spending on nationwide
infrastructure development
• Expected resurgence of manufacturing sector
The steel supply situation in 2017:
• Full utilization for the local production of rebars, shapes
and sections
• Increased importation of finished steel products

New Steel Projects
• SteelAsia - New 500MTPA Small Sections and Merchant Bar Rolling Mill in Calaca, Batangas– commissioning Q4 2019
• Mitsubishi Motors Philippines Corporation –New Stamping Shop Facility in Sta. Rosa, Laguna – operational in Q1 2018

Suite 509 Cityland Shaw Tower, Shaw Blvd., Mandaluyong City Mobile: 0917-625-9483 Fax: 631-0773 Tel.: 636-5263
E-Mail: [email protected]
PHILIPPINE IRON & STEEL INSTITUTE
Thank you.