Embed Size (px)
Citation preview
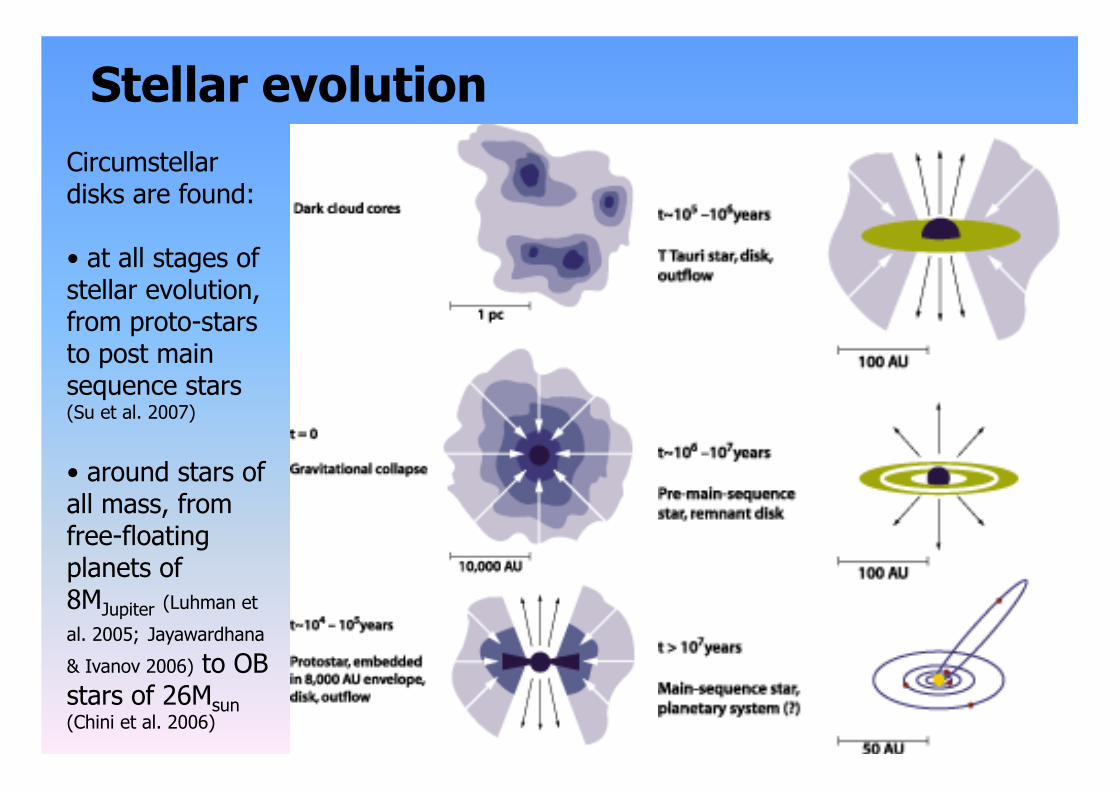
Stellar evolution Circumstellar disks are found:
• at all stages of stellar evolution, from proto-stars to post main sequence stars (Su et al. 2007)
• around stars of all mass, from free-floating planets of 8MJupiter (Luhman et
al. 2005; Jayawardhana
& Ivanov 2006) to OB stars of 26Msun (Chini et al. 2006)
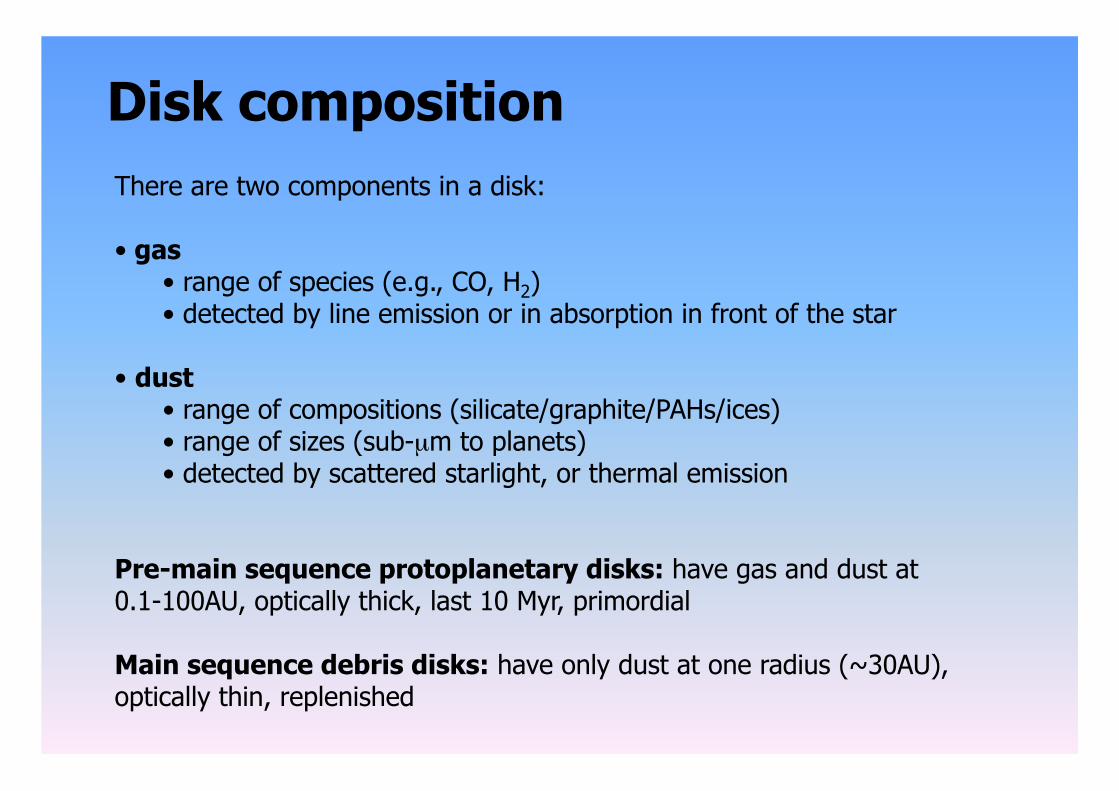
Disk composition There are two components in a disk:
• gas • range of species (e.g., CO, H2) • detected by line emission or in absorption in front of the star
• dust • range of compositions (silicate/graphite/PAHs/ices) • range of sizes (sub-µm to planets) • detected by scattered starlight, or thermal emission
Pre-main sequence protoplanetary disks: have gas and dust at 0.1-100AU, optically thick, last 10 Myr, primordial
Main sequence debris disks: have only dust at one radius (~30AU), optically thin, replenished
Wavelength vs radius probed
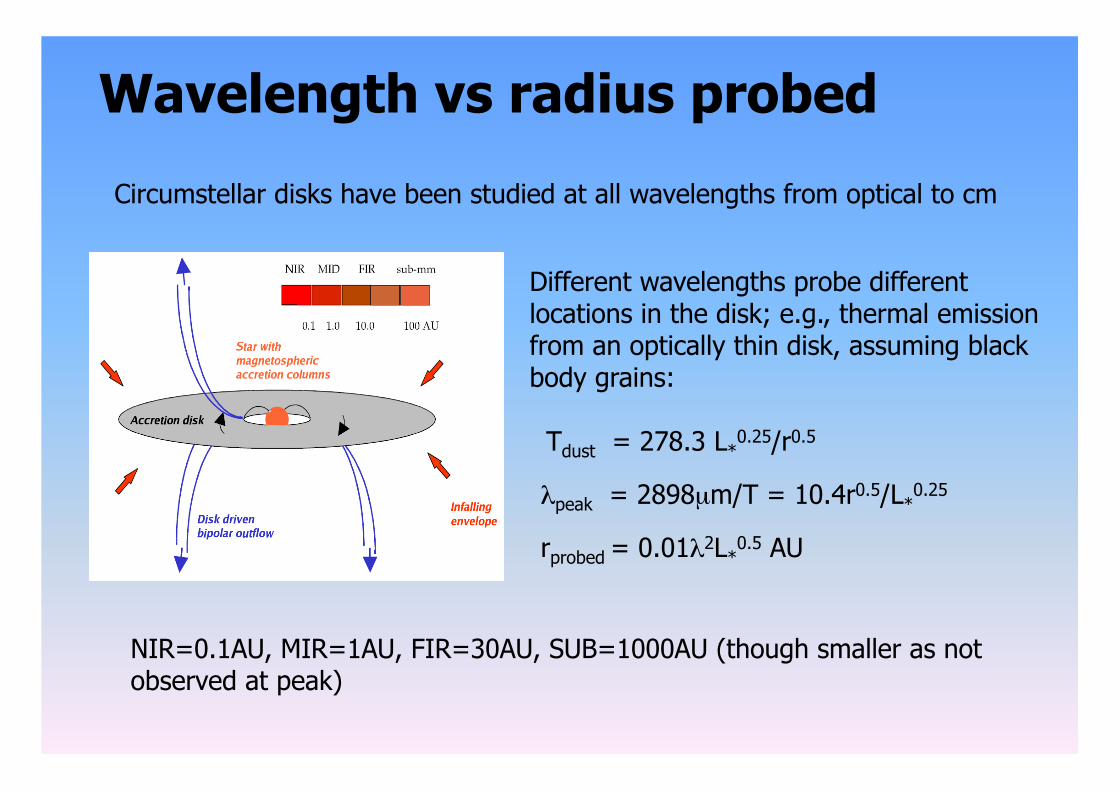
Circumstellar disks have been studied at all wavelengths from optical to cm
Different wavelengths probe different locations in the disk; e.g., thermal emission from an optically thin disk, assuming black body grains:
Tdust = 278.3 L*0.25/r0.5
λpeak = 2898µm/T = 10.4r0.5/L*0.25
rprobed = 0.01λ2L*0.5 AU
NIR=0.1AU, MIR=1AU, FIR=30AU, SUB=1000AU (though smaller as not observed at peak)
Wavelength vs dust size probed
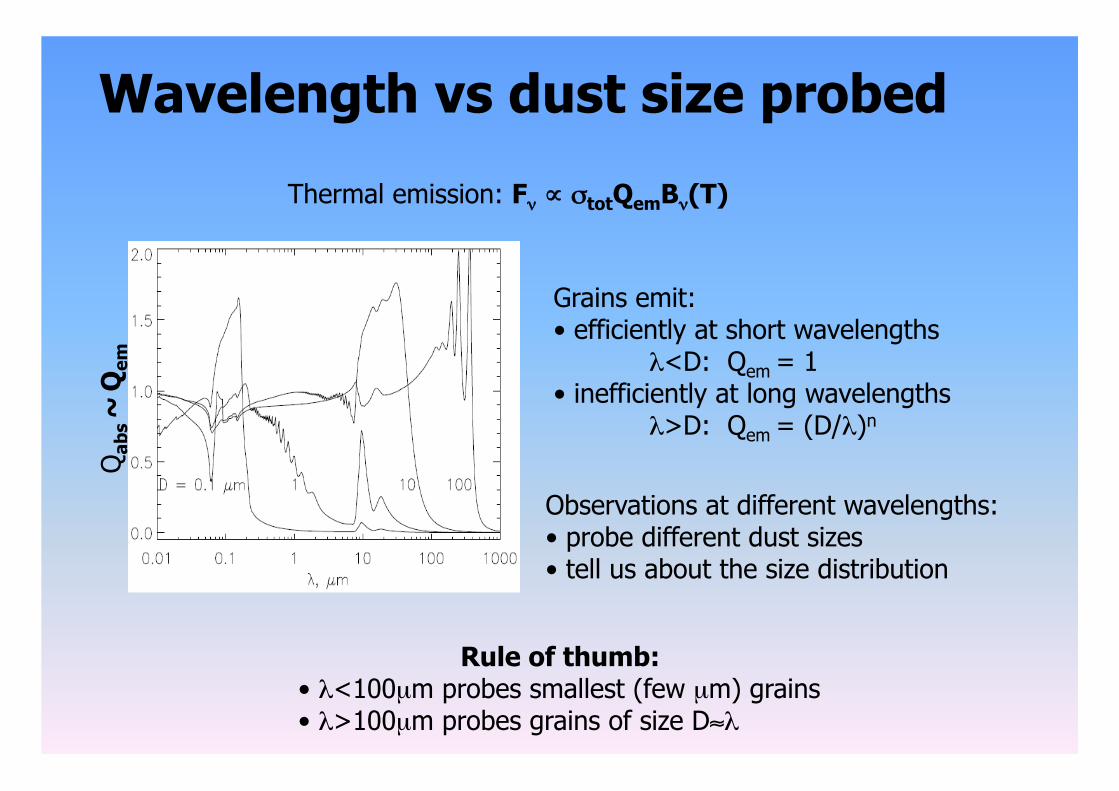
Observations at different wavelengths: • probe different dust sizes • tell us about the size distribution
Rule of thumb: • λ<100µm probes smallest (few µm) grains • λ>100µm probes grains of size D≈λ
Thermal emission: Fν ∝ σtotQemBν(T)
Grains emit: • efficiently at short wavelengths
λ<D: Qem = 1 • inefficiently at long wavelengths
λ>D: Qem = (D/λ)n
Qab
s ~
Qem
Problem of number of nearby stars
Local stellar density is low, ~0.27/pc3, meaning:
(1) There are few nearby young stars
• average lifetime of 10Gyr implies nearest star <10Myr is ~16pc
• stars form in clusters of hundreds; nearest ones are at 140pc
• hard to find 10-100Myr as no youth indicators (molecular cloud)
• young star streams (e.g., TWHya association, β Pic moving group)
(2) There is a finite number of stars amenable to resolved imaging with current telescopes, so advances in resolution (and/or sensitivity) are required
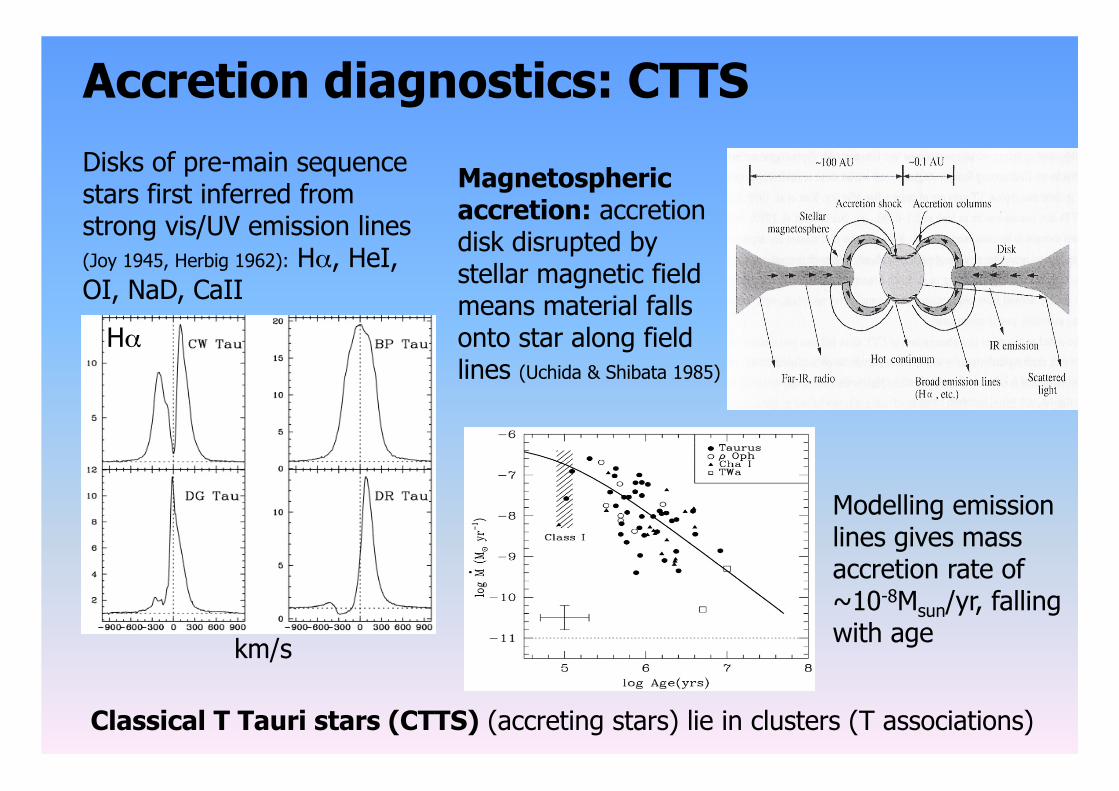
Accretion diagnostics: CTTS Disks of pre-main sequence stars first inferred from strong vis/UV emission lines (Joy 1945, Herbig 1962): Hα, HeI, OI, NaD, CaII
km/s
Modelling emission lines gives mass accretion rate of ~10-8Msun/yr, falling with age
Magnetospheric accretion: accretion disk disrupted by stellar magnetic field means material falls onto star along field lines (Uchida & Shibata 1985)
Classical T Tauri stars (CTTS) (accreting stars) lie in clusters (T associations)
Hα
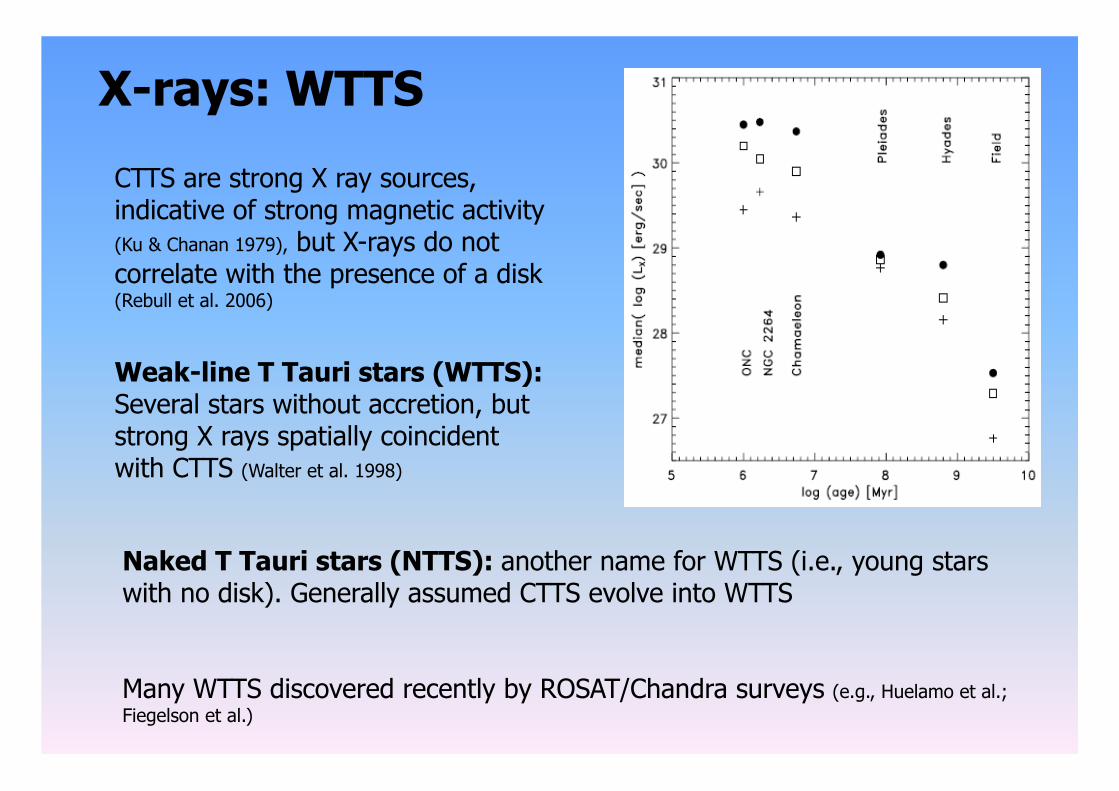
X-rays: WTTS
CTTS are strong X ray sources, indicative of strong magnetic activity (Ku & Chanan 1979), but X-rays do not correlate with the presence of a disk (Rebull et al. 2006)
Weak-line T Tauri stars (WTTS): Several stars without accretion, but strong X rays spatially coincident with CTTS (Walter et al. 1998)
Naked T Tauri stars (NTTS): another name for WTTS (i.e., young stars with no disk). Generally assumed CTTS evolve into WTTS
Many WTTS discovered recently by ROSAT/Chandra surveys (e.g., Huelamo et al.; Fiegelson et al.)
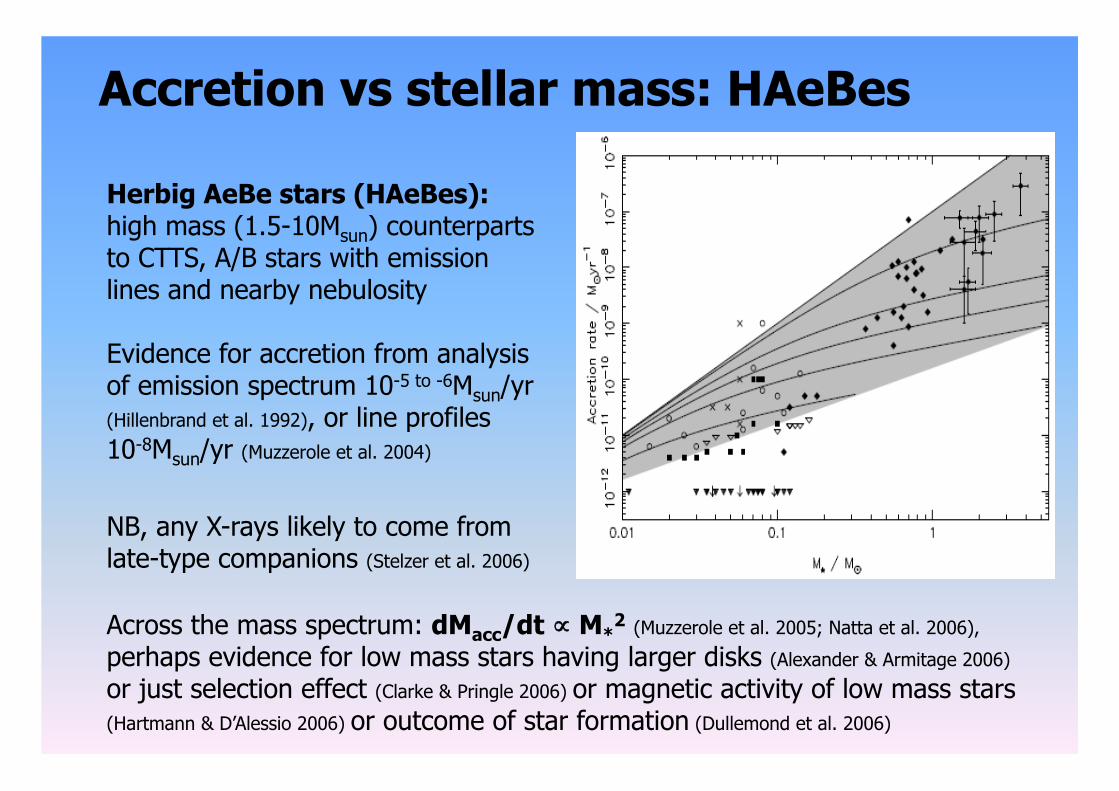
Accretion vs stellar mass: HAeBes
Herbig AeBe stars (HAeBes): high mass (1.5-10Msun) counterparts to CTTS, A/B stars with emission lines and nearby nebulosity
Evidence for accretion from analysis of emission spectrum 10-5 to -6Msun/yr (Hillenbrand et al. 1992), or line profiles 10-8Msun/yr (Muzzerole et al. 2004)
NB, any X-rays likely to come from late-type companions (Stelzer et al. 2006)
Across the mass spectrum: dMacc/dt ∝ M*2 (Muzzerole et al. 2005; Natta et al. 2006),
perhaps evidence for low mass stars having larger disks (Alexander & Armitage 2006) or just selection effect (Clarke & Pringle 2006) or magnetic activity of low mass stars
(Hartmann & D’Alessio 2006) or outcome of star formation (Dullemond et al. 2006)
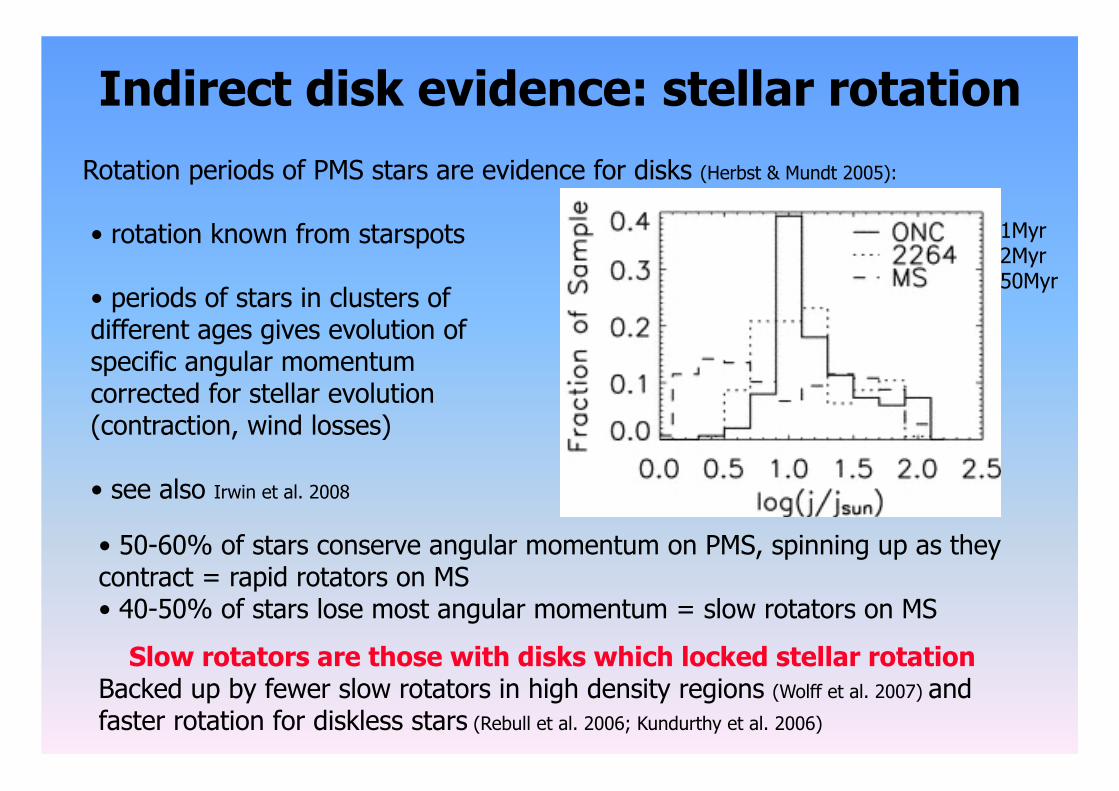
Indirect disk evidence: stellar rotation Rotation periods of PMS stars are evidence for disks (Herbst & Mundt 2005):
• 50-60% of stars conserve angular momentum on PMS, spinning up as they contract = rapid rotators on MS • 40-50% of stars lose most angular momentum = slow rotators on MS
Slow rotators are those with disks which locked stellar rotation Backed up by fewer slow rotators in high density regions (Wolff et al. 2007) and faster rotation for diskless stars (Rebull et al. 2006; Kundurthy et al. 2006)
• rotation known from starspots
• periods of stars in clusters of different ages gives evolution of specific angular momentum corrected for stellar evolution (contraction, wind losses)
• see also Irwin et al. 2008
1Myr 2Myr 50Myr
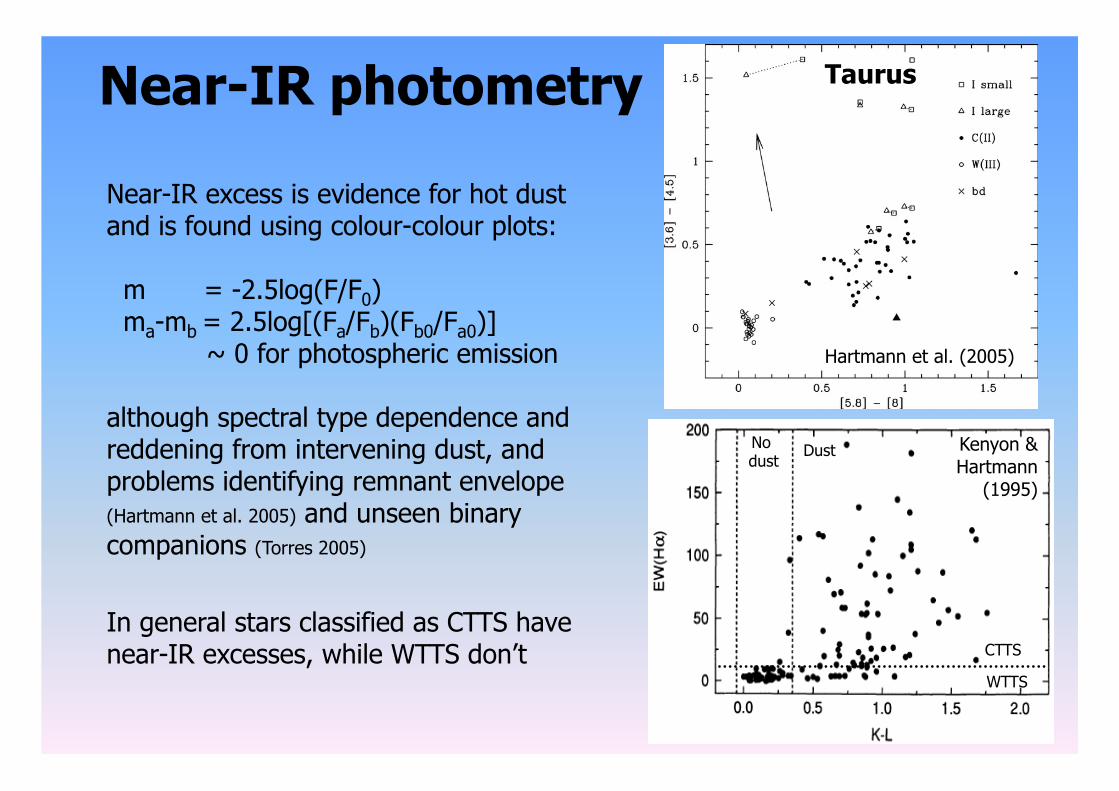
Near-IR photometry
Near-IR excess is evidence for hot dust and is found using colour-colour plots:
m = -2.5log(F/F0) ma-mb = 2.5log[(Fa/Fb)(Fb0/Fa0)] ~ 0 for photospheric emission
although spectral type dependence and reddening from intervening dust, and problems identifying remnant envelope (Hartmann et al. 2005) and unseen binary companions (Torres 2005)
In general stars classified as CTTS have near-IR excesses, while WTTS don’t
Hartmann et al. (2005)
CTTS
WTTS
Dust No dust
Kenyon & Hartmann
(1995)
Taurus
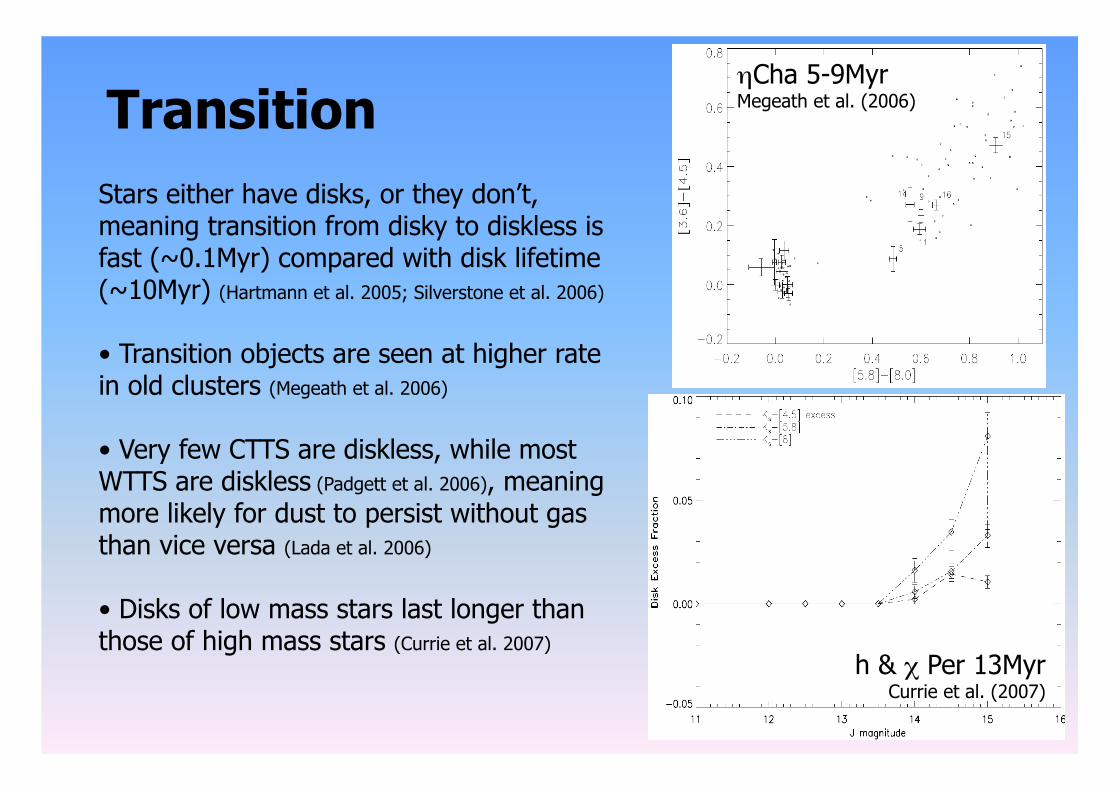
Transition Stars either have disks, or they don’t, meaning transition from disky to diskless is fast (~0.1Myr) compared with disk lifetime (~10Myr) (Hartmann et al. 2005; Silverstone et al. 2006)
• Transition objects are seen at higher rate in old clusters (Megeath et al. 2006)
• Very few CTTS are diskless, while most WTTS are diskless (Padgett et al. 2006), meaning more likely for dust to persist without gas than vice versa (Lada et al. 2006)
• Disks of low mass stars last longer than those of high mass stars (Currie et al. 2007)
h & χ Per 13Myr Currie et al. (2007)
η Cha 5-9Myr Megeath et al. (2006)
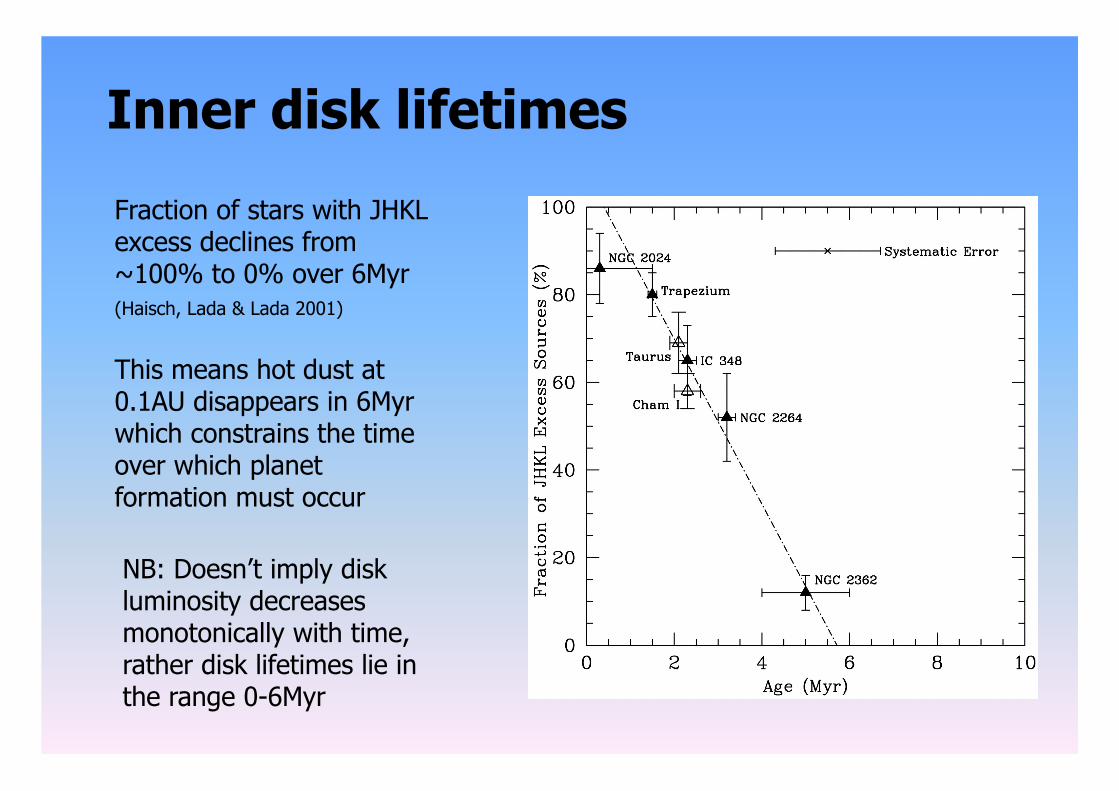
Inner disk lifetimes
Fraction of stars with JHKL excess declines from ~100% to 0% over 6Myr (Haisch, Lada & Lada 2001)
This means hot dust at 0.1AU disappears in 6Myr which constrains the time over which planet formation must occur
NB: Doesn’t imply disk luminosity decreases monotonically with time, rather disk lifetimes lie in the range 0-6Myr
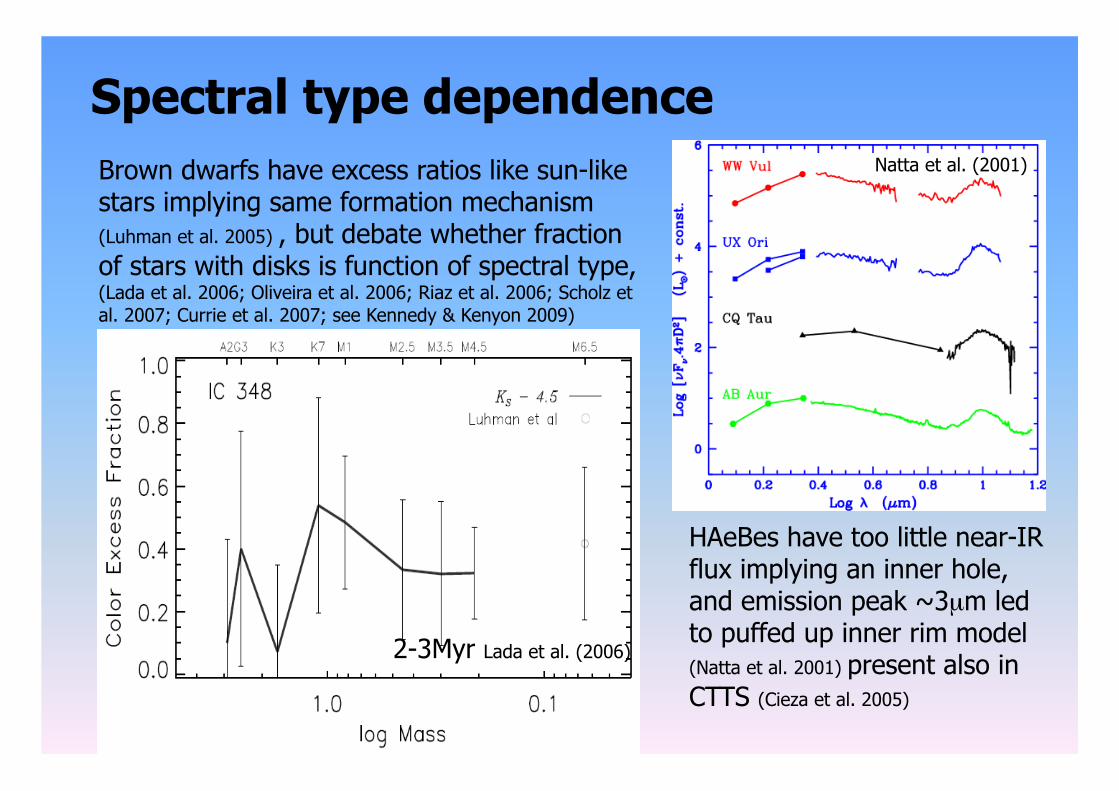
Spectral type dependence Brown dwarfs have excess ratios like sun-like stars implying same formation mechanism (Luhman et al. 2005) , but debate whether fraction of stars with disks is function of spectral type, (Lada et al. 2006; Oliveira et al. 2006; Riaz et al. 2006; Scholz et al. 2007; Currie et al. 2007; see Kennedy & Kenyon 2009)
HAeBes have too little near-IR flux implying an inner hole, and emission peak ~3µm led to puffed up inner rim model (Natta et al. 2001) present also in CTTS (Cieza et al. 2005)
2-3Myr Lada et al. (2006)
Natta et al. (2001)
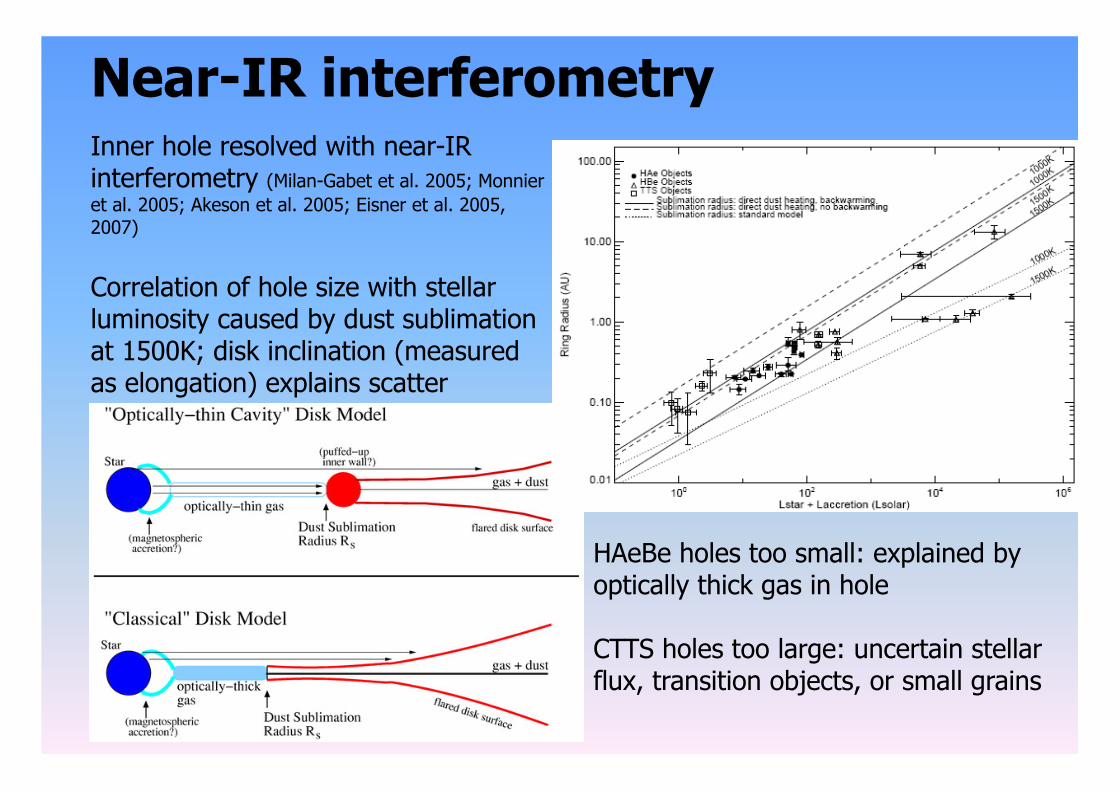
Near-IR interferometry Inner hole resolved with near-IR interferometry (Milan-Gabet et al. 2005; Monnier et al. 2005; Akeson et al. 2005; Eisner et al. 2005, 2007)
Correlation of hole size with stellar luminosity caused by dust sublimation at 1500K; disk inclination (measured as elongation) explains scatter
HAeBe holes too small: explained by optically thick gas in hole
CTTS holes too large: uncertain stellar flux, transition objects, or small grains
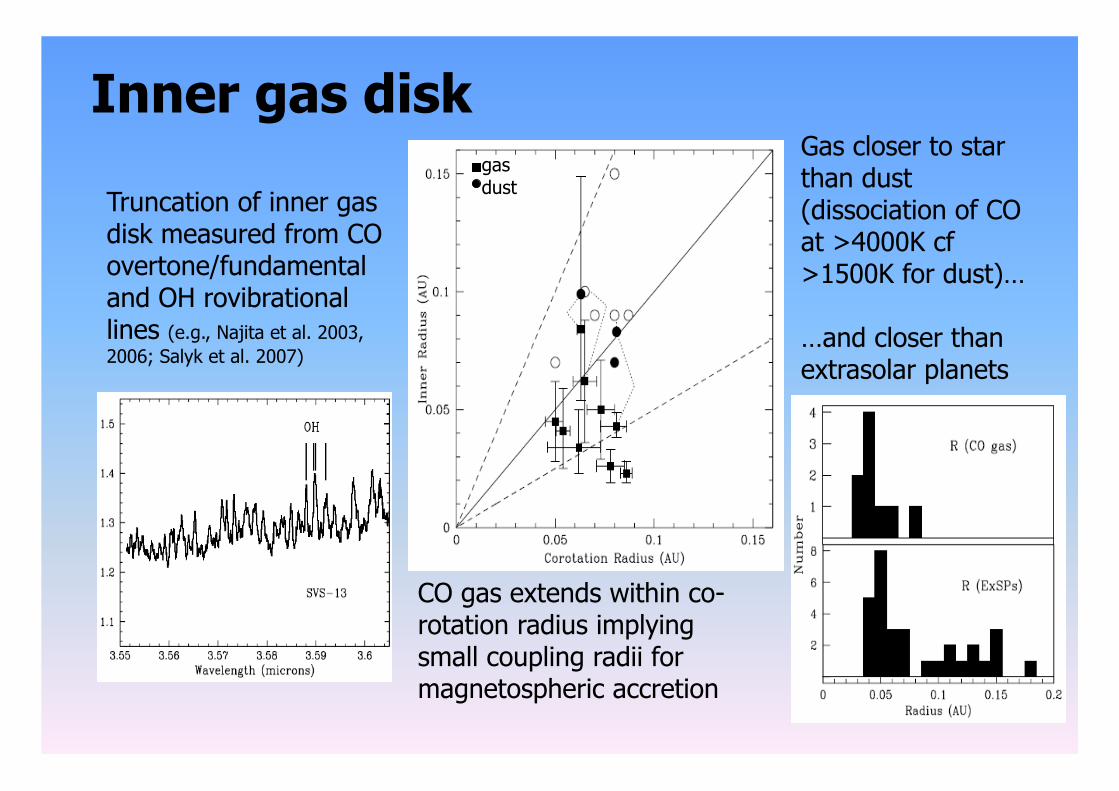
Inner gas disk
Truncation of inner gas disk measured from CO overtone/fundamental and OH rovibrational lines (e.g., Najita et al. 2003, 2006; Salyk et al. 2007)
Gas closer to star than dust (dissociation of CO at >4000K cf >1500K for dust)…
…and closer than extrasolar planets
CO gas extends within co-rotation radius implying small coupling radii for magnetospheric accretion
gas dust
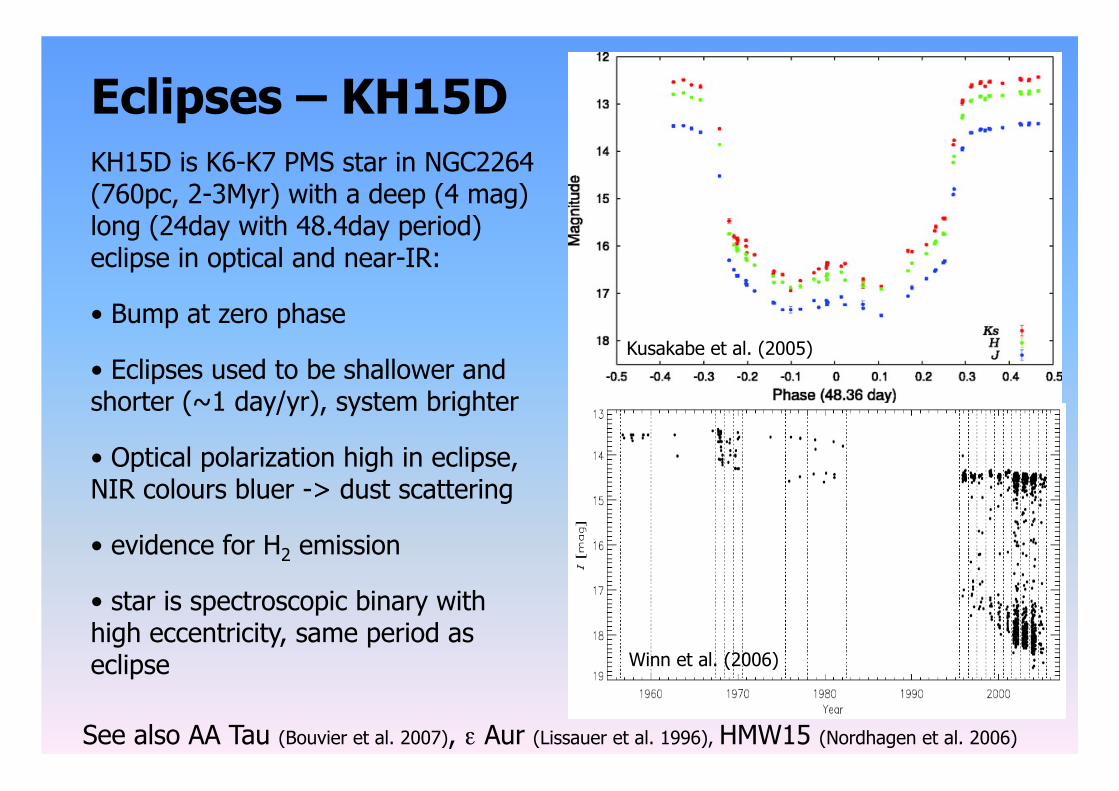
Eclipses – KH15D KH15D is K6-K7 PMS star in NGC2264 (760pc, 2-3Myr) with a deep (4 mag) long (24day with 48.4day period) eclipse in optical and near-IR:
• Bump at zero phase
• Eclipses used to be shallower and shorter (~1 day/yr), system brighter
• Optical polarization high in eclipse, NIR colours bluer -> dust scattering
• evidence for H2 emission
• star is spectroscopic binary with high eccentricity, same period as eclipse Winn et al. (2006)
Kusakabe et al. (2005)
See also AA Tau (Bouvier et al. 2007), ε Aur (Lissauer et al. 1996), HMW15 (Nordhagen et al. 2006)
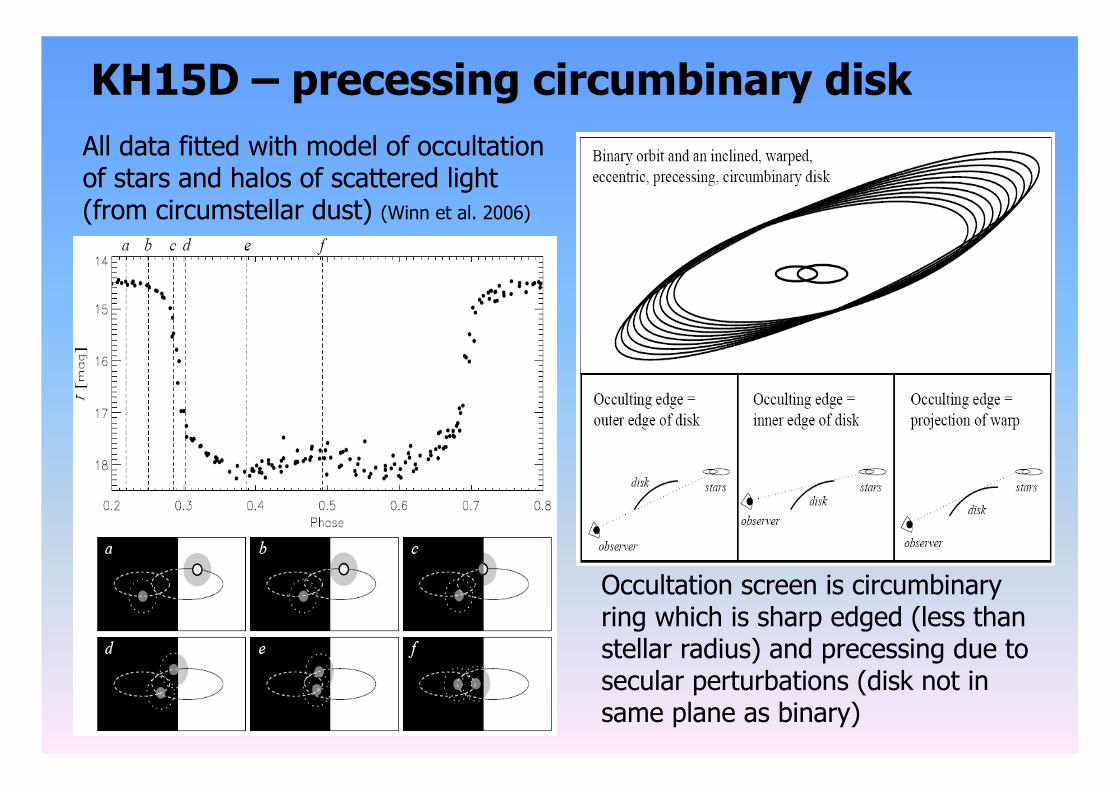
KH15D – precessing circumbinary disk All data fitted with model of occultation of stars and halos of scattered light (from circumstellar dust) (Winn et al. 2006)
Occultation screen is circumbinary ring which is sharp edged (less than stellar radius) and precessing due to secular perturbations (disk not in same plane as binary)
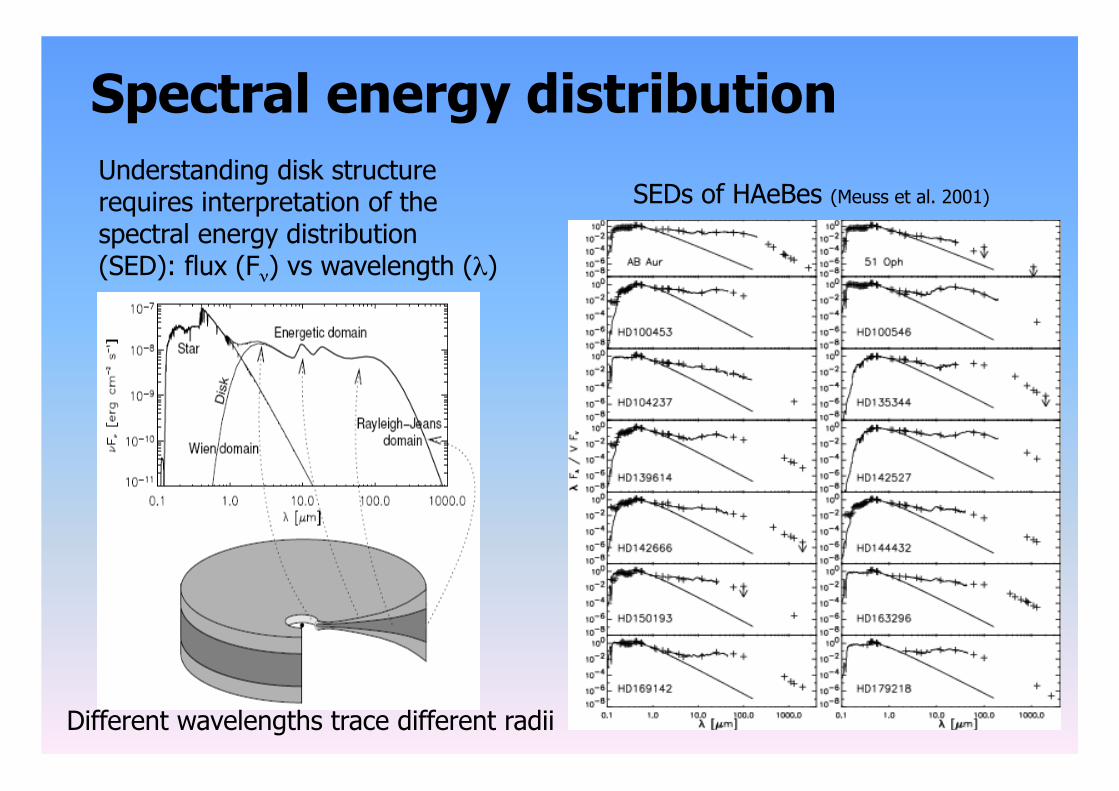
Spectral energy distribution Understanding disk structure requires interpretation of the spectral energy distribution (SED): flux (Fν) vs wavelength (λ)
SEDs of HAeBes (Meuss et al. 2001)
Different wavelengths trace different radii
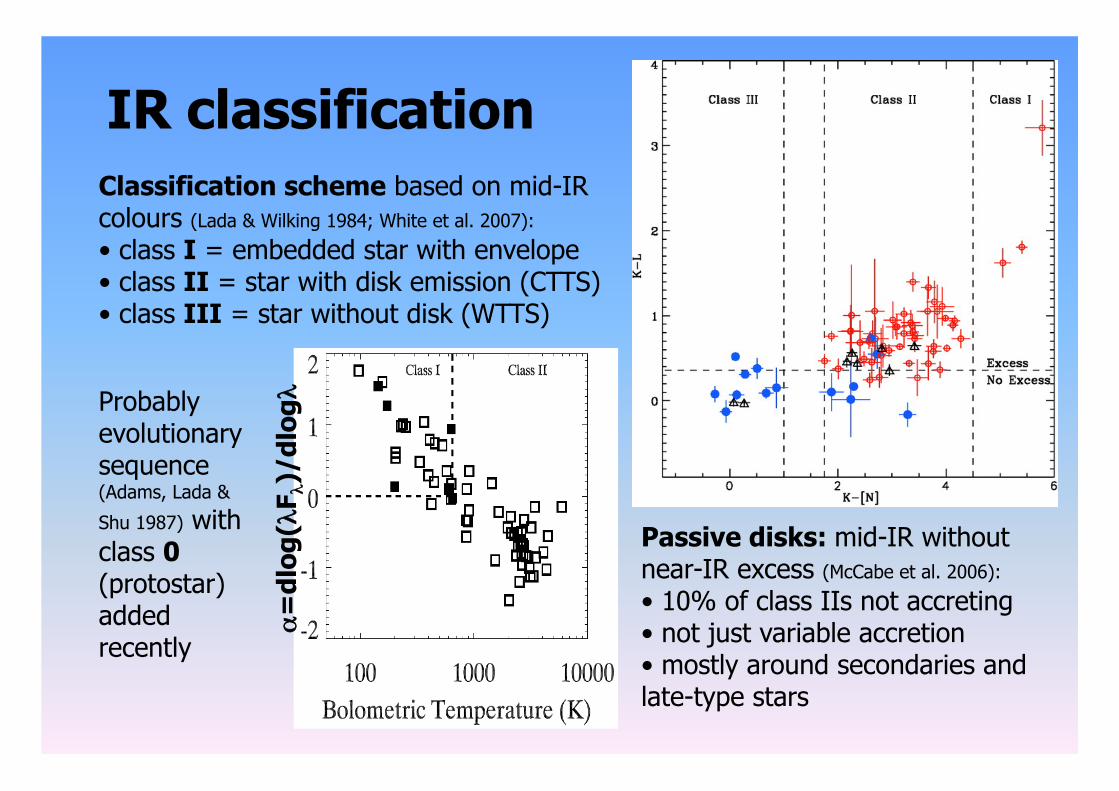
IR classification Classification scheme based on mid-IR colours (Lada & Wilking 1984; White et al. 2007):
• class I = embedded star with envelope • class II = star with disk emission (CTTS) • class III = star without disk (WTTS)
Passive disks: mid-IR without near-IR excess (McCabe et al. 2006): • 10% of class IIs not accreting • not just variable accretion • mostly around secondaries and late-type stars
Probably evolutionary sequence (Adams, Lada &
Shu 1987) with class 0 (protostar) added recently
α=
dlog
(λF λ
)/dl
ogλ
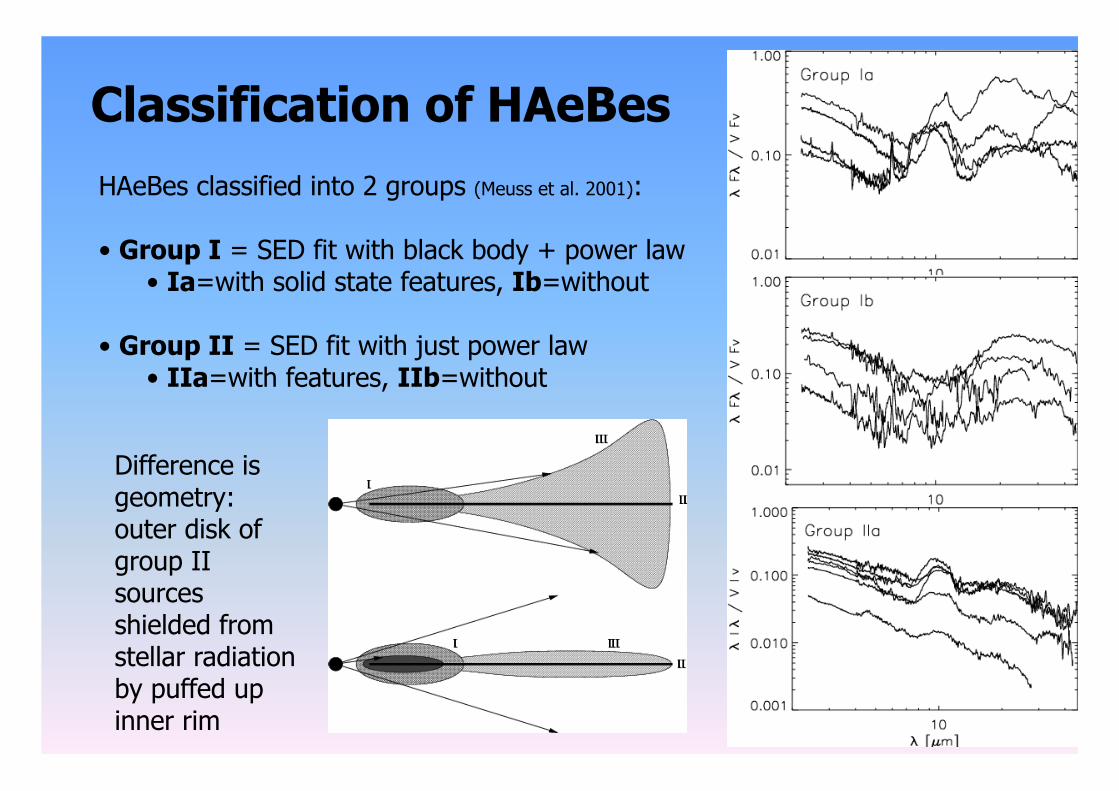
Classification of HAeBes HAeBes classified into 2 groups (Meuss et al. 2001):
• Group I = SED fit with black body + power law • Ia=with solid state features, Ib=without
• Group II = SED fit with just power law • IIa=with features, IIb=without
Difference is geometry: outer disk of group II sources shielded from stellar radiation by puffed up inner rim
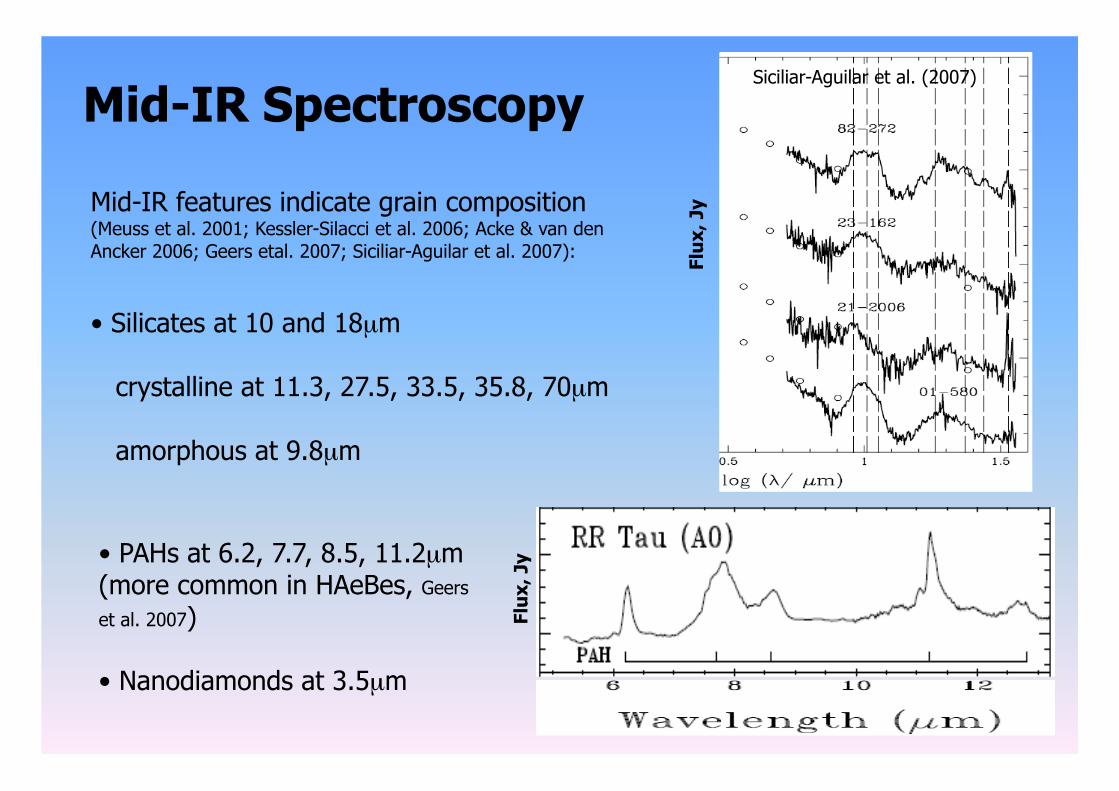
Mid-IR Spectroscopy
Mid-IR features indicate grain composition (Meuss et al. 2001; Kessler-Silacci et al. 2006; Acke & van den Ancker 2006; Geers etal. 2007; Siciliar-Aguilar et al. 2007):
• Silicates at 10 and 18µm
crystalline at 11.3, 27.5, 33.5, 35.8, 70µm
amorphous at 9.8µm
• PAHs at 6.2, 7.7, 8.5, 11.2µm (more common in HAeBes, Geers
et al. 2007)
• Nanodiamonds at 3.5µm Fl
ux, J
y
Flux
, Jy
Siciliar-Aguilar et al. (2007)
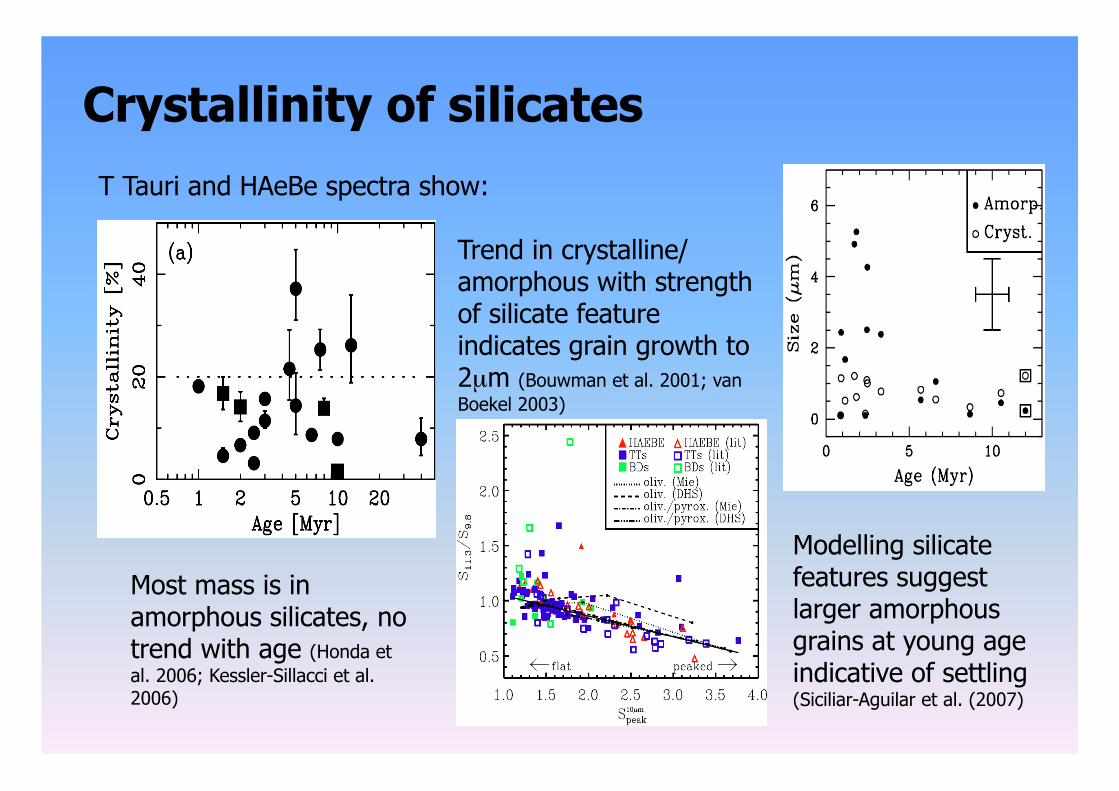
Crystallinity of silicates T Tauri and HAeBe spectra show:
Modelling silicate features suggest larger amorphous grains at young age indicative of settling (Siciliar-Aguilar et al. (2007)
Trend in crystalline/ amorphous with strength of silicate feature indicates grain growth to 2µm (Bouwman et al. 2001; van Boekel 2003)
Most mass is in amorphous silicates, no trend with age (Honda et al. 2006; Kessler-Sillacci et al. 2006)
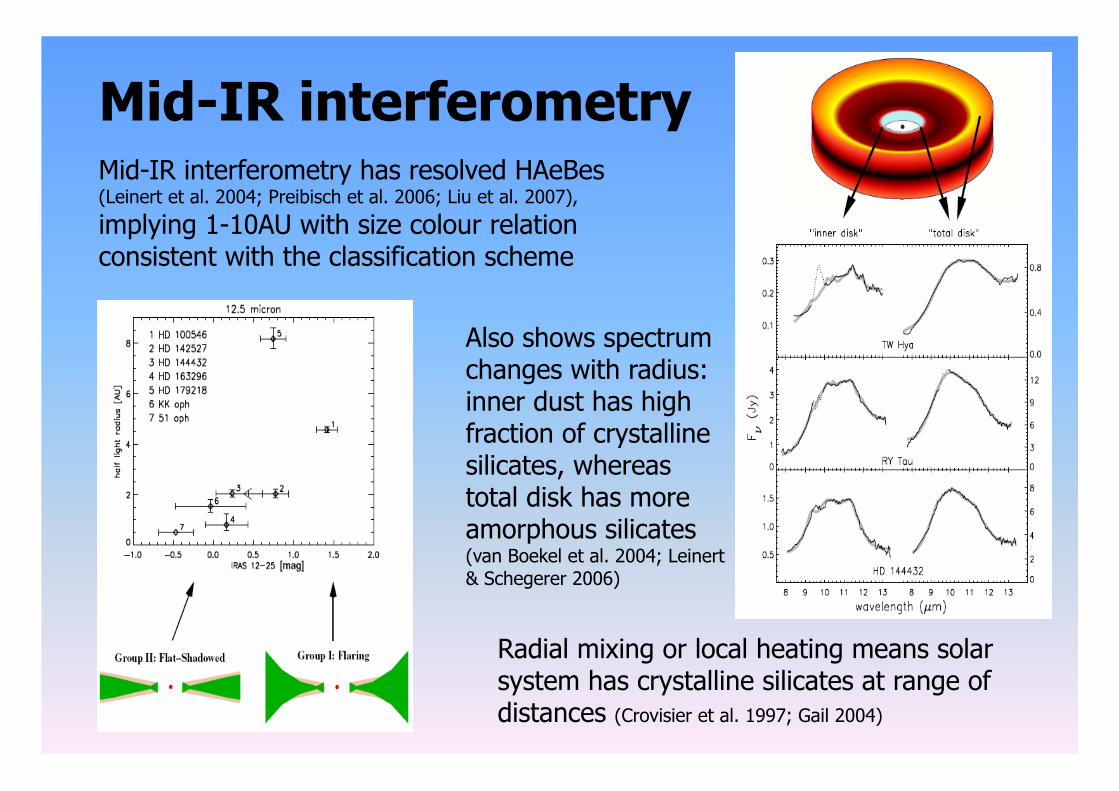
Mid-IR interferometry Mid-IR interferometry has resolved HAeBes (Leinert et al. 2004; Preibisch et al. 2006; Liu et al. 2007),
implying 1-10AU with size colour relation consistent with the classification scheme
Also shows spectrum changes with radius: inner dust has high fraction of crystalline silicates, whereas total disk has more amorphous silicates (van Boekel et al. 2004; Leinert & Schegerer 2006)
Radial mixing or local heating means solar system has crystalline silicates at range of distances (Crovisier et al. 1997; Gail 2004)
Optical/near-IR coronagraphy
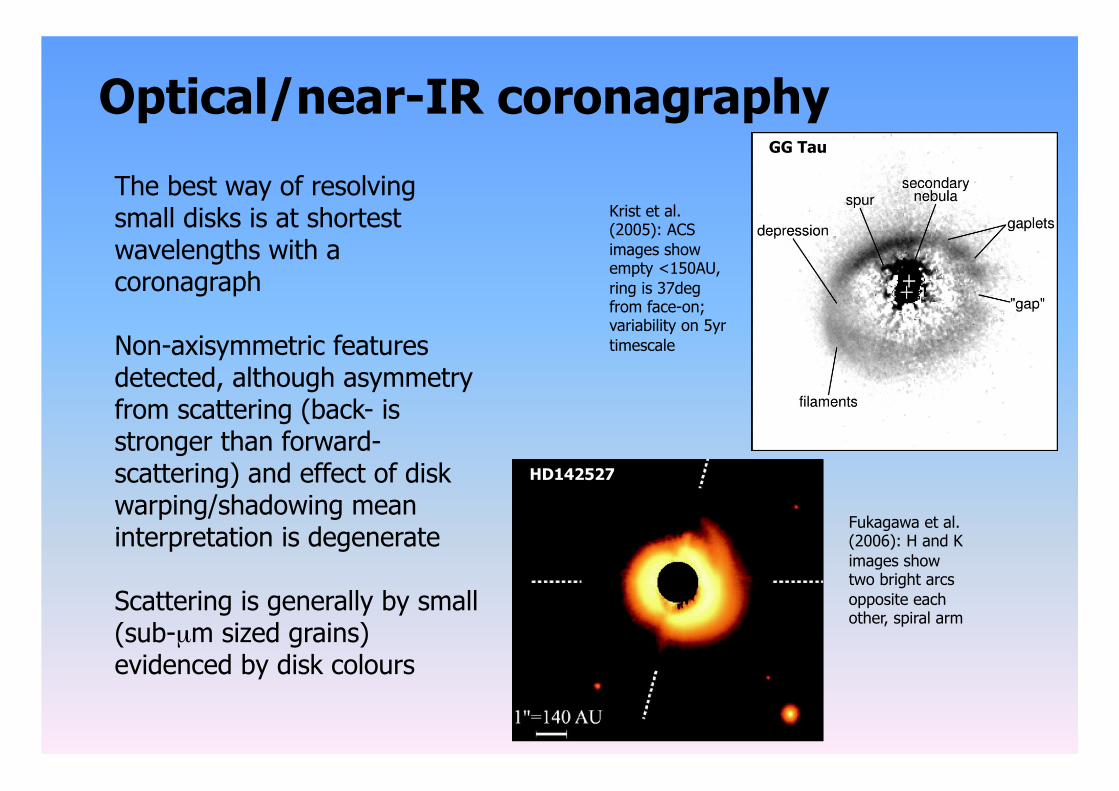
The best way of resolving small disks is at shortest wavelengths with a coronagraph
Non-axisymmetric features detected, although asymmetry from scattering (back- is stronger than forward- scattering) and effect of disk warping/shadowing mean interpretation is degenerate
Scattering is generally by small (sub-µm sized grains) evidenced by disk colours
Krist et al. (2005): ACS images show empty <150AU, ring is 37deg from face-on; variability on 5yr timescale
Fukagawa et al. (2006): H and K images show two bright arcs opposite each other, spiral arm
HD142527
GG Tau
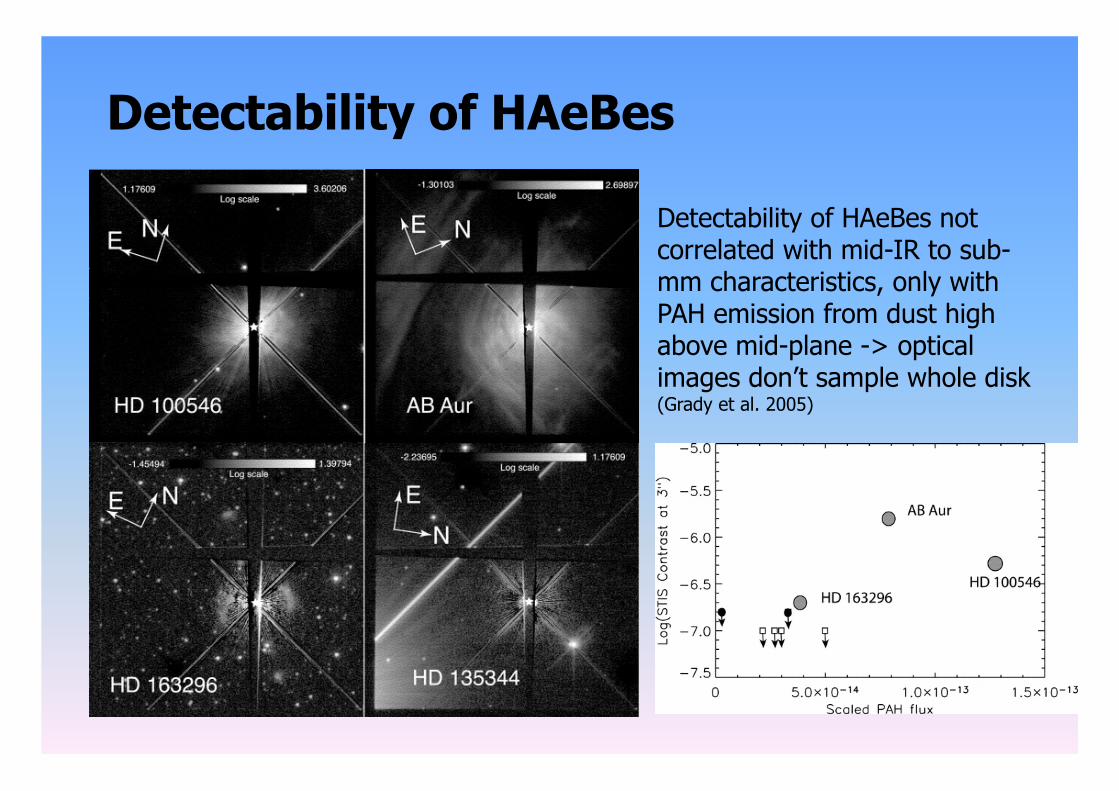
Detectability of HAeBes
Detectability of HAeBes not correlated with mid-IR to sub-mm characteristics, only with PAH emission from dust high above mid-plane -> optical images don’t sample whole disk (Grady et al. 2005)
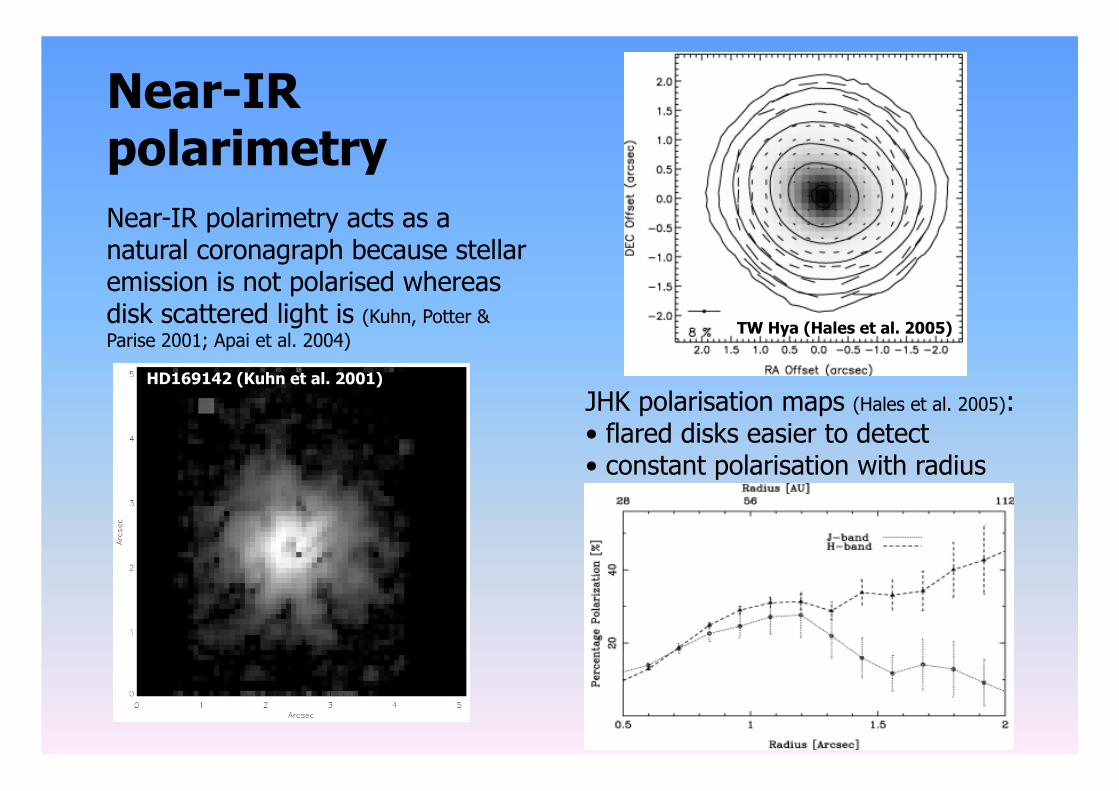
Near-IR polarimetry Near-IR polarimetry acts as a natural coronagraph because stellar emission is not polarised whereas disk scattered light is (Kuhn, Potter & Parise 2001; Apai et al. 2004)
TW Hya (Hales et al. 2005)
HD169142 (Kuhn et al. 2001)
JHK polarisation maps (Hales et al. 2005): • flared disks easier to detect • constant polarisation with radius
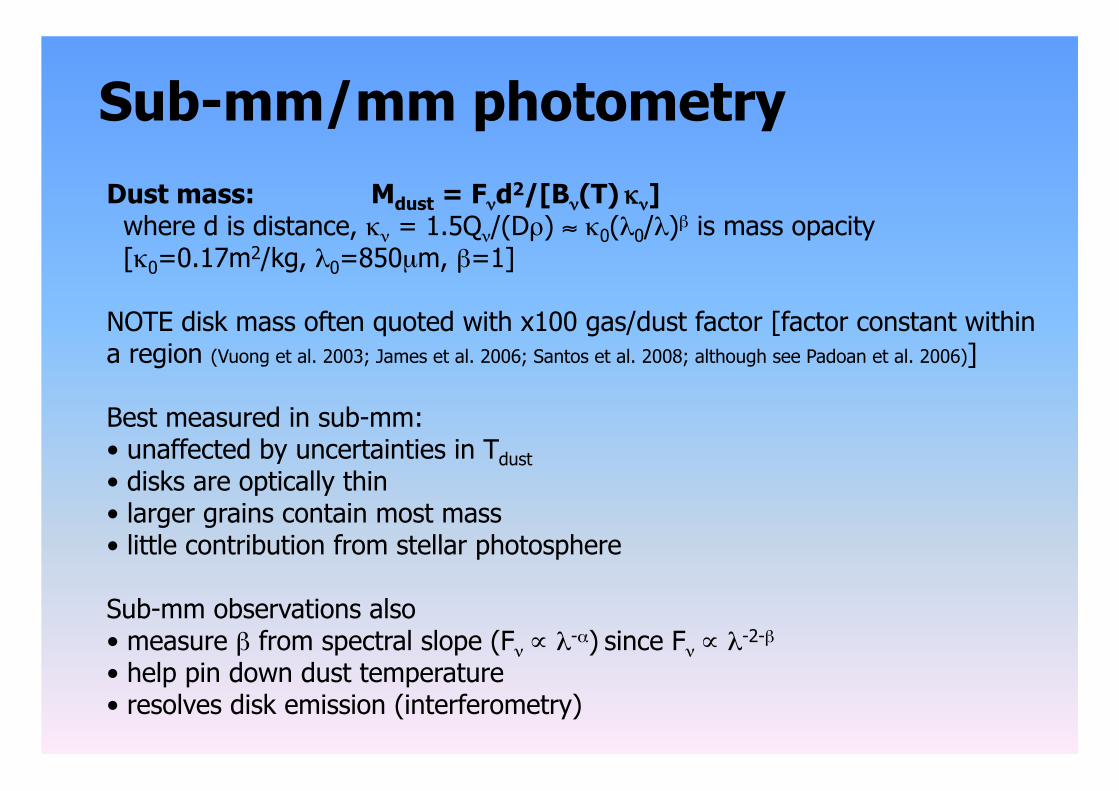
Sub-mm/mm photometry Dust mass: Mdust = Fνd2/[Bν(T) κν] where d is distance, κν = 1.5Qν/(Dρ) ≈ κ0(λ0/λ)β is mass opacity [κ0=0.17m2/kg, λ0=850µm, β=1]
NOTE disk mass often quoted with x100 gas/dust factor [factor constant within a region (Vuong et al. 2003; James et al. 2006; Santos et al. 2008; although see Padoan et al. 2006)]
Best measured in sub-mm: • unaffected by uncertainties in Tdust • disks are optically thin • larger grains contain most mass • little contribution from stellar photosphere
Sub-mm observations also • measure β from spectral slope (Fν ∝ λ-α) since Fν ∝ λ-2-β • help pin down dust temperature • resolves disk emission (interferometry)
Disk properties: mass, spectral slope
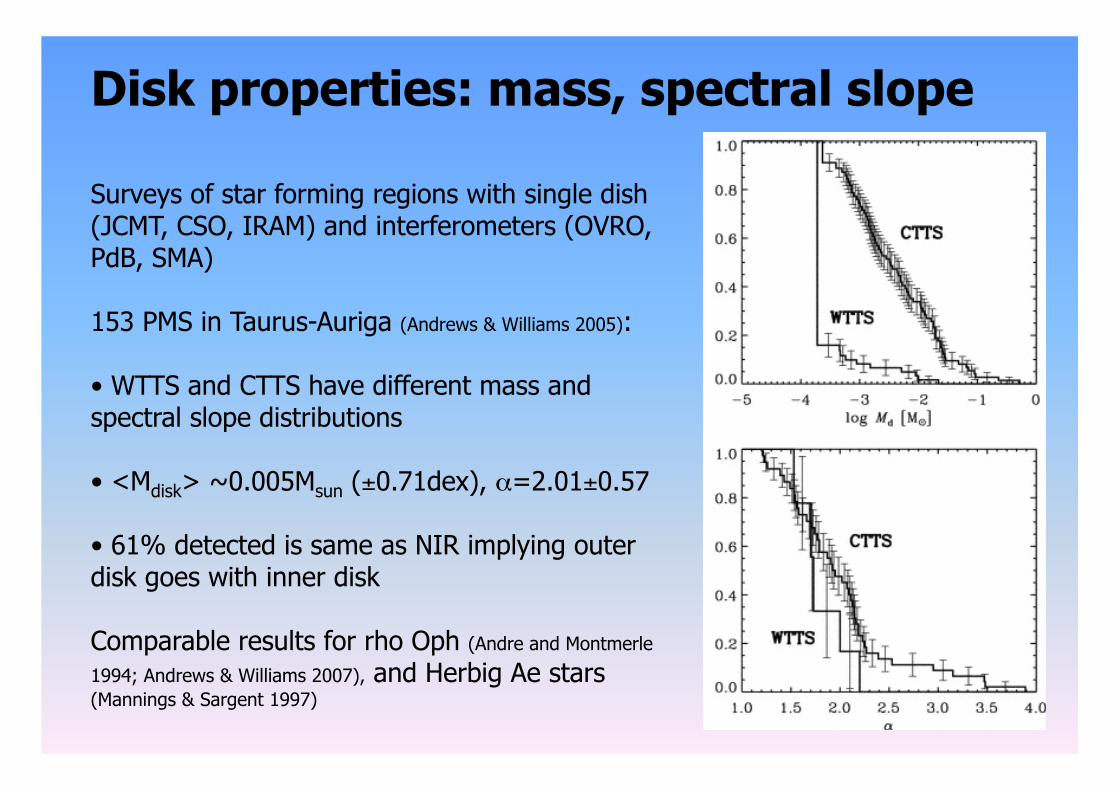
Surveys of star forming regions with single dish (JCMT, CSO, IRAM) and interferometers (OVRO, PdB, SMA)
153 PMS in Taurus-Auriga (Andrews & Williams 2005):
• WTTS and CTTS have different mass and spectral slope distributions
• <Mdisk> ~0.005Msun (±0.71dex), α=2.01±0.57
• 61% detected is same as NIR implying outer disk goes with inner disk
Comparable results for rho Oph (Andre and Montmerle
1994; Andrews & Williams 2007), and Herbig Ae stars (Mannings & Sargent 1997)
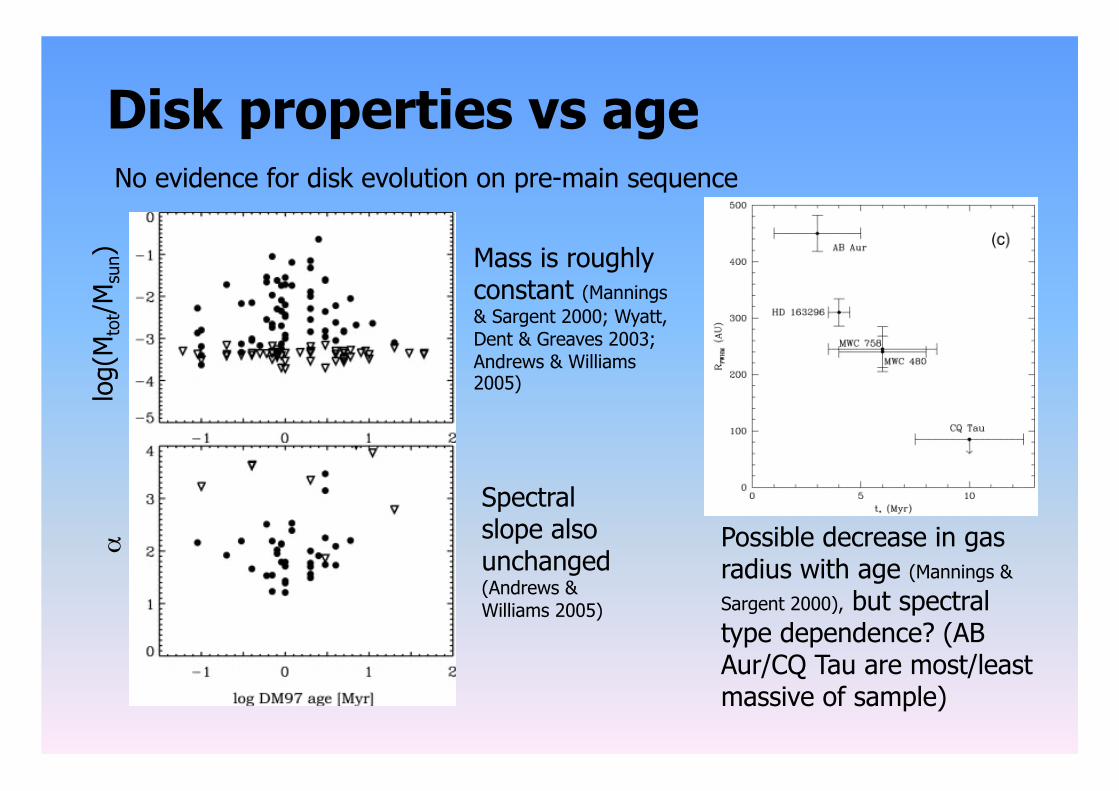
Disk properties vs age No evidence for disk evolution on pre-main sequence
log(
Mto
t/M
sun)
α
Mass is roughly constant (Mannings & Sargent 2000; Wyatt, Dent & Greaves 2003; Andrews & Williams 2005)
Spectral slope also unchanged (Andrews & Williams 2005)
Possible decrease in gas radius with age (Mannings &
Sargent 2000), but spectral type dependence? (AB Aur/CQ Tau are most/least massive of sample)
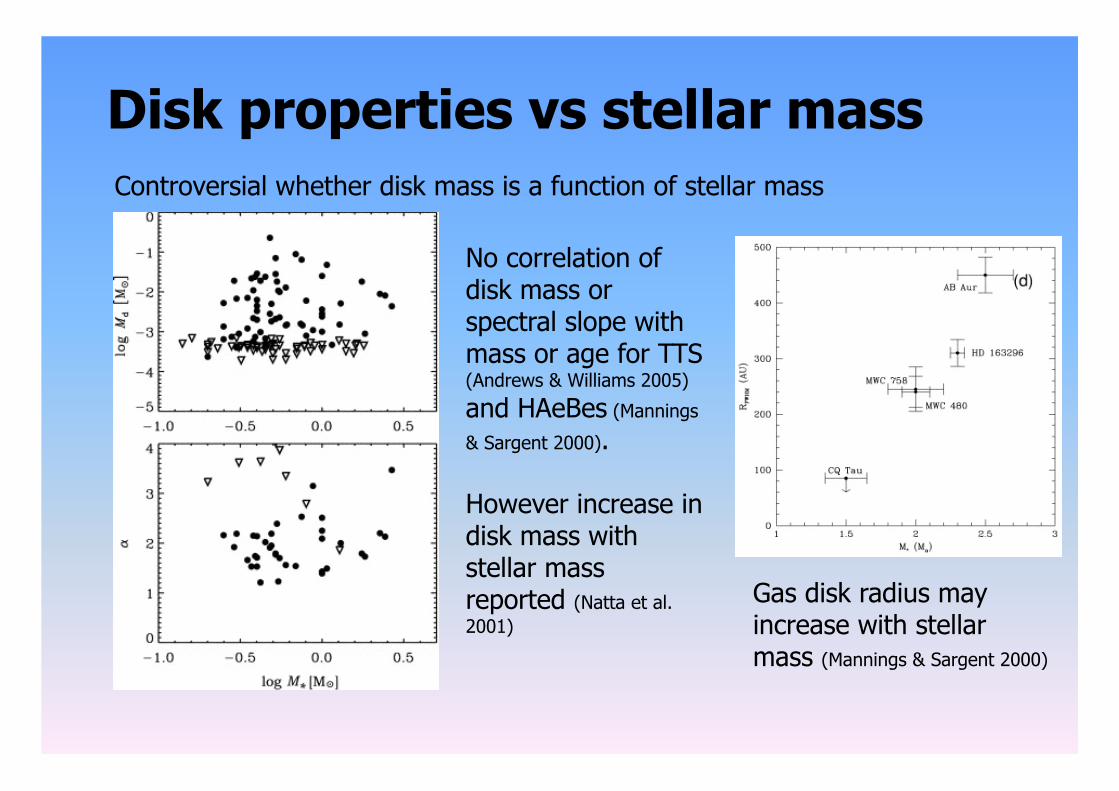
Disk properties vs stellar mass Controversial whether disk mass is a function of stellar mass
No correlation of disk mass or spectral slope with mass or age for TTS (Andrews & Williams 2005)
and HAeBes (Mannings
& Sargent 2000).
However increase in disk mass with stellar mass reported (Natta et al. 2001)
Gas disk radius may increase with stellar mass (Mannings & Sargent 2000)
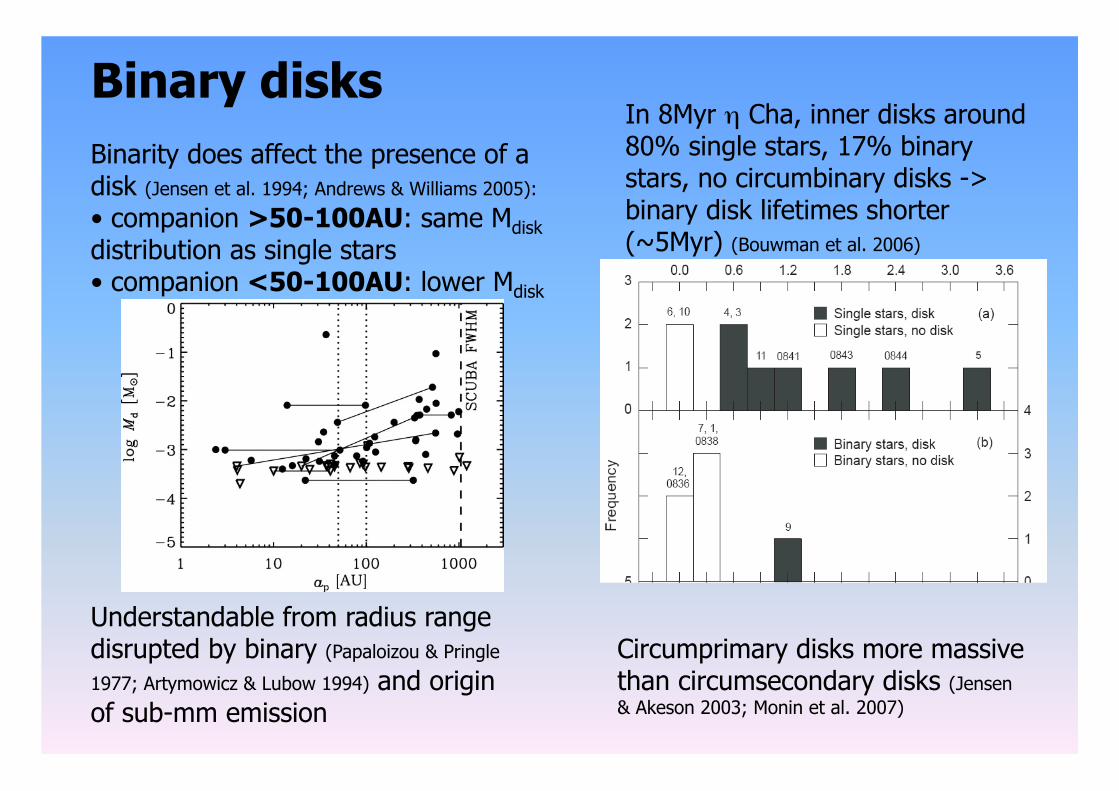
Binary disks
Understandable from radius range disrupted by binary (Papaloizou & Pringle
1977; Artymowicz & Lubow 1994) and origin of sub-mm emission
Binarity does affect the presence of a disk (Jensen et al. 1994; Andrews & Williams 2005):
• companion >50-100AU: same Mdisk distribution as single stars • companion <50-100AU: lower Mdisk
In 8Myr η Cha, inner disks around 80% single stars, 17% binary stars, no circumbinary disks -> binary disk lifetimes shorter (~5Myr) (Bouwman et al. 2006)
Circumprimary disks more massive than circumsecondary disks (Jensen & Akeson 2003; Monin et al. 2007)
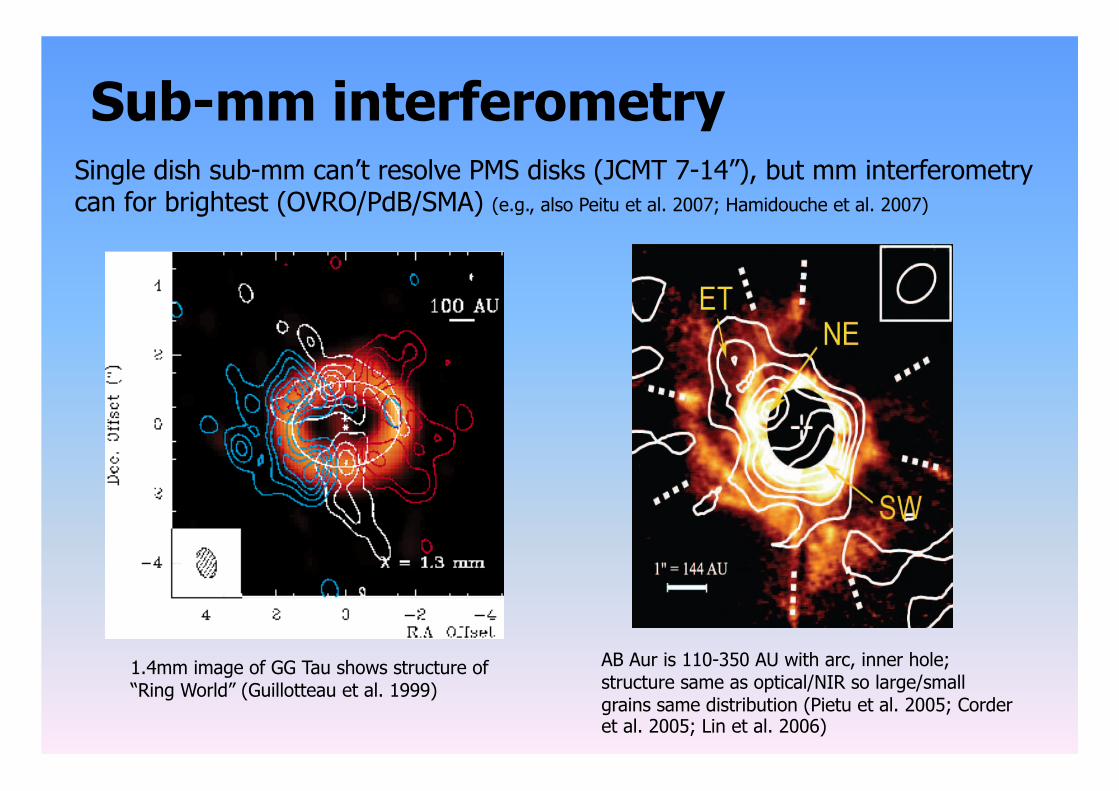
Sub-mm interferometry Single dish sub-mm can’t resolve PMS disks (JCMT 7-14”), but mm interferometry can for brightest (OVRO/PdB/SMA) (e.g., also Peitu et al. 2007; Hamidouche et al. 2007)
AB Aur is 110-350 AU with arc, inner hole; structure same as optical/NIR so large/small grains same distribution (Pietu et al. 2005; Corder et al. 2005; Lin et al. 2006)
1.4mm image of GG Tau shows structure of “Ring World” (Guillotteau et al. 1999)
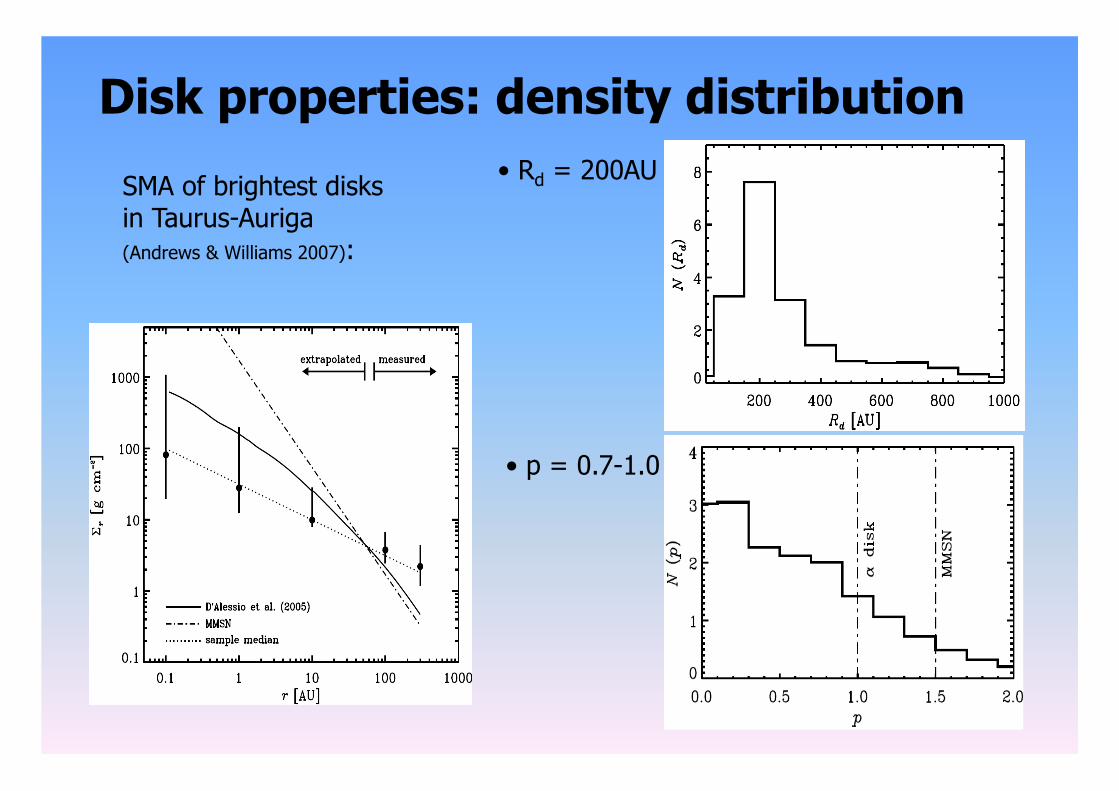
Disk properties: density distribution
SMA of brightest disks in Taurus-Auriga (Andrews & Williams 2007):
• p = 0.7-1.0
• Rd = 200AU
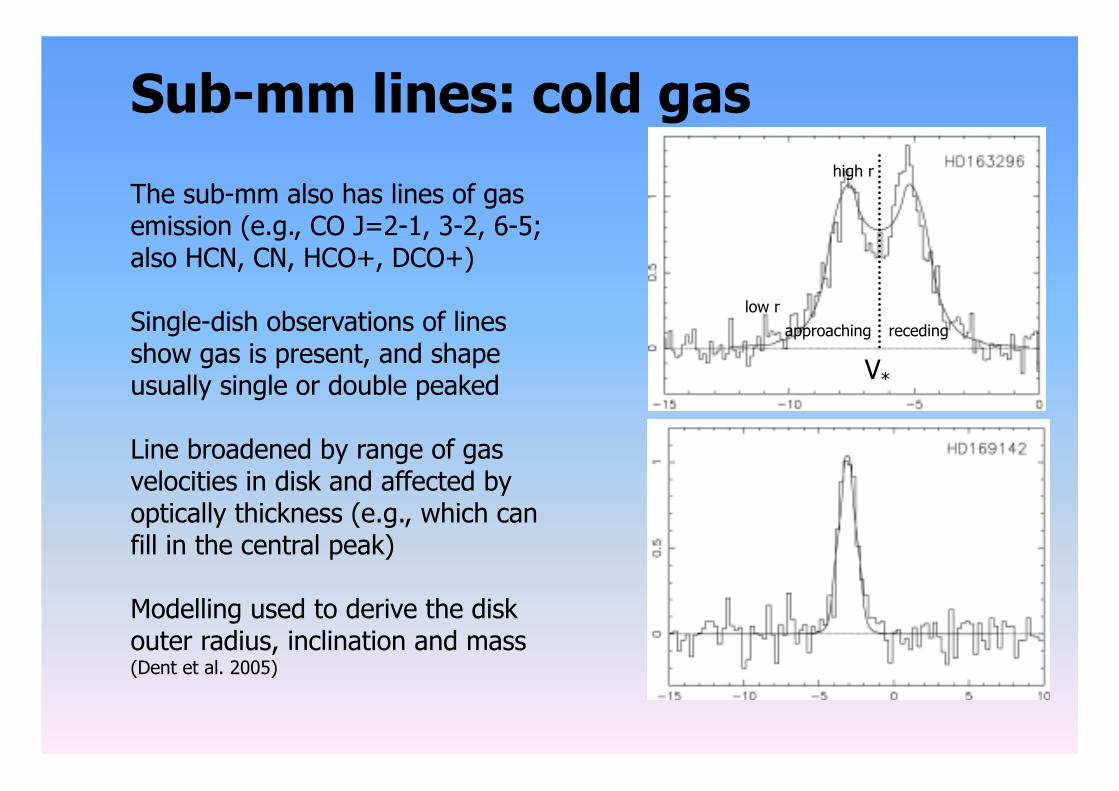
Sub-mm lines: cold gas
The sub-mm also has lines of gas emission (e.g., CO J=2-1, 3-2, 6-5; also HCN, CN, HCO+, DCO+)
Single-dish observations of lines show gas is present, and shape usually single or double peaked
Line broadened by range of gas velocities in disk and affected by optically thickness (e.g., which can fill in the central peak)
Modelling used to derive the disk outer radius, inclination and mass (Dent et al. 2005)
V*
low r
high r
receding approaching
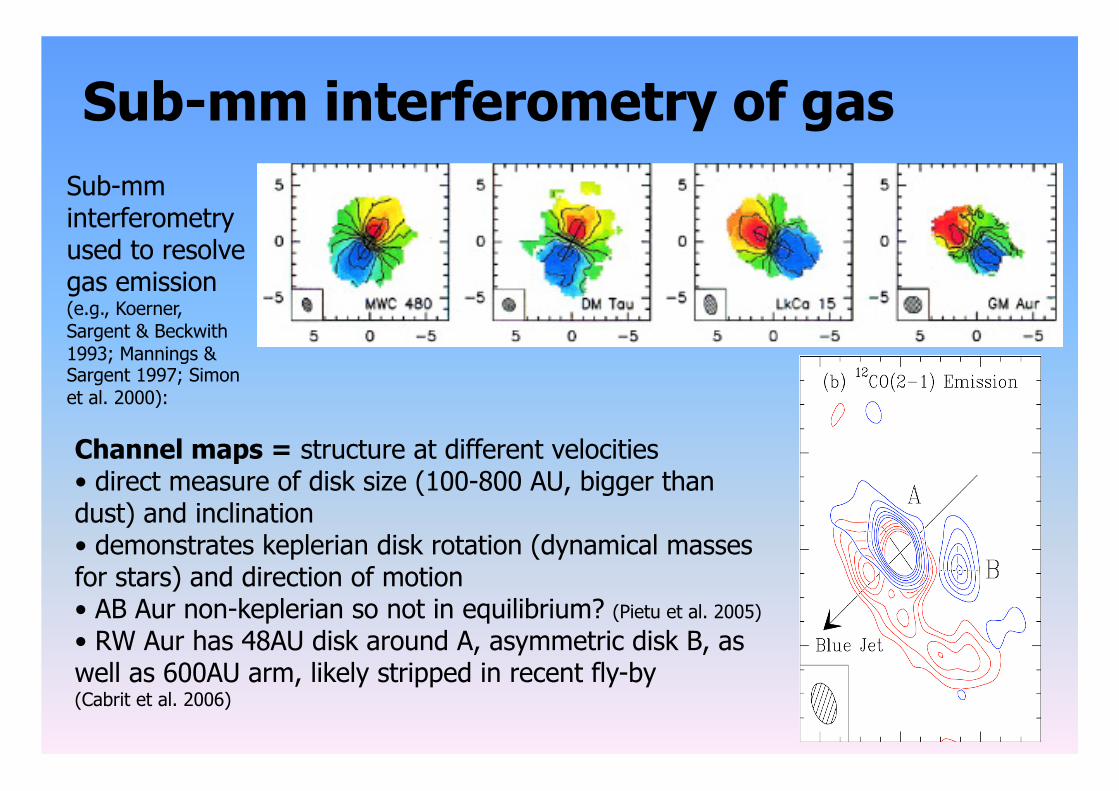
Sub-mm interferometry of gas Sub-mm interferometry used to resolve gas emission (e.g., Koerner, Sargent & Beckwith 1993; Mannings & Sargent 1997; Simon et al. 2000):
Channel maps = structure at different velocities • direct measure of disk size (100-800 AU, bigger than dust) and inclination • demonstrates keplerian disk rotation (dynamical masses for stars) and direction of motion • AB Aur non-keplerian so not in equilibrium? (Pietu et al. 2005)
• RW Aur has 48AU disk around A, asymmetric disk B, as well as 600AU arm, likely stripped in recent fly-by (Cabrit et al. 2006)
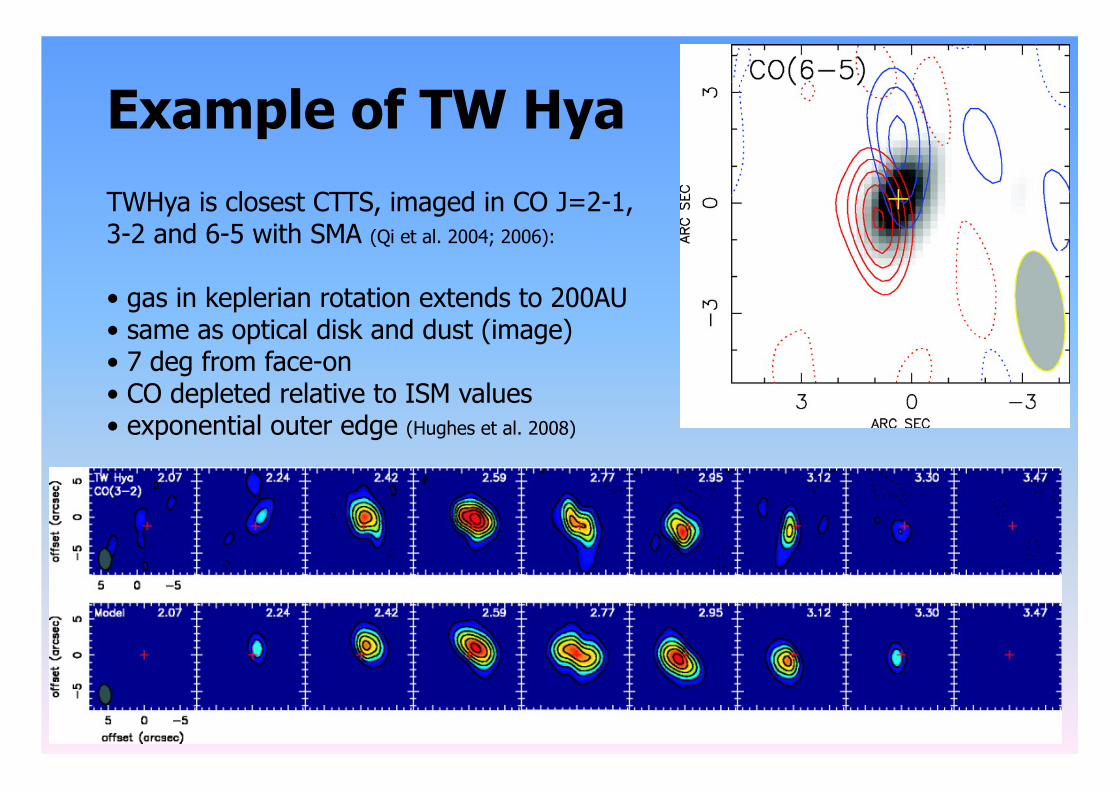
Example of TW Hya TWHya is closest CTTS, imaged in CO J=2-1, 3-2 and 6-5 with SMA (Qi et al. 2004; 2006):
• gas in keplerian rotation extends to 200AU • same as optical disk and dust (image) • 7 deg from face-on • CO depleted relative to ISM values • exponential outer edge (Hughes et al. 2008)
Other gas disk measurements
Gas disks also detected at other wavelengths:
H2 • Most abundant gas in disks, but hard to detect because electronic transitions are in FUV (optical and rho-vibrational are weak) • Fluorescent H2 emission: detected for all but 2 CTTS STIS/GHRS/FUSE, but not WTTS (Herczeg et al. 2002, 2006) • Mid-IR H2 emission: detected for AB Aur (Richter et al. 2002; Sheret et al. 2003)
OI • UVES of HD100546 and 97048 shows OI coincident with dust disk and clumpy, from surface layer of disk (Acke & van den Ancker 2006)
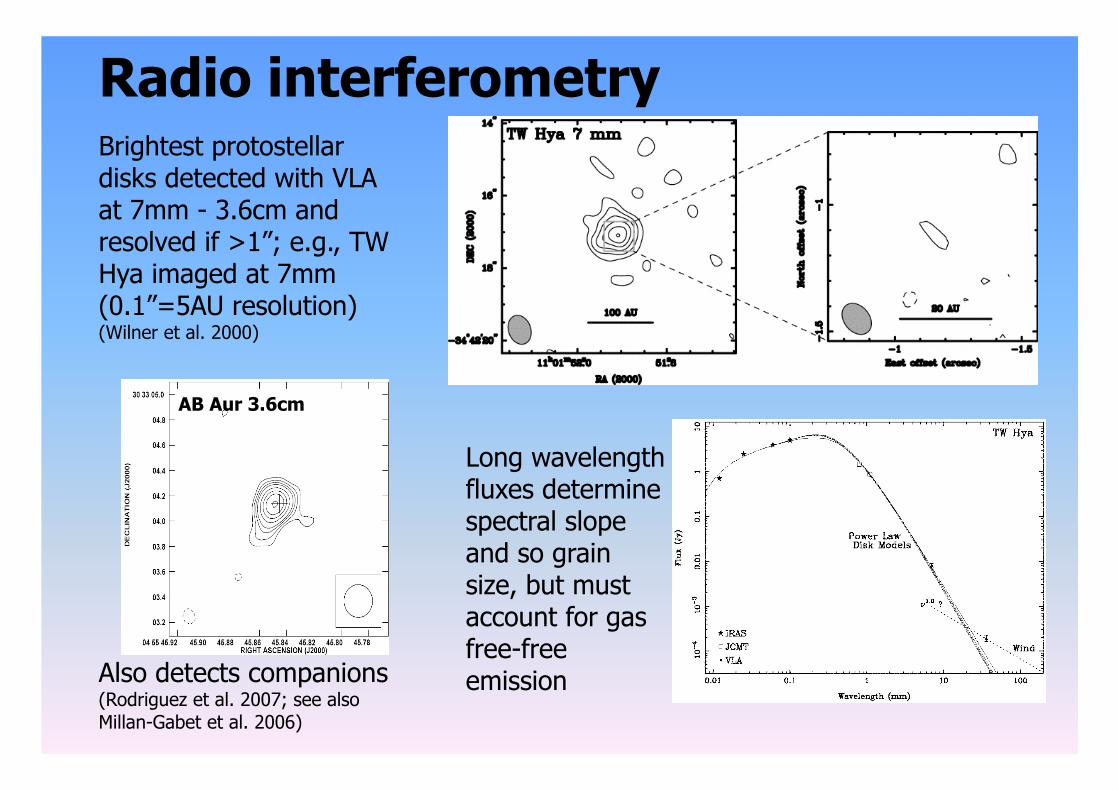
Radio interferometry Brightest protostellar disks detected with VLA at 7mm - 3.6cm and resolved if >1”; e.g., TW Hya imaged at 7mm (0.1”=5AU resolution) (Wilner et al. 2000)
Long wavelength fluxes determine spectral slope and so grain size, but must account for gas free-free emission Also detects companions
(Rodriguez et al. 2007; see also Millan-Gabet et al. 2006)
AB Aur 3.6cm
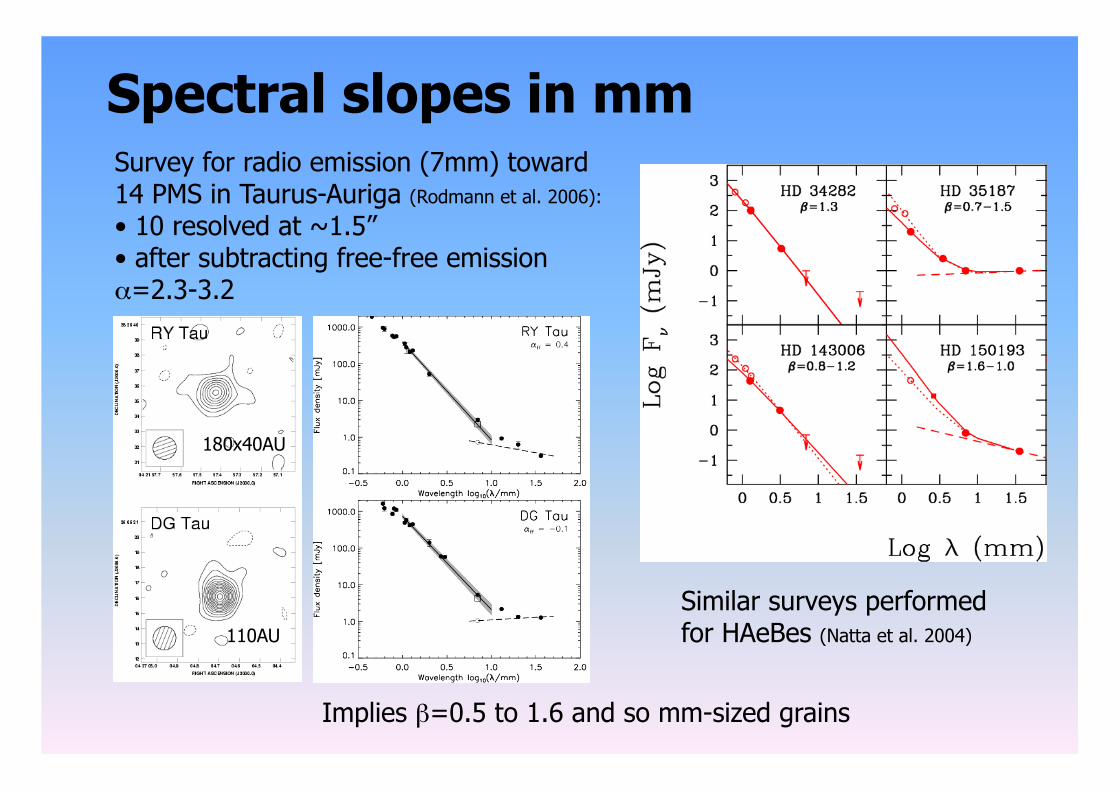
Spectral slopes in mm
Similar surveys performed for HAeBes (Natta et al. 2004)
Survey for radio emission (7mm) toward 14 PMS in Taurus-Auriga (Rodmann et al. 2006): • 10 resolved at ~1.5” • after subtracting free-free emission α=2.3-3.2
180x40AU
110AU
Implies β=0.5 to 1.6 and so mm-sized grains
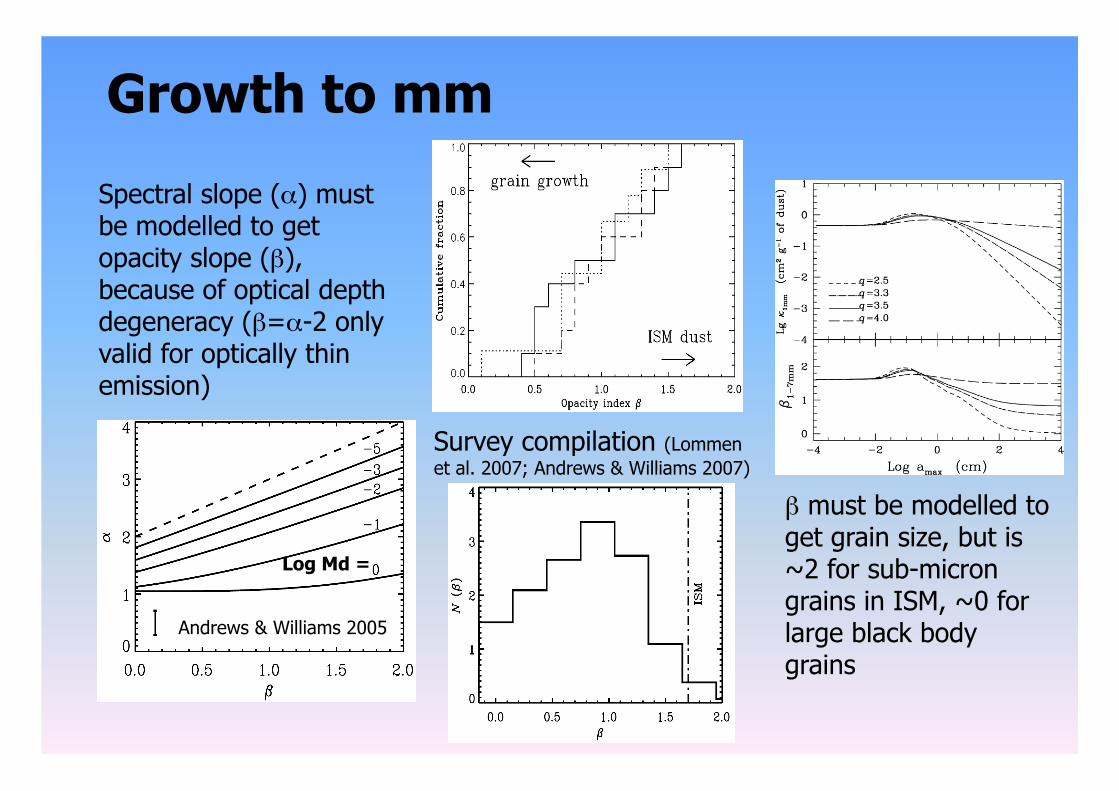
Growth to mm
Survey compilation (Lommen et al. 2007; Andrews & Williams 2007)
Spectral slope (α) must be modelled to get opacity slope (β), because of optical depth degeneracy (β=α-2 only valid for optically thin emission)
Log Md =
Andrews & Williams 2005
β must be modelled to get grain size, but is ~2 for sub-micron grains in ISM, ~0 for large black body grains
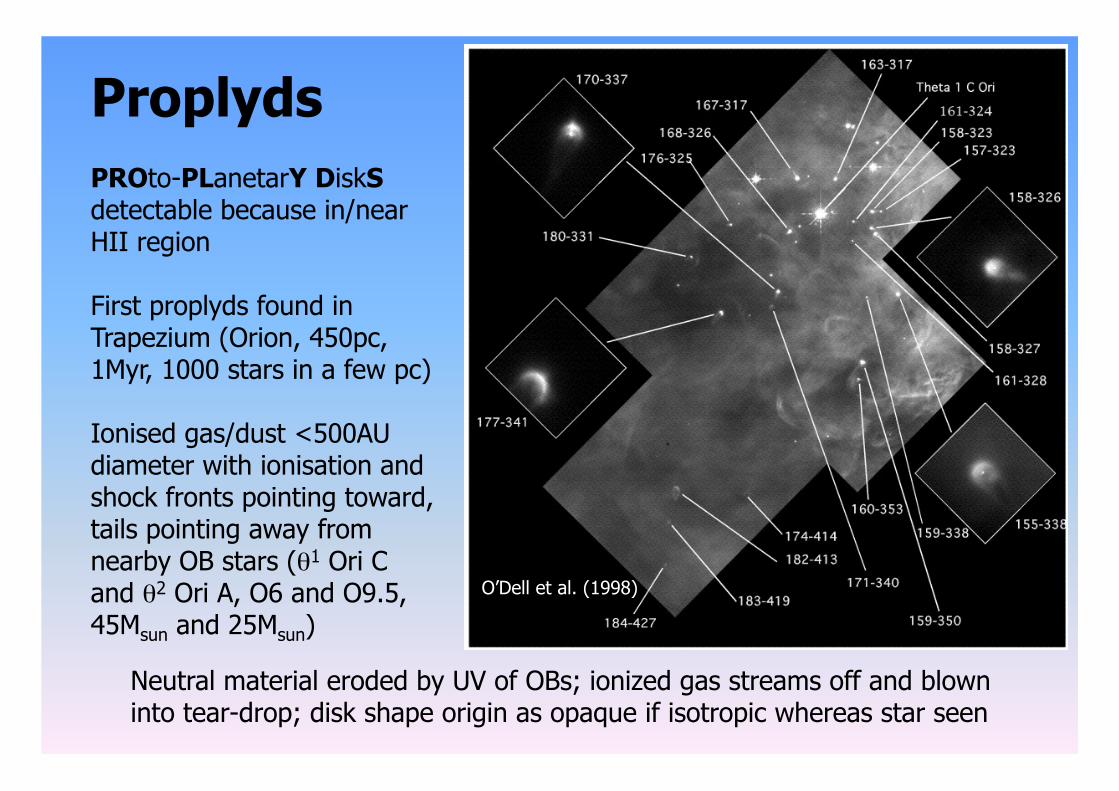
Proplyds PROto-PLanetarY DiskS detectable because in/near HII region
First proplyds found in Trapezium (Orion, 450pc, 1Myr, 1000 stars in a few pc)
Ionised gas/dust <500AU diameter with ionisation and shock fronts pointing toward, tails pointing away from nearby OB stars (θ1 Ori C and θ2 Ori A, O6 and O9.5, 45Msun and 25Msun)
Neutral material eroded by UV of OBs; ionized gas streams off and blown into tear-drop; disk shape origin as opaque if isotropic whereas star seen
O’Dell et al. (1998)
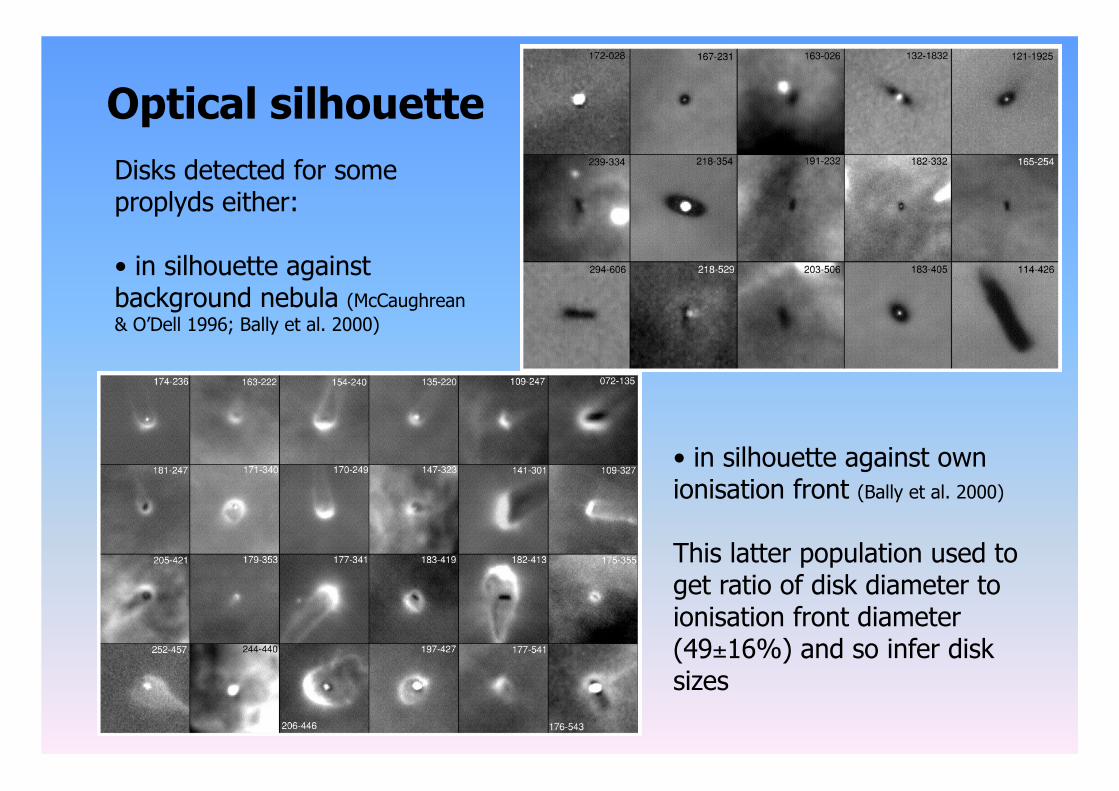
Optical silhouette Disks detected for some proplyds either:
• in silhouette against background nebula (McCaughrean & O’Dell 1996; Bally et al. 2000)
• in silhouette against own ionisation front (Bally et al. 2000)
This latter population used to get ratio of disk diameter to ionisation front diameter (49±16%) and so infer disk sizes
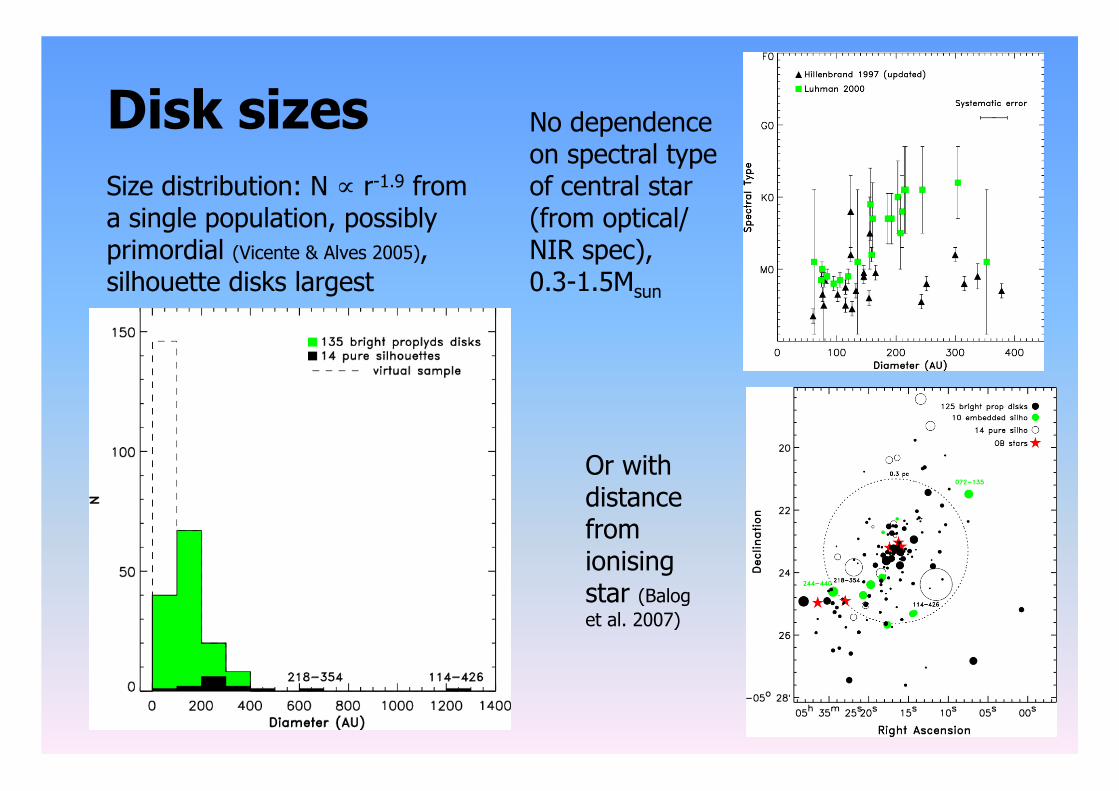
Disk sizes Size distribution: N ∝ r-1.9 from a single population, possibly primordial (Vicente & Alves 2005), silhouette disks largest
Or with distance from ionising star (Balog et al. 2007)
No dependence on spectral type of central star (from optical/NIR spec), 0.3-1.5Msun
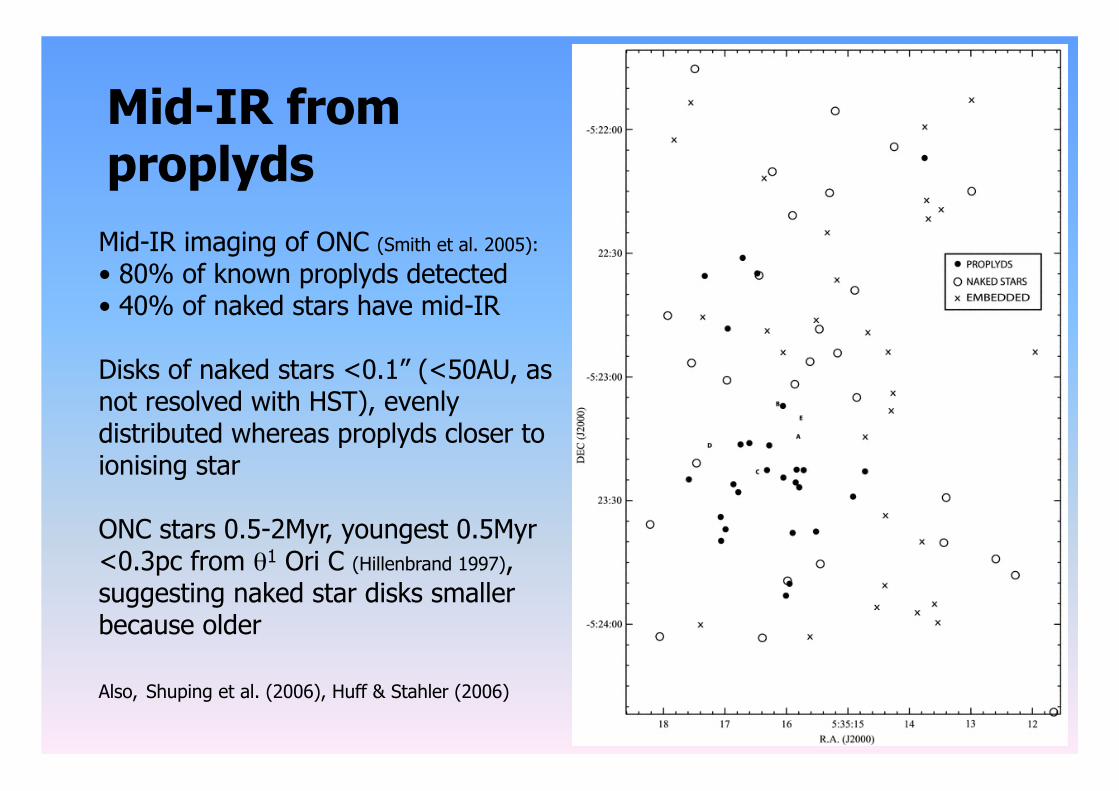
Mid-IR from proplyds Mid-IR imaging of ONC (Smith et al. 2005):
• 80% of known proplyds detected • 40% of naked stars have mid-IR
Disks of naked stars <0.1” (<50AU, as not resolved with HST), evenly distributed whereas proplyds closer to ionising star
ONC stars 0.5-2Myr, youngest 0.5Myr <0.3pc from θ1 Ori C (Hillenbrand 1997), suggesting naked star disks smaller because older
Also, Shuping et al. (2006), Huff & Stahler (2006)
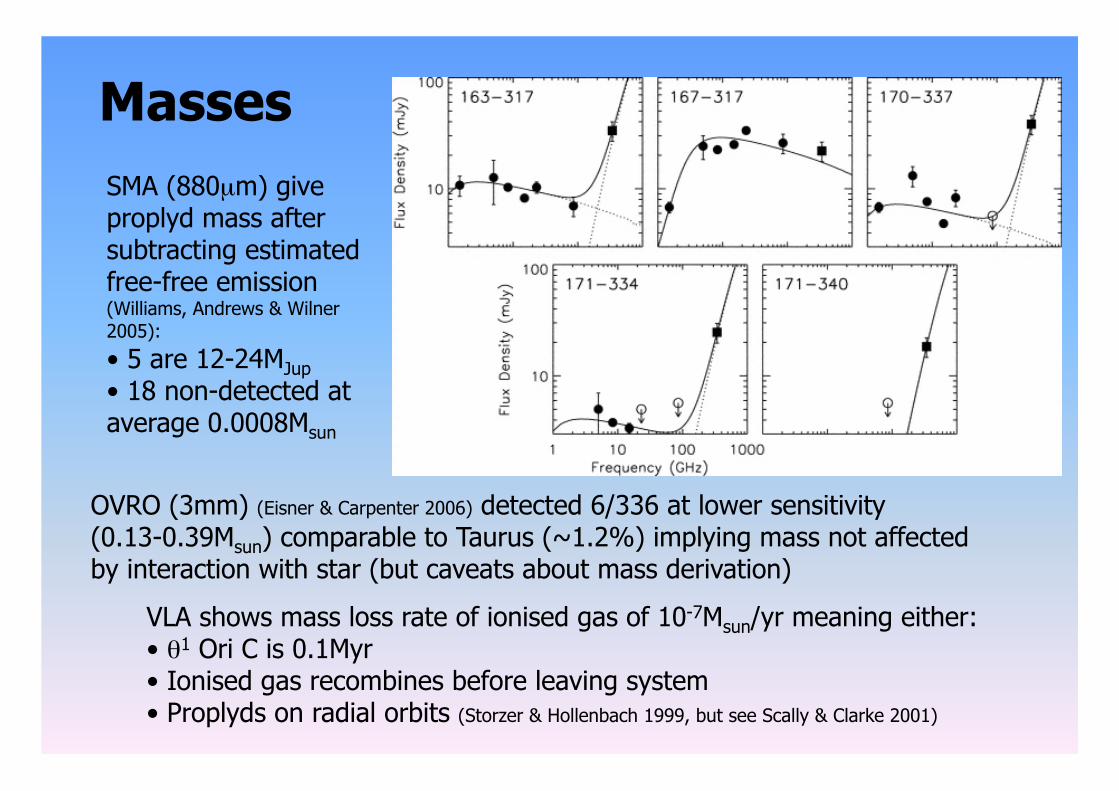
Masses SMA (880µm) give proplyd mass after subtracting estimated free-free emission (Williams, Andrews & Wilner 2005):
• 5 are 12-24MJup • 18 non-detected at average 0.0008Msun
OVRO (3mm) (Eisner & Carpenter 2006) detected 6/336 at lower sensitivity (0.13-0.39Msun) comparable to Taurus (~1.2%) implying mass not affected by interaction with star (but caveats about mass derivation)
VLA shows mass loss rate of ionised gas of 10-7Msun/yr meaning either: • θ1 Ori C is 0.1Myr • Ionised gas recombines before leaving system • Proplyds on radial orbits (Storzer & Hollenbach 1999, but see Scally & Clarke 2001)
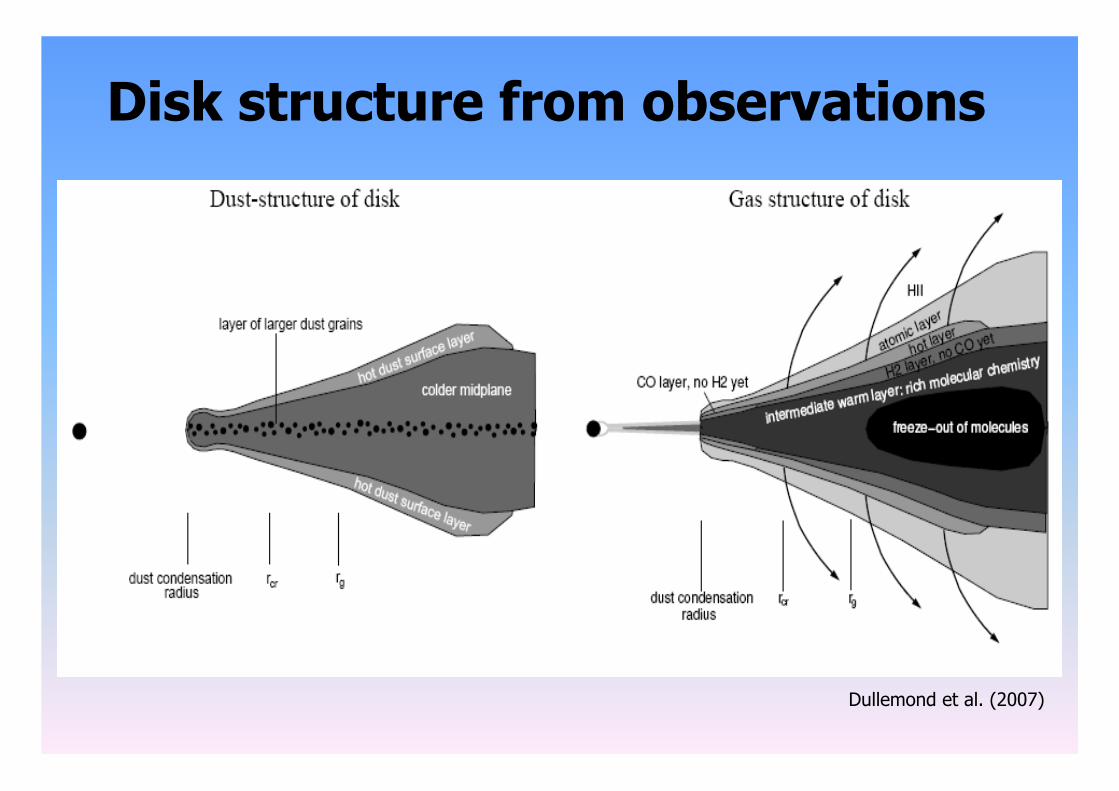
Disk structure from observations
Dullemond et al. (2007)