Embed Size (px)
Citation preview

STEM-SPECIFIC PROMOTERS FROM SORGHUM AND MAIZE
FOR USE IN SUGARCANE
By
Cindy Govender
Thesis submitted in partial fulfillment of the requirements for the degree of Master of
Science at the Stellenbosch University
Supervisor: Dr B. I. Huckett
Co-supervisors: Dr B. A. M. Potier, Prof J. Kossmann
Institute of Plant Biotechnology, Department of Genetics
Stellenbosch University
December 2008

Declaration By submitting this thesis electronically, I declare that the entirety of the work contained therein is my own, original work, that I am the owner of the copyright thereof (unless to the extent explicitly otherwise stated) and that I have not previously in its entirety or in part submitted it for obtaining any qualification. Date: 22 December 2008
Copyright © 2008 Stellenbosch University
All rights reserved
iii
Stem-specific promoters from sorghum and maize for use in
sugarcane
Abstract
Sugarcane (Saccharum spp.) is an important crop which is cultivated worldwide for the
high sucrose content in its stem. Conventional plant breeding has proven to be very
successful over the years with regard to the enhancement of yield characteristics but due
to the exhaustion of genetic potential in the commercial sugarcane germplasm recent
progress has been slow. Genetic engineering seems to be a more attractive approach to
enhance sucrose content and pest resistance in the stems but requires appropriate
transgenes and suitable promoter.
A promoter is essential to drive the transcription of a gene and is therefore critical to the
success of transgenic approaches in sugarcane crop improvement. A negligible number of
strong stem-specific promoters is available for use in sugarcane and this is one of the
major limitations to genetic engineering. The goal of this project was to isolate a stem-
specific promoter from maize and sorghum to drive stem-specific transgene expression in
sugarcane.
The approach used was to source promoters from non-sugarcane grass species with less
complex genomes to simplify isolation and possibly counteract silencing. A cDNA
sequence (SS) (EST clone, Accession number AW746904) from sugarcane was shown by
Northern and Southern analysis to be stem-specific and to have an appropriately low
copy number. The SS gene sequence was not expressed in the leaves of maize, sorghum
or the sugarcane cultivars and prominent expression was observed only in the stems of
the sugarcane hybrids N19 and 88H0019.
The SS gene sequence was used to isolate its upstream regions from a Lambda genomic
library of maize (Zea mays) and a sorghum (Sorghum bicolor) Bacterial Artificial
Chromosome library (BAC). Of the four sorghum and six maize clones obtained in this
iv
study, a 4500 bp maize genomic DNA fragment (λ5) was sub-cloned in three fragments
into separate pBluescript vectors using the ‘forced’ cloning approach for sequence and
database (BLASTN) analysis. This revealed the complete SS gene sequence (975 bp),
the promoter and a 300 bp intron region.
A stretch of DNA sequence from nucleotides 664-3194 from the maize clone 5 sequence
was designated the maize5-pro. Following sequence alignment of the maize and
sugarcane promoter regions, significant sequence identity (68%) was observed between
nucleotide 1675 and 3194 in maize and nucleotide 1506 and 2947 in sugarcane. The
distance between the putative TATA-box and the TSS for this promoter (30 bp) was
found to fall within the expected range of 32± 7 bp.
The promoter region was analysed for possible cis-acting regulatory elements and
revealed several promoter elements that are common in other plant promoters. The
comparisons made between the putative transcription factors in maizepro-5 and the
sugarcane promoter show that both promoter sequences are very similar as they share ten of
the same transcription factors. However, the transcriptional factors WBOX, SRE and
SP8BFIBSP8BIB are unique to the maize5-pro and the TAAG motif to the sugarcane
promoter.
Primers were designed with appropriate restriction sites and the promoter and intron
(2850 bp) region was amplified by PCR (Polymerase chain reaction). The amplified
fragment was fused inframe to the GUS reporter gene encoding β-glucuronidase to
produce a transformation test vector. This will be used in future work to assess the
functionality of the promoter through the production of stable transformants in which
GUS activity can be measured in a range of tissues.

v
Acknowledgements
First and most importantly, I would like to thank God for giving me the strength,
determination and wisdom to be able to complete my thesis.
I feel a deep sense of gratitude toward my husband who always believed in me and
provided me with continuous encouragement, love, support, patience and understanding
during the writing of my thesis. You are a real inspiration to my life and I will treasure
you forever.
To my parents, I would like to thank them for showing me that I can soar like an eagle if
I believe in myself. Thank you for teaching me the most important principles in life and
supporting me by showering me with love. I am truly blessed to have such wonderful
parents, for without the love and guidance I received from you both I would truly be lost.
I am extremely grateful to my supervisors Dr Barbara Huckett and Dr Bernard Potier
whose valuable suggestions and wise counsel has helped me to complete this work. It
has truly been a rewarding experience to work under the guidance of two exceptional
researchers.
Special thanks go to the members of staff at the South African Sugarcane Research
Institute (SASRI) for all their technical assistance, advice and encouragement provided
during my studies.
I thank the National Research Foundation (NRF) and SASRI for the financial support
they have provided for my studies.

vi
Table of Contents
UDeclarationU.......................................................................................................................... ii
UAcknowledgementsU............................................................................................................. v
UTable of ContentsU .............................................................................................................. vi
UList of FiguresU.................................................................................................................. viii
UList of TablesU .................................................................................................................... xii
UChapter 1 IntroductionU...................................................................................................... 1
UChapter 2 Literature ReviewU ............................................................................................ 7
U2.1 The genetic complexity of sugarcane U ...................................................................... 7
U2.1.1 Comparative genetics of sugarcane, maize and sorghumU..................................... 9
U2.2 The sugarcane stemU ................................................................................................. 10
U2.2.1 Sugarcane stem morphology and histologyU........................................................ 10
U2.2.2 Sucrose accumulation and storage in the stemU ................................................... 12
U2.3 Genetic engineering of sugarcane U.......................................................................... 14
U2.3.1 Requirements of sugarcane genetic engineeringU ................................................ 15
U2.4 Gene regulationU ....................................................................................................... 18
U2.4.1 Gene silencingU .................................................................................................... 19
U2.5.1 Functional and structural organisation of promotersU.......................................... 22
U2.5.2 Constitutive promotersU ....................................................................................... 23
U2.5.3 Tissue-specific promotersU................................................................................... 25
U2.5.4 Enhancer elementsU.............................................................................................. 29
U2.5.5 Intron-mediated transgene expressionU................................................................ 31
U2.6 Approaches for promoter isolationU ....................................................................... 34
U2.7 Genomic librariesU.................................................................................................... 38
U2.7.1 Lambda genomic libraryU .................................................................................... 38
U2.7.2 Bacterial artificial chromosome libraryU.............................................................. 38
UChapter 3 Materials and Methods U.................................................................................. 40
U3.1 Plant material for Southern and Northern blot analyses U.................................... 40
U3.2 Northern blot hybridisationU................................................................................... 40
U3.2.1 Isolation of RNAU ................................................................................................ 40
U3.2.2 Assessment of RNA concentration, purity and integrityU.................................... 41
U3.2.3 Blotting procedureU .............................................................................................. 42

vii
U3.3 Southern blot hybridisationU ................................................................................... 42
U3.3.1 Isolation of genomic DNAU ................................................................................. 42
U3.3.2 Assessment of DNA concentration, purity and integrityU ................................... 43
U3.3.3 Blotting procedureU .............................................................................................. 43
U3.4 SS gene sequence probe U.......................................................................................... 44
U3.4.1 Isolation and purification of plasmid DNAU ........................................................ 45
U3.4.2 Isolation of the insert clone DNAU....................................................................... 45
U3.4.3 Quantification of the purified insert DNAU ......................................................... 45
U3.4.4 Radioactive labeling of the DNA fragment U........................................................ 45
U3.5 Prehybridisation and hybridizationU ...................................................................... 46
U3.5.1 Image analysisU .................................................................................................... 47
U3.6 Screening of the librariesU ....................................................................................... 47
U3.6.1 Maize Genomic LibraryU ..................................................................................... 47
U3.6.2 Bacterial Artificial Chromosome libraryU............................................................ 49
U3.7 Isolation of Lambda genomic DNAU....................................................................... 50
U3.7.1 Isolation of plasmid DNAU .................................................................................. 51
U3.8 Investigation of the isolated clones from both librariesU ...................................... 52
U3.8.1 Agarose gel separation and Southern blot analysis of Lambda and BAC DNA
fragments U ..................................................................................................................... 52
U3.8.2 Cloning of isolated DNA fragments and bacterial transformationU..................... 52
U3.8.3 Transformation of the Escherichia coli cells U.................................................... 54
U3.9 Plasmid DNA isolation and assessment of concentration and purity U ................ 55
U3.10 DNA Sequence analysisU ........................................................................................ 55
U3.10.1 Polymerase chain reaction (PCR) U..................................................................... 55
U3.10.2 Sequence analysis U............................................................................................. 56
U3.11 Promoter analysesU................................................................................................. 56
U3.12 PCR amplification of fragments for cloning into the GUS vectorU ................... 57
UChapter 4 ResultsU ............................................................................................................. 59
U4.1 IntroductionU............................................................................................................. 59
U4.2 Tissue-specific expression of the SS gene sequence in sugarcane, maize and sorghumU... 61
U4.2.1 Quality of isolated RNAU..................................................................................... 61
U4.2.2 Northern analysisU................................................................................................ 63
viii
U4.3 SS gene copy number in sugarcane, maize and sorghum U ................................... 65
U4.3.1 Quality of isolated DNAU..................................................................................... 65
U4.3.2 Genomic Southern blot analysisU......................................................................... 65
U4.4 Isolation of SS clones from the Lambda genomic library (maize)U ..................... 68
U4.5 Identification of SS clones from the Bacterial Artificial Chromosome genomic
library (sorghum) U.......................................................................................................... 70
U4.6 Analysis of library clones for SS fragmentsU ......................................................... 72
U4.6.1 Isolation of maize insert DNA from Lambda LibraryU........................................ 72
U4.6.2 Plasmid DNA isolation from sorghum clones U.................................................... 72
U4.6.3 Southern analysis of maize and sorghum clonesU................................................ 73
U4.7 Sub-cloning and physical mapping of SS fragments U ........................................... 76
U4.7.1 Direct cloning of hybridising fragments into pBluescriptU.................................. 76
U4.7.2 Forced cloning of hybridising fragments into pBluescriptU................................. 77
U4.7.3 Physical mapping of maize clone 5U .................................................................... 77
U4.8 Sequence of maize clone 5U ...................................................................................... 80
U4.9 Analysis of promoter regionU .................................................................................. 82
U4.10 Transcription factors and regulatory functions of the putative promoterU................ 85
U4.11 Construction of GUS transformation vector U ...................................................... 89
UChapter 5 Discussion and Conclusion U ............................................................................ 91
UReferencesU ......................................................................................................................... 99
UAppendix AU ..................................................................................................................... 137
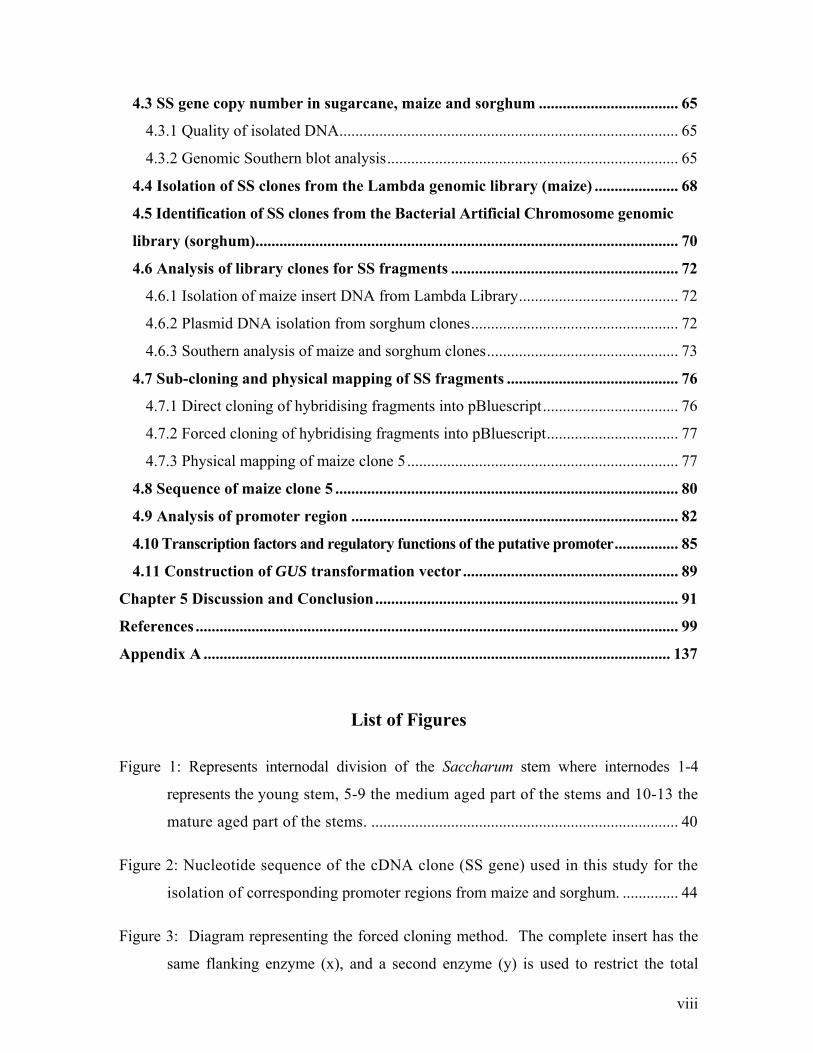
List of Figures
UFigure 1: Represents internodal division of the Saccharum stem where internodes 1-4
represents the young stem, 5-9 the medium aged part of the stems and 10-13 the
mature aged part of the stems. U ............................................................................. 40
UFigure 2: Nucleotide sequence of the cDNA clone (SS gene) used in this study for the
isolation of corresponding promoter regions from maize and sorghum.U .............. 44
UFigure 3: Diagram representing the forced cloning method. The complete insert has the
same flanking enzyme (x), and a second enzyme (y) is used to restrict the total
ix
fragment into smaller pieces. In this case three fragments were produced (a), (b)
and (c). The forced cloning approach limits the plasmid to take up the DNA
segment with the (x) and (y) enzymes flanking it since the plasmid has been
prepared with these two enzymes.U ......................................................................... 53
UFigure 4: Agarose gel electrophoresis separation of typical total RNA (10 µg per lane).
(A) Total RNA isolated from young leaves of maize (Zm), sorghum (Sb), N19,
88H0019 (88H), Coimbatore (Coim) and Black Cheribon (Cher). (B) Total RNA
isolated from young (Ly) and mature (Lm) leaves, immature (S1-4), maturing (S5-
9) and mature (S10-12) stems and roots (R) of sugarcane. The total RNA was
separated electrophoretically on a 1.2% agarose gel and visualized using ethidium
bromide staining.U.................................................................................................... 62
UFigure 5: Northern blots of total RNA illustrating the tissue-specific expression pattern of
the SS gene sequence in maize, sorghum, N19, 88H0019, Coimbatore and Black
Cheribon. Lanes contained total RNA (10µg) from young (Ly) and mature (Lm)
leaves, immature (S1-4), maturing (S5-9) and mature (S10-12) stems and roots (R)
of maize, sorghum and four sugarcane cultivars, N19, 88H0019, Coimbatore and
Black Cheribon. The isolated RNA was denatured and electrophoretically
separated on a 1.2% agarose gel followed by Northern blotting using the
radioactively labeled SS gene sequence as the probe.U ........................................... 64
UFigure 6: Agarose gel electrophoretic analysis of genomic DNA. Genomic DNA from Zea
mays (Zm), Sorghum bicolor (Sb), N19, 88H0019, Coimbatore (Coim) and Black
Cheribon (Cher) were analysed on a 1% agarose gel followed by visualisation by
ethidium bromide staining. The size range of the molecular weight marker used
(MW) is shown on the left.U .................................................................................... 65
UFigure 7: Southern blot analysis of Zea mays (Zm), Sorghum bicolor (Sb), Coimbatore
(Coim), Black Cheribon (Cher), N19 and 88H0019 (88H) genomic DNA to
determine copy number of the SS gene. Ten micrograms of genomic DNA from
young leaves were digested with EcoRI (E), HindIII (H), PstI (P) and XbaI (X)
and separated electrophoretically on a 1% agarose gel; thereafter the DNA was
blotted onto a membrane for hybridisation analysis using the radioactively labeled

x
SS gene sequence as the probe. MW = known molecular weight marker EL.
Prominent bands are marked on the autoradiograph by asterisks and less prominent
bands by arrows.U .................................................................................................... 67
UFigure 8: Autoradiograph of the tertiary selection of individual plaque forming units
obtained from secondary screening using hybridisation analysis. The panels show
the six stem-specific clones (4, 5, 6b, 6d, 9a and 9b) chosen from the maize
Lambda library for further analysis. The arrows on the autoradiograph show the
hybridising plaque forming units selected.U ............................................................ 69
UFigure 9: A hybridising BAC clone designated E18 obtained from screening filter D with
the SS gene sequence. Clone E18 showed hybridisation on filter D and the layout
of the grid was used to identify the field number 1. Within the respective fields,
the well location and position were established to be E and 18 respectively. The
plate number was identified as 7 by determining the orientation of the duplicate
spots and then referring to the table for each field. This library has more than one
filter therefore the plate number of clone E18 was decoded by using the plate
number (7), well location (E18) and filter letter (D) from the conversion table and
was found to be 151.U .............................................................................................. 71
UFigure 10: Agarose gel electrophoresis separation of isolated DNA from maize clone 4 and
plasmid DNA from sorghum clone K24 restricted with XbaI (A) and EcoRV (B)
respectively.U ........................................................................................................... 73
UFigure 11: Southern blot analysis of restricted lambda genomic DNA (1 µg per lane)
probed with the SS gene sequence. One microgram of Lambda genomic DNA
from the maize clones 4, 5, 6b, 6d, 9a and 9b was restricted with HindIII, EcoRI,
PstI and XbaI respectively and electrophoresed on a 1% agarose gel. The DNA was
denatured and blotted onto a nylon membrane for hybridisation analysis. The
fragments containing the SS gene sequence and of a cloning size range are marked
by letters on the autoradiograph. These included fragments 5 HindIII (a), 9b
HindIII (b), 5 EcoRI (c), 6b EcoRI (d), 9a EcoRI (e), 9b EcoRI (f) and 4 XbaI (g).U
................................................................................................................................ 74

xi
UFigure 12: Southern blot analysis prepared with plasmid DNA from the sorghum clones
restricted with a range of restriction enzymes. One microgram of plasmid DNA
was restricted with a specific enzyme and electrophoresed on a 0.8% agarose
gel. The DNA was denatured and blotted onto membranes for hybridisation
analysis using the 32P-labeled SS gene sequence as the probe. The blots were
labelled A, B and C. Candidate DNA fragments h, i, j, k, l, m, n, o, p, q, r and s
marked on the autoradiographs were selected for cloning and sequence analysis.U 75
UFigure 13: Flow diagram showing the cloning strategy implemented for the maize clone 5
fragment to allow for the construction of a physical map.U..................................... 78
UFigure 14: Physical map of the maize clone 5 divided into the three fragments A, B and C
showing their assembly with respect to the orientation of the fragment B. The
restriction sites SphI and SmaI marked on the map cut once within the fragment C
and cleave within the multi-cloning site of pBluescript.U ....................................... 79
UFigure 15: Schematic representation of the sequencing strategy implemented to obtain the
complete sequences for fragment A, B and C in pBluescript for the maize clone 5.
The direction of the arrows represents the direction and the sequence obtained
following re-ligation using a particular enzyme.U ................................................... 81
UFigure 16: Schematic representation of the maize clone 5 showing the retrotransposon
cinful (R), promoter region, intron (I) and the SS coding sequence (SS) in relation
to fragments A, B and C. U........................................................................................ 82
UFigure 17: Alignment of nucleotide sequences of the 5' regulatory regions of the SS gene
promoter from Saccharum (2947 bp) and maize (2947 bp). Significant sequence
homology was observed between nucleotide 1675-3194 in maize (Appendix A) and
nucleotide 1506-2947 in sugarcane. Homologous nucleotides are represented by
shading. The transcription start sites (TSS) are in bold type and highlighted in
bright green, the start codon (ATG) is in bold type and underlined and the TATA
boxes are highlighted in yellow. The CAAT-like sequences similar in maize and
sugarcane are highlighted in red, turquoise and grey. The sugarcane and maize5-
pro promoter sequences were aligned and it was found that they share a 68%

xii
sequence similarity as shown by global alignments (BioEdit software). There are
also numerous indels and substitutions between these promoters.U ........................ 83
UFigure 18: Alignment of nucleotide sequences of the 5' regulatory regions of the SS gene
promoter from Saccharum (2947 bp) and maize (3194 bp) and their putative
transcription factors identified using the Signal Scan Program, PLACE.
Homologous nucleotides are represented by shading and indels by a dot (.). The
transcription start sites (TSS) are underlined and highlighted in green, the start
codon (ATG) is in bold type and underlined and the TATA boxes are in bold script
and underlined.U....................................................................................................... 88
UFigure 19: Schematic representation showing the cloning strategy implemented for the
maize5-pro with intron (int) region into the GUS test vector. Restriction sites are
marked on the complete maize clone 5 DNA fragment and the primers (ZM51F2
and ZM51R2) designed for the amplification of the promoter with intron region
for the construction of the GUS test construct. The primers are shown below the
arrows with their respective incorporated restriction site. The GUS test plasmid
is represented as a linearised vector by restriction at the unique site showing the
maize5-pro, nos terminator and GUS gene.U ........................................................... 90
UFigure 20: Complete DNA sequence of the maize clone 5 showing the fragments A
(between red arrows), B (between blue arrows) and C (between green arrows). The
maize retrotransposon cinful,intron region and SS gene coding sequences are
shown in italics, red text and green text respectively. The six CAAT-like
sequences identified are highlighted in red, the TATA box in yellow and the
transcriptional start site in green.U ......................................................................... 138
List of Tables
UTable 1: Sequences and positions of PCR primers for cloning (i) Promoter and (ii)
Promoter and intron regions into the GUS plasmid. The positions of the 5' end
where +1 is the start of the coding region, the corresponding PCR fragment sizes
and the regions to be amplified are indicated. The 5' spacer sequences are shown
xiii
in lowercase.U........................................................................................................... 57
UTable 2: Differences between the maize Lambda and sorghum BAC genomic libraries U . 60
UTable 3: The number of hybridising bands following Southern blot analysis using visual
assessment for Zea mays, Sorghum bicolor, N19, 88H0019, Coimbatore and Black
Cheribon after restriction with EcoRI (E), HindIII (H), PstI (P) and XbaI (X).U .... 67
UTable 4: The clones hybridising to the SS gene sequence obtained from the sorghum BAC
library showing their filter letter, field number, well location and position, plate
number and plate decoder number.U ......................................................................... 72
UTable 5: Selected candidate DNA fragments from the maize and sorghum clones
following Southern blot analysis (Figures 11 and 12). These clones were selected
for sub-cloning into the pBluescript vector.U........................................................... 76
UTable 6: Putative core promoter elements in the upstream sequence of the SS coding
sequence as predicted by the NNP2.1 toolaU ........................................................... 84
UTable 7: Putative regulatory elements present in the maize5-pro and their positionsU ....... 87
1
Chapter 1
Introduction
Sugarcane (Saccharum spp. hybrids) a member of the grass family, Gramineae, is a crop
of major importance for the production of sucrose (Grof et al. 2001). Sugarcane is best
grown economically in tropical and sub-tropical regions between 15° and 30° latitude
(Barnes, 1974) and is cultivated in over 120 countries and is the source for approx. 70%
of the world’s sugar (South African Sugar Association Industry Directory, 2006). The
world sugarcane crop was forecast at a near record of 126.8 million tons in 2001- 2002
(FAS, 2001).
South Africa is the eleventh largest producer of cane sugar, after countries such as Brazil,
Cuba, India, Australia, the United States, Philippines and China, with a production of 2.5
million tons of sugar per annum (South African Sugar Association Industry Directory,
2006). About 50% of this sugar is marketed in the Southern Africa Customs Union
(SACU) while the remainder is exported to numerous markets in Africa, the Middle East,
North America and Asia (South African Sugar Association Industry Directory, 2006).
Sugarcane was first grown in South Africa in 1848 on the Kwa-Zulu Natal North Coast.
By 1990 the proceeds of the sugarcane industry exceeded 2 billion Rand for one season
(South African Sugar Association Industry Directory, 2006) and in 2003 a record crop of
2763 000 tons of sugar was produced (South African Sugar Association Industry
Directory, 2006). Based on the revenue generated through sugar sales, the South African
sugarcane industry is responsible for generating direct income totaling 6 billion rand
(South African Sugar Association Industry Directory, 2006).
The ideal climate for growing sugarcane is characterised by warm mean day temperatures
of 30°C with adequate moisture and high incident solar radiation (Barnes, 1974). It must be
noted that sugarcane is grown under fairly adverse conditions in KwaZulu Natal as this
area is the furthest south that sugarcane is found in the world (O’ Reilly, 1998). Adverse
climatic conditions are not the only problems faced by sugarcane farmers; disease and pest
damage are also major factors. Since these factors impact directly on the sucrose content of
2
sugarcane, strategies to solve such production problems are a priority to the sugarcane
industry.
The South African Sugarcane Research Institute (SASRI) based in Mount Edgecombe is
an institution involved in developing and optimising the productivity of commercial
sugarcane cultivars grown in South Africa. These cultivars are selected for producing
high sucrose yields, resistance to pests and diseases, herbicide resistance as well as
tolerance to environmental stresses. The plant breeding and biotechnology programmes
based at the South African Sugarcane Research Institute are both aimed at varietal
improvement of the sugarcane plant.
It is not surprising that the genetic improvement of sugarcane has been a major focus of
plant breeding efforts and has made sugarcane a prime candidate for the application of
genetic engineering (Snyman, 2004). Modern cultivated sugarcane obtained by
traditional plant breeding techniques has widely enhanced important economic traits (Liu et
al., 2003; Srivastava et al., 1994). These important economic traits encompass reduced
disease and pest problems, increased biomass and sugar yields, herbicide resistance and
improved adaptability for growth under various stress conditions (Liu et al., 2003;
Srivastava et al., 1994).
Although conventional plant breeding has proven to be very successful over the years, the
progress made by this method is very slow (Liu, 2003). Significant factors believed to
have contributed to this slow progress are the genetic complexity, low fertility, narrow
gene pool used in current commercial breeding programs and the long breeding cycles of
sugarcane (Ingelbrecht et al., 1999; Yang et al., 2003; Grof and Campbell, 2001 and
Roach, 1989). These factors render conventional breeding laborious and make
transformation an attractive approach to include for the improvement of sugarcane (Yang et
al., 2003).
Genetic engineering by DNA-mediated plant transformation has opened up new avenues
to introduce useful genes into sugarcane that otherwise would be difficult or impossible
by standard procedures (Hansen and Wright, 1999). The sugarcane industry is under
great pressure due to damages caused by insects and pathogens resulting in both sucrose

3
yield and economic losses (Sharpe, 1998). Resistance to such economically important
traits can therefore be conferred to sugarcane via genetic engineering.
To date there has been a number of traits that have been introduced into sugarcane.
These include insect resistance via the δ-endotoxin gene from Bacillus thuringiensis
(Arencibia et al., 1997), proteinase inhibitor genes (Allsopp et al., 1997; Nutt et al.,
1999) and mannose-binding lectins (Irvine and Mirkov, 1997), resistance to sugarcane
mosaic virus (SCMV) (Joyce et al., 1998; Ingelbrecht et al., 1999), altered sucrose
content via down-regulation of pyrophosphate-dependent phosphofructokinase
(Groenewald and Botha, 2001), herbicide resistance via the pat gene (Leibbrant and
Snyman, 2003; Falco et al., 2000) and the modification of carbon partitioning (Grof and
Campbell, 2001).
Significant progress has been made in the development of molecular tools for the
transformation of sugarcane and other monocotyledonous (Grof and Campbell, 2001) and
transformation is now well established for sugarcane (Bower and Birch, 1992).
Transformation aims to recover transgenic plants and the target material must be able to
regenerate into plants that show efficient uptake of DNA (Franks and Birch, 1991).
Particle bombardment and Agrobacterium tumefaciens co-cultivation are the two most
common methods for the delivery and expression of transgenes (Liu et al., 2003; Yang et
al., 2003 and Falco et al., 2000). The most widespread approach for sugarcane
transformation is that of particle bombardment using embryogenic callus as target
material. An example of transformation success and efficiency using particle
bombardment undertaken at SASRI was the genetic engineering of sugarcane with the
pat gene to confer resistance to the herbicidal compound glufosinate ammonium in
Buster® (Leibbrandt and Snyman, 2003; Leibbrandt and Snyman, 2001; Snyman et al.,
1998; Synman et al., 2001).
To achieve effective transfer of foreign DNA into sugarcane cells, appropriate genetic
constructs need to be made to facilitate integration and expression of the transgene. A
typical genetic construct will contain a promoter, a transgene and a terminating signal.
The promoter is a major requirement for genetic engineering applications since it offers
fundamental control on gene expression therefore a great deal of interest and time is

4
invested in isolating and studying plant promoters.
Promoter regions are the key cis-acting regulatory region that controls the transcription of
adjacent coding regions into messenger ribonucleic acid which is directly translated into
proteins (Datla et al., 1997). A transformation system is only efficient in conjunction
with the availability of a range of promoters with varied strengths and tissue specificities
(Grof and Campbell, 2001; Yang et al. 2003 and Rooke et al., 2000). One major
constraint to genetic engineering of sugarcane is the lack of suitable promoters required
to drive transgene expression (Liu et al., 2003; Song et al., 2000 and Yang et al., 2003).
There are currently very few promoters that have been shown to be active in sugarcane.
These include CaMV 35S promoter which has been widely used for high-level
constitutive expression in dicotyledonous (Yang et al. 2003). The promoter elements
from rice actin (Grof et al., 1996a), rubisco small subunit (Grof et al., 1996b), maize
ubiquitin (Gallo-Meagher and Irvine, 1993), CaMV 35S (Elliott et al., 1998) and pEMU
(Rathus et al., 1993) show activity in sugarcane although their expression levels are an
order lower than the level of transgene expression driven by CaMV 35S in
dicotyledonous model plant systems (Grof and Campbell, 2001).
The motivation for this project is based primarily on the lack of suitable promoters and
although dicotyledonous promoters can be used in monocotyledonous species, in their native
form they are poorly active. A number of constitutive promoters have been described.
Constitutive promoters may be appropriate for the expression of certain types of transgene
but there is a growing need for promoters that confer unique patterns of transgene
expression in sugarcane. A major area of the sugarcane plant where transgene expression is
required is in the stem. The stem area is not only the area were the stem borer, Eldana
Saccharina, enters the plant and lives causing damage but it is also the region of the
plant where sucrose is stored.
The isolation of stem-specific promoters to drive key genes that regulate major functional
control over metabolic pathways in the stems of sugarcane would prove to be a valuable
tool for sucrose manipulation. Moore et al., (1997) has assessed the biophysical

5
capability of the sugarcane stem to accommodate a significant increase in sucrose
concentration, the study shows that sugarcane is capable of storing more than 25%
sucrose on a fresh-weight basis (Bull and Glasziou, 1963). Besides having the
characteristic of stem-specificity, the isolated promoter should drive strong gene
expression. A strong promoter would enable the production of sufficient RNA to activate
a turnover mechanism that depends on a threshold RNA concentration (Matzke and
Matzke, 1995).
Regulation of specific expression of transgenes in the stem will require stem-specific or
stem-preferential promoter elements. This study therefore concentrates on the isolation of
a stem-specific promoter for driving transgene expression in sugarcane without
encountering promoter inactivation in the plant resulting in gene silencing.
Promoter inactivation leading to transgene silencing has been a major problem
encountered in transgenic plant programmes therefore means of avoiding this problem
needs to be addressed at an early stage in a transgenic programme. Bhullar et al. (2003)
have mentioned two ways in which to avoid promoter homology. The first involves the
designing of synthetic promoters while the second is more pertinent to this project and
involves the use of diverse promoters which have been isolated from different plant and
viral genomes. This understanding has been applied to this project by using maize and
sorghum, which are close relatives of sugarcane, for isolating promoters to drive
transgene expression in sugarcane.
Promoter silencing in transgenic programmes is not the only limiting factor to progress
being achieved in this field of study. A limited number of promoters have been isolated
for use in sugarcane and other monocotyledonous plants for introducing novel traits
in economically important crops. Many of these elements isolated have commercial
limitations with respect to their usage. Developing a promoter is considered an invention
and is therefore protected by intellectual property laws. Both established and promising
promoters already have patents. This causes unnecessary delays in reaching licensing
agreements before the promoters can be used in a breeding program. Due to this,
renewed efforts for isolating novel regulatory elements from monocotyledonous plants are of
major importance. This project therefore sets out to isolate and identify promoters from
6
monocotyledonous plants to be utilised in the sugarcane breeding programs at SASRI.
The present study was aimed at using a stem-specific and low copy number cDNA clone
for the isolation of a stem-specific promoter from maize and sorghum intended to drive
high-level transgene expression in sugarcane. This gene was designated the stem-specific
gene (SS gene) throughout this study. The SS gene was previously isolated from
Sorghum bicolor (BAM Potier, SASRI). The specific function and identity of this gene is
still unknown to date but preliminary studies carried out by BAM Potier have shown that
this gene displays a strong stem-specific expression pattern and a low gene copy number.
The objectives set out in this project were:
• Analysis of the SS gene to confirm tissue-specificity of expression and copy
number in maize, sorghum and sugarcane.
• Screening of maize Lambda genomic and sorghum Bacterial Artificial
Chromosome libraries with the SS gene as the probe for isolation of candidate
clones.
• Ligation of clone fragments into a plasmid vector followed by transformation of
E. coli. ‘Blue-white’ screening will be used to select for positive colonies.
• Characterisation of the isolated clone regions by DNA sequence analysis for the
identification of promoter elements downstream of the gene sequence.
• Incorporation of the promoter region into test constructs made by fusing the
candidate promoters with the reporter gene GUS.
The thesis follows a classical structure. The relevant scientific background is summarised
in Chapter 2 (Literature Review), techniques and protocols used in the work are described
systematically in Chapter 3 (Materials and Methods), research results are presented in
Chapter 4 (Results) and the general findings are explored and interpreted in Chapter 5
(Discussion and Conclusion).

7
Chapter 2
Literature Review
2.1 UThe genetic complexity of sugarcane
Sugarcane is one of the most important crops in the world, mainly cultivated for the high
sucrose content in its stem. The modern sugarcane belongs to the family Poaceae,
subfamily Panicoideae and tribe Andripogoneae. The commercial cultivars of sugarcane,
as we know them today, have been derived through interspecific hybridisations involving
two main species, Saccha rum officinarum and Saccharum spontaneum, with some
contributions from other genera (Babu, 1974). The other genera include Erianthus,
Miscanthus, Sclerostachya and Narenga and are closely related to Saccharum and
together constitute an interbreeding group which is believed to have been involved in the
origin of sugarcane (Daniel and Roach, 1987).
Current cultivated clones are essentially derived from interspecific hybridisation
performed between S. officinarum (2n = 80) and S. spontaneum (2n = 40-128). Up until
the 19th century most cultivated sugarcane plants were clones of Saccharum officinarum;
this is a high sucrose variety which contains 2n=80 chromosomes. Breeding was
successful and hybrids between S. officinarum and Saccharum spontaneum were
developed. The breeding system of crossing S. officinarum with S. spontaneum, and
repeatedly backcrossing the hybrids to S. officinarum (noble cane) is a process called
nobilisation. This process is also commonly referred to as introgression breeding and
defined as the transfer of a relatively small number of specific genes from ill-adapted
germplasm into current commercial germplasm (Simmonds, 1993).
Cytological studies carried out by Bremer (1961) showed that nobilisation is
characterised by asymmetric chromosome transmission. The hybridisation of S.
officinarum and S. spontaneum is characterised by a 2n + n mode of chromosome
transmission (Stevenson, 1965). S. officinarum generally transmits two haploid
8
chromosome sets while S. spontaneum transmits one causing an increase in the
chromosome number of the hybrids. S. officinarum has 80 chromosomes consisting of 8
copies of a base set of 10 chromosomes, whilst S. spontaneum has 48 to 128
chromosomes made up of 6 to 16 copies of a basic number of 8 chromosomes (Barnes,
1974). The 2n + n mode of transmission is continued to the second backcross therefore
modern cultivars have chromosome numbers ranging from 100-130, of which only 5-
10% are of S. spontaneum origin and the remainder come from S. officinarum (D’Hont et
al., 1996, Simmonds, 1976). With repeated crossing, S. spontaneum chromosomes are
preferentially lost.
Recently in situ hybridisation analysis of two ribosomal RNA gene families determined
that S. officinarum has a basic chromosome number of x=10, therefore this plant is
octoploid (D’Hont et al., 1998). Using the same method it was shown that S. spontaneum
has a basic chromosome number of x=8 and that the ploidy level of this species varies
between 5 and 16 (D’Hont et al., 1998). These studies established that the difference in
chromosome numbers provides two distinct chromosome organisations which co-exist
in modern sugarcane cultivars used to date (Grivet and Arruda, 2002). D’Hont et al.
(1996) and Caudrado et al. 2004 used genomic in situ hybridisation to demonstrate that
modern cultivars contain 15-20% S. spontaneum chromosomes of which less than 5% are
recombinant or translocated chromosomes.
Commercial sugarcane cultivars thus have complex polyploid, aneuploid genomes and
the cytogenetic complexity of interspecific hybrids make classical and molecular genetics
as well as breeding studies difficult to interpret considering that the information on the
structure and organisation of the genome has been largely speculative (Butterfield et al.,
2001).
Polyploidy occurs more frequently in the plant kingdom than the animal kingdom
(Pikaard, 2001). Important crops such as banana, canola, coffee, maize, potato, oats,
soybean, sugarcane and wheat are polyploids (Wendel, 2000; Osborne et al., 2003).
These plants being polyploid have multiple copies of a specific chromosome hence there
are multiple copies of a gene present (Wendel, 2000). There are two situations in which

9
polyploidy could occur; the first involves the combining of two differentiated genomes into
a common nucleus (allopolyploidy) and the second the duplication of a single genome
(autopolyploidy) in one of the parental cytoplasms. It is thought that both S. officinarum
and S. spontaneum have complex autopolyploid genomes (D’Hont, et al., 1996; Ming et
al., 2001).
Understanding the Saccharum genome with respect to its evolution and organisation is
necessary for making informed decisions in breeding, germplasm introgression and
biotechnology. Much has been learned about the sugarcane genome over the past 80
years by implementing cytological studies, breeding experiments and molecular diversity
studies (Butterfield and Berding, 2001). Sugarcane has a very complex genome or
genetic structure due to the crossing between two or more than two polyploid
Saccharum spp. (Grivet and Arruda, 2002). Sugarcane cultivars have ploidy levels that
range from 5X to 14X (X= 5, 6, 8, 10, 12, or 14) and chromosomal mosaicism has been
reported (Burner and Legendre, 1994). Such genetic complexity in the sugarcane
genome poses added problems for plant breeding and research.
2.1.1 Comparative genetics of sugarcane, maize and sorghum
Grasses are the members of the family Gramineae or Poaceae and are represented by over
10 000 species including sugarcane, maize and sorghum (Kellogg and Birchler, 1993).
The Poaceae includes most of the major food crops, which are well separated from
dicotyledonous plants (Bennetzen et al., 2001). Their phylogeny has been extensively
studied and is well understood (Kellogg, 2001). Evolutionary divergence of the grass
family occurred within the past 50 to 60 million years (Bennetzen et al., 2001).
Amongst cereals, sorghum (Sorghum bicolor) is the world’s fourth most important crop
after rice, wheat and maize (Mutisya et al., 2003). One important finding from mapping
studies has revealed that sorghum and maize are very closely related and that large
stretches of their genomic DNA are co-linear (Hulbert et al., 1990; Binelli et al., 1992
and Whitkus et al., 1992). Since sorghum is closely related to maize and maize to other
grasses (Ahn et al., 1993), genes isolated from sorghum and maize or other

10
monocotyledonous may be directly transferred into other crops and therefore provide a
source of genetic variation for crop improvement (Woo et al., 1994).
Comparative analysis of several grass genomes (Doebley et al., 1990; Binelli et al., 1992;
Ahn et al., 1993; Hulbert et al., 1990 and Bennetzen and Freeling, 1993) including maize,
rice, sorghum, wheat, and barley have also shown extensive conservation of gene content
and order (Gale and Devos, 1998). Molecular systematic studies have revealed that
maternally inherited genomes of Saccharum and sorghum diverged recently (Al-Janabi,
1994).
There is also a large amount of conservation between the maize and sorghum genomes
from detailed comparisons carried out (Whitkus et al., 1992; Ahn et al. 1994 and
Bennetzen and Freeling, 1993). Maize and sorghum are thought to have diverged before
sugarcane diverged from sorghum (Hulbert et al., 1990) which was about 20 million
years ago (Bennetzen et al., 2001). Results from Guimaráes et al. (1997) showed
colinearity between Saccharum and sorghum and genetic conservation between these
genera. Guimaráes et al. (1997) also predict that alleles cloned from sorghum based on
map position will usually be orthologous to alleles from Saccharum. Considering the
amount of genetic conservation between the 3 genera, isolation of promoters from maize
and sorghum to drive transgene expression in sugarcane may be more viable than use of a
promoter isolated from sugarcane, as gene silencing may be encountered (Potier, personal
communication).
2.2 UThe sugarcane stem
2.2.1 Sugarcane stem morphology and histology
Sugarcane is a tall perennial tropical grass and the basic structure of the sugarcane is
closely related to that of other members of the family Gramineae (Barnes, 1964). This
grass tillers at the base to produce unbranched stems from 2 to 4 m or more tall, and around
5 cm in diameter (James, 2004). The stem of the plant is of greatest interest to the planter,
for it is here that the commercial product sucrose is stored. The aerial part of the sugarcane
11
consists of a clump of stems which vary in number from variety to variety (Barnes, 1964).
The stem is divided into a number of joints, each consisting of a characteristic ring called
the node, and an internode.
The stem is a complex organ composed of epidermal, vascular, meristematic and storage
parenchyma tissues (Moore, 1995). Each internode has an outer epidermal layer
consisting of thick-walled cells which are interspersed with cork and silica cells and
stoma, and this surrounds a ring of sclerenchymatous tissue followed by storage
parenchymatous cells. The parenchyma cells are large towards the centre of the stem
(Babu, 1979) and become lignified at later stages of development. Innumerable vascular
bundles permeate the parenchyma tissue and are surrounded by a fibre sheath and
sclerenchyma cells. Towards the periphery, the vascular bundles are larger in size (Babu,
1979).
Histochemical and sugar assays carried out by Jacobsen et al. (1992) showed changes in
the morphological features and sucrose content of the sugarcane stem. An increase of
sucrose concentrations down the stem was complemented by an increase in the number of
vascular bundles which decreased in size from the core to the peripheral tissues
accompanied by an increase in lignification and suberisation. Studies carried out by
Moore and Cosgrove (1991) further illustrated the differences between the young and
mature internodes since a difference was noted in the length and diameter of the storage
parenchyma cells. Investigations carried out by Moore (1995) showed that sucrose
accumulation occurs primarily in immature storage parenchyma as opposed to in the
mature parenchyma. Apparently, as the parenchyma cells reach maturity they become
less ‘leaky’ and less dependent upon an active transport system for maintaining a high
internal sucrose concentration. These cellular differences down the stem can help to
interpret the gradient of maturation and sucrose accumulation to a point where full
maturity and a stable, high sucrose concentration is reached (Moore, 1995). It is important
to consider the specialised function of the different cell-types in the sugarcane stem to
understand stem-specific gene expression in this region.
12
2.2.2 Sucrose accumulation and storage in the stem
The maturation of sugarcane is characterised by the accumulation of sucrose in
developing internodes (Moore, 1995) and coincides with a redirection of carbon from
water-insoluble components and respiration to produce this sucrose (Botha and
Whittaker, 1995). Internode development can be considered in terms of elongation, dry
matter accumulation and, more broadly, the directing of sucrose towards either utilisation or
storage (Lingle, 1999). Sucrose is sugar which is produced in the leaves by photosynthesis and
is translocated in the phloem and exported into sink tissue of the sugarcane stem as a long-
term storage molecule (Moore, 1995). Sucrose has three fundamental roles in plants, firstly
it is the major product of photosynthesis, secondly it is the main form in which carbon is
translocated in plants and thirdly it is one of the main storage sugars occurring in tissues
such as stems and leaves.
The understanding of sucrose accumulation began with research carried out by Glasziou and
Gayler, 1972. The experiments involved tissue slices suspended in radiolabelled sugar
solutions to produce a model of sucrose accumulation. The model claims that sucrose
from the phloem diffuses into the apoplastic space and is hydrolysed into glucose and
fructose. Both products are taken up into the storage cells by hexose transporters and
phosphorylated. The sucrose-phosphate is transported across the tonoplast for storage in the
vacuole.
There is also increasing evidence that sucrose is involved in signaling to modulate
expression of genes controlling cell division and differentiation, transporters and storage
proteins, induction of flowering, differentiation of vascular tissue, seed development and
accumulation of storage products (Lunn and MacRae, 2003).
Sucrose accumulation in sugarcane is a complex process, and is probably the result of a
number of different processes and enzymes. Sucrose accumulation is simply the difference
between the amount of sucrose produced in the leaf by photosynthesis and the amount of this
sucrose that is removed by metabolism to produce carbon and energy for growth and other
components of the plants (Moore, 2005). Sucrose is produced by photosynthesis in the leaves

13
and is loaded into the phloem by a proton-sucrose symporter (Gahrtz et al., 1994). Unloading
of the sucrose into the stem parenchyma is mediated by cell wall invertase, with sucrose
cleavage followed by transport of monosaccharides through the plasma membrane (Roitsch
et al., 1995). Within the cell, sucrose is resynthesised and stored in the vacuole.
Sucrose unloaded from the phloem may pass through three cellular compartments, the
apoplastic compartment or cell wall and intercellular spaces, the metabolic compartment
or cytoplasm and the storage compartment or vacuole (Moore, 2005). There are multiple
pathways that use different enzymes which drive either sucrose synthesis or degradation in
which there might be rate-limiting physiobiochemical reactions (Moore, 2005). Stem reactions
catalysed by key enzymes include membrane transport, sucrose metabolism, carbon
partitioning into different pools, remobilization of stored sucrose and translocation to
and unloading in various sink tissues including primary storage in parenchyma cells of the
stem.
Enzymes controlling sucrose metabolism include sucrose synthase, sucrose phosphate
synthase and the various isoenzymes of invertase (neutral invertase, soluble acid
invertase and cell wall bound acid invertase). Different invertase isoforms are associated
with all three of these metabolic componenets (Lakshmanan et al., 2005). Invertases
have been considered as principle regulators of sugarcane growth and accumulation (Gayler
and Glasziou, 1972). Work carried out by Ma et al. (2000) involving the down-regulation of
soluble acid invertase in the vacuole of sugarcane cells in liquid culture increased the
concentration of sucrose 2-fold however there was no significant impact on sucrose
concentration in the immature internodes of transgenic sugarcane plants after 70%
reduction of soluble acid invertase activity (Botha et al., 2001).
A kinetic model of sucrose accumulation was developed to determine which targets when
manipulated may increase sucrose accumulation (Botha and Vorster, 1999; Rohwer and
Botha, 2001). Rohwer and Botha (2001) determined that cytosolic neutral invertase, the
putative vacuolar sucrose import protein and hexose transporters may be promising
targets for genetic manipulation to increase sucrose concentration.
14
Due to differences in morphological features and enzyme activities, the genes are
differentially expressed between the different tissue types in the stem and at the different
developmental stages. Carson and Botha (2002) have used an expressed sequence tags
(ESTs) approach to identify genes preferentially expressed during stem maturation. This
research has provided a framework for functional gene analysis in sugarcane sucrose-
accumulating tissues. These genes are under the control of specific regulatory elements
(promoters) which have a stem-specific expression pattern. The isolation and
identification of these specific regulatory elements of stem-specifically expressed genes can
be used to regulate transgene expression in the stems with respect to membrane transport,
sucrose metabolism, carbon partitioning into different pools and phloem unloading in
various sink tissues.
2.3 UGenetic engineering of sugarcane
During the past years much effort has been invested in understanding the structure and
regulation of plant genes. Both this understanding and the recent advances made in plant
molecular biology have provided new strategies to produce genetically engineered plants.
Plant molecular biology has also allowed for the development of transfer techniques for
precise transfer of new genes from diverse sources into crop plants (Stockmeyer and
Kempken, 2004). These diverse sources include plants, animals, bacteria and viruses
(Datla et al., 1997). These transfer techniques and tissue culture approaches have been
well established.
In principle genetic engineering is the introduction of useful foreign genes into a plant’s
genome and has potential commercial applications for modifying traits in transgenic
plants that were otherwise not possible using other techniques (Datla et al., 1997).
Genetic engineering strategies that can be used to modify the function of a plant fall into
three categories, (1) up or down regulation of endogenous gene expression, (2)
modifications to endogenous genes and their expression and (3) introduction of
exogenous genes into the plant (Groenewald et al., 1995).

15
2.3.1 Requirements of sugarcane genetic engineering
The essential requirements for a gene transfer system for the production of transgenic
plants are (a) availability of a target tissue for plant regeneration , (b) genotype specific
tissue culture (c) regulator elements (promoters), (d) a method to introduce DNA into the
regenerable cells and (e) a procedure to select and regenerate transformed plants (Birch,
1997).
2.3.1.1 In vitro culture systems
Sugarcane is vegetatively propagated for commercial use, however a substantial amount
of work has been carried out on in vitro culture systems for the purposes of somatic cell
improvement (Larkin and Scowcroft, 1981), the production of disease-free cells (Irvine
and Benda, 1985), in vitro micropropagation (Lee, 1987) and genetic transformations
(Bower et al., 1996; Gallo-Meagher and Irvine, 1996; Falco et al., 2000). There are two
main routes for the regeneration of sugarcane, namely direct and indirect morphogenesis.
With respect to direct morphogenesis, plants are regenerated directly from tissue such as
immature leaf roll discs while indirect morphogenesis involves the initial culturing of leaf
roll sections or inflorescences on an auxin-containing medium to produce an
undifferentiated mass of cells, or callus (Snyman, 2004).
With respect to the vegetative propagation of sugarcane for commercial purposes, the
termed used is direct organogenesis. This refers to sections of stem or setts which
contain a bud and root primordial and are able to give rise to plantlets (Moutia and
Dookun, 1999). Direct organogenesis in vitro can be achieved by shoot tip culture (Lee,
1987) or shoot multiplication from leaf discs (Irvine and Benda, 1985). Irvine and Benda
(1985) first reported the direct somatic embryo formation on sugarcane leaf discs without
callus formation in vitro during a process of rapid regeneration of plantlets in an attempt
to rid sugarcane of sugarcane mosaic virus (SCMV).
The use of embryogenic callus as a target material for microprojectile bombardment has
been used by sugar industries worldwide in genetic engineering programmes for the
16
production of transgenic sugarcane (Snyman et al., 2000). The use of embryonic callus
cultures for DNA transfer, particularly by microprojectile bombardment has increased the
ability to transform members of the Gramineae (Bower and Birch, 1992). However, it is
well known that callus induction and plant regeneration is time consuming and laborious
and also causes somaclonal variation (Goldman et al., 2004). In other protocols, freshly
isolated immature embryos were used as a target for microprojectile bombardment or for
Agrobacterium infection (Popelka and Altpeter, 2003).
Studies carried out by Snyman et al. (2006) investigated a rapid in vitro protocol using
direct somatic embryogenesis and microprojectile bombardment to establish the
developmental phases most suitable for efficient sugarcane transformation. It was shown
that for effective transformation to occur, explants should be cultured for several days to
allow initiation of embryo development prior to bombardment.
The first report on the production of transgenic plants without callus formation in
monocotyledonous plants was provided by Wang and Ge (2005) using bermudagrass
and creeping bentgrass. This study used stolon nodes as explants and successfully bypassed
the callus formation phase by direct infection of stolon nodes with Agrobacterium
followed by direct and rapid regeneration of transgenic plants.
2.3.1.2 Transformation systems and constructs
Plant transformation is a core research tool in plant biology and cultivar improvement
since specific genes can be introduced and expressed in plants (Birch, 1997; Koyama et
al., 2005). The limiting factor in achieving effective transformation of agronomically
important species in the past was the DNA delivery method but now the methods
developed include Agrobacterium-mediated transformation, particle bombardment,
electroporation and microinjection (Songstad et al., 1995; Datla et al., 1997). Transgenic
monocotyledonous plants were first obtained by direct gene transfer to protoplasts, then by
biolistic transformation, and in more recent years by Agrobacterium-mediated
transformation.

17
In vitro single-cell transformation was first documented in 1979 from work carried out by
Marton and colleagues. The first experiments used the soil bacterium, Agrobacterium
tumefaciens. This is a phytopathogen that has evolved a parasitic mechanism allowing
it an ecological niche in which to flourish (Smith, 2001). The bacterium transfers a
specific region of DNA on its Ti plasmid which would then be incorporated into the plants
own genome (Smith et al., 2001).
The use of transformation mediated by the Agrobacterium is far more successful for
dicotyledonous plants and is now routinely used for many plants including potato
(Romano et al., 2000), strawberry (Zhao et al., 2004), tobacco (Roger et al., 2001) etc.
Cereals and legumes on the other hand are still rather difficult to engineer (Smith et al.,
2001) since they are recalcitrant in tissue culture and their transformation has not been
standardized (Popelka et al., 2003). However there are still some reports on the use of
Agrobacterium-mediated transformation on a range of cereals, these include wheat
(Cheng et al., 1997), maize (Ishida et al., 1996), rice (Hiei et al., 1994), barley (Tingay et
al., 1997) and sugarcane (Elliott et al., 1998; Arencibia et al., 1998) even though they are
outside the host range. Even though there are reports of success with Agrobacterium
tumefaciens-mediated transformation of sugarcane, it is not used routinely for genetic
engineering; rather the technique of microprojectile bombardment is used.
The particle bombardment technology was first described by Sanford et al. in 1987 and
since then a number of major crop species have been engineered (reviewed by Vain et al.,
1993; Hadi et al., 1996; Romano et al., 2000; Breitler et al., 2002; Permingeat et al.,
2003; Popelka et al., 2003). Christou et al. were the first to report stable transformation
events in 1988 in which viable DNA was delivered into immature soybean embryos and
stable transformed callus material was isolated from protoplasts. Particle bombardment is
the most widely used method of transformation for those plants that are not susceptible to
Agrobacterium transformation, such as most monocotyledonous and some dicotyledonous
plants (Christou, 1995).

18
Particle bombardment has also proven to be very successful for transformation of
sugarcane which has been a very difficult crop plant to transform in the past (reviewed by
Bower and Birch, 1992; Sun et al., 1993; Falco et al., 2000; Snyman et al., 2001). Plant
regeneration from bombarded embryogenic callus is efficient and simple and since all
sugarcane cultivars that have been tested are able to initiate embryogenic callus (Taylor
et al., 1992), this method of gene transfer into sugarcane is made feasible (Bower et al.,
1996). The use of embryogenic callus as a target material for microprojectile
bombardment has been reported by sugar industries around the world. Particle
bombardment can be used on any sugarcane cultivar but differences in transformation
efficiencies have been reported and this is linked to the cultivar used, genotypic response
to hormone treatment and selection regime (Snyman et al., 2000).
This technology uses gold or tungsten particles coated in DNA which are propelled at
high speed toward the plant tissue. This therefore allows for the forced penetration of
DNA into the cell nucleus where it is integrated into genomic DNA during replication
(Smith et al., 2001; Breitler et al., 2002). Its advantage lies in achieving truly genotype-
independent transformation since most tissue culture related regeneration problems are
avoided (Christou, 1997). Also the DNA of interest can be introduced into regenerable
cells, tissues or organs (Christou, 1997).
2.4 UGene regulation
The regulation of gene expression in plants is controlled at both the transcriptional and
post-transcriptional level. Transcription is divided into three stages namely, initiation,
elongation and termination. Initiation begins with the binding of RNA polymerase to the
promoter region of each gene. Ribosomal RNA is transcribed by RNA polymerase I,
mRNA by RNA polymerase II, and tRNA by RNA polymerase III (An and Kim, 1993).
Transcription factors are also required for transcription initiation. Transcription
elongation occurs when the RNA moves along the DNA; this extends the RNA chain
until RNA synthesis is terminated at the transcription terminator region. At this point the
transcription complex dissociates (An and Kim, 1993).
19
The general steps involved in turning a gene into a protein product, require the gene to be
transcribed, spliced and processed to form mRNA which is translated into a polypeptide. All
cells contain at least one form of RNA polymerase. This enzyme transcribes DNA into
RNA prior to the translation of mRNA into protein. There are additional steps in the
process of gene expression found in complex organisms. For example, for many genes, the
RNA transcript must be ‘spliced’, a process that removes unwanted sequences; it must be
chemically modified at one or both its ends followed by transportation out of the nucleus
for translation (Ptashne and Gann, 2002).
2.4.1 Gene silencing
The inheritance and stable expression of transgenes is an important concern in crop
improvement through gene manipulation. Studies have revealed that in some cases
transgene expression was lost in a variable proportion of the progeny (Chareonpornwattana
et al., 1999). This phenomenon, referred to as ‘gene silencing’, has been studied most
extensively in dicotyledonous plants, such as tobacco, petunia, tomato and buckweed
(reviewed in Matzke and Matzke, 1995; Stam et al., 1997). In contrast to the extensive
studies on gene silencing in dicotyledonous plants, there have been relatively few studies
in gene silencing in monocotyledonous plants or on the mechanisms of transgene
inactivation (Cooley et al., 1995).
In plants and animals there is an additional level of gene regulation through the
modification of DNA by cytosine methylation (Finnegan, 2001). DNA methylation can
inhibit transcription by preventing the binding of the basal transcriptional machinery
through the modifications of target sites (Finnegan, 2001). It is thought that this
mechanism is important in preventing transcription of genes intended to be permanently
turned off. Experiments have shown that a signaling molecule is involved in the systemic
spread of gene silencing and resulting resistance of viruses (Palauqui et al., 1997). Both
gene silencing and virus resistance have been found to be induced by virus infections of
non-transgenic plants (Covey et al., 1997; Morino et al., 2004). Results from these
experiments and others have led to the hypothesis that gene silencing is a natural plant
defense mechanism.

20
Homology-based gene silencing (HBGS) is a generic term for the two types of gene
silencing recognised, namely transcriptional gene silencing (TGS) and post-
transcriptional gene silencing (PTGS). Both have been reported to occur extensively in
transgenic plants (Meyer and Saedler, 1996; Vaucheret and Fagard, 2001). Both types
have been found to lead to reduced or undetected steady state levels of transcripts. It is
possible that there are multiple mechanisms for gene silencing therefore several models
have been proposed by Matzke and Matzke (1995b) to explain gene silencing. These
include the methylation of specific sequences in the promoter region, aberrant RNA
production, RNA-DNA pairing and a RNA threshold model.
Furthermore, the phenomenon of gene silencing may be instigated when multiple copies
of a gene cassette integrate into plants during transformation (Van der Krol et al., 1990).
There is however a vast difference between transcriptional gene silencing and post-
transcriptional gene silencing. TGS occurs when interacting genes share sequence
homology in promoter regions and inhibits transcription by promoter methylation,
whereas post-transcriptional gene silencing requires homology in transcribed sequences
in which the transcription rate is not affected but double-stranded RNA induces the
degradation of homologous RNA sequences (Mette et al., 1999; Bass, 2000; Fagard and
Vaucheret, 2000). Recent studies indicate that TGS and PTGS may be mechanistically
and functionally related since they have some of the same events, including changes in
DNA methylation (Paszkowski and Whitham, 2001). Since both types of silencing are
confined to regions of sequence homology, sequence-specific methylation signals
consisting of either DNA-DNA or RNA-DNA associations are believed to be involved
(Mette et al., 2000).
A study carried out by Mette et al. (1999) demonstrated the effect of sequence homology
in the promoter region. The experimental design involved the intentional transcribing of
the nopaline synthase promoter (NOSpro) sequences by the cauliflower mosaic virus 35S
promoter to produce NOSpro RNAs. The result of this in the tobacco line was the
induction of methylation and transcriptional inactivation of homologous NOSpro copies
in trans.
21
Both types of gene silencing have been associated with changes in DNA cytosine 5-
methylation, which is generally concentrated in promoters for transcriptional gene
silencing and at the 3' end of genes for post-transcriptional gene silencing (Mette et al.,
1999). This hypermethylation can spread within promoter regions or within transcribed
regions, however the extent of spreading is lesser from promoter to adjacent transcribed
regions and from transcribed to adjacent promoter regions (Paszkowski and Whitham,
2001).
The sequence homology triggers cellular recognition mechanisms that result in silencing
of the repeated genes. One way to prevent silencing of introduced DNA is to develop
gene cassettes that contain very little sequence similarity to endogenous sequences or to
one another if a number of transgenes need to be introduced (Bhullar et al., 2003). With
respect to promoters, homology can be avoided by using diverse promoters isolated from
different plant and viral genomes or by designing synthetic promoters (Bhullar et al.,
2003).
There have been extensive studies carried out on gene silencing in dicotyledonous plants,
however there have been relatively few studies carried out for monocotyledonous plants.
When conducting studies involving the isolation of promoters from one plant for use in
another, transcriptional gene silencing may place a great limitation. An example of this
limitation has been noted when sugarcane promoters, following re-introduction into
sugarcane, have lead to transcriptional gene silencing (Birch et al., 1995).
There have been two nuclear proteins identified for TGS, namely the DNA
DEMETHYLATION1 GENE (DDM1) and the Morpheus molecule (MOM1). DDM1 is
a chromatin-remodeling protein belonging to the SNF2/SW12 superfamily. Its
impairment releases both TGS and methylation of transgenes and silent retrotransposons
(Jeddeloh et al., 1999). The impairment of MOM1, a nuclear protein, releases TGS but not
methylation of the transgene, this therefore suggests that TGS could operate through
methylation-dependent or –independent pathways (Amedeo et al., 2000). The findings from
these two proteins suggest that proteins involved in changes of chromatin structure are
22
required to ensure the correct levels and allocation of methylation. Furthermore, TGS can
also result from expression of dsRNA derived from promoter sequences, suggesting that like
PTGS, TGS can be mediated by dsRNA (Chandler and Vaucheret, 2001).
2.5 UPromoters
A promoter is essential to drive the transcription of a gene since it contains specific
sequences recognized by proteins that are involved in the initiation of transcription
(Buchanan et al., 2000). This therefore makes promoters critical to the success of
transgenic approaches in sugarcane crop improvement. The promoter of a gene contains
the information required to direct when, where and to what extent the gene will be
expressed (Datla et al., 1997) therefore promoters affect transcription both, quantitatively
and qualitatively (Potenza et al., 2004).
2.5.1 Functional and structural organisation of promoters
Transcriptional activation of genes is controlled by both cis-acting DNA sequences and
trans-acting factors. The cis-acting sequences comprise the promoter region while trans-
acting factors include for example gene-specific DNA-binding proteins. The cis-acting
sequence of promoters contains two core elements, the “TATA” box and the initiator.
These elements are known to function as binding sites for transcription factors and other
proteins that are involved in the initiation process (Reese and Eeckman, 1995). The core
promoter is located about 40 base pairs upstream of the start of transcription and the
upstream promoter region may extend 200 base pairs farther upstream (Potenza et al.,
2004).
A TATA box is present in most of the RNA polymerase II mediated promoters and is a
highly conserved sequence. It is an AT-rich sequence which is usually located 20 to 35
nucleotides upstream of the transcription start site (Butler and Kadonaga, 2002). The
TATA sequence binds to RNA polymerase II through a number of general transcriptional
factors (TATA-binding proteins, RNA polymerase and other associated factors) (Butler
and Kadonaga, 2002). The TATA element in the promoter region is recognized by this

23
complex. This element serves as anchor for making contact with gene-specific
transcriptional factors to thus activate transcription. Studies carried out by An and Kim
(1993) showed that the removal of the TATA box results in a reduced promoter activity.
Also for some genes, tissues, organs or environmental conditions, specific expression
is determined by the TATA box (Butler and Kadonaga, 2002). Knowledge of TATA-
less promoters in plants is limited but it was found that the majority of TATA-less
promoters were common to genes associated with photosynthesis (Nakamura et al. 2002).
Over the years, numerous promoters have been isolated from a wide variety of organisms
and applied to plant genetic engineering systems. Great demand has been placed on
increasing the range of available promoters for sugarcane transformation and studies are
constantly being carried out to obtain strong promoters. It is known that certain
promoters direct gene expression at higher levels than others (Xiao et al., 2005). A good
knowledge of the pattern of activity of a promoter is critical to both the design of the
transformation experiment and the stability of gene expression (Rooke et al., 2000). An
important factor for the expression of a gene is the choice of a suitable promoter that
results in the desired amount, location and timing of transgene expression. Promoters
that are used and sought after for biotechnology are of different types according to the
intended type of control of gene expression. There are two major classifications of
promoters; this includes constitutive promoters and tissue-specific promoters.
2.5.2 Constitutive promoters
Constitutive promoters direct expression in virtually all tissues and are largely
independent of environmental and developmental factors. The expression of these
promoters is normally not conditioned by endogenous factors and therefore can be active
across species and even kingdoms (Potenza et al., 2004). However, it does not
necessarily imply that this promoter drives the expression of a transgene at the same level
in all cell types but rather it expresses the transgene in a wide range of cell types with
some variation in expression levels (Bade et al., 2003).
Some examples of constitutive promoters include the nuclear gene promoter from the 3-

24
subunit of the mitochondrial ATPase complex (Boutry and Chua, 1985), the rice ACT1
promoter (Zhang et al., 1991), the maize Ubi promoter (Christensen and Quail, 1996) and
the CaMV 35 S promoter (Fang et al., 1989). The CaMV 35S promoter has been widely
used for high-level constitutive expression in dicotyledonous but confers low levels of
transgene expression in most of the sugarcane studies reported to date (Lakshmanan et al.,
2005). Recently Xiao et al. (2005) have isolated and characterised a novel plant promoter,
MtHP promoter that drives strong constitutive expression of transgenes in plants. The
promoter was isolated from a model legume species, Medicago truncatula and was shown to
direct higher levels of GUS expression than CaMV promoters in a range of plant species
Although there are some examples of promoters active in dicotyledonous plants also being
active in monocotyledonous plants, in many cases the dicotyledonous promoter requires
modification in order to show high levels of expression in monocotyledonous species.
The maize ubiquitin 1 promoter (Christensen and Quail, 1996) produced significantly
higher expression in sugarcane than other tested promoters (Rathus et al., 1993; Gallo-
Meagher and Irvine, 1996) such as the CaMV 35S promoter, the synthetic Emu promoter
(Last et al., 1991) and the rice actin Act-1 promoter (McElroy et al., 1991). From the
current trends obtained from these studies, the Ubi-1 is becoming the promoter of
choice for constitutive expression of transgenes in sugarcane.
Studies conducted by Liu et al. (2003) showed that the rice ubiquitin promoter RUBQ2
has increased transgene expression by about 1.6 fold over the maize Ubi-1 promoter in
sugarcane. From such studies is can be see that there is a constant demand and urgency
to obtain promoters for driving transgene expression in sugarcane. But it must be noted
that promoter activity in different plant species varies and therefore not all of these
promoters can be used for high-level expression in all monocotyledonous species (Wilmink
et al., 1995).
Promoter elements from plant viruses have also been investigated for driving high-level
transgene expression in sugarcane. Because of the success of the CaMV 35S promoter,
other promoters have been developed or are being developed for use. In 2004,
Braithwaite et al. compared four genomic regions of Sugarcane bacilliform virus shown
25
to have promoter activity in sugarcane. One of these promoters drove GUS expression in
meristems, leaves and roots of glasshouse-grown sugarcane plantlets at levels equal to or
higher than those obtained for the maize Ubi-1 promoter. Another study by Schenk et al.
(2001) showed a promoter isolated from Banana streak virus to be capable of driving
green fluorescent protein (GFP) expression up to 3 fold higher than that reported for the
maize Ubi-1 promoter. The banana bunchy top virus is another example of a virus from
which promoter elements have been isolated and is currently undergoing characterisation in
sugarcane in Australian laboratories (Grof and Campbell, 2001).
Another constitutively expressed promoter isolated from a virus was that from the Cestrum
yellow leaf curling virus (CmYLCV), belonging to the Caulimoviridae family. This
promoter was found to be highly active in callus, meristems and vegetative tissues of Zea
mays, Oryza sativa and Nicotiana tabacum (Stavolone et al., 2003). Other viral promoters
include those from mirabilis mosaic virus (Dey and Maiti, 1999), cassava mosaic virus
(Li et al., 2001), figwort mosaic virus (Sanger et al., 1990) and cotton leaf curl Multan
virus (Xie et al., 2003).
2.5.3 Tissue-specific promoters
Tissue-specific promoters drive the expression of a gene in a specific tissue or at certain
stages of development. Transgenes driven by these types of promoters will only be
expressed in tissues where the transgene product is desired, leaving the rest of the tissue
in the plant unmodified by the transgene expression (Stitt et al., 1995; Potenza et al.,
2004). Constitutive promoters which have non-specific expression patterns such as
CaMV 35 S, maize Ubi 1 and rice actin 1 have a number of potential drawbacks for use
in genetic engineering (Gittins et al., 2000). For example the over-expression of a
specific transgene in tissues where it is not normally expressed, or at very high levels,
can have unexpected consequences on plant growth and development (Potenza et al.,
2004).
An example of the value of tissue-specific expression would be the confinement of an

26
insecticidal transgene product to affected tissues instead of harvestable material (Bucchini
and Goldman, 2002). Another advantage is the use of tissue-specific promoters for
targeting metabolic processes in a tissue type which could increase yields obtained from
commercial crops (Lakshmanan et al., 2005).
Many tissue-specific genes and the corresponding promoters have been isolated.
Examples include genes that are specifically expressed in flower (Annadana et al., 2002)
pistil (Ficker et al., 1997), anthers (Koltunow et al., 1990), roots (Yamamoto et al., 1991;
Nitz et al., 2001; Winicov et al., 2004; Koyama et al., 2005), fruits (Edwards and
Coruzzi, 1990), phloem (Zhao et al., 2004) and epidermal cells (Ancillo et al., 2003).
The most extensively studied leaf-specific gene is the gene that encodes the small subunit
of Rubisco (rbcs) (Fluhr et al., 1986). Sugarcane Rubisco small subunit genes have been
isolated, sequenced and the corresponding promoter elements isolated (Tang et al., 1996).
The promoter showed expression specifically in leaves and preferentially in bundle
sheath. Recently a promoter of a gene for Chrysanthemum Chlorophyll-a/b-binding
protein was isolated and expressed a transgene in leaf tissue more efficiently that the 35S
promoter (Aida et al., 2004). The promoter of alcohol dehydrogenase expressed during
ripening of the grape berry was isolated and characterised as a fruit-ripening promoter
(Sarni-Manchado et al., 1997). Another promoter from a gene expressed during
grapevine ripening (VvAdh2) has also been isolated and analysed (Verries et al., 2004).
It must be noted that very little is known about tissue-specific promoters in sugarcane,
especially strong stem and root specific promoters. However, a sugarcane stem-specific
promoter, UQ67P has been isolated and shown to be able to drive reporter gene
expression in stem tissue (Hansom et al., 1999). Also Mirkov and his colleagues were
successful in cloning two stem-specific promoters from sugarcane; these promoters
showed strong reporter gene activity in stem tissues of transgenic sugarcane (Mirkov et
al., unpublished results).
2.5.3.1 Regions within the promoter driving tissue-specific expression
There are specific regions of the promoter which are necessary for tissue specific

27
expression. These regions can be identified by deletion analysis and reporter gene
expression studies. It has been found that in most cases the proximal region of the
promoter is able to confer specificity of expression (Tyagi, 2001). One of the best
characterised and most commonly used seed-specific promoters is the French bean 3-
phaseolin gene (van der Geest and Hall, 1997). The -295 bp region of the
β-phaseolin promoter has been identified as containing sequence motifs implicated in
directing seed specific expression in transgenic tobacco plants. The two motifs were the
legumin box (CATGCATG) and endosperm boxes (TGTAAAGT and RTGAGTCAT).
Extensive in vivo footprint analysis showed that over 20 cis-elements are present and
bind trans-acting factors in seeds. This specific binding mediates expression in various
regions of the embryo (Chandrasekharan et al., 2003).
Analysis of the promoters from the 1-aminocyclopropran-1-carboxylate (ACC) gene
showed promoter fragments ranging from -1966 to -1159 bp from the start of
transcription were able to drive ripening-specific expression of a reporter gene in the
tomato fruit, with no activity present in other tissues (Atkinson et al., 1998). An 809 bp
region located between -1115 and -306 was found to be responsible for increase in the
activity levels of the VvAdh2 promoter from grapevine. Further analysis of this region
revealed two putative cis-elements corresponding to enhancer-like elements, respectively
positioned at -1781 (TGAAAAAT) and -181 (GTGGATTG) (Verries, et al., 2004).
Closer examination of the 809 bp promoter region revealed the presence of an AT-rich
region of 60 bp length, with two repeated motifs (TTTTA and TTA respectively).
However, these motifs did not correspond to other known cis-elements. But the elements
were an interesting putative enhancer motif of the VvAdh2 promoter expression (Verries
et al., 2004).
The gSPO-A1 promoter from sweet potato was fused to a reporter gene showing high
levels of expression in the stem. Analysis of the promoter region showed two sequence
elements; one directs expression to the phloem (-305 and -237 bp) and the other to the
pith parenchyma (-192 to -94 bp) (Ohta et al., 1991).

28
2.5.3.2 The importance of stem-specific promoters to sugarcane
The sugarcane plant comes under great attack from sugarcane pests especially in the
region of the stems. Pests such as the eldana borer, which is the larval stage of the Eldana
saccharina Walker (Lepidoptera: Pyralidae), attack the older cane stems. The borer feeds
voraciously on the soft tissue inside the sugarcane stem causing serious loss in yields and
cane quality. Up to 14 borers per internode have been recorded and the cane can become
completely hollowed out. It has been estimated that, for every one eldana per 100 stems,
0.5 ton cane per hectare is lost (Guidelines and recommendations for Eldana control in
the SA sugar industry, 2005).
Another problem faced by the sugarcane stem is the disease Smut caused by the fungus
Ustilago scitaminea. The symptoms include dark brown, whip-like structures which
develop from the tops of infected shoots of stems (Sugarcane Diseases in Southern
Africa, 2003). Such problems of pest and diseases have caused major economic losses
and these pests and diseases are controlled by integrated pest management (IPM)
approaches which involve cultural, biological and insecticidal controls (Allsopp and
Manners, 1997; Allsopp and Suasa-ard, 2000). Another technology that can be
implemented to maximise and sustain crop productivity is the introduction of novel
insecticidal genes by transgenic approaches. Similar studies have been carried out by
Liebbrand and Snyman, 2003 in which a Saccharum hybrid cultivar Nco310 was
transformed with a pat gene which confers resistance to the herbicide Buster (glufosinate
ammonium; Bayer CropScience Monheim am Rhein, Germany) Therefore the isolation
of stem-specific promoters would be very valuable.
Considerable progress has been made to date in targeting pest resistance in the sugarcane
stem. A study carried out by Legaspi and Mirkov (2000) observed considerable growth
inhibition of sugarcane stem borers when they were fed on transgenic sugarcane
engineered with lectin genes. Therefore obtaining stem-specific promoters would
provide opportunities to introduce or enhance natural pest resistance (Lakshmanan et al.,
2005).

29
The sugarcane stem is also an important area of the plant with respect to sucrose
accumulation. Sucrose cycling and compartmentation are important features for the
sucrose accumulation process in the sugarcane stem. However, the regulation of these
mechanisms is not well understood (Moore, 1995). The regulations of these mechanisms is
controlled by different key enzymes which are expressed in different cell types which are
regulated by specific promoters. Therefore the isolation of stem-specific promoters may
provide a clear understanding of the sucrose pathway by targeting specific key genes which
can be either up-regulated or down-regulated to increase sucrose accumulation in the
sugarcane plant using transgenic approaches. It may also help to understand the role of
different tissue types involved in sink-to-source interaction in sugarcane.
2.5.4 Enhancer elements
Although initiation of transcription is dependent on sequences found in the core and
upstream promoter regions, many other DNA sequence motifs, which occur within the
surrounding DNA, are also involved in the regulation of gene expression (Potenza et al.,
2004). Much of the fine-tuning of gene expression is controlled by sequence-targeted
transcription factors or enhancer-binding proteins (Alberts et al., 2002). Enhancer-
binding proteins bind to cis-elements within the promoter of the gene. These cis-
elements are also called enhancer elements and are conserved DNA sequence modules that
vary in size and show sequence degeneracy which make them difficult to recognize using
comparative analysis. A large number of enhancers have been discovered using promoter
deletion studies, DNA foot-printing and site-specific sequence mutation (Potenza et al.,
2004).
Various strategies can be employed to increase the activity of promoters. One strategy is
to add an enhancer element that increases the transcription of a promoter (Last et al.,
1991). In plants, extra copies of enhancer elements can enhance the activity of a
promoter (Chen et al., 2002). An example would be the anaerobic responsive element to
the maize Adh1 promoter (Olive et al., 1990). Multiple copies of enhancer elements
have also been employed using the octopine synthase enhancer from Agrobacterium
tumefaciens to the maize Adh1 promoter (Ellis et al., 1987).

30
Enhancers can be located hundreds or thousands of base pairs away from the gene they
control. They can be found upstream or downstream of the coding region and within the
coding or intronic sequences.
In several but not all promoters a CAAT box is contained and seems to play an important
role in promoter efficiency, by increasing its strength and functions in either orientation
(An and Kim, 1993). There are also hexamer motifs that are found as repeats separated
by six to eight nucleotides. A hexamer sequence (TGACGT) is found in most
constitutive promoters within a few hundred nucleotides from the transcriptional start site
(An and Kim, 1993). These motifs are essential for the transcription activity of the
cauliflower mosaic virus (CaMV) 35S, octapine synthase (ocs) and nopaline synthase
(nos) promoters.
Several consensus sequence elements, including the G motif, the GATA motif, the GT1
motif and the Z motif, are commonly found in light regulated minimal promoter regions
and have been shown by mutagenesis studies to be necessary for high promoter activity
in the light (Kehoe et al., 1994). The H-box sequence (CCTACC) together with the G-
box sequence (CCACGTGG) is essential for the expression of the bean chalcone
synthase gene (Arias et al., 1993). The 3-phaseolin promoter drives expression
specifically in transgenic tobacco seeds but it has been found that the inclusion of the
matrix attachment regions found flanking the 3-phaseolin gene in the transgenic
constructs enhances transcription (van der Geest and Hall, 1997).
An enhancer sequence, TATCCA was found to significantly enhance transcription in the
CaMV 35S minimal promoter in rice protoplasts thus serving as a transcriptional
enhancer. Also, mutations of the TATCCA element in the promoters of two barley a-
amylase genes were found to lower its expression by 20% (Chen et al., 2002). The
enhancer sequence, (T/A)AAAG was found to enhance transcription of the C4-type
phosphoenolpyruvate carboxylase promoter in Zea mays (Yanagisawa and Schmidt,
1999). Another example is the enhancer sequence, GTGAGGTAATAT which enhances the
Ribulose-1,5-biphosphate carboxylase promoter in Pisum sativum (Green et al.,

31
1987).
2.5.5 Intron-mediated transgene expression
Introns are intervening sequences present in the pre-mRNA but absent in the mature
RNA following splicing mechanisms (Bourdon et al., 2001). In plants numerous studies
involving introns have focused on their effects when inserted between the promoter
region and the coding sequence of the gene. Introns inserted inside the coding region of
the reporter gene were shown to enhance gene expression (Tanaka et al., 1990). In plants
introns are characterised by their AT content (60%) and their consensus splicing sites
(Lorkovic et al., 2000). The AT content of three maize introns in studies carried out by
Bourdon et al. (2000) were between 54 and 63%. With respect to efficient intron splicing
suggestions have been made that the sequences surrounding the introns are important for
intron splicing (Matsumoto et al., 1998). Work carried out by Bourdon et al. (2001)
clearly demonstrated that introns even within the coding sequence are of a major
determinant of transgene expression levels. Their sequence and position within any open
reading frame could determine how and with what efficiency the ribosomes employ the
mRNA once the mRNA has been exported from the nucleus.
The enhancement of gene expression by introns in plants is not a general phenomenon
since some naturally occurring genes do not contain introns and are still expressed
efficiently therefore intron-mediated enhancement may be a gene dependent process
(Rethmeier et al., 1997; Mascarenhas et al., 1990). In plants, enhancement of gene
expression is observed only in the more GC-rich genomes, such as those of
monocotyledonous plants (Taylor et al., 1993).
In many organisms, a significantly higher level of gene expression is observed from
intron-containing transgenes than from intronless constructs (Callis et al., 1987; Duncker
et al., 1997). Work carried out by researchers has shown that introns have a strong
32
enhancing effect on gene expression when inserted downstream of a promoter sequence
within the transcriptional unit (Sinibaldi and Mettler, 1992). This effect of introns has
also been observed with promoters which, on their own, have weak activity in
monocotyledonous, such as the cauliflower mosaic virus (CaMV) 35S promoter (Vain et
al., 1996).
The enhancing effect of introns within the transcriptional unit for gene expression in
monocotyledonous has also been well documented. This effect seems to be directly related
to the splicing mechanism and it is thought that the improved gene expression results from
synthesis of a relatively more stable RNA molecule (Sinibaldi and Mettler, 1992). This
strategy has been used for the cauliflower mosaic virus (CaMV) 35S promoter. In its
native form, the promoter is only poorly active in monocotyledonous, but the addition of an
intron taken from Adh1 (Vain et al., 1996), cat1, Ubi1 and Act1 (Vain et al., 1996)
dramatically improved promoter activity in maize, rice, barley, wheat and various
grasses. Furthermore, the addition of an intron (act1) to the potato pin2 promoter
greatly improved expression levels in transgenic rice (Xu et al., 1993).
Although there are examples of a promoter active in dicotyledonous plants also being active
in monocotyledonous plants (Verdaguer et al., 1996; Schenk et al., 1999, in many cases
the modification of the dicotyledonous promoter is required prior to high levels of
expression being achieved in the monocotyledonous species. The most common
modification for the enhancement of the promoter activity to obtain high levels of
expression being achieved in the monocotyledonous species is the addition of an intron
between the promoter and the transgene open reading frame. This strategy has been used
for the cauliflower mosaic virus (CaMV) 35S promoter. The native form of this
promoter is only poorly active in monocotyledonous but the addition of an intron taken
from Adh1 enhances the promoter activity.
Transcription factor binding sites have been found in plant introns. Examples include the

33
barley HVA22 gene induced by abcissic acid (ABA), in which one of the elements
essential for ABA induction is located in the intron (Shen et al., 1993). Another is the
intron of the potato sucrose synthase gene (Sus4), which includes a ‘promoter-like
structure’ that regulated the activity of its promoter. Work carried out by Salgueiro et al.
(2000) showed that the activity of the complete promoter, exon and intron cassette
using the maize ubiquitin promoter for driving expression in tritordeum and wheat was
up to 20 000-fold higher than background but the maize ubiquitin promoter in isolation
had very low activity (Salgueiro et al., 2000). Within the maize ubi intron several
‘promoter’ sequences were recognized. At position +924 a TATA-box-like sequence
(TATAA) and a CAAT box at position +390 (CAAT) was identified. Other known
transcription factor binding boxes were located. The intron of maize adh1 showed a TATA
motif at position +298, a CAAT sequence at position +274 and an E-box element at
position +569.
These elements found within intron regions may play a role in the ability to drive gene
expression to a low extent. They may also have a regulatory role when the introns are
part of a transcriptional cassette. Results from Salgueiro et al. (2000) showed that
removing part of the intron and the small exon region resulted in undetectable GUS
activity in explants. This may also indicate the regulatory role for the small exon region,
as it is known that the 5' - 3'-UTRs can regulate gene expression. Further analysis
involving the use of promoterless constructs with only the maize ubiquitin promoter and
exon showed expression of GUS and may be due to transcription factors binding to these
sequences and initiating a low level of transcription. It was also speculated that some of
these binding sites within the intron region may play a role when introns are used as
enhancers downstream from weak promoters (Salgueiro et al., 2000).
The promoter of the UDP-glucose dehydrogenase gene was found to be ineffective in
driving transgene expression in sugarcane on its own but when fused with an intron (980
bp) derived from the 5'UTR of the same gene the level of transgene expression was
increased (van der Merwe et al., 2003). Work carried out by Bourdon et al. (2001)
showed that the insertion of the intron from maize into the coding region of the luciferase
reporter gene produced a significant and reproducible increase in luciferase expression.

34
2.6 UApproaches for promoter isolation
There have been several approaches implemented for the isolation of DNA fragments
carrying regulatory elements from plants. Most of the plant promoters isolated during the
early 80s used the conventional approach. This approach involved the identification of
the cDNA clone of a particular gene, and from its information the corresponding
promoter region from a genomic clone was isolated (Datla et al., 1997). The difference
between genomic clones and cDNA clones is the lack of introns in cDNA clones thus
making them easier to characterise and use as probes (An and Kim, 1993).
The overall approach to evaluating promoter activity involves the determination of the
expression pattern of a gene using Northern hybridisation using total RNA and the cDNA as
the probe (Yoshida and Shinmyo, 2000). If a gene is found to be expressed specifically in the
stem, transcription of the gene might be controlled by a stem-specific promoter. A genomic
DNA fragment is cloned from a genomic DNA library using cDNA as a probe. It is
possible to amplify the DNA fragment containing the promoter by PCR amplification. The
cDNA and the genomic DNA sequences are compared and the 5'- upstream region of the
gene is elucidated. The genomic DNA containing the promoter region (500-1000bp
upstream of the transcription initiation site) is ligated to a reporter gene such as β-
glucuronidase (GUS), luciferase (LUC) or a green fluorescent (GFP) to assess the activity
of the promoter activity (Yoshida and Shinmyo, 2000).
Genomic clones carrying a regulatory region can be isolated by screening a genomic
library with the cDNA clone used as a probe (Yoshida and Shinmyo, 2000).
Transcriptional regulatory regions can be obtained using this cDNA clone to isolate
adjacent regions from genomic DNA. The genomic DNA flanking the amino terminus of
a cDNA clone should contain the promoter and the region adjacent to the poly A tail
contains the terminator region of the gene (An and Kim, 1993).
After the genomic clone is obtained, restriction mapping and Southern blot analysis are
used to locate fragments containing the cDNA sequence. A restriction fragment carrying

35
the region upstream of the transcription start point of the region downstream of the
termination site is considered to contain a regulatory region. The length of the regulatory
region is difficult to estimate therefore it is best to start with 2 kb fragments for
characterisation or utilisation of the promoter (An and Kim, 1993).
This approach for isolating promoters by screening genomic libraries with a cDNA clone
has been applied by many researchers. Research carried out by Yang et al. (2003) at Texas
A&M University used the direct screening of a sugarcane genomic library with a radioactively
labeled cDNA probe to isolate constitutive promoters. A total of eleven promoters were
isolated with this strategy and two of these promoters driving elongation factor 1ct and
sugarcane proline rich protein encoding genes were found to drive β-glucuronidase (GUS)
expression in sugarcane callus and wheat embryos at levels equivalent to those obtained
with maize Ubi1 promoter (Yang et al., 2003).
Yang et al. 2003 implemented four steps in their approach for promoter isolation. First,
pooled mRNA from a specific tissue of interest was used as a probe to screen a phage
genomic library. Secondly, the coding region of these genomic clones was identified by
Southern hybridisation of restriction-enzyme digested Lambda phage DNA clones with
pooled first strand cDNA, and corresponding cDNA clones were isolated from a
sugarcane cDNA library. Thirdly, the copy number of genes was estimated by Southern
analysis and the expression level of genes was confirmed by Nothern analysis. Finally
the promoters were characterised by sequencing of the genomic clones, GenBank
searches, primer designing and transient expression analysis. Their final result was two
genomic clones of the sugarcane proline-rich gene and a sugarcane elongation factor
gene, which contained both the promoter and coding regions. These were sub-cloned,
sequenced and promoter regions defined by comparison of cDNA and genomic DNA
sequences (Yang et al., 2003).
The method implemented by Yang et al. 2003 involved isolating strong constitutive
promoters from sugarcane but a similar general methodology can be used to identify and
isolate tissue-specific promoters as shown by Muhitch et al. (2002). This study used the
36
glutamine synthase (GS) gene found in the maize genome involved in encoding a
cytoplasm-localised GS isozyme specifically expressed in the basal maternal tissues of
the developing kernel to isolate its corresponding promoter for conferring tissue-specific
gene expression in transgenic maize. Another example of this methodology was shown
in a study carried out by Opsahl-sorteberg et al. (2004) in which a promoter directing
aleurone cell specific expression was identified and isolated. In these examples Northern
blot analyses were carried out to either determine the level of the gene expression or the
tissues in which the gene was being expressed.
A sugarcane stem-specific promoter, UQ67P, has also been isolated and shown to drive
reporter gene expression in stem tissue (Hansom et al., 1999) and recently Mirkov and
co-workers at Texas A&M University were successful in cloning two stem-specific
promoters from sugarcane using a similar methodology implemented in this project.
These isolated promoters showed strong reporter gene activity in stem tissues of
transgenic plants (Mirkov et al., unpublished results).
Additional studies have been carried out to obtain corresponding promoters for the
chitinase C gene in potato (Ancillo et al., 2003), polyubiquitin gene in sugarcane
(Garbarino et al., 1995), Pyk10 gene in Arabidopsis thaliana (Nitz et al., 2001), MtHP
gene from Medicago truncatula (Xiao et al., 2005) and glutamine synthase gene from
maize (Muhitch et al., 2002). Studies carried out by Verries et al. (2004) involved the
screening of a grapevine genomic DNA library for the alcohol dehydrogenase (Adh) genes
with a cDNA probe. A clone containing the Adh gene from this library was selected and
sub-cloned into a vector for sequence analysis. The promoter region was identified within
this fragment and its activity was analysed by monitoring the Luciferase reporter activity in
particle-bombardment experiments on Vitis vinifera L. suspension cells (Verries et al.,
2004). These are but a few examples of the many promoters currently being isolated.
Other complementary approaches have also been implemented for the isolation of

37
promoters from plants. These include differential screening, subtractive hybridisation,
differential display, promoter tagging and inverse PCR. These approaches do not
require prior knowledge of the gene or its product (Datla et al., 1997). The promoter
tagging method is a commonly used approach and involves the delivery of promoter-
less reporter genes into plant genomes and assaying the transgenics for the activation of
the reporter genes. The tagging of plant promoters with reporter genes such as GUS and
LUC has an advantage to studying the regulatory properties of the tagged promoter
(Springer et al., 1995). The first report on plant promoter tagging employed a promoter-less
npt-II and positive selection for recovering transcriptional fusions (Teeri et al., 1986).
In another method, plant promoters can be isolated by inserting a random DNA fragment in
front of a promoterless reporter gene for the screening of the activation of the reporter gene.
A vector that was constructed for this purpose was the pROA97 vector which contains two
markers (npt gene and GUS gene). Both markers are placed under the minimal 35S
promoter carrying the TATA box region (An and Kim, 1993). Using this method several
promoter fragments were isolated from Arabidopsis thaliana (Ott and Chua, 1990) and rice
(Claes et al., 1991) genomic DNA. Having a completely sequenced genome such as that
of the model plant Arabidopsis, this facilitates easier promoter identification and
comparative analysis. Seki et al. (2002) identified promoter regions by comparing data of the
5'- ends of isolated full-length cDNAs, from Arabidopsis plants to genomic sequences of
Arabidopsis and constructed a promoter database using data from a plant transcription
factor database (Higo et al., 1999).
SASRI has been involved in promoter research programmes since 1990. A vast amount of
work has been done in this field to date. The programme is based on targeting
differentially expressed genes in plants for expression in specific tissues such as stems,
leaves and roots in sugarcane. This would allow for the isolation and characterisation of
their respective promoters. The project implements molecular techniques already
optimised at SASRI. The most recent promoter project in SASRI is to obtain four types of
novel promoters (DNA elements regulating gene expression), from maize and sorghum,
for targeted functionality in sugarcane; specifically promoters able to switch on gene
expression in leaf, young internodes, mature stem and root (Bernard Potier pers. comm.).

38
2.7 UGenomic libraries
2.7.1 Lambda genomic library
The construction of representative large insert DNA libraries is critical for the analysis of
complex genomes. Physical mapping and chromosome walking in complex genomes
requires large insert DNA libraries. These libraries are required to be rapidly constructed,
easily screened and manipulated (Woo et al., 1994). Most large insert DNA libraries are
constructed in bacteriophage, cosmid and yeast artificial chromosome (YAC) cloning vectors.
Large insert libraries have made valuable contributions to genome analysis and molecular
genetics (Vanhouten and MacKenzie, 1999). In plants, large insert libraries have been
developed for several crop species, such as rice, sugarcane, tomato, soybean, sorghum,
lettuce and maize. The clones obtained from these libraries have been used to facilitate
gene isolation by positional cloning and promoter isolation, to study the relationship between
physical and genetic distance, and to assess genome structure (Vanhouten and
MacKenzie, 1999).
2.7.2 Bacterial artificial chromosome library
The most commonly used system for constructing large insert libraries in plants is the
bacterial artificial chromosome (BAC) system. The BAC vector is an F plasmid-based
vector that is maintained as a single-copy plasmid in recombinant-deficient Escherichia
coli host to promote sequence stability (Shizuya et al., 1992).
The insert sizes found in most BAC libraries go up to 350 kb, averaging 100-150 kb
(Shizuya et al., 1992; Woo et al., 1994). The BAC system offers some important
advantages over the YAC system. The BAC insert DNA is easy to isolate and
manipulate and clone instability and chimeras (Umehara et al., 1995) have been reported
to be low (Bent et al., 1998) or absent (Shizuya et al., 1992; Woo et al., 1992 as
compared to the YAC libraries.

39
There are numerous examples of BAC libraries constructed for monocotyledonous plants.
Woo et al. (1994) constructed and characterised a BAC library of Sorghum bicolor in
which the library had an average insert size of 157 kb. This study focused on
establishing and implementing efficient map-based gene cloning systems for crop plants
for the isolation of important genes. Map based cloning is defined as the isolation of a
gene based solely on its position on a genetic map and it includes four basic elements 1)
target gene mapping; 2) physical mapping 3) chromosome walking and 4) gene
identification (Wing et al., 1994).
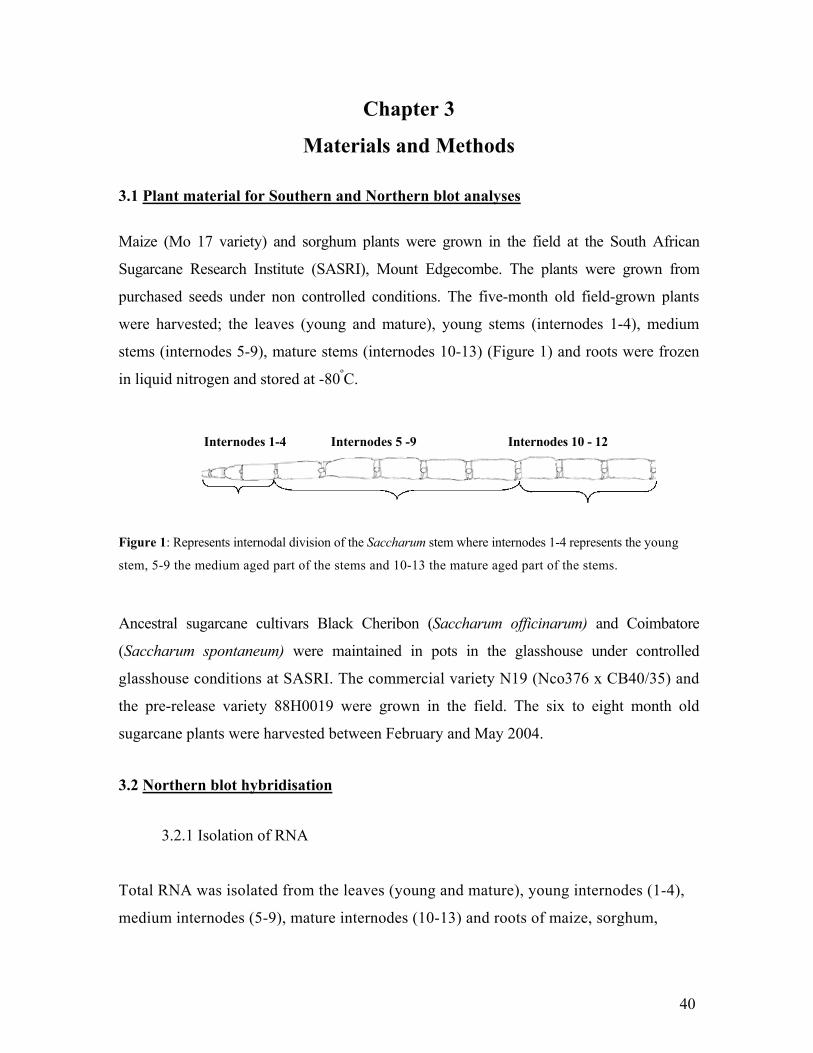
40
Chapter 3
Materials and Methods
3.1 UPlant material for Southern and Northern blot analyses
Maize (Mo 17 variety) and sorghum plants were grown in the field at the South African
Sugarcane Research Institute (SASRI), Mount Edgecombe. The plants were grown from
purchased seeds under non controlled conditions. The five-month old field-grown plants
were harvested; the leaves (young and mature), young stems (internodes 1-4), medium
stems (internodes 5-9), mature stems (internodes 10-13) (Figure 1) and roots were frozen
in liquid nitrogen and stored at -80ºC.
Figure 1: Represents internodal division of the Saccharum stem where internodes 1-4 represents the young
stem, 5-9 the medium aged part of the stems and 10-13 the mature aged part of the stems.
Ancestral sugarcane cultivars Black Cheribon (Saccharum officinarum) and Coimbatore
(Saccharum spontaneum) were maintained in pots in the glasshouse under controlled
glasshouse conditions at SASRI. The commercial variety N19 (Nco376 x CB40/35) and
the pre-release variety 88H0019 were grown in the field. The six to eight month old
sugarcane plants were harvested between February and May 2004.
3.2 UNorthern blot hybridisation
3.2.1 Isolation of RNA
Total RNA was isolated from the leaves (young and mature), young internodes (1-4),
medium internodes (5-9), mature internodes (10-13) and roots of maize, sorghum,
Internodes 1-4 Internodes 5 -9 Internodes 10 - 12

41
N19, 88H0019, Black Cheribon and Coimbatore plants according to Bugos et al. (1995).
Five grams of frozen plant material were ground to a fine powder using a mortar and
pestle. The ground tissue was transferred into centrifuge tubes containing 10 ml of TENS
homogenisation buffer (0.1M Tris-HCl pH7.5, 1mM EDTA, 0.1M NaCl, 1% SDS and 2-
3-mercaptoethanol). One volume of phenol:chloroform:isoamyl alcohol (25:24:1) was
added to the ground tissue and homogenised at high speed for 1-2 minutes. Seven
hundred microlitres of 3M sodium acetate pH 5.2 were added and this was placed on ice
for 15 minutes. The solution was centrifuged at 12 000 x g for 15 minutes at 4°C. The
aqueous phase was transferred into a new centrifuge tube and an equal volume of
isopropanol was added to precipitate the nucleic acids. The solution was incubated at -
70°C for 30 minutes.
The precipitated RNA was recovered by centrifugation at 10 000 x g for 10 minutes. The
pellet was washed with 70% (v/v) ethanol and briefly dried. The pellet was resuspended
in 750 µl deionised water and centrifuged at 10 000 x g for 5 minutes at 4°C. The
supernatant was transferred to a fresh tube and the RNA precipitated overnight at 4°C by
the addition of lithium chloride (LiCl) to a 2M final concentration. The RNA was
recovered by centrifugation at 12 000 x g for 15 minutes at 4°C. The pellet was washed
with 70% (v/v) ethanol and resuspended in 50 µl Diethyl pyrocarbonate (DEPC)-treated
deionised water.
3.2.2 Assessment of RNA concentration, purity and integrity
The concentration of the isolated RNA was determined spectrophotometrically. The
integrity was verified by the presence of the 18S and 28S ribosomal bands after
separation on a 1.2% (w/v) agarose gel and visualised by ethidium bromide staining (0.01
µg/ml) using the AlphaImagerTM 2200 for visualisation. The RNA concentration was
calculated using the equation, (A260*40*Dilution Factor)/1000 (Hillis and Moritz, 1990).

42
3.2.3 Blotting procedure
Ten micrograms of total RNA per sample were denatured in a buffer of the following
composition (20 mM MOPS (pH7.0), 5 mM sodium acetate, 1 mM EDTA, 50% (v/v)
formamide and 2.2 M formaldehyde) at 65°C for 5 minutes and followed by immediate
quenching of the denatured RNA samples on ice. Total RNA (10 µg per lane) was
electrophoretically separated on a 1.2% (w/v) agarose gel and blotted onto a nylon
membrane (Hybond-N+ Amersham Pharmacia Biotech, Inc.) by upward capillary
transfer according to the protocol described by Sambrook and Russell (2001). Following
electrophoresis the RNA was stained for 30 minutes with ethidium bromide (0.01µg/ml)
and visualised. The transfer was carried out overnight in a 10X SSC (1X SSC contains
150 mM NaCl and 15 mM sodium citrate) transfer buffer and the RNA bound to the
nylon membrane by UV cross-linking (Hoefer Scientific Instruments, San Francisco) at
700 microjoules/cm2.
3.3 USouthern blot hybridisation
3.3.1 Isolation of genomic DNA
Genomic DNA was isolated from 3 g frozen leaf material from the sugarcane cultivars,
maize and sorghum using a cetyltrimethylammonium bromide (CTAB) extraction
method (Saghai-Maroof et al., 1984). The frozen leaf tissue material was ground into a
fine powder using a mortar and pestle. Three grams of the ground tissue were added to
10 ml of warm (65°C) CTAB extraction buffer and mixed several times by gentle
inversion. The resulting solution was incubated at 65°C for 1 hour with gentle mixing at
10 minute intervals. The solution was cooled and 5 ml of chloroform:isoamyl alcohol
(24:1) were added with gentle shaking for 5-10 minutes.
The contents were spun in an ultracentrifuge (Beckman AvantiTM J-25I) at 12 000 x g for
10 minutes at room temperature. The aqueous phase was transferred to clean tubes to
which 5 ml of chloroform:isoamyl alcohol (24:1) were added and gently mixed. This was
spun at room temperature for 10 minutes at 12 000 x g. The aqueous phase was transferred

43
to fresh tubes containing pre-boiled Rnase A to a final concentration of 40µg/ml and
mixed by gentle inversion followed by incubation at room temperature for 30 minutes.
Six millilitres of isopropanol were added and the sample gently inverted and spun at 1500 x
g for 10 minutes. The DNA pellet was dried and resuspended in 1 ml TE buffer (10mM
Tris-HCl and 1mM EDTA, pH 8.0). The sample was phenol extracted with 1 ml Tris-
equilibrated phenol (pH 8.0). The aqueous phase was transferred to a fresh tube. The
DNA was precipitated and resuspended in 1 ml TE buffer.
3.3.2 Assessment of DNA concentration, purity and integrity
The isolated DNA was quantified spectrophotometrically and the integrity was verified
by gel electrophoresis on a 1% (w/v) agarose gel. The concentration of the DNA was
determined by recording readings at wavelengths of 260 and 280 nm using a
spectrophotometer. The equation, (A260*50*Dilution Factor)/1000, was used to
calculate the DNA concentration (Hillis and Moritz, 1990).
3.3.3 Blotting procedure
The genomic DNA for each plant was treated separately with each of the restriction
endonucleases, EcoRI, HindIII, XbaI and XhoI (Fermentas). Ten micrograms of genomic
DNA were digested with 10 units of each enzyme in a total reaction volume of 300 µl at
37ºC overnight. The digested DNA was size-fractionated by agarose gel electrophoresis
using a 0.8% (w/v) agarose gel in a 0.5X Tris-borate-EDTA (5X TBE is 445mM Tris
base, 445mM borate and 10mM EDTA) running buffer and visualised by ethidium
bromide staining (0.01 µg/ml) using the AlphaImagerTM 2200 for visualisation. The DNA
was denatured for 1 hour in denaturing solution (2M NaOH and 1.5M NaCl) with
gentle agitation. Thereafter the gel was rinsed in distilled water to remove residual
denaturation solution and submerged in neutralisation buffer (0.5M Tris-HCl and 1.5M
NaCl) with constant shaking for 1 hour. The restricted DNA was transferred to a
positively charged nylon membrane (Hybond-N+ Amersham Pharmacia Biotech, Inc.)
using upward capillary DNA transfer according to Sambrook and Russell (2001) in 10X

44
SSC transfer buffer (1.5M sodium chloride and 150mM sodium citrate).
The nucleic acids were fixed to the moist nylon membrane by UV cross-linking (Hoefer
Scientific Instruments, San Francisco) at a pre-set UV exposure of 700 microjoules/cm2.
Blots were stored dry between Whatman filter paper at 4ºC until required.
3.4 USS gene sequence probe
A partial gene sequence (EST clone, Accession number AW746904) isolated from
sorghum was designated the SS (stem-specific) gene. The stem-specific expression
pattern of this gene allowed for its use in this study. The complete sequence for this gene
is shown in Figure 2.
1 GGCACGAGGATCCATCCCACTCTCAGCTGATCGCTCACTCTTTCAGCTCGATCAGTCTTAGCTCTAGCTC
71 TAGCTAGCCAGCTAGCCAATCCTTCGTGTAGTCGTCATCAGCCTTCTCATCGTCACCAATGGCCACCGCC
141 GAGGTCCAGACCCCGACCGTGGTGGCGACCGAGGAAGCGCCGGTGGTGGAGACCCCGGCGCCGGCCGTCG
211 TGCCCGAGGAGGCTGCCCCCGCCCCCGCCGAGGCTGAGCCGGCCGTGCCAGAGGAGGCTGCCCCCGCCGA
281 GGAGGCCAAGGTGGTGGAGGAGCCAGCTGCCCCGGCGGAGCCCGAGCCTGTCGCCGCTGAGCCTGAGGCC
351 GAGCCTGCCGCCGCGGAGCCGGAGGCGGCACCTGCTGCGGCCGCGGCGGAAGAAGAGGCGCCAAAGGAGG
421 CGGAGCCGGCCGCGGTCGAGGAGGTCAAGGAGGAGGAGGCTGCGGCGCCCGCTGCCGAGACAGAGCCGGC
491 GGCCGCCGAGCCCGAGGCTGCTGCTCCTGCTCCTGCTGCTGCCGAGGAGCCCGCCGCGGCCGAGCCGGCC
561 GCCGAGGAGCCCGAGAAGGCCAGCGAGTGAGGCCTCCTCGGCGGCGGCCAAGGGATCGGAGTGAGATGGC
631 TCATCGTGCGCGCGTACATGCCACGGGCTTTTGCTGTTGAGTACGCTACGGTTACTGGCGTTTCTCTACG
701 TACCTAGCAGTGGCTGTGCGCGTGGACTGTCCGGTGCGGACTGCGAGTGACGTGGGCTAAATAAAGTGAG
771 GGTCGTGTTCGTGTGGCGGGGGGAAGTGGGGCCCGGTGTCAGTGGCGCGGTGCCCCATGGCCTGCCACTG
841 CAGCTTGTGTGTCCTTTTGTGTTGTGTTGGTTCCTGTTCTGTGTTCTCTGTCTATCTATGCTCATGTATG
911 TAATGGCAGTTTGGGTATGATGAGTATCAAGCATGTCTGCATTCTCGTCTTCTTTGGTTAAAAAA
Figure 2: Nucleotide sequence of the cDNA clone (SS gene) used in this study for the isolation of
corresponding promoter regions from maize and sorghum.

45
3.4.1 Isolation and purification of plasmid DNA
The Sorghum bicolor cDNA clone in a pBluescript SK(-) plasmid vector was grown in
TOP10F’ Escherichia coli cells. The bacterial cells were grown in Luria Bertani (LB)
broth (bacto-tryptone (10 g/l), yeast extract (5 g/l), NaCl (10mg/l) and ampicillin
(100µg/ml) at pH 7.5) at 37°C overnight. The plasmid DNA was purified using a
Nucleobond AX100 kit (Macherey-Nagel, Germany) and stored at -20°C.
3.4.2 Isolation of the insert clone DNA
The cDNA clone sequence was used to probe Northern and Southern blots. The insert
was isolated from the plasmid construct by digestion with the restriction endonuclease
PstI (Fermentas) to release a 975 base pair DNA fragment. The digested plasmid was
separated on a 0.8% agarose gel and the band corresponding to the insert size was
excised. A Qiagen gel extraction kit (Qiagen, Hilden, Germany) was used to purify the
DNA from the gel as described by the protocol provided by the manufacturer.
3.4.3 Quantification of the purified insert DNA
The purified insert DNA was separated on a 1% (w/v) agarose gel. Molecular weight
marker (EL marker – pEmuLuc restricted with PglII, PvuII and BamHI) was used for
visual estimation of the DNA concentration and verification of band sizes.
3.4.4 Radioactive labeling of the DNA fragment
A MegaprimeTM DNA labeling systems kit (Amersham Biosciences) was used to
radioactively label 25 ng of purified DNA with α-[32P]dCTP (220 Tbq/mmol; Amersham
Biosciences). Twenty-five nanograms of template DNA dissolved in deionised water
were placed in a microcentrifuge tube, 5 µl primer solution (Random nanomer primers in
an aqueous solution) and the appropriate volume of water were added to give a total final
volume of 50 µl. The reaction mix was denatured at 100°C for 5 minutes, followed by
immediate cooling on ice. Five microlitres labeling buffer (dATP, dGTP and dTTP in

46
Tris/HCl pH7.5, 2-mercaptoethanol and MgCl2) were added. Three microlitres of α-
[32P]dCTP were added to the mix, followed by the addition of one unit DNA polymerase 1
Klenow fragment (Fermentas). The solution was gently mixed. This was spun for a few
seconds in a microcentrifuge and thereafter incubated at 37°C for 1 hour.
3.4.4.1 Probe purification and denaturation
The labeled probe was purified using a QIAquick PCR Purification kit (Qiagen, Hilden,
Germany) to remove unincorporated nucleotides. The purification was carried out
according to the protocol provided by the manufacturer and the labeled DNA fragments
were eluted in 100 µl elution buffer (10mM Tris-HCl pH8.5). The eluted labeled probe
was transferred to a fresh tube and denatured at 100°C followed by immediate chilling on
ice for 2 minutes prior to hybridisation.
3.5 UPrehybridisation and hybridization
The modified Church and Gilbert hybridisation buffer (0.5M phosphate buffer pH7.2, 7%
(w/v) SDS and 10mM EDTA) (Church and Gilbert, 1984) was used for the
prehybridisation of the membranes for a period of 6 to 8 hours at 65°C. The
prehybridisation buffer was preheated to 65°C and 30 ml added to a 300 ml hybridisation
bottle (HybaidTM). To this volume 300 µl of 10 mg/ml denatured herring sperm DNA
was added as a blocking agent to minimize non-specific hybridisation. The herring
sperm DNA was denatured by boiling for 5 minutes and cooled on ice. The blots were
pre-wet in 0.5M phosphate buffer pH7.2 before being placed in the hybridisation bottles.
After prehybridisation in a rotating oven, the labeled probe was added directly to the
bottle. Hybridisation was carried out for 16 to 18 hours at 65°C. Following hybridisation
the radioactive solution was removed from the bottles. The membranes were washed twice
with a medium stringency wash solution (1XSSC, 0.1% SDS) at 65°C for 10 minutes.

47
3.5.1 Image analysis
The membranes were placed in a HypercassetteTM (Amersham, Life Sciences) and
exposed to phosphor screens (CycloneTM) overnight. The phosphor screens were scanned
using the CycloneTM Storage Phosphor System (Packard BioScience). The image was
viewed using the OptiQuantTM Image Analysis software.
3.6 UScreening of the libraries
3.6.1 Maize Genomic Library
The bacterial host strain used was XLI-Blue MRA’ (P2). A single colony was grown in
LB broth in a sterile Erlenmeyer flask supplemented with 0.2 % (w/v) maltose and 10mM
magnesium sulfate (MgSO4) at 37ºC with vigorous shaking (250 rpm) for 4-5 hours. The
optical density (OD) was monitored during the course of the bacterial growth. The OD
was measured using the spectrophotometer (Beckman DU® 7500, USA) at 600 nm, the
ideal OD of the bacteria should be between 0.8 and 1.
The bacteria were centrifuged at 1000 x g for 10 minutes. The pellet was gently
resuspended in 10 ml of 10mM MgSO4 and diluted to an OD600 of 0.5 with 10 mM
MgSO4 prior to use.
3.6.1.1 Plating the maize genomic library
The Lambda library has an estimated titre of 1.0x 10⁶ pfu/ml (Lambda Library User
Manual, Stratagene). Titre estimation at the outset is critical since the number of clones
to be screened must be pre-determined. Also the maximum number of clones would
provide a good representation of the maize genome for screening thus increasing the
probability of locating the desired clones. It must be noted that clones in the library are
not unique and therefore screening a large number of clones is also vital in ensuring
isolated clones are unique. To obtain single plaque purity three rounds of screening were
48
required and each round of screening is carried out by hybridisation analysis.
The Zea mays genomic library was purchased from Stratagene® and stored at -80°C.
From an estimated 1.0x 10⁶ pfu/ml in the maize genomic library, 280 000 pfu were plated
over 10 agar plates with a lawn of bacterial cells, with approximately 28 000 plaque
forming units per plate since between 20 000-30 000 plaque forming units is ideal for a
plate size of 150mm2.
Six-hundred microlitres 0.5OD bacterial host cells were mixed with 28 000 plaque
forming units and incubated at 37°C for 15 minutes. Five milliliters of NZY Top agar at
48°C (NaCl (5 g/l), MgSO4.7H2O (2 g/l), yeast extract (5 g/l), amine (casein hydrolysate)
(10 g/l) and agarose (7 g/l)) were mixed with the phage-infected bacteria and thereafter
poured immediately onto 10 NZY agar plates (NaCl (5 g/l), MgSO4.7H2O (2 g/l), yeast
extract (5 g/l), NZ amine (casein hydrolysate) (10 g/l) and agar (15 g/l). The agar was
allowed to solidify for 10 minutes and incubated at 37°C.
3.6.1.2 Plaque lifts
After individual plaques were visible, the plates were chilled at 4°C overnight. The
plaques were transferred onto the nylon membranes by placing the membranes on the
agar surface for 1 minute and for duplicate lifts 2 minutes. The phage DNA was
denatured on filter paper pre-soaked with denaturation solution (1.5M NaCl and 0.5M
NaOH) for 5 minutes. This was followed by neutralisation of the membranes on filters
soaked with neutralisation buffer (1.5M NaCl and 0.5M Tris-HCl pH8.0) for 5 minutes.
The membranes were washed in 2X SSC to remove cellular debris followed by UV cross-
linking at 700 microjoules/cm2. The agar plates were stored at 4°C for use after
screening.
The positive plaques were located on the agar plates following primary screening by
alignment of the autoradiograph film to the corresponding plates and a small plug
(diameter ~2-3mm) of agarose and agar from around each positive plaque was cored.

49
Each plug taken with this diameter was estimated to contain between 5-10 plaques of
which each plaque has approximately 1x10⁶ pfu. Using this estimation a dilution series
was prepared of the plaques to titre the total number of plaques in each agar plug placed
in 500 µl SM buffer (100 mM NaCl, 8 mM MgSO4.7H2O, 50 mM Tris-HCl (pH 7.5) and
0.01% (w/v) gelatin). The estimated titre per agar plug assuming each plug contained ten
plaques is 10x 106 pfu/plug, this was used as the basis on which to calculate the dilution
factor required to obtain 100 pfu/20µ/ for spotting onto a bacterial lawn to obtain well
separated plaques on the agar plates. Twenty thousand plaques were mixed with 100 µl
SM buffer and 1 µl of this was used in a 1:50, 1:75 and 1:100 dilution. The number of
plaques counted from each dilution gave the titre for each agar plug (Table 4) and this
was used to calculate a dilution factor to obtain 100 pfu/20µl for spotting onto an agar
plate.
3.6.1.3 Screening of the maize genomic library
The maize blots were screened according to the hybridisation protocol obtained from the
Clemson University Genomics Institute (3.5 and 3.5.1). The probed membranes were
exposed to phosphor screens and visualised using the CycloneTM Storage Phosphor
System (Packard BioScience). Plaques that showed a strong hybridisation signal were
plugged out and transferred to 500 µl SM buffer with 20 µl chloroform. The agar plugs
were stored at 4°C to allow the phage to diffuse out of the agar plug into the SM buffer.
A dilution series was prepared and a dilution containing ±53 pfu was spotted onto a
bacterial lawn. The spots were dried and the agar plates incubated at 37°C overnight.
Secondary and tertiary plaque lifts were carried out in order to obtain a single positive
plaque that displayed a strong hybridisation signal.
3.6.2 Bacterial Artificial Chromosome library
A Sorghum bicolor Bacterial Artificial Chromosome (BAC) library arrayed on
membranes was purchased from Clemson University Genomics Institute. The
50
membranes were screened with the radioactively labelled SS gene sequence according to
hybridisation and wash protocols provided by Clemson University. The screened BAC
library filters were exposed to high performance autoradiography film (HyperfilmTM MP;
Amersham Biosciences) and autoradiography was carried out for a period of 2 weeks at -
80°C.
3.6.2.1 Identification of addresses for hybridising clones
X-rays were aligned to a grid and addresses were allocated to the strongly hybridised
clones using the addressing system provided and the clones were ordered. The filter
membranes are sub-divided into six fields (Figure 10) and each field contains 384
squares. The 384 squares represent the row and column identification of the BAC.
Within each square there are 16 positions where eight clones are spotted in duplicate.
The pattern of the spotted clones was used to generate the plate address of the BAC.
3.7 UIsolation of Lambda genomic DNA
Lambda DNA was isolated using protocols modified from Sambrook and Russell (2001).
Six plates were prepared for each isolated phage. Six-hundred microlitres of 0.5 OD
bacterial host cells were infected with 20 µl phage (±50 000 pfu) and incubated for 15
minutes at 37°C. The infected bacterial cells were mixed with top agar and poured
immediately onto NZY agar plates. The plates were incubated overnight at 37°C. Ten
milliliters of SM buffer were poured onto the NZY plates and left at 4°C overnight to
allow the diffusion of the phage from the agar into the SM buffer. The bacteriophage
suspension from each plate was recovered and pooled into a sterile tube. An additional 5
ml SM buffer was used to further wash and remove the residual bacteriophage. Five
milliliters of chloroform were mixed with the phage stock. This was centrifuged at 11
000 x g for 5 minutes and RNaseI (Fermentas) was added to the supernatant to a final
concentration of 1µg/ml followed by incubation at room temperature for 30 minutes.
NaCl (2.6 g/50 ml supernatant) was added to the phage supernatant and incubated on ice
for 1 hour. The solution was spun at 11 000 x g for 10 minutes to remove the cellular

51
debris of the bacteria. Polyethylene glycol (PEG) 8000 (4.5 g/50 ml supernatant) was
added to the phage supernatant and kept on ice for 30 minutes. This solution was
centrifuged at 11 000 x g for 10 minutes. The bacteriophage pellet was resuspended in
10 mls SM buffer and one volume of chloroform added. The resulting solution was
centrifuged at 3 000 x g for 15 minutes. The supernatant was removed and a
phenol/chloroform extraction was performed. One volume of isopropanol was added to
the supernatant and incubated overnight at -20°C. This was spun at 11 000 x g for 10
minutes and the pellet was washed with 80% (v/v) ethanol and air dried. The washed
pellet was resuspended in 500 µl deionised water.
3.7.1 Isolation of plasmid DNA
The BAC clones were streaked onto LB plates supplemented with chloramphenicol
(Roche, Diagnostics, Mannheim, Germany) to a final concentration of 20 µg/µl. The
plates were incubated overnight at 37°C. Fifty milliliters of Terrific broth (Bacto
tryptone (12 g/l), Bacto yeast extract (24 g/l), 0.4% (v/v) glycerol) were inoculated with a
single bacterial colony for each clone. This was grown to saturation overnight at 37°C
after which 1.5 ml of bacterial culture was pelleted by centrifugation at maximum speed
for 20 seconds. The BAC plasmid DNA was isolated according to an alkaline lysis
procedure described by Birnboim and Doly, 1979. The pellet was resuspended in 100 µl
Glucose/Tris/EDTA (GTE), (50mM glucose, 25mM Tris-HCl pH8.0 and 10mM EDTA)
solution and allowed to stand for 5 minutes at room temperature. Two-hundred
microlitres NaOH/SDS (0.2M NaOH and 1% (w/v) SDS) solution were added to the
resuspended mixture and kept on ice for 5 minutes. One hundred and fifty microlitres of
3M potassium acetate solution were added to the lysed bacterial solution. This was
placed on ice for 5 minutes and thereafter spun for 10 minutes at maximum speed to
pellet the cell debris and chromosomal DNA.
The supernatant was transferred to a clean tube and mixed with 0.8 ml 95% (v/v) ethanol.
This was allowed to stand for 2 minutes at room temperature to precipitate the nucleic
acids followed by centrifugation for 1 minute at room temperature to pellet the plasmid
DNA and RNA. The supernatant was poured off and the pellet washed with 1 ml 70%
52
(v/v) ethanol and dried. The pelleted plasmid DNA was resuspended in 25 µl deionised
water and stored at -20°C.
3.8 UInvestigation of the isolated clones from both libraries
3.8.1 Agarose gel separation and Southern blot analysis of Lambda and BAC
DNA fragments
Southern blot analysis was performed on the restricted isolated clones from both libraries
to obtain fragments that were of a suitable size range for cloning into a plasmid vector.
Five micrograms of the isolated lambda DNA from the maize genomic library clones
were digested with a range of restriction enzymes (HindIII, EcoRI, PstI and XbaI). Five
micrograms of the isolated plasmid DNA from the Sorghum bicolor BAC library clones
were digested using various restriction enzymes (Eco01091, HindIII, XbaI and XhoI).
The restricted DNA fragments were electrophoretically separated in a 0.8% (w/v) agarose
gel and fragments sizes were obtained by comparing to the EL marker. Prior to blotting,
the restricted DNA was viewed after ethidium bromide staining (0.01 µg/ml) using the
AlphaImagerTM 2200 (Alpha Innotech corporation). The restricted DNA was transferred to
a positively charged nylon membrane (refer to section 3.2.3).
3.8.2 Cloning of isolated DNA fragments and bacterial transformation
The plasmid DNA pBluescript SK(-) was isolated using a QIAprep® Miniprep kit
(Qiagen, Hilden, Germany) and linearised with the respective enzyme. The enzyme was
inactivated at 65°C for 30 minutes followed by desphosphorylation with 1 unit shrimp
alkaline phosphatase (Fermentas) and 2µl 10x shrimp alkaline phosphatase
desphosphorylation buffer (0.1M Tris-HCl pH7.5, 0.1M Mg Cl2) (Fermentas, USA).
This was incubated at 37°C for 1 hour and the phosphatase was inactivated by heating at
65°C for 30 minutes.
Two micrograms of lambda DNA and plasmid DNA were digested with the respective
enzyme in a reaction volume of 30 µl with 2 units of restriction enzyme and incubated
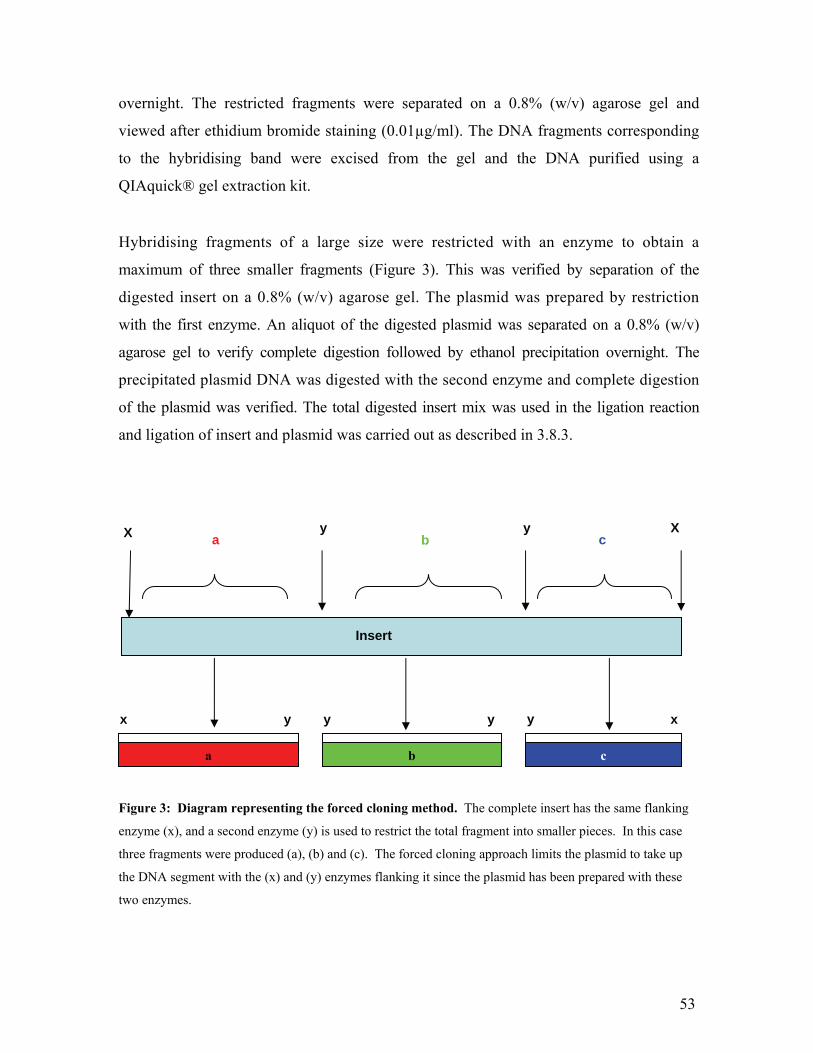
53
overnight. The restricted fragments were separated on a 0.8% (w/v) agarose gel and
viewed after ethidium bromide staining (0.01µg/ml). The DNA fragments corresponding
to the hybridising band were excised from the gel and the DNA purified using a
QIAquick® gel extraction kit.
Hybridising fragments of a large size were restricted with an enzyme to obtain a
maximum of three smaller fragments (Figure 3). This was verified by separation of the
digested insert on a 0.8% (w/v) agarose gel. The plasmid was prepared by restriction
with the first enzyme. An aliquot of the digested plasmid was separated on a 0.8% (w/v)
agarose gel to verify complete digestion followed by ethanol precipitation overnight. The
precipitated plasmid DNA was digested with the second enzyme and complete digestion
of the plasmid was verified. The total digested insert mix was used in the ligation reaction
and ligation of insert and plasmid was carried out as described in 3.8.3.
Figure 3: Diagram representing the forced cloning method. The complete insert has the same flanking
enzyme (x), and a second enzyme (y) is used to restrict the total fragment into smaller pieces. In this case
three fragments were produced (a), (b) and (c). The forced cloning approach limits the plasmid to take up
the DNA segment with the (x) and (y) enzymes flanking it since the plasmid has been prepared with these
two enzymes.
y
Insert
X X y a b
x x y
c
y y
a b c
y

54
Ligation was carried out as described by Sambrook and Russell (2001). The ligation was
carried out in a reaction volume of 20 µl consisting of 100 ng insert DNA, 50 ng
linearised and dephosphorylated plasmid DNA, 5 µl 10X ligation buffer (100 µl of
400mM Tris-HCl , 100mM MgCl2, 100mM DTT and 5mM ATP pH7.8), 1 unit T4 DNA
ligase and deionised water overnight at 4°C. The ligation mix was heated at 65°C for 10
minutes to inactivate the T4 DNA ligase.
3.8.3 Transformation of the Escherichia coli cells
Transformation was carried out as described by Sambrook and Russell (2001). Two
microlitres of ligated plasmid were gently mixed with 50 µl competent TOP10F’
Escherichia coli cells (Invitrogen) and kept on ice for 10 minutes. This mixture was
transferred to pre-chilled cuvettes (BioRad) and electroporated using a Micropulser
(BioRad). Immediately after electroporation the cells were mixed with 450 µl LB broth
and transferred to clean tubes to be shaken at 240 rpm for 1 hour at 37°C.
The transformation mix (100µl) was plated onto LB agar plates supplemented with 5-
Bromo-4chloro-3-indolyl-3-D-galactopyranoside (X-gal) (40 µg/ml)) (Roche
Diagnostics, Mannheim, Germany), 0.5mM Isopropyl-3-D-thiogalactoside (IPTG)
(Roche Diagnostics, Mannheim, Germany) and ampicillin (100 µg/ml) (Roche
Diagnostics, Mannheim, Germany). The white colonies were transferred onto fresh LB
agar plates supplemented with X-gal, IPTG and ampicillin. Location was determined
using a grid reference. Duplicate plates were also prepared.
3.8.3.1 Colony lifts and hybridisation
The colonies from the plates were transferred onto nylon membranes (Hybond-N+) as
described by Sambrook and Russell (2001). The nylon membranes were placed directly
over the agar surface and the transfer was allowed to proceed for 2 minutes. The plasmid
DNA was denatured following neutralisation as described in section 3.6.1.3. The
membranes were allowed to air dry on Whatman filter paper for 30 minutes before UV
cross-linking at 700 microjoules/cm2 using the UV cross-linker.
55
The colony lifts were screened using the hybridisation and wash procedure carried out in
section 3.5. The membranes were probed with a α-[32P]dCTP labeled SS gene sequence
as described by the MegaprimeTM DNA labeling systems kit (Amersham Biosciences).
The blots were exposed to phosphor screens for 1 hour before viewing.
3.9 UPlasmid DNA isolation and assessment of concentration and purity
The hybridising colonies were selected from the master plates and used to inoculate 3 ml
of LB broth supplemented with ampicillin (100 µg/ml). The bacterial cultures were
shaken at 250 rpm overnight at 37°C. The plasmid DNA was purified using a
Nucleobond AX100 kit (Macherey-Nagel, Germany) from 6 ml of overnight bacterial
culture and eluted in 50 µl deionised water. The concentration was assessed as described
in section 3.4.3.
3.10 UDNA Sequence analysis
3.10.1 Polymerase chain reaction (PCR)
The cloned fragments were amplified and sequenced using the BigDye® Terminator
V3.1 Cycle sequencing Kit (Applied Biosystems, Foster City, CA) as instructed by the
manufacturer. The 20 µl reaction mixture was composed of the following: DNA
template (200 ng), either M13Forward- (AACGACGGCCAGTGAATT) or
M13Reverse- (GGAAACAGCTATGACCATGAT) primer (3.2 pmol of each primer), 2
µl 5X BigDye Sequencing Buffer, 2 µl 2.5X Ready Reaction mix and sequencing-quality
water made to the final reaction volume. Amplification conditions consisted of initial
denaturation (96°C for 1 min) followed by 25 cycles (96°C for 10 sec, 50°C for 5 sec and
60°C for 4 min) and a rapid thermal ramp to 4°C in a thermal cycler (GeneAmp® PCR
Systems 9700, Applied Biosystems).
The amplified DNA was precipitated using the protocol provided by the manufacturer.
Five microlitres of EDTA pH8.0 (125mM) and 60 µl of 100% (v/v) ethanol were added
to the PCR mix and left at room temperature for 15 minutes. This was centrifuged at
56
maximum speed for 20 minutes to pellet the DNA. The pelleted DNA was washed with
60 µl 70% (v/v) ethanol and spun at maximum speed for 20 minutes. The pellet was air
dried for 5 minutes and resuspended in 20 µl template suppression reagent (BigDye ®
Terminator v3.1 Cycle sequencing kit; Applied Biosystems). The resuspended DNA was
denatured by boiling for 2 minutes and then cooled on ice. Sequencing was performed on
an ABI PrismTM 310 Genetic Analyser (Applied Biosystems, Foster City, CA).
3.10.2 Sequence analysis
Sequences were edited using a biological sequence alignment program BioEdit (T.A.
Hall Software) and used for homology searches on the GenBank database using the
BLAST algorithm of the National Centre for Biotechnology Information (NCBI).
Restriction maps were constructed for each clone using the restriction map function in
BioEdit (T.A. Hall Software). Religations of the plasmid were carried out by restriction
with specific enzymes to obtain the complete sequence. Transformation was carried out
as shown in section 3.8.3 Single colonies were picked and grown in LB broth and
plasmid isolation was carried out using a Nucleobond AX100 kit. The religated plasmid
vectors were sequenced as described in section 3.10.1.
3.11 UPromoter analyses
A BLAST search was carried on the complete sequence (4500 bp) to determine the
location of the SS gene sequence. To identify preliminary proximal promoter regions
which included the TATA-box as well as a putative transcriptional start site, the genomic
clone sequence was analysed by promoter prediction database software, Neural Network
Promoter Prediction (NNPP, HUhttp://www.fruitfly.org/seqtools/promoter.html)UH (Rees and
Eeckman, 1995). A BLAST search was carried out using the identified putative promoter
region from the NNPP software and maize EST clones in the database. This was carried
out to confirm that the coding region of the SS gene sequence was after the putative
transcriptional start site.
The Plant Cis-acting Regulatory DNA Elements (PLACE)

57
U( UHUhttp://www.dna.affrc.go.jp/htdocs/PLACE) UH (Higo et al., 1998) motif database was
used to identify cis-acting regulatory DNA elements. This database contains motifs found
in vascular plants only. All sequence similarity search and alignment analyses were
conducted using BLAST: HUhttp://www.ncbi.nlm.nih.gov/blast/UH (Altschul et al., 1990),
DNAssist and BioEdit.
3.12 UPCR amplification of fragments for cloning into the GUS vector
To clone the genomic sequence immediately upstream of the coding region in the maize
genomic clone, primers were designed to carry out polymerase chain reaction (PCR).
Based on the sequence obtained, primers were designed to amplify two regions, (i) the
promoter region and (ii) the promoter region with the intron. Restriction sites SacII and
SpeI were incorporated at the 5' end of the forward and reverse primers (Table 1)
respectively. This was done by PCR amplification of the cloned promoter fragments with
primers containing the respective restriction sites.
Table 1: Sequences and positions of PCR primers for cloning (i) Promoter and (ii) Promoter and
intron regions into the GUS plasmid. The positions of the 5' end where +1 is the start of the coding
region, the corresponding PCR fragment sizes and the regions to be amplified are indicated. The 5'
spacer sequences are shown in lowercase.
a restriction site underlined b SpeI restriction site underlined
The genomic DNA fragments were amplified in a 50 µl reaction solution containing 10
ng of genomic DNA and final concentration of primers (10µM), dNTPs and MgCl2 at 0.2
µM, 40 µM, 3.5 mM respectively. Five microlitres of 10X PCR buffer and 1unit Taq
polymerase were added to the PCR. Amplification conditions consisted of initial
denaturation (96°C for 2 min) followed by 35 cycles (94°C for 1 min, 55°C for 30 sec and
72°C for 3 min), a final extension at 72°C for 4 min and a rapid thermal ramp to 4°C in a
Primer
designed
Primer Sequence (5′-3′) Position of
5′ end
Region
amplified
Fragment
size (bp)
ZM51F2 aa UCCGCGGUGCCTGATATCTG a -2378
ZM51R2 ttUACTAGTUGTCTGGACCTGCACAC b +423 Promoter and
intron
2815
ZM51R3 UACTAGTUATGAGAAGGCTGATGG b +128 Promoter 3183

58
thermal cycler (GeneAmp® PCR Systems 9700, Applied Biosystems). The amplified
fragments were digested with SacII and SpeI to facilitate cloning into a GUS plasmid
prepared with SacII and SpeI.
The amplified fragments with the flanking SacII and SpeI sites were cloned into the
pBScript vector restricted with SacII and SpeI to confirm that the restriction sites were
intact. The cloned PCR fragments were cleaved from pBluescript and cloned inframe with
the GUS gene in the expression vector pBScr-GUS000. Ligation was carried out as
described by Sambrook and Russell (2001). The constructs were subjected to restriction
analyses using the enzymes SacII and SpeI.

59
Chapter 4
Results
4.1 UIntroduction
A partial gene sequence (EST clone, Accession number AW746904) (975bp)
isolated from sorghum was used in this study. This gene sequence had been
observed previously to display a stem-specific expression pattern and was
designated SS. To date the SS (stem-specific) source gene has an undescribed
function. At the outset of this project it was necessary to undertake a preliminary study
to verify the expression pattern of this stem-specific gene sequence in maize (Zea
mays), sorghum (Sorghum bicolor) and two ancestral sugarcane cultivars Coimbatore
(Saccharum spontaneum) and Black Cheribon (Saccharum officinarum), the commercial
sugarcane hybrid variety N19 and a pre-release sugarcane variety 88H0019 (Section
4.3)
The copy number of the gene was important to the study since a high copy number gene
implies numerous genes with similar sequences encoding similar protein
families, making the analysis of tissue-specific promoters difficult. Evolutionary
modification in gene family sequences over time may render some genes inactive.
This does not necessarily imply that the promoter driving the gene is inactive but chances
are high that changes have occurred in the promoter as well. Therefore for high
copy number genes the probability of isolating inactive promoters is greater, thus
favouring the use of a low copy number gene in this project.
The overall approach for this project involved the use of two non-sugarcane grass
species, maize and sorghum, as sources of the corresponding promoters of the SS
gene sequence. A maize Lambda genomic library and a sorghum Bacterial Artificial
Chromosome (BAC) library were screened with the SS gene sequence as the first step
in isolating the upstream promoter regions.
The maize genomic library purchased from Stratagene uses the Lambda FIX II vector
and the host strains XL1-Blue MRA and XL1-Blue MRA (P2). A total of 280
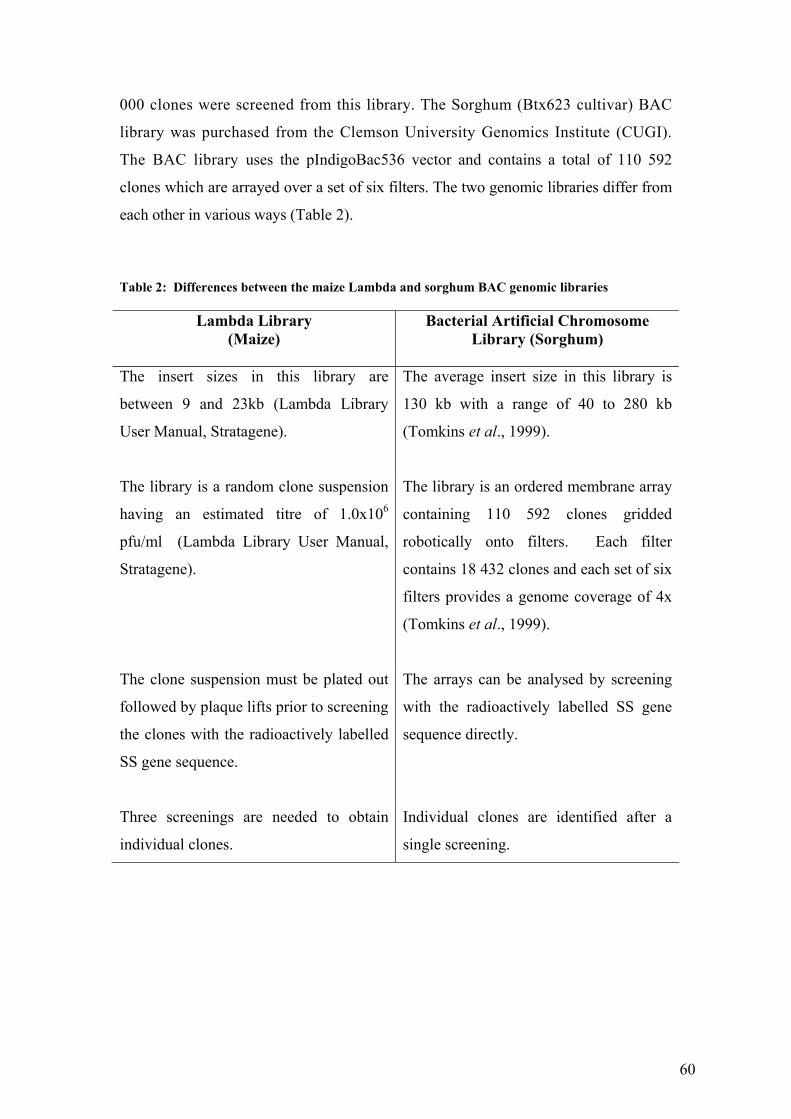
60
000 clones were screened from this library. The Sorghum (Btx623 cultivar) BAC
library was purchased from the Clemson University Genomics Institute (CUGI).
The BAC library uses the pIndigoBac536 vector and contains a total of 110 592
clones which are arrayed over a set of six filters. The two genomic libraries differ from
each other in various ways (Table 2).
Table 2: Differences between the maize Lambda and sorghum BAC genomic libraries
Lambda Library (Maize)
Bacterial Artificial Chromosome Library (Sorghum)
The insert sizes in this library are
between 9 and 23kb (Lambda Library
User Manual, Stratagene).
The average insert size in this library is
130 kb with a range of 40 to 280 kb
(Tomkins et al., 1999).
The library is a random clone suspension
having an estimated titre of 1.0x10⁶
pfu/ml (Lambda Library User Manual,
Stratagene).
The library is an ordered membrane array
containing 110 592 clones gridded
robotically onto filters. Each filter
contains 18 432 clones and each set of six
filters provides a genome coverage of 4x
(Tomkins et al., 1999).
The clone suspension must be plated out
followed by plaque lifts prior to screening
the clones with the radioactively labelled
SS gene sequence.
The arrays can be analysed by screening
with the radioactively labelled SS gene
sequence directly.
Three screenings are needed to obtain
individual clones.
Individual clones are identified after a
single screening.

61
The maize Lambda and sorghum BAC library were screened using the SS gene
sequence. The clones identified were large DNA fragments that could not be sub-cloned
into a plasmid vector hence restriction analysis was implemented to obtain smaller
fragments. Restricted fragments containing the SS gene sequence were identified
using Southern blot analysis and cloned into pBluescript. Sequence analysis was
carried out on the cloned fragments and these sequences were aligned to the SS gene
sequence to determine if the upstream regulatory region was contained within the
fragment.
Physical maps of the cloned DNA sequences were constructed to facilitate sequencing
and the location of the promoter and intron regions. Primers were designed to
amplify the promoter and promoter and intron regions respectively using
polymerase chain reaction (PCR). The amplified fragments were fused transciptionally
inframe to a β-glucuronidase (GUS) reporter gene in a test vector (pBScr-GUS000) for
direct delivery into the plant. It was envisaged that the plasmid constructs would be used
in the future to generate stable transformants in which the isolated promoter activity
could be evaluated in sugarcane using both quantitative and qualitative analysis.
4.2 UTissue-specific expression of the SS gene sequence in sugarcane, maize and sorghum
4.2.1 Quality of isolated RNA
The isolation of clean intact RNA from plant material is essential for experiments
involving Northern blot analysis. Total RNA was isolated from young and mature
leaves, immature internodes (internodes 1-4), maturing internodes (internodes 5-9),
mature internodes (internodes 10-12) and roots of maize, sorghum and four sugarcane
cultivars, Black Cheribon, Coimbatore, N19 and 88H0019 as described in chapter 3.
The difficulty in RNA isolation is its easily degradable nature by RNases (Strommer
et al., 1993). Figure 4 shows intact total RNA run on a 1.2% agarose gel with
clear

62
separation of the two abundant species of eukaryotic RNA, the 28S rRNA (approximately
5kb) and 18S rRNA (approximately 2kb) (Hillis and Davis, 1986).
Figure 4: Agarose gel electrophoresis separation of typical total RNA (10 µg per lane). (A) Total
RNA isolated from young leaves of maize (Zm), sorghum (Sb), N19, 88H0019 (88H), Coimbatore
(Coim) and Black Cheribon (Cher). (B) Total RNA isolated from young (Ly) and mature (Lm) leaves,
immature (S1-4), maturing (S5-9) and mature (S10-12) stems and roots (R) of sugarcane. The total
RNA was separated electrophoretically on a 1.2% agarose gel and visualized using ethidium bromide
staining.
28S rRNA
18S rRNA
Chloroplast RNA
Zm Sb N19 88H Coim Cher
Sugarcane
28S rRNA
18S rRNA Chloroplast RNA
Internodes 1-4 Internodes 5 -9 Internodes 10 - 12
Top of sugarcane stem
Ly Lm S1-4 S5-9 S10-12 R
(A)
(B)

63
The respective ribosomal bands were sharp with no smearing observed on the stained
gel. This was indicative of high quality RNA undergoing no degradation during
preparation. The banding pattern of the ribosomal bands showed a typical profile for
RNA isolated from stems and roots with the 28S rRNA and 18S rRNA subunit. Leaf
RNA showed a typical banding pattern which included the 28S rRNA and 18S rRNA
subunit and the additional chloroplast RNA bands.
4.2.2 Northern analysis
In order to confirm the expression pattern of the SS gene sequence, Northern blot
analysis was carried out. Figure 5 shows results of Northern analysis demonstrating the
hybridisation of the sorghum SS gene sequence to total RNA isolated from immature,
maturing and mature stems of maize, sorghum, N19, 88H0019, Black Cheribon and
Coimbatore.
The results show that the SS gene sequence was not expressed in the leaves of maize,
sorghum or the sugarcane cultivars. The prominent expression of the SS gene is
observed only in the stems of the sugarcane hybrids N19 and 88H0019. Sorghum also
shows high expression levels of the SS gene in the stems only. This therefore confirms
the tissue specific expression pattern of this gene. The patterns of expression in the two
ancestral Saccharum species vary greatly from each other, even though they are largely
stem specific. Black Cheribon shows SS gene expression only in the young stems
while Coimbatore shows expression in all the stem tissues as well as in the roots.
The expression of this gene other than in the stems was only observed in the roots
of maize and Coimbatore but to a lesser degree in maize. The results from this Northern
analysis provided a foundation substantiating the use of this sorghum gene sequence
showing stem-specific expression for the isolation of corresponding stem-specific
promoters from maize and sorghum. Furthermore, is shows the presence of homologous
sequences in the tested plants.

64
LY LM S1-4 S5-9 S10-12 R
Plant Source
Maize
Sorghum
N19
88H0019
Coimbatore
Black Cheribon
Figure 5: Northern blots of total RNA illustrating the tissue-specific expression pattern of the SS
gene sequence in maize, sorghum, N19, 88H0019, Coimbatore and Black Cheribon. Lanes
contained total RNA (10µg) from young (Ly) and mature (Lm) leaves, immature (S1-4), maturing
(S5-9) and mature (S10-12) stems and roots (R) of maize, sorghum and four sugarcane cultivars,
N19, 88H0019, Coimbatore and Black Cheribon. The isolated RNA was denatured and
electrophoretically separated on a 1.2% agarose gel followed by Northern blotting using the
radioactively labeled SS gene sequence as the probe.

65
4.3 USS gene copy number in sugarcane, maize and sorghum
4.3.1 Quality of isolated DNA
The isolation of high quality DNA from the plant material was essential for the
preparation of Southern blots. Figure 6 shows the quality and purity of genomic DNA
isolated from maize, sorghum, N19, 88H0019, Coimbatore and Black Cheribon. The
genomic DNA was observed as a sharp distinct band of high molecular weight with no
smearing. This was indicative of minimal degradation. Quantities of isolated genomic
DNA were measured by spectrophotometric analysis. Total yield of DNA from 5 g plant
material was in the range of 450 and 750 µg.
Figure 6: Agarose gel electrophoretic analysis of genomic DNA. Genomic DNA from Zea mays (Zm),
Sorghum bicolor (Sb), N19, 88H0019, Coimbatore (Coim) and Black Cheribon (Cher) were analysed
on a 1% agarose gel followed by visualisation by ethidium bromide staining. The size range of the
molecular weight marker used (MW) is shown on the left.
4.3.2 Genomic Southern blot analysis
Genomic Southern blot analysis was performed to investigate the copy number of the
SS gene sequence in maize, sorghum and the four sugarcane cultivars (N 19,
88H0019, Coimbatore and Black Cheribon). This was significant in assessing the
SS genes suitability for isolating corresponding promoters (Section 4.1).
5412 bp 3857 bp 2840 bp 2248 bp 1594 bp 1317 bp 954 bp 620 bp 373 bp
MW Zm Sb N19 88H Coim Cher
High molecular weight bands (>5412 bp)
Sugarcane cultivars

66
Four six-base cutting enzymes were used to restrict genomic DNA to produce a
number of fragments. The choice of enzymes was based on availability and their moderate
cutting nature. The enzymes selected were EcoRI, HindIII, PstI and XbaI. The use of
different enzymes in this study would provide different banding profiles for each of the
DNA samples. It was argued that small fragments would be more likely to represent
single gene copies as compared to large fragments which could represent multiple gene
copies.
Figure 7 shows a Southern blot prepared using restricted genomic DNA from maize,
sorghum, N19, 88H0019, Coimbatore and Black Cheribon. Analysis of the Southern blot
was carried out by visually counting the number of restricted genomic fragments
hybridising to the SS gene sequence to determine the number of hybridising bands
(Table 3). The signal intensities of some of these bands were low; these may
therefore contain only a small stretch of the SS gene sequence. In such cases the bands
were disregarded.
The results obtained from the genomic Southern blot show the successful radioactive
labelling of the SS gene sequence. There are distinct hybridising bands of both high and
low molecular weights observed for sorghum and the four sugarcane cultivars thus
enabling profile comparisons. As expected, each enzyme used in this study gave a
different banding profile but some almost identical profiles can be seen across the
different genomes for a particular enzyme. Good examples are shown by N19, 88H0019
and Black Cheribon restricted with PstI and EcoRI respectively (Figure 7).
The restriction enzyme HindIII produced ambiguous results for the different plant
samples and the profiles obtained were not informative to this study. The results from the
HindIII restrictions were therefore excluded from the analysis.
The banding profile obtained for maize shows distinct bands of low molecular weight;
however the high molecular weight bands are smeared. Due to this smearing the precise
number of bands cannot be interpreted. The banding profiles for the ancestral sugarcane
cultivars are very different from each other. Coimbatore has distinct hybridising
bands both of high and low molecular weight whereas Black Cheribon has mainly
high molecular weight bands. This result was in keeping with the fact that they are
different species of Saccharum.

67
Bearing in mind the polyploid nature of the sugarcane genome, the number of
hybridising bands observed from the genomic Southern blot is very low. This
provides strong evidence that the SS gene has a low copy number in the four
sugarcane cultivars and sorghum.
Figure 7: Southern blot analysis of Zea mays (Zm), Sorghum bicolor (Sb), Coimbatore (Coim),
Black Cheribon (Cher), N19 and 88H0019 (88H) genomic DNA to determine copy number of the
SS gene. Ten micrograms of genomic DNA from young leaves were digested with EcoRI (E), HindIII
(H), PstI (P) and XbaI (X) and separated electrophoretically on a 1% agarose gel; thereafter the DNA
was blotted onto a membrane for hybridisation analysis using the radioactively labeled SS gene
sequence as the probe. MW = known molecular weight marker EL. Prominent bands are marked on the
autoradiograph by asterisks and less prominent bands by arrows.
Table 3: The number of hybridising bands following Southern blot analysis using visual
assessment for Zea mays, Sorghum bicolor, N19, 88H0019, Coimbatore and Black Cheribon after
restriction with EcoRI (E), HindIII (H), PstI (P) and XbaI (X).
Zea mays Sorghum
bicolor
Coimbatore Black
Cheribon
N19 88H0019
E EcoRI - 2 3 5 4 4
P PstI - 3 3 6 5 6
X XbaI - 1 - - 3 4 (-) – Results were not included due to smeared bands
MW E H P X E H P X E H P X E H P X MW MW E H P X E H P X MW
Zm Sb Coim Cher N19 88H0019
* * * **
5412 bp 3857 bp 2840 bp 2248 bp 1594 bp 1317 bp

68
The number of individual hybridising bands obtained for the different restriction
enzymes on the Southern blot does not necessarily correspond to the number of gene
copies. Prominent or high molecular weight hybridising bands on the Southern blot may
contain more than one copy of the SS gene sequence. Such examples include
Sorghum, Coimbatore, Black Cheribon and N19 restricted with EcoRI (marked
with asterisks) (Figure 7). Less prominent bands or low molecular weight bands
on the Southern blot may be considered as less than one gene copy. Such examples are
observed for Sorghum restricted with HindIII, N19 restricted with EcoRI, 88H0019
and Black Cheribon restricted with PstI (marked with arrows) (Figure 7).
Overall the indications from this analysis show that the SS gene copy number is low in
sorghum and in the four sugarcane cultivars. The comparison between sorghum and
sugarcane shows that sorghum displayed a fewer number of hybridising bands on the
Southern blots than across the four sugarcane cultivars. This makes sense since
sugarcane is genetically more complex than sorghum.
4.4 UIsolation of SS clones from the Lambda genomic library (maize)
A Lambda genomic library was used in this study to identify candidate clones
encoding the SS gene sequence from maize. Insert DNA containing the SS gene
sequence would be sub-cloned into a plasmid vector for restriction analysis and
sequencing, thus enabling the localisation and characterisation of the corresponding
upstream promoter region of this gene.
At the outset, the titre of the library was estimated since the number of clones to be
screened needed to be at least 280 000 to ensure a good representation of the maize
genome (calculation not shown). There maybe different copies of the SS gene sequence
in maize (Results from Figure 7 and Table 3 are inconclusive) and it would be desirable
to isolate these. An added consideration is that the maize genomic library is amplified
and the same copy of the SS gene sequence may be isolated more than once. Therefore
isolating a number of clones increase the chances of finding different copies of the SS
gene sequence.

69
The Lambda library constructed in the Lambda FIX® II vector was screened using
the 32 P- labeled SS gene sequence. Selected positive plaques were subjected to
successive rounds of purification, re-infection and re-plating to ensure well separated
plaques of single plaque purity.
The primary screening investigated a total of 280 000 plaque forming units (pfu) which
were plated to produce a lawn of infected bacterial cells. Lysis was visible following 4-5
hours of incubation. Following lifts onto membranes for hybridisation analysis, a
total of six signals was identified. Secondary and tertiary screenings were conducted
using dilutions of phage to better obtain single plaque purity. The number of phages
plated out for secondary and tertiary screenings was between 20 and 50 pfu thus
ensuring well separated plaques on the agar plate for the isolation of individual
plaques.
The six clones identified after screening the maize genomic library following the tertiary
selection were named according to the membrane number they were located on i.e. 4,
5, 6b, 6d, 9a and 9b (Figure 8). These six clones were used for further analysis in
this study.
Figure 8: Autoradiograph of the tertiary selection of individual plaque forming units obtained
from secondary screening using hybridisation analysis. The panels show the six stem-specific clones
(4, 5, 6b, 6d, 9a and 9b) chosen from the maize Lambda library for further analysis. The arrows on the
autoradiograph show the hybridising plaque forming units selected.
4 5
6d 9a 9b
6b

70
4.5 UIdentification of SS clones from the Bacterial Artificial Chromosome genomic
library (sorghum)
The screening of a Bacterial Artificial Chromosome library was used to identify clones
containing the SS gene sequence from the genome of sorghum. The isolation of
candidate clones containing the SS gene sequence from the sorghum genome
would allow for DNA fragments to be sub-cloned into a plasmid vector for sequencing
and mapping thus enabling the localisation and characterisation of the
corresponding promoter region of this gene. The BAC library purchased from the
Clemson University contained 110 592 clones arrayed over 6 filters.
From the total 110 592 BAC clones on the membrane set, four were found to contain
the SS gene sequence. An example is shown in Figure 9. These clones were allocated
addresses and named with respect to their microtitre well location and position i.e. K1,
E18, K24 and A11 (Table 4). These clones were ordered from Clemson University for
further analysis in this study.

71
Figure 9: A hybridising BAC clone designated E18 obtained from screening filter D with the SS
gene sequence. Clone E18 showed hybridisation on filter D and the layout of the grid was used to
identify the field number 1. Within the respective fields, the well location and position were established
to be E and 18 respectively. The plate number was identified as 7 by determining the orientation of the
duplicate spots and then referring to the table for each field. This library has more than one filter
therefore the plate number of clone E18 was decoded by using the plate number (7), well location (E18)
and filter letter (D) from the conversion table and was found to be 151.
Plate # from Filter
UFilter AU
UFilter BU
UFilter CU
UFilter DU
UFilter EU
UFilter FU
UFilter G U
UFilter HU
1 1 49 97 145 193 241 289 337 2 2 50 98 146 194 242 290 338 3 3 51 99 147 195 243 291 339 4 4 52 100 148 196 244 292 340 5 5 53 101 149 197 245 293 341 6 6 54 102 150 198 246 294 342 7 7 55 103 151 199 247 295 343
Position 2 = Plate 7 in field 1
Hybridising BAC clone on filter membrane
Field number
Well location = E Well position = 18
Filter D
Plate decoded = 151
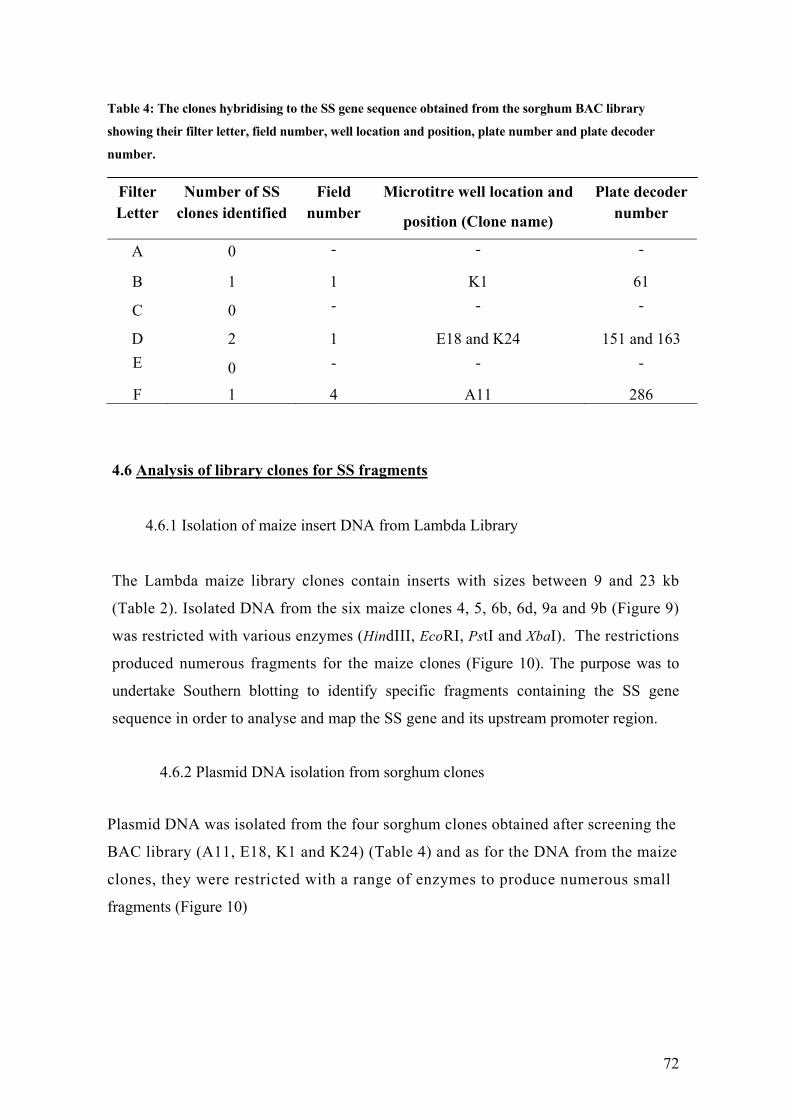
72
Table 4: The clones hybridising to the SS gene sequence obtained from the sorghum BAC library
showing their filter letter, field number, well location and position, plate number and plate decoder
number.
Filter Number of SS Field Microtitre well location and Plate decoder Letter clones identified number position (Clone name) number
A 0 - - -
B 1 1 K1 61
C 0 - - -
D 2 1 E18 and K24 151 and 163 E 0 - - -
F 1 4 A11 286
4.6 UAnalysis of library clones for SS fragments
4.6.1 Isolation of maize insert DNA from Lambda Library
The Lambda maize library clones contain inserts with sizes between 9 and 23 kb
(Table 2). Isolated DNA from the six maize clones 4, 5, 6b, 6d, 9a and 9b (Figure 9)
was restricted with various enzymes (HindIII, EcoRI, PstI and XbaI). The restrictions
produced numerous fragments for the maize clones (Figure 10). The purpose was to
undertake Southern blotting to identify specific fragments containing the SS gene
sequence in order to analyse and map the SS gene and its upstream promoter region.
4.6.2 Plasmid DNA isolation from sorghum clones
Plasmid DNA was isolated from the four sorghum clones obtained after screening the
BAC library (A11, E18, K1 and K24) (Table 4) and as for the DNA from the maize
clones, they were restricted with a range of enzymes to produce numerous small
fragments (Figure 10)
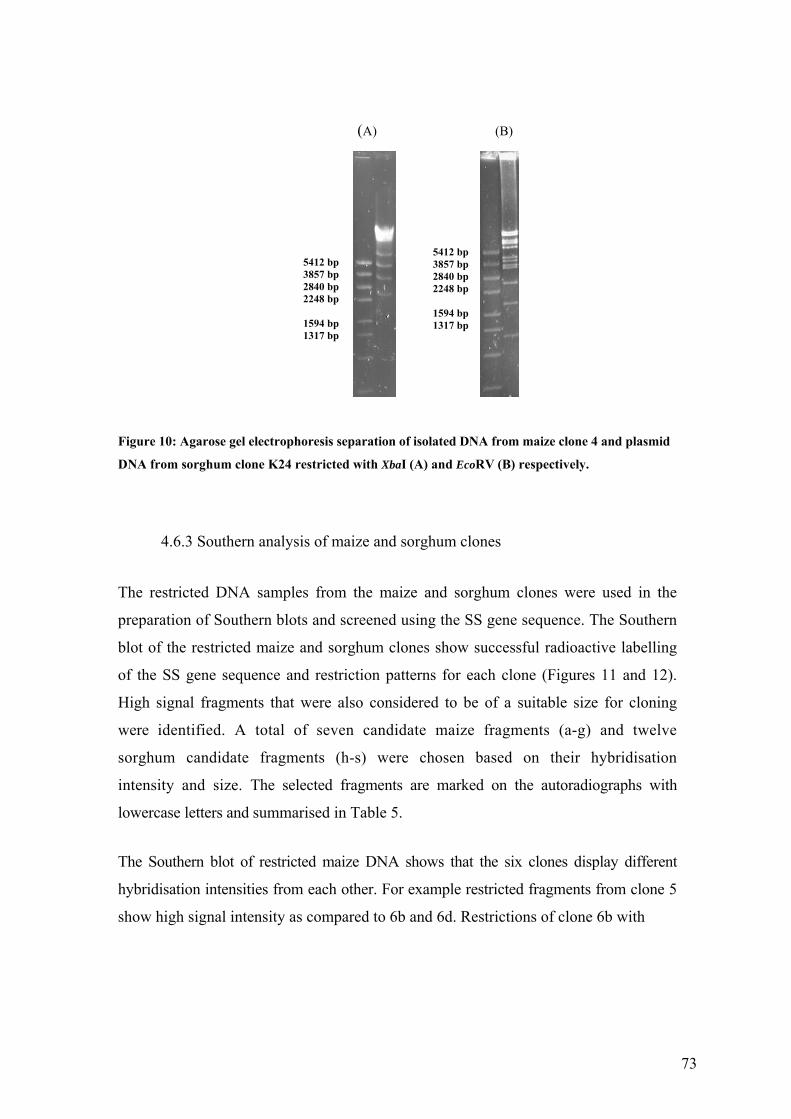
73
(A) (B)
Figure 10: Agarose gel electrophoresis separation of isolated DNA from maize clone 4 and plasmid
DNA from sorghum clone K24 restricted with XbaI (A) and EcoRV (B) respectively.
4.6.3 Southern analysis of maize and sorghum clones
The restricted DNA samples from the maize and sorghum clones were used in the
preparation of Southern blots and screened using the SS gene sequence. The Southern
blot of the restricted maize and sorghum clones show successful radioactive labelling
of the SS gene sequence and restriction patterns for each clone (Figures 11 and 12).
High signal fragments that were also considered to be of a suitable size for cloning
were identified. A total of seven candidate maize fragments (a-g) and twelve
sorghum candidate fragments (h-s) were chosen based on their hybridisation
intensity and size. The selected fragments are marked on the autoradiographs with
lowercase letters and summarised in Table 5.
The Southern blot of restricted maize DNA shows that the six clones display different
hybridisation intensities from each other. For example restricted fragments from clone 5
show high signal intensity as compared to 6b and 6d. Restrictions of clone 6b with
5412 bp 3857 bp 2840 bp 2248 bp 1594 bp 1317 bp
5412 bp 3857 bp 2840 bp 2248 bp 1594 bp 1317 bp

74
MW 4 5 6b 6d 9a 9bMW4 5 6b 6d 9a 9b MW4 5 6b 6d 9a 9bMW4 5 6b 6d 9a 9b MW
HindIII EcoRI PstI XbaI
a
b
c
d f
g
e
XbaI, HindIII and PstI produced either low or no signals on the blot. This suggests the
possibility that the original isolates from the maize library were false positives. A
similar hybridisation signal was observed with restricted fragments of clone 6d and 9a. By
contrast with the maize clones, all four of the restricted sorghum clones give a strong
hybridisation signal on the blots. This shows that correct addresses were allocated to the
identified clones in the sorghum BAC library.
Figure 11: Southern blot analysis of restricted lambda genomic DNA (1 µg per lane) probed with the
SS gene sequence. One microgram of Lambda genomic DNA from the maize clones 4, 5, 6b, 6d, 9a and 9b
was restricted with HindIII, EcoRI, PstI and XbaI respectively and electrophoresed on a 1% agarose gel. The
DNA was denatured and blotted onto a nylon membrane for hybridisation analysis. The fragments containing
the SS gene sequence and of a cloning size range are marked by letters on the autoradiograph. These included
fragments 5 HindIII (a), 9b HindIII (b), 5 EcoRI (c), 6b EcoRI (d), 9a EcoRI (e), 9b EcoRI (f) and 4 XbaI (g).

75
E18 K24
MW
E
coR
I Sm
aI
Eco
RV
Sp
hI
Eco
RV
M
W
r s
MW E18 E18 A11 E18 K1 K24 MWA11E18 K1 K24MWA11 E18 K1 K24 K1 K24 MW
PstI SpeI KpnI SphI BglI XhoI
l m
n o p q
(A)
(B) (C)
Figure 12: Southern blot analysis prepared with plasmid DNA from the sorghum clones restricted
with a range of restriction enzymes. One microgram of plasmid DNA was restricted with a specific
enzyme and electrophoresed on a 0.8% agarose gel. The DNA was denatured and blotted onto membranes
for hybridisation analysis using the 32P-labeled SS gene sequence as the probe. The blots were labelled A,
B and C. Candidate DNA fragments h, i, j, k, l, m, n, o, p, q, r and s marked on the autoradiographs were
selected for cloning and sequence analysis.
MW E18 A11 K1 K24MWE18 A11 K1 K24MWE18 A11 K1 K24MWE18 A11 K1 K24MW
Eco0109I HindIII XbaI XhoI
h
i j k

76
Table 5: Selected candidate DNA fragments from the maize and sorghum clones following
Southern blot analysis (Figures 11 and 12). These clones were selected for sub-cloning into the
pBluescript vector.
4.7 USub-cloning and physical mapping of SS fragments
4.7.1 Direct cloning of hybridising fragments into pBluescript
The principle of direct sub-cloning involves the cloning of a DNA fragment produced by
restriction with one enzyme into a dephosphorylated vector restricted with the same
enzyme. This strategy was used to clone the seven maize and twelve sorghum candidate
fragments into pBluescript.
Candidate fragments were located on the gel, excised and the DNA purified. Direct
cloning of these fragments into pBluescript was carried out. To amplify the plasmid
DNA transformation of E. coli was carried out. Blue-white screening was
implemented to identify colonies with plasmid and insert. Both blue and white colonies
were obtained. The white colonies were investigated using restriction analysis of the
isolated plasmid DNA but no inserts were found. No restricted DNA fragments from
maize or sorghum were cloned using this strategy.
Maize
Fragment a b c d e f g
Clone 5 9a 5 6b 9a 9b 4
Restriction
enzyme
Hin
dIII
Hin
dIII
EcoR
I
EcoR
I
EcoR
I
EcoR
I
XbaI
Sorghum
Fragment h i j k l m n o p q r s
Clone E18 A11 K1 K24 E18 E18 A11 E18 K1 K24 E18 K24
Restriction
enzyme
Eco0
109I
Eco0
109I
Eco0
109I
Eco0
109I
PstI
SpeI
SphI
SphI
SphI
SphI
EcoR
I
EcoR
V

77
4.7.2 Forced cloning of hybridising fragments into pBluescript
Since the direct cloning of large fragments into the pBluescript vector proved to be
difficult, the strategy of forced cloning was implemented. The principle involves
restriction of fragments originally produced by one enzyme with a second enzyme in
order to obtain fragments with different terminal ends. These fragments would be sub-
cloned into a vector restricted with the same enzymes, where self-ligation was then
impossible. The added advantage of using this approach was directional cloning.
An example of this strategy is shown in Figure 14 using fragment (a) originally
obtained from restriction of maize clone 5 with HindIII (4400 bp) (Figure 11 and Table
5). Following trials with several restriction enzymes, EcoRI was found to produce a
suitable number of fragments and molecular sizes. The electrophoretic separation of
this digest on an agarose gel showed three fragments with molecular weights of 2200
bp (C), 1400 bp (B) and 750 bp (A). The two terminal fragments with HindIII and
EcoRI sites on flanking ends were cloned into a plasmid vector restricted with the same
restriction enzymes.
The maize clone 5 was the only clone sub-cloned using the forced cloning strategy.
Figure 13 shows the sub-cloning strategy carried out for this clone.
4.7.3 Physical mapping of maize clone 5
The construction of a physical map for the maize clone 5 fragment (a) was based on the
identification of restriction sites within the fragment. The map allows for the use of these
restriction sites to obtain the complete sequence of the fragment (4.9).

78
Figure 13: Flow diagram showing the cloning strategy implemented for the maize clone 5 fragment
to allow for the construction of a physical map.
Electrophoretic separation of the 4400 bp
maize genomic fragment restricted with
EcoRI showed three fragments with
molecular weights 2200 bp(C), 1400 bp
(B) and 800 bp (A). The terminal
fragments A and C have HindIII and
EcoRI ends and B only EcoRI ends.
Band D is undigested DNA.
The blue-white screening technique was implemented
as a preliminary selection to identify and isolate
E.coli bacterial colonies successfully transformed
with recombinant plasmid.
Schematic representation showing the fragments
produced following restriction with EcoRI.
Terminal fragments A and C were cloned into a
plasmid vector (pBS) restricted with the same
restriction enzymes. To amplify the plasmid DNA
transformation of E.coli was carried out.
D C B
A
5412 bp 3857 bp 2840 bp 2248 bp 1594 bp 1317 bp 954 bp 620 bp 373 bp
Direct cloning
A B C
EcoRI HindIII HindIII EcoRI
Forced cloning
The isolated plasmid DNA was restricted
with HindIII and EcoRI and
electrophoretically separated on an
agarose gel. The insert sizes of 2400 bp (A)
and 800 bp (B) were confirmed.
A B
Construction of a physical map

79
The physical map of the clone was constructed by restricting the DNA fragments A,
B and C with the enzymes EcoRI, EcoRV, Eco0109I, NheI, PvuI, ClaI, BamHI, , SphI
and SmaI respectively. Of the ten enzymes tested only SphI and SmaI proved to be useful
since they cut only once within fragment C and again within the multiple cloning site of
pBluescript. These restriction sites were identified and assembled on the map to
produce a physical map (Figure 14). However, no useful restriction sites were found
for fragments A and B. The restriction sites were assembled on the map using
distances based on the sizes of the restriction fragments obtained from electrophoretic
separation on an agarose gel.
Fragment B has been cloned using the direct cloning strategy; therefore the orientation
of the fragment within the vector was unknown. Two possible models for assembly of
the three fragments were proposed (Figure 14). Sequencing had to be carried out to
determine the correct orientation of the fragment B and also to obtain the complete
sequence in one piece.
Figure 14: Physical map of the maize clone 5 divided into the three fragments A, B and C showing
their assembly with respect to the orientation of the fragment B. The restriction sites SphI and SmaI
marked on the map cut once within the fragment C and cleave within the multi-cloning site of
pBluescript.
EcoRI EcoRI HindIII
A B C
0.7 kb 1.4 kb 2.2 kb
?HindIII SphI SmaI
EcoRI EcoRI HindIII
A B C
0.7 kb 1.4 kb 2.2 kb
?HindIII SmaI SphI

80
4.8 USequence of maize clone 5
The complete sequencing of the maize clone 5 fragment involved three approaches. The
first strategy involved the use of the M13Forward (M13F) and M13Reverse (M13R)
primers flanking the multiple cloning site in pBluescript. Sequencing with M13F
and M13R primers gives 400-450 bp of reliable sequences. The second strategy was used
for sequencing fragments greater than 800 bp by using restriction sites identified in
the physical map to carry out re-ligations i.e. cleavage of sequenced stretches of DNA to
sequence inaccessible regions in the truncated plasmid. The third strategy was used if no
useful restriction sites were found within these sequences and involved the designing of
primers at strategic positions by using known sequences of the fragment thus allowing for
further stretches of DNA to be sequenced.
The flanking fragment A cloned in pBluescript was sequenced with M13F and M13R
primers contained in the vector. Since fragment A was 0.7 kb in length, the entire
region was sequenced.
The flanking fragment C was a large fragment (2.2 kb) and the use of the physical
map was essential. The M13F and M13R primers were used to sequence the terminal
ends of this fragment. The cleavage site SphI within the fragment and SpeI from the
multiple cloning site were used to cleave a 0.42 kb stretch of sequenced DNA to
sequence the inaccessible region. The cleavage site SmaI within fragment C and in
the multiple cloning site of pBluescript was used to cleave a 0.85 kb stretch to obtain
the sequence for a central stretch of 0.78 kb.
Fragment B was sequenced firstly using the M13F and M13R primers. Since this
fragment was 1.4 kb a central stretch of 0.4 kb could not be sequenced directly and
suitable restriction sites were not available. Therefore primers R3EF and R3ER were
designed from the known seqences in order to obtain the complete sequence. The
sequencing strategy is summarised in Figure 15. The complete sequences for the three
fragments were obtained (Appendix A).

81
Figure 15: Schematic representation of the sequencing strategy implemented to obtain the complete
sequences for fragment A, B and C in pBluescript for the maize clone 5. The direction of the arrows
represents the direction and the sequence obtained following re-ligation using a particular enzyme.
The sequences obtained from each fragment were assembled into one piece for future
analysis. BLAST searches were carried out with fragments A, B and C to determine
their possible homology to known sequences on the NCBI database. Results for
fragment C show 95% sequence similarity with the Saccharum hybrid mRNA (EST
clone, Accession number AW746904). Fragment B revealed significant sequence
similarity (87%) to Saccharum hybrid cultivar isolate c51 promoter region (Accession
no. AY78 1895) while fragment A showed 91% sequence similarity to the Zea mays
retrotransposon cinful (Accession no. AF0491 10). All three fragments showed
M13R M13F
R3ER
M13R M13F
R3EF
M13F pBluescript
M13R SpeI
SmaI HindIII SphI SmaI
pBluescript
M13R
pBluescript
SmaI
M13R
Scale: 1cm:362.5 bp
EcoRI EcoRI
HindIII
HindIII
HindIII EcoRI
EcoRI

82
high sequence similarity to maize sequences thus confirming that all three fragments
were from maize.
Based on the results from the BLAST search, fragment B was orientated to
fragments A and C. The sequences from all three fragments were assembled in the
order of retrotransposon, promoter region and coding region (Figure 16). The intron
region was deduced by the stretch of missing DNA in the coding region. The lengths of
the possible retrotransposon, promoter, intron and SS gene regions within the maize
clone 5 fragment were found to be 325 bp, 2378 bp, 264 bp and 129 bp respectively
(Appendix A).
Scale: 1cm:362.5 bp
Figure 16: Schematic representation of the maize clone 5 showing the retrotransposon cinful (R),
promoter region, intron (I) and the SS coding sequence (SS) in relation to fragments A, B and C.
4.9 UAnalysis of promoter region
For the purpose of promoter analysis, a stretch of DNA sequence from nucleotides
664- 3194 from the maize clone 5 sequence (Appendix A) was selected and
designated the maize5-pro. A BLAST search of the deduced SS promoter sequence
from maize clone 5 revealed significant homology to Saccharum hybrid cultivar isolate
c5 1 promoter region (Accession no. AY78 1895). A sequence comparison was made
between the SS gene promoter region from sugarcane (2947 bp in length) obtained
from the NCBI database and the maize5-pro (2531 bp in length) (Figure 17).
Implementing this comparison would help to understand the level of genetic
conservation between the two promoters thus helping to provide more information
on the usefulness of the maize promoter for driving transgene expression in sugarcane
and the chances of promoter silencing.
A B C 0.7 kb 1.4 kb 2.2 kb
R Maize5-pro I SS
ATG

83
Saccharum 1506 AAAAAAGATGCCATAAAATTGCTTGAAGCTCCTGGTAATAAGCAGCTGGTAAATAATTCCTTAAAACGAGAAAAGAAGAACCTCACTAATATCT 1599Maize 1675 AAAAAAAT....TACAGTAGCAGCCCCCTCCTGATT.TCCAAAGAAAG.ACATAATTG.TTAAAACGAGAAAAGAAAAAACTCGCGAATA.CT 1759 Saccharum 1600 CC.......TTTGCTTACCTTCA...GTTCA..TCAGCCAACGACGAGG...TAGGGTTCAGTATCATGATCCAATTAT...CCCATCGTGACA 1675 Maize 1760 CCATAGTATTTTGCGTACGTACGTTCGTCCAGTTCAGCCAACGACGAGGAGGTAGGGTTCAATATTATGACCCGATTATTATCCCATCGTGGCA 1853 Saccharum 1676 ....TAGCCTTGTCCTTGATGA....TTCGAGATGCAATTCTAATTCTCATC....ATATCATCGACTAGGTAACACAGAAAACAAAC.TTTTT 1756 Maize 1854 CATATAGCCTTGTCCTTGATGACTAATTCGAGATGCAATTCTAATTCTCACCGTGTATATAATCGACTAGGTAACACAGAAAACAAGCCTTTTT 1947 Saccharum 1757 TCTTCGTCAATT....GCACTGCA...........ACCGTTGCTTTTTG.TGATGTGCAGTTGTGCACCCACATCACAACAGCAC.TCAACACA 1833 Maize 1948 TCTTTGTCGATTAATCGCACTGGTCTGGACTCTGGACCGTTGCTTTTTGGTGACGTGCAGTTGTGCACCCATATCACAAAACAGCGTGTAAATA 2041 Saccharum 1834 TGCCACTTCAAAGTTCGAATCGACACC..AGAACTGACGGGAGAAAAGA...AAACAAATTAACAAAACTGTAGAATAGATCATCCAGTCATCC 1922 Maize 2042 GGCAACCTCGAAGTTCGAATCGACACCTCACACGTCACACCAGAAGGGACGCAAGAAAAGAAACAAAATTATACTATTATT..GCAATAGATCC 2133 Saccharum 1923 AGCGTCCAAAAA....GTCCTGCTAGCTATAGATGCAACCTAATAACTTTGCTGACCTAGTCACTCCG...AATTCCAACATCACATCATCGTA 2009 Maize 2134 AGCGTCCAAAAAAAAGGAGAGGTTAGCTATAGACTTAGC-TAATAACTTTGCTGATCTAGCCCCTCCGCCGAATTCCAAAACCACATGATAGTA 2226 Saccharum 2010 GTAGGCTCATTGTCATAGCATTCCTCAACAGCACTGTTAACAAGCAGATGCAAACAAGCAGATGCACATTCACCGGTCCCAATTGCACTGTTAA 2103 Maize 2227 GTAGGCTCAATGTCATA...........................CAGATACAGTGGAAAGGAGGCACATTCACCGGCCACAGCTAACCCGACAA 2293 Saccharum 2104 CCCGACAACCGCCTCTATTCCTGT......CACCTCTAATCA.......CGTACGAGCAAAGCA.....CTAATCAATC.TCTCTCCCCTCCCC 2178 Maize 2294 CCGGGCCCCCTGCTGTCTTCCTTTGCCGCGCGCCTCTAATAATCTCGTACGTACGACCAAATTAAAACGCTAATCAACAATCTCTTCCC.CGTA 2386 Saccharum 2179 TGTAACCAAAGCTGCCGAA...TCTCTTCGCTGATCTGGCTGCTGCACCGCTGCAGCCTGCGAGGAGAGGTGGGGGTCGCTCATCAGTTAACTA 2269 Maize 2387 CGTAACCAAAGCTGCCGAAATGTCCCCTCGCTGATTTTTAATTTG.......GC..........................TCA..ATTTAACTA 2445 Saccharum 2270 CTGACG...CCAAGGACGGCGTGCAACGTGCAGCAACAATGAGGCGCAGGAT.GCACACCTCACAA...TGCCCTGCACC.GCAATGAAGCCT. 2354 Maize 2446 CGGACGACGCCAAGGACGGCGTACAGCGTGCAGCAACAATGAGGCGCAGCCCAGCGCAGCGAGCCAGCGTGCGACGCACATGCAATGAAGCCTC 2539 Saccharum 2355 .ACATCTCCCG......AAGGTACAC.......TTGTCTCCATGGACACACATGCTGGAACCTGGA.....GAGATGCATGCAAGCAAGCAGAC 2429 Maize 2540 TACAGCTCCGCTCCCAAAAGGTACGCGCGCTTGTTGTCTCCACGGACACACATGCTGGAGCCTGGAACCTGGAGAGAGATGCATGCAAAAA.AC 2632 Saccharum 2430 CACACATCA.TCGATCGGTCTGTGAACCTGTGATCACTTGGTGTTGGTGATCTATCGATCTCTCCCACAGATTCACGCACAGGGGCCTGCTGGG 2522 Maize 2633 CACACAGCAATCCATCGGTCTGTAATC....GACC.....GTCTCTCCCACAGATTCACCTCACGCGCCGCTGGTGCTGCGTGAAAGGACCAGG 2717 Saccharum 2523 TGAAAGAACCAAGACACCGTGCACAC....CGCCCCTTTTGGACCCTTTCCATGTGTCATGAC..ACGGT....CATGGGCACCTTTTGGTTGC 2606 Maize 2718 ACCAAGA.CCAAGACGCCGTGCACACACACCGCCCGCTTTGGACCCTTCCCATGTGTCACGCATGAGGGTGACTCATGGCCACCTTTTGGTTGC 2810 Saccharum 2607 ATTGCATGACATGTTCATGTGTGCTC..GTACAGCTCCTCAAGATTCCC......GATCATGATACCAGCGAC..........GACAGCTCTTT 2682 Maize 2811 ACTGCGTGGCATGTTCATGTGTGTACCTGTACAGCTCCTCAAGATTCCCAGTCATGATCATGATACGAGCGACAGATCAAGGGGCCGGGGATTT 2904 Saccharum 2683 ATTAGATCA.AGGGGGATTTTTAAAAAAAAAATC.....GGCAGAGTGCTAAGAAGCCCTTTTGTGTTCTCCCCATTCTGGCCTCGCCGC...C 2767 Maize 2905 AACAAAAGAGAGAGAGAGAGAGAGAAAAAAAACCCACCCGGCAGACTGCGCTTA.GCCCT..TGCGTTCTCCCCGTTCTGGCCTCGCCGCGCCC 2995 Saccharum 2768 GGGCCTC........TATATATAGCGCTCCCA.TCTCACCACCTT.GCTTCACACAAGCTCGAATGCTCGATCGATCCCACTCTCAGCTGATCG 2851 Maize 2996 GGTCCTCTCCTCTTCTATATATAGCGTCCCGGGTCTCACGGCATTTGCCTCACACAACC....AAGCTCGATCGATCTCACTCTCAGCTGGTCG 3085 Saccharum 2852 CTCACTCTTGCAGCTCGA........TCAGTCTTAG........CTCTAGCCTCTAGCTAGCCAACTAGCCACTCCTTCGTGTAGCCATCAGCC 2929 Maize 3086 CTCACTCTTGCAGCTCCACCCTTCACTCAGTCTTAGGCTCTTAGCTCTAGGCTCTAGCTAGCCG...CGCCACTCCTTCGTGTAGCCATCAGCC 3176 Saccharum 2930 TTCTGATCGTCACCAATG 2947 Maize 3177 TTCTCATCGCCACCAATG 3194
Figure 17: Alignment of nucleotide sequences of the 5' regulatory regions of the SS gene promoter
from Saccharum (2947 bp) and maize (2947 bp). Significant sequence homology was observed
between nucleotide 1675-3194 in maize (Appendix A) and nucleotide 1506-2947 in sugarcane.
Homologous nucleotides are represented by shading. The transcription start sites (TSS) are in bold type
and highlighted in bright green, the start codon (ATG) is in bold type and underlined and the TATA
boxes are highlighted in yellow. The CAAT-like sequences similar in maize and sugarcane are
highlighted in red, turquoise and grey. The sugarcane and maize5-pro promoter sequences were aligned
and it was found that they share a 68% sequence similarity as shown by global alignments (BioEdit
software). There are also numerous indels and substitutions between these promoters.
From this alignment, significant sequence similarity (68%) was observed between
nucleotide 1675–3 194 in maize and nucleotide 1506-2947 in sugarcane (Figure 17).
The maize and sugarcane promoter sequences were found to have identical TATA
boxes (TATATATA) at positions 3011 and 2775 respectively and both were located
30 nucleotides from the TSS. Seven CAAT-like sequences were also identified

84
different distances from the TATA box for maize and sorghum (Figure 17). The
consensus sequences of the CAAT-like sequences identified in the maize and
sugarcane promoters were found to be different. In maize5-pro the CAAT-like
sequences were positioned at nucleotides 1889, 2124, 2234, 2433 and 2528 (CAAT)
and 2368 and 2479 (CAACAAT) upstream of the putative TATA-box. In sugarcane,
the CAAT-like sequences were located at nucleotides 1657, 1703, 1764, 2089, 2160
and 2343 (CAAT) and 2368 (CAACAAT) upstream of the putative TATA-box (Figure
17). For both these promoter sequences, the distance between the putative CAAT-
like boxes and the TSS is greater than the average of 80 bp as reported for several
plant promoters by An and Kim (1993).
A detailed analysis of this promoter sequence revealed several promoter elements that
are common in other plant promoters. The Neural Network Promoter Prediction
(NNP2.1, Rees and Eeckman, 1995) tool was used to identify putative TATA-box
elements and transcriptional start sites (TSS) for the maize and sugarcane SS gene
promoter (Accession no. AY78 1895) (Table 6). These core elements are known to
function as binding sites for Polymerase II, transcription factors and other proteins
that are involved in the transcription initiation process.
Table 6: Putative core promoter elements in the upstream sequence of the SS coding sequence
as predicted by the NNP2.1 toola
a Neural network promoter prediction. b Predicted transcriptional start sites are indicated in bold type and the predicted TATA box sequences are underlined.
The promoter region sequence for maize revealed several important cis elements.
The score obtained from the promoter prediction tool for the core promoter
elements were 1.00 for both maize and sugarcane (Table 6). This shows the high
predication accuracy for the core promoter elements and their location. The position
of the core promoter element for maize was identified between positions 3011 and
Promoter sequence
Position of core
promoter
Score Promoter sequenceb
Saccharum (Accession no.
AY781895)
2775 - 2805 1.00 GCCGGGCCTC UTATATATA UGCGCTCCCATCTCACCACCTTGCTTCACACAA
Maize5-pro 3011 - 3041 1.00 TCTCCTCTTC UTATATATA UGCGTCCCGGGTCTCACGGCATTTGCCTCACAC

85
3041 in relation to the transcriptional start site (TSS). To further confirm that the
putative core promoter element identified from the NNP software program was
correct, a BLAST search was carried out. The BLAST search used the region
upstream from the ATG start codon to the predicted TSS to be compared with maize
EST clones from the NCBI data base. The results obtained showed that no RNA
sequence was found upstream of the deduced TSS site. This therefore confirmed the
location of the TSS within the core promoter region.
The putative promoter, retrotransposon and intron regions were found to be AT-rich
(56%, 55% and 55% respectively) as compared to the SS gene sequence (26%).
Therefore, the AT-content is similar for the promoter, retrotransposon and intron
regions while the SS coding region is much lower. The TATA box (TATATATA)
for maize5- pro is located 30 bp upstream of the deduced transcriptional start site.
4.10 UTranscription factors and regulatory functions of the putative promoter
The promoter region was analysed for the possible presence of cis-acting regulatory
elements by comparison with known sequences using the Signal Scan Program,
PLACE (Higo et al., 1999). This analysis revealed a number of conserved DNA
motifs upstream of the SS gene (Table 7).
Searches based on the use of PLACE software for the investigation of
regulatory elements in the promoter region revealed a MYB-like recognition site
(position 2005). Various other putative cis-acting elements were also identified
in the maize5-pro involved in driving the expression of the SS gene (Table 7).
These include various signal-responsive elements such as light- and phytohormone-
responsive elements. The light responsive element identified was the GATA-box
(positions 2220, 2246 and 2872) which is a characteristic cis-regulatory element of
light-regulated promoters (Guilfoyle, 1997). The phytohormone-responsive
elements identified include auxin (ABRE) (position 2000) and abscissic acid
(ARFAT) (position 2574) responsive elements.

86
The AAAG-motif is a potential target site of the Dof class of DNA binding proteins.
Dof proteins are transcription factors that are unique to plants and have been found to
interact with a variety of promoters that drive photosynthetic genes, seed storage
protein genes and genes responsive to plant hormones and/or stress signals
(Yanagisawa and Schmidt, 1999). Thirteen AAAG-motifs were identified in the
putative promoter region using the PLACE based searches.
The transcription factors between the maize5-pro and the sugarcane promoter were
compared to determine the number of unique and similar regulatory elements (Figure
18). This would allow for the determination of the degree of similarity between two
promoters driving the same gene in different plants.
The comparisons made between the putative transcription factors in maizepro-5 and the
sugarcane promoter show that both promoter sequences are very similar as they share
ten of the same transcription factors (Figure 18). These include the DOFCOREZM,
GATAbox, ABRE, CACTFTPPCA1, ANAERO2CONSENSUS,
ANAERO1CONSENSUS, CGACGOSAMY3, BOXCPSAS1, MYBCORE and
ARFAT transcription factors. However, the transcriptional factors WBOX, SRE and
SP8BFIBSP8BIB are unique to the maize5-pro and the TAAG motif to the sugarcane
promoter.
The CACTFTPPCA1 and DOFCOREZM elements were the most numerous than any
of the other elements in both maize5-pro and sugarcane. Seven DOFCOREZM
elements were found in maize and four in sugarcane. This is not uncommon since this
recognition site is unique to plants. Eight CACTFTPPCA1 recognition sites are found
in sugarcane and four in maize; these are also found in the promoter driving the C4
phosphoenolpyruvate carboxylase gene (Gowik et al., 2004).

87
Table 7: Putative regulatory elements present in the maize5-pro and their positions
aMotifs were obtained from the PLACE database. bPositions are relative to the TSS in the maize promoter sequence and the 5′ most nucleotide of the sequence is numbered.
The three regulatory elements unique to maize5-pro, the WBOX, SRE and
SP8BFIBSP8BIB function in binding proteins involved in sugar signalling, binding of
major proteins of sweet potato and as a sugar repressive element respectively. The
function of the SS gene is unknown at this point; therefore a promoter with sugar
Regulatory elementa Consensus sequence
Positionb Proposed function Reference
GATA-box GATAA 2220, 2246 and 2872
Cis-element for light and tissue specific responsiveness
Teakle et al., 2002
ABRE ACGTG 2000 Abscisic acid responsive element Simpson et al., 2003
ANAERO1CONSENSUS AAACAA 1934 Found in promoters of anaerobic genes involved in the fermentative pathway
Mohanty et al., 2005
ANAERO2CONSENSUS AGCAGC 1689 Found in promoters of anaerobic genes involved in the fermentative pathway
Mohanty et al., 2005
ARFAT TGTCTC 2574 Binding site found in the promoters of auxin responsive genes of Arabidopsis thaliana
Ulmasov et al., 1997
BOXCPSAS1
CTCCCAC 2668 Box C found in pea asparagines synthetase (AS1) gene and binds with nuclear proteins
Ngai et al., 1997
CACTFTPPCA1 CACT 1965, 3070, 3088, 3109 and 3153
Cis-regulatory element for mesophyll-specific gene expression in the C4 plant Flaveria trinervia, the promoter of the C4 phosphoenolpyruvate carboxylase gene
Gowik et al., 2004
CCAATBOX1 CCAAT 1889, 2528 and 2479
Found in the promoter of heat shock protein genes and is located immediately upstream from the most distal HSE of the promoter. This element acts in cooperatively with HSEs to increase heat shock promoter activity
Rieping and Schoffl, 1992
CGACGOSAMY3 CGACG 2505 and 2876
May function as a coupling element for the G box element
Hwang et al., 1998
DOFCOREZM AAAG 1710, 1714, 1738, 2098, 2256, 2556, 2707 and 2909
Dof core recognition sequence that are unique to plants
Yanagisawa and Schmidt, 1999
MYBCORE CAGTTG 2005 Binding site for all animal MYB and at least two plant MYB proteins ATMYB1 and ATMYB2. ATMYB2 is involved in regulation of genes that are responsive to water stress in Arabidopsis
Urao et al., 1993
SP8BFIBSP8BIB TACTATT 2113 A nuclear factor that binds to regions of three different genes encoding for major proteins of sweet potato tuberous roots
Ishiguro and Nakamura, 1992
SRE TTATCC 1838 A sugar-repressive element found in down-regulated genes after main stem decapitation in Arabidopsis
Tatematsu et al., 2005
WBOX TGACT 1873and 2786
The SUSIBA2 binds to the WBOX element in barley isoamylase1 promoter and participates in sugar signalling
Sun et al., 2003

88
signalling elements may help to give an idea of the function this gene plays in the
stem. The unique element in sugarcane (TAAG motif) is also found in Solanum
tuberosum and is a target site for trans-acting StDof1 protein controlling guard cell-
specific gene expression (Plesch et al., 2001).
ANAERO2CONSENSUS
Saccharum 1506 AAAAAAGATGCCATAAAATTGCTTGAAGCTCCTGGTAATAAGCAGCTGGTAAATAATTCCTTAAAACGAGAAAAGAAGAACCTCACTAATATCT 1599 Maize 1675 AAAAAAAT....TACAGTAGCAGCCCCCTCCTGATT.TCCAAAGAAAG.ACATAATTG.TTAAAACGAGAAAAGAAAAAACTCGCGAATA.CT 1759 DOFCOREZM ANAERO2CONSENSUS DOFCOREZM DOFCOREZM CACTFTPPCA1 Saccharum 1600 CC.......TTTGCTTACCTTCA...GTTCA..TCAGCCAACGACGAGG...TAGGGTTCAGTATCATGATCCAATTAT...CCCATCGTGACA 1675 Maize 1760 CCATAGTATTTTGCGTACGTACGTTCGTCCAGTTCAGCCAACGACGAGGAGGTAGGGTTCAATATTATGACCCGATTATTATCCCATCGTGGCA 1853 SRE Saccharum 1676 ....TAGCCTTGTCCTTGATGA....TTCGAGATGCAATTCTAATTCTCATC....ATATCATCGACTAGGTAACACAGAAAACAAAC.TTTTT 1756 Maize 1854 CATATAGCCTTGTCCTTGATGACTAATTCGAGATGCAATTCTAATTCTCACCGTGTATATAATCGACTAGGTAACACAGAAAACAAGCCTTTTT 1947 WBOX ANAERO1CONSENSUS Saccharum 1757 TCTTCGTCAATT....GCACTGCA...........ACCGTTGCTTTTTG.TGATGTGCAGTTGTGCACCCACATCACAACAGCAC.TCAACACA 1833 Maize 1948 TCTTTGTCGATTAATCGCACTGGTCTGGACTCTGGACCGTTGCTTTTTGGTGACGTGCAGTTGTGCACCCATATCACAAAACAGCGTGTAAATA 2041 DOFCOREZM CACTFTPPCA1 ABRE MYBCORE Saccharum 1834 TGCCACTTCAAAGTTCGAATCGACACC..AGAACTGACGGGAGAAAAGA...AAACAAATTAACAAAACTGTAGAATAGATCATCCAGTCATCC 1922 Maize 2042 GGCAACCTCGAAGTTCGAATCGACACCTCACACGTCACACCAGAAGGGACGCAAGAAAAGAAACAAAATTATACTATTATT..GCAATAGATCC 2133 CACTFTPPCA1 DOFCOREZM DOFCOREZM SP8BFIBSP8BIB Saccharum 1923 AGCGTCCAAAAA....GTCCTGCTAGCTATAGATGCAACCTAATAACTTTGCTGACCTAGTCACTCCG...AATTCCAACATCACATCATCGTA 2009 Maize 2134 AGCGTCCAAAAAAAAGGAGAGGTTAGCTATAGACTTAGC-TAATAACTTTGCTGATCTAGCCCCTCCGCCGAATTCCAAAACCACATGATAGTA 2226 DOFCOREZM ANAERO1CONSENSUS GATA-box Saccharum 2010 GTAGGCTCATTGTCATAGCATTCCTCAACAGCACTGTTAACAAGCAGATGCAAACAAGCAGATGCACATTCACCGGTCCCAATTGCACTGTTAA 2103 Maize 2227 GTAGGCTCAATGTCATA...........................CAGATACAGTGGAAAGGAGGCACATTCACCGGCCACAGCTAACCCGACAA 2293 CACTFTPPCA1 GATA-box DOFCOREZM CACTFTPPCA1 Saccharum 2104 CCCGACAACCGCCTCTATTCCTGT......CACCTCTAATCA.......CGTACGAGCAAAGCA.....CTAATCAATC.TCTCTCCCCTCCCC 2178 Maize 2294 CCGGGCCCCCTGCTGTCTTCCTTTGCCGCGCGCCTCTAATAATCTCGTACGTACGACCAAATTAAAACGCTAATCAACAATCTCTTCCC.CGTA 2386 CGACGOSAMY3 Saccharum 2179 TGTAACCAAAGCTGCCGAA...TCTCTTCGCTGATCTGGCTGCTGCACCGCTGCAGCCTGCGAGGAGAGGTGGGGGTCGCTCATCAGTTAACTA 2269 Maize 2387 CGTAACCAAAGCTGCCGAAATGTCCCCTCGCTGATTTTTAATTTG.......GC..........................TCA..ATTTAACTA 2445 DOFCOREZM Saccharum 2270 CTGACG...CCAAGGACGGCGTGCAACGTGCAGCAACAATGAGGCGCAGGAT.GCACACCTCACAA...TGCCCTGCACC.GCAATGAAGCCT. 2354 Maize 2446 CGGACGACGCCAAGGACGGCGTACAGCGTGCAGCAACAATGAGGCGCAGCCCAGCGCAGCGAGCCAGCGTGCGACGCACATGCAATGAAGCCTC 2539 ABRE CGACGOSAMY3 Saccharum 2355 .ACATCTCCCG......AAGGTACAC.......TTGTCTCCATGGACACACATGCTGGAACCTGGA.....GAGATGCATGCAAGCAAGCAGAC 2429 Maize 2540 TACAGCTCCGCTCCCAAAAGGTACGCGCGCTTGTTGTCTCCACGGACACACATGCTGGAGCCTGGAACCTGGAGAGAGATGCATGCAAAAA.AC 2632 DOFCOREZM ARFAT Saccharum 2430 CACACATCA.TCGATCGGTCTGTGAACCTGTGATCACTTGGTGTTGGTGATCTATCGATCTCTCCCACAGATTCACGCACAGGGGCCTGCTGGG 2522 Maize 2633 CACACAGCAATCCATCGGTCTGTAATC....GACC.....GTCTCTCCCACAGATTCACCTCACGCGCCGCTGGTGCTGCGTGAAAGGACCAGG 2717 BOXCPSAS1 BOXCPSAS1 DOFCOREZM Saccharum 2523 TGAAAGAACCAAGACACCGTGCACAC....CGCCCCTTTTGGACCCTTTCCATGTGTCATGAC..ACGGT....CATGGGCACCTTTTGGTTGC 2606 Maize 2718 ACCAAGA.CCAAGACGCCGTGCACACACACCGCCCGCTTTGGACCCTTCCCATGTGTCACGCATGAGGGTGACTCATGGCCACCTTTTGGTTGC 2810 DOFCOREZM WBOX Saccharum 2607 ATTGCATGACATGTTCATGTGTGCTC..GTACAGCTCCTCAAGATTCCC......GATCATGATACCAGCGAC..........GACAGCTCTTT 2682 Maize 2811 ACTGCGTGGCATGTTCATGTGTGTACCTGTACAGCTCCTCAAGATTCCCAGTCATGATCATGATACGAGCGACAGATCAAGGGGCCGGGGATTT 2904 GATA-boxCGACGOSAMY3 Saccharum 2683 ATTAGATCA.AGGGGGATTTTTAAAAAAAAAATC.....GGCAGAGTGCTAAGAAGCCCTTTTGTGTTCTCCCCATTCTGGCCTCGCCGC...C 2767 Maize 2905 AACAAAAGAGAGAGAGAGAGAGAGAAAAAAAACCCACCCGGCAGACTGCGCTTA.GCCCT..TGCGTTCTCCCCGTTCTGGCCTCGCCGCGCCC 2995 DOFCOREZM TAAG MOTIF Saccharum 2768 GGGCCTC........TATATATAGCGCTCCCA.TCTCACCACCTT.GCTTCACACAAGCTCGAATGCTCGATCGATCCCACTCTCAGCTGATCG 2851 Maize 2996 GGTCCTCTCCTCTTCTATATATAGCGTCCCGGGTCTCACGGCATTTGCCTCACACAACC....AAGCTCGATCGATCTCACTCTCAGCTGGTCG 3085 CACTFTPPCA1 Saccharum 2852 CTCACTCTTGCAGCTCGA........TCAGTCTTAG........CTCTAGCCTCTAGCTAGCCAACTAGCCACTCCTTCGTGTAGCCATCAGCC 2929 Maize 3086 CTCACTCTTGCAGCTCCACCCTTCACTCAGTCTTAGGCTCTTAGCTCTAGGCTCTAGCTAGCCG...CGCCACTCCTTCGTGTAGCCATCAGCC 3176 CACTFTPPCA1 CACTFTPPCA1 CACTFTPPCA1 Saccharum 2930 TTCTGATCGTCACCAATG 2947 Maize 3177 TTCTCATCGCCACCAATG 3194
Figure 18: Alignment of nucleotide sequences of the 5' regulatory regions of the SS gene
promoter from Saccharum (2947 bp) and maize (3194 bp) and their putative transcription
factors identified using the Signal Scan Program, PLACE. Homologous nucleotides are
represented by shading and indels by a dot (.). The transcription start sites (TSS) are underlined
and highlighted in green, the start codon (ATG) is in bold type and underlined and the TATA boxes
are in bold script and underlined.

89
4.11 UConstruction of GUS transformation vector
The known sequences from the flanking fragments (fragments A and C) (Section 4.8)
were used to design primers (forward and reverse) for the amplification of the
promoter with intron region (2.8 kb) (Appendix A). The primers had incorporated
restriction sites, SacII and SpeI for their addition to the 5' and 3' ends of the promoter.
The forward and reverse primers were designated ZM51F2 and ZM51R2 respectively
(Figure 19). The forward primer was designed downstream from the retrotransposon.
The amplified fragment was fused transcriptionally inframe to a β-glucuronidase
(GUS) reporter gene in a transformation vector (pBScr-GUS000) for direct delivery
into the plant. Figure 23 shows a schematic representation of the cloning strategy
employed together with the respective primers designed.
The promoter with intron region was successfully amplified using the designed
primers. This was verified by restriction and sequence analysis including BLASTN
searches of the amplified product. The amplified fragment was fused transciptionally
inframe to a β-glucuronidase (GUS) reporter gene in a transforamtion test vector
(pBScr-GUS000) for direct delivery into the plant. The construct was designated GUS-
maize5-pro. It was envisaged that this test construct would be used in the future to
generate stable transformants in which the isolated promoter activity could be
evaluated in sugarcane using both quantitative and qualitative analysis.

90
Figure 19: Schematic representation showing the cloning strategy implemented for the maize5-
pro with intron (int) region into the GUS test vector. Restriction sites are marked on the complete
maize clone 5 DNA fragment and the primers (ZM51F2 and ZM51R2) designed for the amplification
of the promoter with intron region for the construction of the GUS test construct. The primers are
shown below the arrows with their respective incorporated restriction site. The GUS test plasmid is
represented as a linearised vector by restriction at the unique site showing the maize5-pro, nos
terminator and GUS gene.
SS coding sequence
Fragment C 2.2 kb
Fragment A 0.7 kb
Fragment B 1.4 kb
ATG intRetrotransposon Maize5-pro
Scale: 1cm:362.5 bp
ZM51F2 site
ZM51R2 SpeI site
nos Maize5-pro int GUS
TATA box
ATG SpeI

91
Chapter 5
Discussion and Conclusion
This project was aimed at isolating a stem-specific promoter; therefore it was essential
to first identify a stem-specific gene. A partial gene sequence (EST clone, Accession
number AW746904), named SS (stem-specific), was known from previous work to
display a stem-specific expression pattern in sugarcane. This gene was selected for
further analysis to determine if it could be a candidate for promoter recovery from
sorghum or maize. To date the SS source gene has an undescribed function. This
approach has been used by various researchers in the field as described in section 2.6.
The first phase of a project of this nature involves determining the level of
expression and the expression pattern of a specific gene. For this purpose in the
present study, RNA was isolated from leaves, immature, maturing and mature
stems and root and used for Northern blot analyses. Implementing Northern analyses
enabled the clear identification of the expression pattern of the SS gene sequence in
maize, sorghum and sugarcane genotypes N19, 88H0019, Coimbatore and Black
Cheribon. The results obtained confirmed the tissue-specific expression of the gene
across the species under study and its suitability as candidate for the isolation of a stem-
specific promoter. Although the function of this gene is still undescribed, it is
interesting to speculate on its role in the stem, perhaps involvement with sucrose
accumulation or other aspect of maturation.
In studies to determine the tissue-specific expression pattern of a gene, Northern blot
analysis is not the only suitable method. More sensitive methods such as real-time
PCR, in situ RNA hybridisation and microarrays can also be used. Work carried out by
Jain et al. (2007) investigated the tissue-specific expression pattern of two phototropin
genes OsPHOT1 and OsPHOT1 at the transcriptional level by performing real-time
PCR with total RNA extracted from 6-day-old dark-grown and light-grown
seedlings, shoots, roots, mature leaves, and flowers, using gene-specific primers. In situ
hybridization was also used by Li et al. (1996) to investigate cell-specific expression of
mitochondrial transcripts in maize seedlings. However, for this study Northern blot
analysis was suitable to determine the expression pattern of the SS gene since it was

92
sensitive enough and the technology was available in the laboratory.
From the results obtained in the Northern analysis, the SS gene is expressed in the
stem of the ancestral sugarcane cultivars; however, their expression patterns differ
from those of the hybrid cultivars. Research carried out by Harvey and Botha
(1996) indicated that there had been a gradual decline in DNA diversity (84%
reduction) from the early inter-specific crosses to the commercial hybrids, probably as a
result of backcrossing and inbreeding strategies used in the previous 5 to 6
generations of sugarcane breeding. Although there has been a gradual decline in
DNA diversity, the ancestral and hybrid cultivars are still to some extent genetically
diverse thus explaining the differences in expression of the SS gene. This
information could be useful for future thought in isolating this promoter from
ancestral sugarcane cultivars for driving transgene expression in the hybrid
cultivars.
In the case of the two ancestral cultivars, Coimbatore and Black Cheribon, the SS
gene was expressed down the length of the sugarcane stem and the roots for Coimbatore
while Black Cheribon showed expression only in the young stems (internode 1-4).
These ancestral cultivars are different species of Saccharum which could explain
the differences obtained in their expression patterns. The expression of this gene in
the roots of Coimbatore could suggest its function in nutrient uptake in the root cells,
especially in root epidermis cells. This gene might therefore be involved with the
phosphate or other category of transporter family, which takes up phosphate or other
ions at the root-soil interface.
The second phase of this project involved the assessment of the gene copy number of
the SS gene in maize, sorghum, N19, 88H0019, Coimbatore and Black Cheribon. The
procedure for the isolation of a genomic clone can be complicated if there is more
than one copy of the gene in the plant species. Therefore, it was necessary to
determine the copy number of the gene by Southern blot analysis (An and Kim,
1993). Where a gene is present in multiple copies there are chances that most
cloned copies of the genes may have nonfunctional promoters. In addition each
functional copy of the gene may be assigned different levels of expression and how
much of the total expression is assigned to each copy is unknown. Therefore there is

93
great uncertainty surrounding the levels of expression of the functional copies of such
a promoter. To obtain the best estimate copy number, more than one restriction
endonuclease was used to digest the plant DNA (An and Kim, 1993). The Southern
blot data of the SS gene suggests that this gene is present at a low copy number in the
genomes of these plants.
Confirmation of low copy number was also obtained following the screening of the
sorghum BAC library with the SS gene. This particular sorghum BAC library has a 4x
genome coverage and four clones were identified following the screening. This
outcome could therefore suggest that the four clones are one and the same.
The approach to promoter isolation implemented in this project was to screen two large
insert libraries i.e. the maize lambda and sorghum BAC library to identify clones
containing the SS gene sequence. In identifying this gene sequence the
corresponding promoter region can be located by sequence analysis. The
availability of large-insert genomic libraries is crucial for genome analysis, physical
mapping, genome sequencing, positional and map-based gene cloning, screening for
specific genomic sequences in organisms with very large genomes and isolation of
promoter regions (Woo et al., 1994, Budiman et al., 2007; Saisho et al., 2007). The
BAC libraries have been constructed and used for genome analysis of many
organisms, including crop plants. The main advantage of using BACs for genomic
library construction is the stability of the large, very low or single-copy clones and
this system has also proven to be an invaluable tool in stably maintaining large DNA
fragments (Wild et al., 2007).
The sorghum BAC library used for the purpose of this project was screened using the
radioactively labelled SS gene sequence as the probe and four clones were
identified. The same probe was used to probe the Lambda-based maize genomic
library. A total of six clones were identified from this library. From this study the
screening of the BAC library proved to be much simpler and less time consuming
than that of the Lambda genomic library. The BAC library required a single screening
with the radioactively labelled SS gene sequence for a pure clone to be identified for
further analysis. The maize Lambda genomic library on the other hand required
primary, secondary and tertiary screening procedures to be implemented in order to

94
obtain a pure clone thus proving to be more tedious and time consuming. This also
suggested that this form of screening is more costly in terms of the amount of
solutions prepared (including radioactivity), nylon filters used and the large
number of false positives obtained.
The screening of recombinant Lambda phages by the traditional method yielded a large
number of false positives. de Andrade et al. (2005) devised an approach to modify the
original technique. This approach allowed for distinguishing, with great accuracy, a true
positive spot from a false one using a single agar-plate and nylon filter. This modified
technique was also applied to this project as explained in Chapter 3. It was agreed
that this modification proved to be less tedious than the plating of several dilutions
and had the obvious advantage of preventing the wastage of several expensive nylon
filters. However, false positives were still obtained in this project following
screening. This could be as a result of a short stretch of sequence from the SS
gene hybridising to the clone sequence.
Maize became the main focus genomic resource for this project since more success was
obtained with cloning the smaller fragments from the Lambda genomic library into a
pBluescript vector as compared to the BAC library clones. The isolation of plasmid
DNA for the BAC clones proved to be a challenge and due to the low yields of isolated
plasmid DNA, cloning of these fragments into the pBluescript vector proved to be
difficult. Hence, focus was placed on the maize genomic clones with respect to cloning
and further characterisation of the SS promoter region in maize.
While the BAC library has many advantages over the Lambda genomic library the
clone inserts obtained from the BAC library were large fragments and hence plasmid
DNA recovery levels were low. This limited the amount of available plasmid DNA for
use in the cloning procedure. Scaling up the experiment could have been a solution to
extracting more plasmid DNA but it was decided that greater focus be placed on the
Lambda library since it was not problematic. A similar problem was faced by Wild
et al. (2007); however, in their study they solved the problem by constructing
vectors that retain the advantages of single-copy stability of the BAC clones.
The clones obtained from the Lambda genomic library on the other hand proved to

95
yield high quantities of Lambda genomic DNA to carry out numerous cloning
procedures. The fragments from this library were also within a reasonable size range
and forced cloning was implemented for sequence analysis of the clones.
The next step in this study involved the characterisation of the isolated regions by
DNA sequence analysis. A sequence comparison was made between the SS gene
promoter region from sugarcane (2947 bp in length) obtained from the NCBI database
and the maize5-pro (2531 bp in length). This was important in determining the level of
sequence homology that existed between the maize and sugarcane promoter. This had
a two-fold benefit, one involved the determination of the usefulness of this promoter
for driving transgene expression in sugarcane and secondly the chances of promoter
silencing when introduced into the sugarcane genome.
A sequence homology of 68% was observed between the two promoters following
sequence analysis. This proved to be a valuable finding since it shows the close genetic
relationship that is shared between maize and sugarcane. Although they are close
monocotyledonous relatives they still show differences in their promoter sequences. The
differences between the sequences involved numerous substitutions, deletions and
differences in the types of transcription factors identified. This is significant to this
project since gene silencing as a result of DNA-DNA pairing could pose a great
problem in the use of this promoter for driving transgene expression in sugarcane.
Having this degree of sequence divergence could help to lower the chances of gene
silencing when the maize5-pro is introduced into the sugarcane genome. In the nopaline
synthase promoter-based system, the extent of promoter homology was about 300bp
(Matzke and Matzke, 1993) and no gene silencing was observed. However, when
Vaucheret (1993) investigated the 35Spro-based system silencing was observed
even when promoter homology comprised only 90bp. Therefore 90bp is probably not
enough for direct DNA-DNA pairing; it still does not eliminate the possibility of
recognition of DNA sequence homology. Rossignol and Faugeron (1994) showed for
direct DNA-DNA interaction, the homology between promoter sequences should
exceed a minimum length of about 300 bp.
Following detailed sequence analysis of the promoter region obtained, several

96
promoter elements that are common in other plant promoters were identified. The
TATA box sequences identified were identical and both were located 30 nucleotides
from the TSS. For both the promoter sequences the distance between the putative
CAAT-like boxes and the TSS was greater than the average of 80 bp reported for
several plant promoters. The presence of a TATA box sequence categorises the SS
gene promoter from maize as a TATA box- containing promoter as classified by Joshi
(1987). The localisation of the TATA-box and TSS in the maize promoter is compatible
with the results previously obtained by Joshi (1987) for 79 higher plants. It must be
noted that the distance between the putative TATA-box and the TSS for this promoter
(30 bp) falls in the range of 32± 7 bp as determined by Joshi (1987). Having identified
the ATG, the length of the 5'UTR leader sequence was calculated using the distance
between the transcriptional start site obtained from the NNP software program and the
ATG start codon. According to Joshi (1987) the length of the leader sequence varies
from 9 to 193 bp, which agrees with the 150 bp distance obtained for the maize
promoter.
The promoter region was analysed for cis-regulatory elements, a number of conserved
DNA motifs were observed. However, it must be noted that since transcription factor
genes encoding proteins are short stretches of DNA sequences, there is a high
probability of finding random sequences in the promoter which have no significance.
The analysis of the promoter regions for both maize and sorghum showed a sharing of
ten similar transcription factors (DOFCOREZM, GATA-box, ABRE,
CACTFTPPCA1, ANAERO2CONSENSUS, ANAERO1CONSENSUS,
CGACGOSAMY3, BOXCPSAS1, MYBCORE and ARFAT transcription factors).
This further confirms that maize and sorghum share a degree of sequence homology
due their close genetic relation.
Specific transcription factors, Dof proteins, are plant-specific transcription factors which
interact with a wide variety of promoters of plant-specific genes in both
monocotyledonous and dicotyledonous (maize, barley, Arabidopsis, tobacco and
pumpkin) (Yanagisawa, 2000). Maize Dof1 was found to activate transcription from
synthetic promoters to varying extents in greening and etiolated protoplasts. But of
greater significance to this project is the findings of Yanagisawa (2000) in which Dof
1 regulates the activities of the cyppdk and dpepcZm2A promoters as well as the C4pepc

97
promoter in maize mesophyll protoplasts. Therefore, it is likely that Dof proteins may
play regulatory roles in the co-ordinated expression of genes related to the plant-
specific pathway for carbon metabolism. This could therefore provide insight to the
function of the SS gene in the stems of maize and sugarcane since it is in the stems of
sugarcane that sucrose accumulation takes place.
The MYB gene family represents one of the largest regulatory factor families in plants.
One of the most important functions for MYB factor is to control development and
determine cell fate and identity (Stracke et al., 2001). Studies carried out by Gavnholt
et al. (2002) showed that MYB recognition sites were also identified in the promoter
region of LpLAC5-4 laccase from ryegrass which is involved in lignin
polymerisation. Furthermore, MYB transcription factors are involved in regulation of
signal transduction pathways responding to plant growth regulators as well as in the
regulation of the branch of phenylpropanoid metabolism involved in lignin
formation (Martin and Paz-Ares, 1997). MYB genes are thought to play a role in the
lignification process since they are highly expressed in xylem tissues thus
supporting the idea that this promoter drives a stem-specific gene. Although the
function of this gene is unknown, it could play a role in the lignification process in the
stem.
The presence of the MYB recognition sites, the plant-specific Dof motif, light responsive
elements and phytohormone-responsive elements in the promoter sequence might
play a role in the processes that occur in the stem tissues, thus providing a broad but
inconclusive role for the SS gene in the sugarcane stem.
The final step in this project was the incorporation of the promoter region into a test
construct by fusing the candidate promoter to the reporter gene GUS. This project set
out to obtain GUS constructs, one with and one without the intron and from there
make comparisons with respect to their influence on the level of gene expression in
sugarcane. Introns are intervening sequences present in the pre-mRNA but absent in
the mature RNA. Introns inserted inside the coding region of the reporter gene have
been shown to enhance gene expression (Tanaka et al., 1990). Further research by Rose
(2004) showed that mRNA accumulation in transgenic plants declined with distance from

98
the promoter. In that work, measurements of GUS enzyme activity revealed that the
intron elevated GUS activity. The findings supported the model in which introns
increase transcription and promote translation. A GUS construct with the intron was
obtained from this study.
The construct (GUS-maize5-pro), the main product of this study, is currently being
used to generate stable transformants in which the isolated promoter activity will be
evaluated in sugarcane. Transformation will be carried out by microprojectile
bombardment of sugarcane embryogenic callus with the GUS-maize5-pro construct
and subsequent selection and growth of transformants. Future analytical work will
involve GUS assay analysis of various tissues of these transgenic sugarcane plants.
Histochemical localisation of GUS-activity and GUS activity assays would
determine the functionality and strength of this promoter (Nitz et al., 2001, Rose,
2004). The results envisaged would be the expression of the GUS gene specifically
in the stem tissues of sugarcane.
If the maize5-pro proves to be functional, tissue specific and stable in sugarcane, it
will be of great significance to the transgenic programme at SASRI. It will help to
target transgene expression in the stem tissue thus reducing the impact on non-target
tissue. The isolated promoter may be used to manipulate certain aspects of metabolism
and increase pathogen resistance in the stem of sugarcane. For instance, the
manipulation of sucrose accumulation in the stem or successful control of stem
borer will largely depend on the availability of promoters that are specific to or highly
active in stem tissues. Therefore strong stem-specific promoters would be very valuable
for crop improvement research. Manipulation of these crucial factors will be invaluable
in enhancing the productivity and economic well-being of the South African sugar
industry.
99
References
Ahn, S., Anderson, J.A., Sorrels, M.E. and Tanksley, S.D. 1993. Homoeologous
relationships of rice, wheat and maize chromosomes. Molecular and General Genetics
241: 483-490.
Aida, R. Ohira, K., Tanaka, Y., Yoshia, K. and Kishimoto, S. 2004. Efficient transgene
expression in Chrysanthemum, Dendranthema grandiflorum (Ramat.) Kitamura, by using
the promoter of a gene for Chrysanthemum chlorophyll-a/b-binding protein. Breeding
Science 54: 51-58.
Alberts, B., Johnson, A., Lewis, J., Raff, M., Roberts, K. and Walter, P. 2002. Molecular
biology of the cell, 4th edition. New York: Garland Science.
Al-Janabi, S.M., McClelland, M., Peterson, C. and Sobral, B.W.S. 1994. Phylogenetic
analysis of organellar DNA sequences in the Andropogoneae: Saccharinae. Theoretical
and Applied Genetics 88: 933-944.
Allsopp, P. G., Shepherd, K. M., Smith, G. R., Cox, M. C. and Robertson, S. K. 1997.
Use of host-plant resistance as a component in IPM for canegrubs. In: Allsopp, P.
G., Rogers, D. J. and Robertson, L. N. (eds). Soil Invertebrates. BSES, Brisbane, pp
102-105.
Allsopp, P.G. and Manners, J.M. 1997. Novel approaches for managing pests and
diseases in sugarcane. In Keating, B.A. and Wilson, J.R. (eds.) Intensive sugarcane
production: meeting the challenge beyond 2000. Wallingford: CAB International 173-
188.
Allsopp, P.G. and Suasa-ard, W. 2000. Sugarcane pest management strategies in the new
millennium. Prodeeings of the International Society of Sugar Cane Technologists.
Sugarcane Entomology workshop, Khon Kaen 4.

100
Altschul, S.F., Gish, W., Miller, W., Meyers, E.W. and Lipman, D.J. 1990. Basic Local
Alignment Search Tool. Journal of Molecular Biology 215: 403-410.
Amedeo, P., Habu, Y., Afsar, K., Scheid, O.M. and Paszkowski, J. 2000. Disruption of
the plant gene MOM releases transcriptional silencing of methylated genes. Nature 405:
203-206.
An, G. and Kim, Y.S. 1993. Techniques for isolating and characterising plant
transcription promoters, enhancers, and terminators. In Glick, B., Thompson, J. (eds.)
Methods in plant molecular biology and biotechnology. C.R.C Press, London, pp 155-
166.
Ancillo, G., Hoegen, E. and Kombrink, E. 2003. The promoter of the potato chitinase C
gene directs expression to epidermal cells. Planta 217: 566-576.
Annadana, S., Beekwilder, M.J., Kuipers, G., Visser, P.B., Outchkourov, N., Pereira, A.,
Udayakumar, M., De Jong, J. and Jongsma, M.A. 2002. Cloning of the chrysanthemum
UEP1 promoter and comparative expression in florets and leaves of Dendranthema
grandiflora. Transgenic Research 11: 437-445.
Anonymous 2000. South African Sugar Association Industry directory. Published by
SASA Public Affairs Division.
Anonymous 2003. Sugarcane Diseases in Southern Africa.
Anonymous 2003. South African Sugar Association Industry directory. Published by
SASA Public Affairs Division.
Anonymous 2005. Guide lines and recommendations for Eldana control in the SA sugar
industry.

101
Anonymous 2005. South African Sugar Association industry directory. Published by
SASA Public Affairs Division.
Anonymous 2006. South African Sugar Association industry directory. Published by
SASA Public Affairs Division.
Arceneaux, G. 1965. Cultivated sugarcanes of the world and their botanical derivatives.
Proceedings of the 12th International Society for Sugar Cane Technologists: 844-855.
Arencibia, A., Molina, P.R., de la Riva, G. and Selman-Housein, G. 1995. Production of
transgenic sugarcane (Saccharum officinarum L.) plants by intact cell electroporation.
Plant Cell Reports 14: 305-309.
Arencibia, A., Vazquez, R.I., Prieto, D., Tellez, P., Carmon, E.R., Coego, A., Hernandez,
L., de la Riva, G.A. 1997. Transgenic sugarcane plants resistant to stem borer attack.
Molecular Breeding 3: 247-255.
Arencibia, A.D., Carmona, E.R., Tellez, P., Cahn, M-T, Yu, S-M, Trujilo, L.E. and
Oramas, P. 1998. An efficient protocol for sugarcane (Saccha rum spp. L.)
transformation mediated by Agrobacterium tumefaciens. Transgenic Research 7: 213-
222.
Arias, J.A., Dixon, R.A. and Lamb, C.J. 1993. Dissection of the functional architecture
of a plant defence gene promoter using a homologous in vitro transcription initiation
system. Plant Cell 5: 485-496.
Atkinson, R.G., Bolitho, K.M., Wright, M.A., Iturriagagoitia-Bueno, T., Reid, S.J. and
Ross, G.S. 1998. Apple ACC-oxidase and polygalacturonases ripening-specific gene
expression and promoter analysis in transgenic tomato. Plant Molecular Biology 38:
449-460.
102
Babu, C.N. 1974. Sugarcane. Allied Publishers Limited: New Delhi 10: pp 90-96.
Bade, J., van Grinsven, E., Custers, J., Hoekstra, S. and Ponstein, A. 2003. T-DNA
tagging in Brassica napus as an effiiceint tool for the isolation of new promoters for
selectable marker genes. Plant Molecular Biology 52: 53-68.
Barba, R. and Nickell, L.G. 1969. Nutrition and organ differentiation in tissue culture of
sugarcane – a monocotyledon. Planta 89: 299-302.
Barnes, A.C. 1974. The sugarcane. 2nd edition. Leonard Hill Books, London UK, pp
572.
Baruah, J., Harwood, W.A., Lonsdale, D.A., Harvey, A., Hull, R. and Snape, J.W. 1999.
Luciferase as a reporter gene for transformation studies in rice (Oryza sativa L.). Plant
Cell Reports 18: 715-720.
Bass, B.L. 2000. Double-stranded RNA as a template for gene silencing. Cell 101: 235-
238.
Bennetzen, J.L. and Freeling, M. 1993. Grasses as a single genetic system: Genome
composition, collinearity and compatibility. Trends in Genetics 9: 259-26 1.
Bennetzen, J.L., Chandler, V.L. and Schnable, P. 2001. National science foundation-
sponsored workshop report. Maize genome sequencing project. Plant Physiology 127:
1572-1578.
Bent, E., Johnson, S. and Bancroft, I. 1998. BAC representation of two low-copy regions
of the genome of Arabidopsis thaliana. Plant Journal 13: 849-855.
Berding, N. and Roach, B.T. 1987. Germplasm collection, maintanence, and use. In:
Heinz, D.J. (ed.) Sugarcane Improvement through breeding. pp 143-210.

103
Berding, N., Hogarth, M. and Cox, M. 2004. Plant improvement of sugarcane. In:
James, G.L. (ed.) Sugarcane 2nd edition. Blackwell Science, Oxford, UK, pp 20-53.
Bhullar, S., Chakravarthy, S., Advani, S., Datta, S., Pental, D. and Burma, P.K. 2003.
Strategies for development of functionally equivalent promoters with minimum sequence
homology for transgene expression in plants: cis-Elements in a novel DNA context
versus domain swapping. Plant Physiology 132: 988-998.
Binelli, G., Gianfranceschi, L., Pe, M.E., Taramino, G., Busso, C., Stenhouse, J. and
Ottaviano, E. 1992. Similarity of maize and sorghum genomes as revealed by maize
RFLP probes. Theoretical and Applied Genetics 84: 10-16.
Birch, R.G., Bower, R. Elliot, A., Potier, B., Franks, T. and Cordeiro, G. 1995.
Expression of foreign genes in sugarcane. In Cock, J.H., Brekelbaum, T. (eds.)
International Society of Sugar Cane Technologists, Cartagena, Columbia 22: 368-373.
Birch, R.G. 1996. New gene technologies and their potential value for sugarcane.
Outlook Agriculture 25: 2 19-226.
Birch, R.G. 1997. Plant transformation: Problems and strategies for practical
application. Annu Rev Plant Physiol Plant Mol Biol. 48: 297-326.
Botha, F.C. and Whittaker, A. 1995. Sucrose accumulation in sugarcane: regulation of
carbon flow between competing pathways and expression of key enzymes. International
Society of Sugarcane Technologists.
Botha, F.C. and Vorster, D.J. 1999. Analysis of carbon partitioning to identify metabolic
steps limiting sucrose accumulation. In Singh, V. and Kumar, V. (eds.) Proceedings of
the International Society of Sugar Cane Technologists 23: 259-272.
104
Botha, F.C., Sawyer, B.J.B. and Birch, R.G. 2001. Sucrose metabolism in the stem of
transgenic sugarcane with reduced soluble acid invertase activity. In Hogarth, D.M. (ed.)
Proceedings of the International Society of Sugar Cane Technologists 24: 588-591.
Bourdon, V., Harvey, A. and Lonsdale, D.M. 2001. Introns and their positions affect the
translation activity of mRNA in plant cells. EMBO Reports 2: 394-398.
Boutry, M. and Chua, N.H. 1985. A nucelar gene encoding the beta subunit of the
mitochondrial ATPase in N.plumbaginifolia. EMBO Journal 4: 2159-2165.
Bower, R. and Birch, R.G. 1992. Transgenic sugarcane plants via microprojectile
bombardment. The Plant Journal 2: 409-416.
Bower, R., Elliott, A.R., Potier, B.A.M. and Birch, R.G. 1996. High-efficiency,
microprojectile-mediated cotransformation of sugarcane, using visible or selectable
markers. Molecular Breeding 2: 239-249.
Braithwaite, K.S., Geijskes, R.J. and Smith, G.R. 2004. A variable regions of the SCBV
genome can be used to generate a range of promoters for transgene expression in
sugarcane. Plant Cell Reports 23: 3 19-326.
Breitler, J.C., Labeyrie, A., Meynard, D. and Legavre, T. 2002. Efficient microprojectile
bombardment-mediated transformation of rice using gene cassettes. Theoretical and
Applied Genetics 104: 709-719.
Bremer, G. 1961. Problems in breeding and cytology of sugarcane. IV The origin of the
increase of chromosome number in species hybrids Saccharum. Euphytica 10: 325-342.
Brett, P.G.C. 1951. Flowering and pollen fertility in relation to sugarcane breeding in
Natal. Proceedings of the International Society of Sugar Cane Technologists 7: 43-46.

105
Brett, PGC. 1974. Early experiments on the artificial induction of flowering at Mount
Edgecombe. Proceedings of the South African Sugar Technologists Association 48: 78-
79.
Bucchini, L. and Goldman, L. R. 2002. Starlink corn: a risk analysis. Environmental
and. Health Perspective. 110: 5-13.
Budiman, M. A., Mao, L., Wood, T. C. and Wing, R. A. 2007. A deep-coverage tomato
BAC library and prospects toward development of an STC framework for genome
sequencing. Genome Research 10: 129-136.
Bugos, R., Chiang, V., Zhang, X., Campbell, E., Podia, G. and Campbell, W. 1995. RNA
isolation from plant tissues recalcitrant to extraction in quanidine. Biotechniques 19:
734-737.
Bull, T. A. and Glasziou, K.T 1963. The evolutionary significance of sugar accumulation
in Saccharum. Australian Journal of Biological Sciences 16: 737-742.
Burner, D.M. and Legendre, B.L. 1994. Cytogenetic and fertility characteristics of elite
sugarcane clones. Sugar Cane 1: 6-10.
Burner, D.M. and Grisham, M.P. 1995. Induction and stability of phenotypic variation in
sugarcane as affected by propagation procedure. Crop Science 35: 875-880.
Butler, J.E.F. and Kadonaga, J.T. 2002. The RNA polymerase II core promoter: a key
component in the regulation of gene expression. Genes Development 16: 2583-2592.
Butterfield, M.K. and Thomas, D.W. 1996. Sucrose, yield and disease resistance
characteristics of sugarcane cultivars under test in the SASEX selection programme.
Proceedings of the South African Sugar Technologists Association 70: 103-105.

106
Butterfield, M.K., D’Hont, A. and Berding, N. 2001. The sugarcane genome: a synthesis
of current understanding, lessons for breeding and biotechnology. Proceedings of the
South African Sugar Technologists Association 75: 1-5.
Callis, J., Fromm, M. and Walbot, V. 1987. Introns increase gene expression in cultured
maize cells. Genes Development 1: 1183-1200.
Callis, J., Raasch, J.A. and Vierstra, R.D. 1990. Ubiquitin extension proteins of
Arabidopsis thaliana. Structure, localization, and espression of their promoters in
transgenic tobacco. Journal of Biology and Chemistry 265: 12486-12493.
Carson, D.L. and Botha, F.C. 2002. Genes expressed in sugarcane maturing internodal
tissue. Plant Cell Reports 20: 1075-1081.
Chandrasekharan, M.B., Bishop, K.J. and Hall, T.C. 2003. Module-specific regulation of
the β-phaseolin promoter during embyrogenesis. Plant Journal 33: 853-866.
Chareonpornwattana, S., Thara, K. V., Wang, L., Datta, S. K., Panbangred, W. and
Muthukrishnan, S. 1999. Inheritance, expression, and silencing of a chitinase transgene
in rice. Theoretical and Applied Genetics 98: 3-4.
Chen, P-W., Lu, C-A., Yu, T-S., Tseng, T-H., Wang, C-S. and Yu, S-M. 2002. Rice α-
amylase transcriptional enhancers direct multiple mode regulation of promoters in
transgenic rice. JBC Papers, Manuscript M109722200.
Cheng, M., Fry, J.E., Pang, S., Zhou, H., Hironaka, C.M., Duncan, D.R., Conner, T.W.
and Wan,Y. 1997. Genetic transformation of wheat mediated by Agrobacterium
tumefaciens. Plant Physiology 115: 97 1-980.
107
Chowdhury, M.K.U. and Vasil, I. 1993. Molecular analysis of plants regenerated from
embyrogenic cultures of hybrid sugarcane cultivars (Saccharum spp.). Theoretical and
Applied Genetics 86: 18 1-188.
Christensen, A.H. and Quail, P.H. 1996. Ubiquitin promoter-based vectors for high-level
expression of selectable and/or screenable marker genes in monocotyledonous plants.
Transgenic Research 5: 213-318.
Christou, P., McCabe, D.E. and Swain, W.F. 1988. Stable transformation of soybean
callus by DNA-coated gold particles. Plant Physiology 87: 67 1-674.
Christou, P. 1995. Strategies for variety-independent genetic transformation of important
cereals, legumes and woody species utilising particle bombardment. Euphytica 85: 13-
27.
Christou, P. 1997. Rice transformation: bombardment. Plant Molecular Biology 35:
197-203.
Church, G.M. and Gilbert, W. 1984. Genomic sequencing. Proceedings of the National
Academy of Science USA 81: 1991-1995.
Claes, B., Smalle, R., Dekeyser, R., Van Montagu, M. and Caplan, A. 1991. Organ-
dependent regulation of a plant promoter isolated from rice by ‘promoter-trapping’ in
tobacco. The Plant Journal 1 (1): 15-26.
Cooley, J., Ford, T. and Christou, P. 1995. Molecular and genetic characterisation of
elite transgenic rice plants produced by electric-discharge particle acceleration.
Theoretical and Applied Genetics 90: 97-104.
Covey, S.N., Al-Kaff, N.S., Lángara, A. and Turner, D.S. 1997. Plants combat infection
by gene silencing. Nature 385: 781-782.

108
Cuadrado, A., Acevedo, R., Moreno Díaz de la Espina, S. Jouve, N. and de la Torre, C.
2004. Genome remodeling in three modern S. officinarum x S. spontaneum sugarcane
cultivars. Journal of Experimental Botany 55: 847-854.
Dale, J.L., Harding, R.M., Burns, T.M. and Karan, M. 1994. The sequences of banana
bunchy top virus and uses thereof. Patent application 08/202, 186 USA.
Daniels, J. and Roach, B.T. 1987. Taxonomy and Evolution. In:DJ Heinz (ed.)
Developments in Crop Science 11: Sugarcane improvement through breeding. Elsevier,
Amsterdam, pp 7-84.
Datla, R., Anderson, J.W. and Selvaraj, G. 1997. Plant promoters for transgene
expression. Biotechnology Annual Review 3: 269-296.
de Andrade, A., Teixeira, P. R., Siviero, F. and Santelli, R. V. 2005. A shortcut in phage
screening technique. Genetics and Molecular Biology 28: 150-151.
de Maagd R.A., Bosch, D. and Stiekema, W. 1999. Bacillus thuringiensis toxin-mediated
insect resistance in plants. Trends in Plant Science 4: 9-13.
Dey, N. and Maiti, I.B. 1999. Structure and promoter/leader deletion analysis of
mirabilis mosaic virus (MMV) full-length transcript promoter in transgenic plants. Plant
Molecular Biology 40: 77 1-782.
D’Hont, A., Grivet, L., Feldman, P., Rao, S., Berding, N. and Glaszmann, J.C. 1996.
Characterisation of the double genome structure of modern sugarcane cultivars
(Saccharum spp.) by molecular genetics. Molecular and General Genetics 250: 405-4 13.
D’Hont, A., Ison, D., Alix, K., Roux, C. and Glaszmann, J.C 1998. Determination of
basic chromosome numbers in the genus Sachharum by physical mapping of ribosomal
RNA genes. Genome Research 41: 221-225.

109
Doebley, J., Stec, A., Wendel, J. and Edwards, M. 1990. Genetic and morphological
analysis of a miaze-teosinte F2 population: Implications for the origin of maize.
Proceedings of the National Academy of Sciences USA 87: 9888-9892.
Dunker, B.P., Davies, P.L. and Walker, V.K. 1997. Introns boost transgene expression in
Drosophila melanogaster. Molecular and General Genetics 254: 29 1-296.
Edwards, J. W. and Coruzzi, G. M. 1990. Cell-specific gene expression in plants. Annual
Review of Genetics 24: 275-303.
Elliott, A.R., Campbell, J.A., Brettell, R.I.S. and Grof, C.P.L. 1998. Agrobacterium-
mediated transformation of sugarcane using GFP as a screenable marker. Australian
Journal of Plant Physiology 25: 739-743.
Ellis, J., Llewellyn, D., Walker, J., Dennis, E. and Peacock, W. 1987. The OCS element:
a 16 base pair palindrome essential for activity of the octopine synthase enhancer.
EMBO Journal 6: 3203-3208.
Estruch, J.J., Carozzi, N.B., Desai, N., Duck, N.B., Warren, G.W. and Koziel, M.G.
1997. Transgenic plants: an emerging approach to pest control. Nature Biotechnology
15: 137-141.
Fagard, M. and Vaucheret, H. 2000. Systemic silencing signal (s). Plant Molecular
Biology 43: 285-293.
Falco, M.C., Neto, A.T. and Ulian, E.C. 2000. Transformation and expression of a gene
for herbicide resistance in Brazilian sugarcane. Plant Cell Reports 19: 1188-1194.
Fang, R.X., Nagy, F., Sivasubramaniam, S. and Chua, N.H. 1989. Multiple cis regulatory
elements for maximal expression of the cauliflower mosaic virus 35S promoter in
transgenic plants. Plant Cell 1:141-150.

110
FAS 2001. World sugar situation. U.S. Department of Agriculture, Foreign Agricultural
Service. HUhttp://www.fas.usda.gov/htp/sugar/2001/nov/sugsit.htm;UH verfified 21 January
2005.
Ficker, M., Wemmer, T. and Thompsom, R. D. 1993. A promoter directing high level
expression in pistils of transgenic plants. Plant Mol. Biol. 35: 425-431.
Finnegan, E.J. 2001. Is plant gene expression regulated globally? Trends in Genetics 17:
361-365.
Fitch, M.M.M. and Moore, P.H. 1993. Long term culture of embryogenic sugarcane
callus. Plant Cell Tiss. Organ Cult. 32: 335-343.
Fluhr, R., Kuhlemeier, C., Nagy, F. and Chua, N-H. 1986. Organic-specific and light-
induced expression of plant genes. Science 232: 1106-1112.
Franks, T. and Birch, R.G. 1991. Gene transfer into intact sugarcane cells using
microprojectile bombardment. Australian Journal of Plant Physiology 18: 471-480.
Gahrtz, M., Stolz, J. and Sauer, N. 1994. A phloem specific sucrose H+ symporter from
Plantago major L. supports the model of apoplatic phloem loading. Plant Journal 6: 697-
706.
Gale, M.D. and Devos, K. 1998. Comparative genetics in the grasses. Proceedings of the
National Academy of Sciences USA 95: 1971-1974.
Gallo-Meagher, M. and Irvine, J.E. 1993. Effects of tissue type and promoter strength on
transient GUS expression in sugarcane following particle bombardment. Plant Cell
Reports 12: 666-670.

111
Gallo-Meagher, M. and Irvine, J.E. 1996. Herbicide resistant transgenic sugarcane plants
containing the bar gene. Crop Science 36: 1367-1374.
Garbarino, J. E., Oosumi, T. and Belknap, W. R. 1995. Isolation of a polyubiquitin
promoter and its expression in transfenic potato plants. Plant Physiology 109:1371-1378.
Garside, A.L. 1997. Yield decline research in the Australian sugar industry. Proceedings
of the South African Sugar Technology Association 71: 3-8.
Geijskes, R.J., Wang, L.F., Lakshmanan, P. McKeon, M.G., Berding, N., Swain,R.S.,
Elliott, A.R., Grof, C.P.L., Jackson, J. and Smith, G.R. SmartsettTM seedlings: tissue
culture seed plants for the Australian sugar industry. Sugarcane Int. May/June 13-17.
Gittins, J. R., Pellny, T. L., Hiles, E. R., Rosa, C., Biricolti, S. and James, D. J. 2000.
Transgene expression driven by heterologous ribulose-1,5-bisphospate
carboxylase/oxygenase small-subunit gene promoters in the vegetative tissues on apple
(Malus pumila Mill.). Planta 210: 232-240.
Glasziou, K.T. and Gayler, K.R 1972. Storage of sugars in stems of sugarcane. Botanical
Reviews 38: 471-490.
Goldman, J.J., Hanna, W.W., Fleming, G.H. and Ozias-Akins, P. 2004. Ploidy variation
among herbicide-resistant bermudagrass plants of cv. TifEagle transformed with the bar
gene. Plant Cell Reports 22: 553-560.
Gowik, U., Burscheidt, J., Akyildiz, M. Schlue, U., Koczor, M., Streubel, M. and
Westhoff, P. 2004. The Plant Cell 16: 1077-1090.
Grassl, C.O. 1969. Saccharum names and their interpretation. Proceedings of the
International Society of Sugarcane Technologists, 13.

112
Green, P.J., Kay, S.A. and Chua, N.-H. 1987. Sequence-specific interactions of a pea
nuclear factor with light-responsive elements upstream of the rbcS-3A gene. EMBO
Journal 6: 2543-2549.
Grice, J., Wegener, M.K., Romanach, L.M. and Paton,S. 2003. Genetically modified
sugarcane: A case for alternate products. AgBioForum 6(4): 162-168.
Grivet, L. and Arruda, P. 2002. Sugarcane genomics: depicting the complex genome of
an important tropical crop. Current Opinions in Plant Biology 2: 122-127.
Groenewald , J.H., Groenewald, S., Whittaker, A., Huckett, B.I., and Botha, F.C. 1995.
Molecular agriculture: Prospects for the production of alternative commodities in
sugarcane through genetic engineering. Proceedings of the South African Sugar
Technologists Association 69: 14-20.
Groenewald, J.H. and Botha, F.C. 2001. Manipulating sucrose metabolis with a single
enzyme: pyrophosphate-dependent phosphofructokinase (PFP). Proceedings of the
South African Sugar Technology Association 75: 10 1-103.
Grof, C.P.L., Campbell, J.A., Quick, W.P., Sonnewald, U. and Glassop, D. 1996a.
Molecular manipulation of sucrose phosphate synthase in sugarcane. In Wilson, J.R.,
Hogart, D.M., Campbell, J.A. and Garside, A.L. (Eds.) ‘Sugarcane: research towards
efficient and sustainable production’ (CSIRO Division of Tropical Crops and Pastures:
Brisbane), pp 124-126.
Grof, C.P.L., Elliot, A., Glassop, D., Bertram, J.R., Campbell, J.A. and Birch, R.G.
1996b. Differential expression of β-glucuronidase in sugarcane under the control of the
rice rubisco small subunit promoter. In Wilson, J.R., Hogart, D.M., Campbell, J.A. and
Garside, A.L. (Eds.) Sugarcane: research towards efficient and sustainable production.
(CSIRO Division of Tropical Crops and Pastures: Brisbane), pp. 120-123.

113
Grof, C.P.L. and Campbell, J.A. 2001. Sugarcane sucrose metabolism: scope for
molecular manipulation. Australian Journal of Plant Physiology 28: 1-12.
Guilfoyle, T. 1997. The structure of plant gene promoters. In Setlow, J. (ed.) Genetic
engineering Vol 19. Plenum Press, New York, pp 15-47.
Guimaráes, C.T., Sills, G.R. and Sobral, B.W.S. 1997. Comparative mapping of
Andropogoneae: Saccha rum L. (sugarcane) and its relation to sorghum and maize.
Proceedings of the National Academy of Science USA 94: 14261-14266.
Hadi, M.Z., McMullen, M.D. and Finer, J.J. 1996. Transformation of 12 different
plasmids into soybean via particle bombardment. Plant Cell Reports 15: 500-505.
Hamilton, A.J., Fray, R.G. and Grierson, D. 1995. Sense and antisense inactivation of
fruit ripening genes in tomato. Current Topics in Microbiology and Immunology. 197:
77-89.
Hansen, G. and Wright, M.S. 1999. Recent advances in the transformation of plants.
Trends in Plant Science 4: 226-23 1.
Hansom, S., Bower, R., Zhang, L., Potier, B., Elliot., A., Basnayake, S., Cordeiro, G.,
Hogart, D.M., Cox, M., Berding, N. and Birch, R.G. 1999. Regulation of transgene
expression in sugarcane. In: Singh, V. and Kumar, V. (Eds.) Proceedings of the
International Society of Sugar Cane Technologists. New Delhi 23: 278-289.
Harrison, D., Waldron, J., Ramage, C., Peace, C., Cox, M., Birch, R.G. and Carrol, B.J.
2001. New DNA technologies provide insight into the molecular basis of somaclonal
variation in sugarcane. Proceedings of the International Sugar Cane Technologists,
Australia 24: 580-582.
114
Harvey, M. and Botha, F.C. 1996. Use of PCR-based methodologies for the
determination of DNA diversity between Saccharum cultivars. Euphytica 89: 257-265.
Heinz, D.J. and Mee, G.W.P. 1969. Plant differentiation from callus tissue of
Saccharum species. Crop Science 9: 346-348.
Heinz, D.J. and Mee, G.W.P. 1971. Morphologic, cytogenic, and enzymatic variation in
Saccha rum species hybrid clones derived from callus tissue. American Journal of
Botany58: 257-262.
Hiei, Y., Ohta, S., Komari, T. and Kumashiro, T. 1994. Efficient transformation of rice
(Oryza sativa L.) mediated by Agrobacterium and sequence analysis of the boundaries of
the T-DNA. Plant Journal 6: 27 1-282.
Higo, K., Ugawa, Y., Iwamoto, M. and Higo, H. 1998. PLACE: a database of plant cis-
acting regulatory DNA elements. Nucleic Acids Research 26: 358-359.
Higo, K., Ugawa, Y., Iwamoto, Korenaga, T. 1999. Plant cis-acting regulatory DNA
elements (PLACE) database. Nucleic Acids Research 27: 297-300.
Hillis, D.M. and Davis, K. 1986. Evolution of ribosomal DNA: fifty million years of
recorded history in the frog genus Rana. Evoution 40: 1275-1288.
Hillis, D.M. and Moritz, C. 1990. An overview of applications in molecular systematics.
In Hillis, D.M. and Moritz, C. (Eds.) Molecular Systematics. Sinauer Associates,
Sunderland, MA.
Hoy, J.W., Bischoff, K.P., Milligan, S.B. and Gravois, K.A. 2003. Effect of tissue
culture explant source on sugarcane yield components. Euphytica 129: 237-240.

115
Hulbert, S.H., Richter, T.E., Axtell, J.D. and Bennetzen, J.L. 1990. Genetic mapping and
characterization of sorghum and related crops by means of maize DNA probes.
Proceedings of the National Academy of Sciences USA 87: 425 1-4255.
Hwang, Y.S., Karrer, E.E., Thomas, B.R., Chen, L. and Rodriguez, R.L. 1998. Three cis-
elements required for rice alpha-amylase Amy3D expression during sugar starvation.
Plant Molecular Biology 36: 33 1-341.
Ingelbrecht, I.L., Mandelbaum, C.I. and Mirkov, T.E. 1998. High sensitive Northern
hybridisation using a rapid protocol for downward alkaline blotting of RNA.
Biotechniques 25: 420-425.
Ingelbrecht, I.L. Irvine, J.E. and Mirkov, T.E. 1999. Post transcriptional gene silencing
in transgenic sugarcane. Dissection of homology-dependent virus resistance in a
monocot that has a complex polyploidy genome. Plant Physiology 119: 1187-1197.
Irvine, J.E. and Benda, G.T.A. 1985. Sugarcane mosaic virus in plantlets regenerated
from diseased leaf tissue. Plant Cell, Tissue and Organ Culture 5: 101-106.
Irvine, J.E. and Mirkov, T.E. 1997. The development of genetic transformation of
sugarcane in Texas. Sugar Journal 60: 25-29.
Ishida, Y., Saito, H., Ohta, S., Hiee, Y., Komari, T. and Kumshiro, T. 1996. High
efficiency transformation of maize (Zea mays L.) mediated by Agrobacterium
tumefaciens. Nature Biotechnology 14: 745-750.
Ishiguro, S. and Nakamura, K. 1992. The nuclear factor SP8BF binds to the 5'-upstream
regions of three different genes encoding for major proteins of sweet potato tuberous
roots. Plant Molecular Biology 18: 97-108.

116
Jacobsen, K.R., Fisher, D.G. and Moore, P.H. 1992. Developmental changes in the
anatomy of the sugarcane stem in relation to phloem unloading and sucrose storage.
Botanica Acta 105: 70-80.
Jain, M., Sharma, P., Tyagi, S.B., Tyagi, A.K. and Khurana, P. 2007. Light regulation
and differential tissue-specific expression of phototropin homologues from rice (Oryza
sativa spp. indica). Plant Science 172: 164-17 1.
James, G.L. 2004. James, G.L. (ed.) Sugarcane.
Jeddeloh, J.A., Stokes, T.L. and Richards, E.J. 1999. Maintenance of genomic
methylation requires a SW12/SNF2-like protein. Nature Genetics 22: 94-97.
Joshi, C. 1987. An inspection of the domain between putative TATA box and translation
start site in 79 plant genes. Nucleic Acids Research 15: 6643-6653.
Joyce, P.A., McQualter, R.B., Handley, J.A., Dale, J.L., Harding, R.M. and Smith, G.R.
1998. Transgenic sugarcane resistant to sugarcane mosaic virus. Proceedings of the
Australian Society of Sugar Cane Technologists 20: 204-210.
Kehoe, D.M., Degenhardt, J.,Winicov, I and Tobin, E.M. 1994. Two 10-bp regions are
critical for phytochrome and regulation of a Lemna gibba Lhcb gene promoter. Plant
Cell 6: 1123-1134.
Kellogg, E.A. and Birchler, J.A. 1993. Linking phylogeny and genetics: Zea mays as a
tool for phylogenetic studies. Systemic Biology 42: 415-439.
Kellogg, E.A. 2001. Evolutionary history of the grasses. Plant Physiology 125: 1198-
1205.

117
Kinney, A.J. 1996. Development of genetically engineered soybean oils for food
applications. Journal of Food Lipids 3: 273-292.
Koltunow, A. M., Truettner, J., Cox, K. H., Walroth, M. and Goldberg, R. B. 1990.
Different temporal and spatial gene expression patterns occur during anther development.
Plant Cell 2: 1201-1224.
Koyama, T., Ono, T., Shimizu, M., Jinbo, T., Mizuno, R., Tomita, K., Mitsukawa, N.,
Kawazu, T., Kimura, T., Ohmiya, K. and Sakka, K. 2005. Promoter of Arabidopsis
thaliana phosphate transporter gene drives root-specific expression of transgene in rice.
Journal of Bioscience and Bioengineering 99 (1): 38-42.
Koziel, M.G., Beland, G.L., Bowman, C., Carozzi, N.B., Crenshaw, R., Crossland, L.,
Dawson, J., Desai, N., Hill, M. and Kadwell, S. 1993. Field performance of elite
transgenic maize plants expressing an insecticidal protein derived from Bacillus
thuringiensis. Bio/Technology 11: 194-200.
Lakshmanan, P., Geijskes, R.J., Aitken, K.S., Grof, C.L., Bonnett, G.D. and Smith, G.R.
2005. Invited Review: Sugarcane biotechnology: The challenges and opportunities. In
Vitro Cellular and Developmental Biology – Plant 41: 345-363.
Larkin, P.J. and Scowcroft, W.R. 1981. Somaclonal variation - a novel source of
variability from cell cultures for plant improvement. Theoretical and Applied Genetics
60: 197-214.
Last, D.L., Brettell, R.I.S., Chamberlain, D.A., Chaudhury, A.M., Larkin, P.J. and Marsh,
E.L. 1991. pEmu: an improved promoter for gene expression in cereal cells. Theoretical
and Applied Genetics 81: 581-588.
Lee, T.S.G. 1987. Micropropagation of sugarcane (Saccharum spp.). Plant Cell, Tissue
and Organ Culture 10: 47-55.

118
Legaspi, J.C. and Mirkov, T.E. 2000. Evaluation of trangenic sugarcane against
stemborers. In Allsopp, P.G., Suasa-ard, W. (eds.) Proceedings of the Internation Society
of Sugar Cane Technologists. Sugarcane Entomolgy Workshop, Khon Kaen 4: 68-7 1.
Leibbrandt, N.B. and Snyman, S.J. 2001. Initial field testing of transgenic glufosinate
ammonium-resistant sugarcane. Proceedings of the South African Sugarcane
Technologists Association 75: 108-111.
Leibbrandt, N.B. and Snyman, S.J. 2003. Stability of gene expression and agronomic
performance of a transgenic herbicide-resistant sugarcane line in South Africa. Crop
Science 43: 67 1-677.
Li, X-Q., Zhang, M and Brown, G.G. 1996. Cell-specific expression of mitochondrial
transcripts in maize seedlings. The Plant Cell 8: 1961-1975.
Li, Z., Jayasankar, S. and Gray, D.J. 2001. Expression of a bifunctional green fluorescent
protein (GFP) fusion marker under the control of three constitutive promoters and
enhances derivatives in transgenic grape (Vitis vinifera). Plant Science 160: 877-887.
Lingle, S.E. 1999. Sugar metabolism during growth and development in sugarcane
internodes. Crop Sciences 39: 480-486.
Liu, M.C. In vitro method applied to sugarcane improvement. In: Thorpe, T.A. (ed.)
Plant tissue culture: methods and applications in agriculture. Academic Press, New York
1981: 299-323.
Liu, M.C. 1993. Factors affecting inductionm somatic embryogenesis and plant
regeneration of callus from cultured immature inflorescences of sugarcane. Journal of
Plant Physiology 141: 714-720.

119
Liu, D.W., Oard, S.V. and Oard, J.H. 2003. High transgene expression levels in
sugarcane (Saccharum officinarum L.) driven by the rice ubiquitin promoter RUBQ2.
Plant Science 165: 743-750.
Lorkovic, Z.J., Wieczorek Kirk, D.A., Lambermon, M.H.L. and Filipowicz, W. 2000.
Pre-mRNA splicing in higher plants. Trends in Plant Science 5: 160-167.
Lourens, A.G. and Martin, F.A. 1987. Evaluation of in vitro propagated sugarcane
hybrids for somaclonal variation. Crop Science 27: 793-796.
Ludwig, S.R., Bowen, B., Beach, L. and Wessler, S.R. 1990. A regulatory gene as a
novel visible marker for maize transformation. Science 247: 449-450.
Lunn J. E. and MacRae, E. 2003. New complexities in the synthesis of sucrose. Current
Opinions in Plant Biology 6: 208-214.
Ma, H., Albert, H.H., Paull, R. and Moore, P.H. 2000. Metabolic engineering of
invertase activities in different subcellular compartments affects sucrose accumulation in
sugarcane cells. Australian Journal of Plant Physiology 27: 102 1-1030.
Marton, L., Wullems, G.J., Molendijk, L. and Schilperoort, R.A. 1979. In vitro
transformation of cultured cells from Nicotiana tabacum by Agrobacterium tumefaciens.
Nature 277: 129-13 1.
Mascarenhas, D., Mettler, I.J., Pierce, D.A. and Lowe, H.W. 1990. Intron-mediated
enhancement of heterologous gene expression in maize. Plant Molecular Biology 15:
913-920.
Matsumoto, K., Wassarman, K.M. and Wolffe, A.P. 1998. Nuclear history of a pre-
mRNA determines the translational activity of cytoplasmic mRNA. EMBO Journal 17:
2107-2121.

120
Matzke, M. A. and Matzke, A. J. M. 1993. Genomic imprinting in plants: Parental effects
and trans-inactivation phenomena. Annual Review of Plant Physiology 44: 53-76.
Matzke, A.J.M. and Matzke, M.A. 1995a. Trans-inactivation of homologous sequences
in Nicotiana tabacum. In Meyer, P. (ed.) Gene silencing in higher plants and related
phenomena in other eukaryotes. Springer, Berlin Heidelberg New York, pp 1-14.
Matzke, M.A. and Matzke, A.J.M. 1995b. How and why do plants inactivate
homologous (Trans)genes? Plant Physiology 107: 679-685.
Matzke, M.A. and Matzke A.J.M. 1998. Epigenetic silencing of plant transgenes as a
consequence of diverse cellular defense responses. Cellular and Molecular Life Sciences
54: 94-103.
McElroy, D., Blowers, A.D., Jenes, B. and Wu, R. 1991. Construction of expression
vectors based on the rice actin 1 (Act1) 5’ region for use in monocot transformation.
Molecular and General Genetics 231: 150-160.
McElroy, D. and Brettell, R.I.S. 1994. Foreign gene expression in transgenic cereals.
Trends in Biotechnology 12: 62-68.
Mette, M.F., van der Winden, J., Matzke, M.A. and Matzke, A.J.M. 1999. Production of
aberrant promoter transcripts contributes to methylation and silencing of unlinked
homologous promoters in trans. The EMBO Journal 18: 241-248.
Mette, M.F., Aufsatz, W., van der Winden, J., Matzke, M.A. and Matzke, A.J.M. 2000.
Transcriptional silencing and promoter methylation triggered by double-stranded RNA.
The EMBO Journal 19: 5194-5201.
Meyer, P. and Saedler, H. 1996. Homology-dependent gene silencing in plants. Annual
Review of Plant Physiology Plant Molecular Biology 47: 23-48.

121
Ming, R., Liu, S.C., Moore, P.H., Irvine, J.E. and Paterson, A.H. 2001. QTL Analysis in
a Complex Autopolyploid: Genetic control of sugarcane content in sugarcane. Genome
Research 11: 2075-2084.
Mohanty, B., Krishnan, S.P.T., Swarup, S. and Bajic, V.B. 2005. Detection and
preliminary analysis of motifs in promoters of anaerobically induced genes of different
plant species. Annals of Botany 96 (4): 669-681.
Mol, L.J.N.M., Stuitje, A.R. and van der Krol, A. 1989. Genetic manipulation of floral
pigmentation genes. Plant Molecular Biology 13: 287-294.
Moore, P.H. and Irvine, J.E. 1991. Genomic mapping of sugarcane and its potential
contribution to improvement and to selection of new cultivars. Proceedings of the South
African Sugar Technologists Association 65: 96-102.
Moore, P.H. and Cosgrove, D.J. 1991. Development changes in cell and tissue water
relations parameters in storage parenchyma of sugarcnae. Plant Physiology 96: 794-801.
Moore, P.H. 1995. Temporal and spatial regulation of sucrose accumlation in the
sugarcane stem. Australian Journal of Plant Physiology 22: 66 1-679
Morino, K., Olsen, O. and Shimamoto, K. 2004. Silencing of the Aleurone-specific
Ltp2-gus Gene in transgenic rice is reversed by transgene rearrangements and loss of
aberrant transcripts. Plant Cell Physiology 45: 1500-1508.
Moutia, M. and Dookun, A. 1999. Evaluation of surface sterilisation and hot water
treatments on bacterial contaminants in bud culture of sugarcane. Experimental
Agriculture 35: 265-274.

122
Muhitch, M. J., Liang, H., Rastogi, R. and Sollenberger, K. G. 2002. Isolation of a
promoter sequence from the glutamine synthetase1-2 gene capable of conferring tissue-
specific gene expression in transgenic maize. Plant Science 163: 865-872.
Mukherjee, S. 1957. Origin and distribution of Saccharum. Botanical Gazette, 119.
Mutisya, J., Sathish, P., Sun, C., Andersson, L., Ahlandsberg, S., Baguma, Y., Palmqvist,
S., Odhiambo, B., Aman, P. and Jansson, C. 2003. Starch branching enzymes in sorghum
(Sorghum bicolor) and barley (Hordeum vulgare): Comparative analyses of enzyme
structure and gene expression. Journal of Plant Physiology 160: 92 1-930.
Nakamura, Y. 2002. Towards a better understanding of the metabolic system for
amylopectin biosynthesis in plants: Rice endosperm as a model tissue. Plant Cell
Physiology 43: 718-725.
Ngai, N., Tsai, F.Y. and Coruzzi, G.M. 1997. Light-induced transcriptional repression of
the AS 1 gene: Identification of cis-elements and transfactors. Plant Journal 12: 102 1-
1034.
Nitz, I., Berkefeld, H., Puzio, P.S. and Grundler, F.M.W. 2001. Pyk 10, a seedling and
root specific gene and promoter from Arabidopsis thaliana. Plant Science 161: 337-346.
Nutt, K.A., Allsopp, P.G., McGhie, T.K., Shepherd, K.M., Joyce, P.A., Taylor, G.O.,
McQualter, R.B. and Smith, G.R. 1999. Transgenic sugarcane with increased resistance
to canegrubs. In Hogarth, D.M. (ed.) Proceedings of the Australian Society of Sugar
Cane Technologists 21: 171-176.
Ohta, S., Hattori, T., Morikami, A. and Nakamura, K. 1991. High-level expression of a
sweet potato sporamin gene promoter: β-glucuronidase (GUS) fusion gene in the stems of
transgenic tobacco plants is conferred by multiple cell typespecific regulatory
elements. Molecular Genetics 225: 369-378.
123
Olive, M.R., Walker, J.C., Sing, K., Dennis, E.S. and Peacock, W.J. 1990. Functional
properties of the anaerobic responsive element of the maize Adh1 gene. Plant Molecular
Biology 15: 593-604.
Opsahl-Sorteberg, H-G., Divon, H.H., Nielsen, P.S., Kalla, R., Hammond-Kosack, M.,
Shimamoto, K. and Kohli, A. 2004. Identification of a 49-bp fragment of the HvLTP2
promoter directing aleurone cell specific expression. Gene 341: 49-58.
O’Reilly, G. 1998. The South African sugar industry. International Sugar Journal 100:
266-268.
Osborn, T.C., Chris, P.J., Birchler, J.A., Auger, D.L., Jeffery, C.Z., Lee, H.S., Comai, L.,
Madlung, A., Doerge, R.W., Colot, V. and Martienssen, R.A. 2003. Understanding
mechanisms of novel gene expression in polyploids. Trends in Genetics 19: 141-147.
Ott, R.W. and Chua, N. 1990. Enhancer sequences from Arabidopsis thaliana obtained
by library transformation of Nicotiana tabacum. Molecular and General Genetics 223:
169-179.
Owen, M.D.K. 2000. Current use of transgenic herbicide-resistant soybean and corn in
the USA. Crop Protection 19: 765-77 1.
Palauqui, J.C., Elmayan, T., Pollien, J.M. and Vaucheret, H. 1997. Systemic acquired
silencing: transgene-specific post-transcriptional silencing is transmitted by grafting from
silenced stocks to non-silenced scions. EMBO Journal 16: 4738-4745.
Paszkowski, J. and Whitham, S.A. 2001. Gene silencing and DNA methylation
processes. Current Opinion in Plant Biology 4: 123-129.
124
Permingeat, H.R., Alvarez, M.L., Cervigni, G.D.L., Ravizzini, R.A. and Vallejos, R.H.
2003. Stable wheat transformation obtained without selectable markers. Plant Molecular
Biology 52: 415-419.
Pikaard, C.S. 2001. Genomic change and gene silencing in polyploids. Trends in
Genetics 17: 675-677.
Plesch, G. Ehrhardt, T. and Mueller-Roeber, B. 2001. Involvement of TAAAG elements
suggests a role for Dof transcription factors in guard cell-specific gene expression. Plant
Journal 28: 455-464.
Popelka, J.C., Xu, J. and Altpeter, F. 2003. Generation of rye (Secale cereale L.) plants
with low transgene copy number after biolistic gene transfer and production of instantly
marker-free transgenic rye. Transgenic Research 12: 587-596.
Popelka, J.C. and Altpeter, F. 2003. Agrobacterium tumefaciens-mediated genetic
transformation of rye (Secale cereale L.). Molecular Breeding 11: 203-211.
Potenza, C., Aleman, L. and Sengupta-Gopalan, C. 2004. Invited review: Targeting
transgene expression in research, agricultural and environmental application: Promoters
used in plant transformation. In Vitro Cellular and Developmental Biology-Plant 40: 1-
22.
Price, S. 1967. Interspecific hybridisation in sugarcane breeding. Proceedings of the
International Society of Sugar Cane Technologists 12: 1021-1026.
Ptashne, M. and Gann, A. 2002. Genes and Signals. Cold Spring Harbor, NY: Cold
Spring Harbor Laboratory Press.
125
Rathus, C., Bower, R. and Birch, R.G. 1993. Effects of promoter, intron and enhancer
elements on transient gene expression in sugarcane and carrot protoplasts. Plant
Molecular Biology 23: 613-618.
Rees, M. and Eeckman, F. 1995. New neural network algorithms for improved
eukaryotic promoter site recognition. Genome Science and Technology 1:45.
Rethmeier, N., Seurinck, J., Van Montagu, M. and Corelissen, M. 1997. Intron-mediated
enhancement of transgene expression in maize is a nuclear, gene-dependent process.
Plant Journal 12: 895-899.
Rieping, M. and Schöffl, F. 1992. Synergistic effect of upstream sequences, CAAT box
elements and HSE sequences for enhanced expression of chimaeric heat shock genes in
transgenic tobacco. Molecular and General Genetics 231: 226-232.
Roach, B.T. 1989. Origin and improvement of the genetic base for sugarcane. In
Proceedings of the Australian Society of Sugar Cane Technologists, 11: 492-503.
Rohwer, J.M. and Bothat, F.C. 2001. Analysis of sucrose accumulation in the sugarcane
stem on the basis of in vitro kinetic data. Biochemical Journal 358: 437-445.
Roger, D., Lacoux, J., Lamblin, F., Gaillet, D., Dauchel, H., Klein, D., Balangé, David,
A. and Lainé E. 2001. Isolation of a flax pectin methylesterase promoter and its
expression in transgenic tobacco. Plant Science 160: 7 13-721.
Roitsch, T., Bittner, M. and Godt, D.E. 1995. Induction of apoplastic invertase of
Chenopodium rubrum by D-glucose and a glucose analog and tissue specific expression
suggests a role in sink source regulation. Plant Physiology 108: 285-294.

126
Romano, A., Raemakers, R. Visser, R. and Mooibroek, H. 2000. Transformation of
potato (Solanum tuberosum) using particle bombardment. Plant Cell Reports 20 (3):
198-204.
Rooke, L., Bryne, D. and Salgueiro, S. 2000. Marker gene expression driven by the
maize ubiquitin promoter in transgenic wheat. Analytical and Applied Biology 136: 167-
172.
Rose, A.B. 2004. The effect of intron location on intron-mediated enhancement of gene
expression in Arabidopsis. The Plant Journal 40: 744-751.
Rossignol, J-L. and Faugeron, G. 1994. Gene inactivation triggered by recognition
between DNA repeats. Experientia 50: 307-3 17.
Saghai Maroof, M.A., Solima, K.M., Jorgenson, R.A. and Allard, R.W. 1984. Ribosomal
DNA spacer-length polymorphisms in barley: Mendelian inheritance, chromosomal
location, and population dynamics. Proceedings of the National Academy of Sciences
USA 81: 8014-8018.
Saisho, D., Myoraku, E., Kawasaki, S., Sato, K. and Takeda, K. 2007. Construction and
characterisation of a Bacterial Artificial Chromosome (BAC) library from the Japanese
malting barley variety ‘Haruna Nijo’. Breeding Science 57: 29-38.
Salgueiro, S., Pignocchi, C. and Parry, M. J. 2000. Intron-mediated gusA expression in
tritordeum and wheat resulting from particle bombardment. Plant Molecular Biology 42:
615-622.
Sambrook,J. and Russell, D.W. 2001. Molecular Cloning: A Laboratory Manual. 3rd
Edition. Cold Spring Harbor Laboratory Press, Cold Spring Harbor, New York.

127
Sanford, J.C., Klein, T.M., Wolf, E.D. and Allen, N. 1987. Delivery if substances into
cells and tissues using a particle bombardment process. Journal of Particulate Science
and Technology 5: 2737.
Sanger, M., Daubert, S. and Goodman, R.M. 1990. Characteristics of a strong promoter
from the figwort mosaic virus: comparison with the analgous 35S promoter from
cauliflower mosaic virus and the regulated mannopine synthase promoter. Plant
Molecular Biology 14: 433-443.
Sarni-Manchando, P. 1997. Molecular characterisation and structural analysis of one
alcohol dehydrogenase gene (GV-Adhl) expressed during ripening of grapevine (Vitis
Vinifera) berry. Plant Science 125: 177-187.
Schenk, P.M., Remans, T., Sagi, L., Elliott, A.R., Dietzgen, R.G., Swennen, R., Ebert,
P.R, Grof, C.P.L. and Manners, J.M. 2001. Promoters for pregenomic RNA of banana
streak badnavirus are active for transgene expression in monocot and dicot plants.
Plant Molecular Biology 47: 399-4 12.
Schenk, P. M., Sagi, L. Remans, T., Dietzgen, R. G., Bernard, M. J., Graham, M. W. and
Manners, J. M. 1999. A promoter from sugarcane bacilloform badnavirus drives
transgene expression in banana and other monocot and dicot plants. Plant Molecular
Biology 39: 1221-1230.
Schünmann, P.D., Llewellyn, D.J., Surin, B., Boevink, P., De Feyter, R.C. and
Waterhouse, P.M. 2003. A suite of novel promoters and terminators for plant
biotechnology. Functional Plant Biology 30: 443-452.
Seki, M., Narusaka, M., Kamiya, A., Ishida, J., Satou, M., Sakurai, T., Nakajima, M.,
Enju, A., Akiyama, K., Oona, Y., Muramatsu, M., Hayashizaki, Y., Kawai, J., Carninci,
P. Itoh, M., Ishii, Y., Arakawa, T., Shibata, K., Shinagawa, A. and Shinozaki, K. 2002.

128
Functional annotation of a full-length Arabidopsis cDNA collection. Science 296: 141-
145.
Shah, D.M., Horsch, R.B., Klee, H.J., Kishore, G.H., Winter, J.A., Tumer, N.E.,
Horonaka, C.M., Sanders, P.R., Gasser, C.S., Aykent, S., Siegel, N.R., Rogers, S.G. and
Fraley, R.T. 1986. Engineering herbicide tolerance in transgenic plants. Science 233:
478-481.
Shen, Q., Uknes, S. J. and Ho, T. H. 1993. Hormone response complex in a novel
abscisic acid and cycloheximide- inducible barley gene. Journal of Biology and
Chemistry 268: 23652-23660.
Shizuya, H., Birren, B., Kim, U.-J., Mancino, V., Slepak, T., Tachiri, Y and Simon, M.
1992. Cloning and stable maintenance of 300-kilobase-pair fragments of human DNA in
Escherichia coli using an F-vector-based vector. Proceedings of the National Academy
of Science USA 89: 8794-8797.
Simmonds, N.W. 1976. Sugarcanes. In N.W. Simmonds (ed.) Evolution of crop plants.
Longman, London, pp 104-108.
Simmonds, N.W. 1993. Introgression and incorporation: strategies for the use of crop
genetic resources. Biological Reviews 68: 539-562.
Simpson, S., Nakashima, K., Narusaka, Y., Seki, M., Shinozaki, K. and Yamaguchi-
Shinozaki, K. 2003. Two different novel cis-acting elements of erd1, a clpA homologous
Arabidopsis gene function in induction by dehydration stress and dark-induced
senescence. Plant Journal 33: 259-270.
Sinibaldi, R. M. and Mettler, I. J. 1992. Progress in Nucleic Acids Research, Molecular
Biology 42: 229-257.
129
Smith, N., Kilpatrick, J.B. and Whitelam, G.C. 2001. Superfluous transgene integration
in plants. Critical Reviews in Plant Sciences 20 (3): 215-249.
Snyman, S.J., Leibbrandt, N.B. and Botha, F.C. 1998. Buster resistant sugarcane.
Proceedings of the South African Sugar Technologists Association 72: 138-139.
Snyman, S., Watt, M.P., Huckett, B.I. and Botha, F.C. 2000. Direct somatic
embryogenesis for rapid, cost effective production of transgenic sugarcane (Saccharum
spp. hybrids). Proceedings of the South African Sugar Technologists Association 74:
186-187.
Snyman, S.J., Monosi, B.B. and Huckett, B.I. 2001. New developments in the production
of herbicide-resistant sugarcane. Proceedings of the South African Sugar Technologists
Association 75: 112-114.
Snyman, S.J. 2004. Transformation of sugarcane. In Curtis I.S. (ed.) Transgenic Crops
of the World – Essential protocols. Kluwer Academic Publishers, pp. 103-114.
Snyman S.J., Meyer G.M., Richards J.M., Haricharan N., Ramgareeb S. and Huckett B.I.
2006. Refining the application of direct embryogenesis in sugarcane: effect of the
developmental phase of leaf disc explants and the timing of DNA transfer on
transformation efficiency. Plant Cell Reports 25:1016-1023.
Song, P., Heinin, J.L., Burns, T.H. and Allen, R.D. 2000. Molecular Biology:
Expression of two tissue-specific promoters in transgenic cotton plants. The Journal of
Cotton Science 4: 217-223.
Songstad, D.D., Somers, D.A. and Griesbach, R.J. 1995. Advances in alternative DNA
delivery techniques. Plant Cell, Tissue and Organ Culture 40: 1-15.

130
Springer, P.S., McCombie, W.R. Sundaresan, V. and Martienssen, R.A. 1995. Gene
tagging of PROLIFERA, and essentialMCM2-3-5-like gene in Arabidopsis. Science 268:
877-880.
Sreenivasan, T.V., Ahloowalia, S. and Heinz, D.J. 1987. Cytogenetics. In: Heinz D.J.
(ed.) Developments in crop science III. Sugarcane improvement through breeding. Elsevier,
Amsterdam, pp 211-254.
Srivastava, B.L., Cooper, M. and Mullins, R.T. 1994. Quantitative analysis of the effect
of selection history on sugar yield adaptation of sugarcane clones. Theoretical and
Applied Genetics 87: 627-640.
Stam, M., Mol, J.N.M. and Kooter, J.M. 1997. The silence of genes in transgenic plants.
Annals of Botany 79: 3-12.
Stavalone, L., Kononova, M., Pauli, S., Ragozzino, A., de Haan, P., Milligan, S., Lawton, K.
and Hohn, T. 2003. Cestrum yellow leaf curl virus (CmYLCV) promoter: a new strong
constitutive promoter for heterologous gene expression in a wide variety of crops. Plant
Moleculat Biology 53: 703-7 13.
Stevenson, G.C. 1965. Genetics and breeding of sugarcane. Longmans, London, pp 284.
Stitt, M. 1995. The use of transgenic plant to study the resulation of plant carbohydrate
metabolism. Australian Journal of Plant Physiology 22: 635-646.
Stockmeyer, K. and Kempken, F. 2004. Biotechnology: Production of proteins for
biopharmaceutical and industrial uses in transgenic plants. Progress in Botany 65: 179-
192.
Strommer, J., Gerats, A.G.M., Sanago, M., Molnar,S.J. 2000. A gene-based RFLP map
of petunia. Theoretical and Applied Genetics 102: 1305-1306.

131
Sun, S.S.M., Maretzki, A., Nagai, C., Houtchens, K. and Bidney, D. 1993.
Transformation of Saccharum spontaneum by particle bombardment. Sugarcane 5: 1-7.
Sun, C., Palmqvist, S., Olsson, H., Borèn, M., Ahlandsberg, S. and Jansson, C. 2003. A
noverl WRKY transcription factor, SUSlBA2, participates in sugar signaling in Barley by
binding to the sugar-responsive elements of the iso1 promoter. The Plant Cell 15: 2076-
2092.
Tanaka, A., Mita, S. Ohta, S., Kyozuka, J., Shimamoto, K. and Nakamura, K. 1990.
Enhancement of foreign gene expression by a dicot intron in rice but not in tobacco is
correlated with an increased level of mRNA and an efficient splicing of the intron.
Nucleic Acids Research 18: 6767-6770.
Tang, W., Sun, S., Nagai, C. and Moore, P. 1996. Regulation of expression of β-
glucurondiase in transgenic sugarcane by promoter of rubisco small subunit genes. In
Wilson, J., Hogarth, D., Campbell, J., Garside, A. (eds.) Sugarcane research towards
efficient and sustainable production. CSIRO Division of Tropical Crops and Pastures,
Brisbane Australia, pp 117-119.
Tatematsu, K., Ward, S., Leyser, O., Kamiya, Y. and Nambara, E. 2002. Identification of
cis-elements that regulate gene expression during initiation of axillary bud growth in
Arabidopsis. Plant Physiology 138: 757-766.
Taylor, P.W.J., Ko, H-L., Adkins, S.W., Rathus, C. and Brich R.G. 1992. Establishment
of embryogenic callus and high protoplast yielding suspension cultures of sugarcane
(Saccharum spp. Hybrids). Plant Cell, Tissue and Organ Culture 28: 69-78.
Taylor, P.W.J. and Dukic, S. 1993. Develpoment of an in vitro culture technique for
conservation of Saccharum spp. hybrid germplasm. Plant Cell, Tissue and Organ Culure
34: 217-222.

132
Taylor, M.G., Vasil, V. and Vasil, I.K. 1993. Enhanced GUS gene expression in
cereal/grass cell suspensions and immature embryos using the maize ubiquitin-based
plasmid pAHC25. Plant Cell Reports 12: 491-495.
Taylor, P.W.J., Geijskes, J.R., Ko, H.L., Fraser, T.A., Henry, R.J. and Birch, R.G. 1995.
Sensitivity of random amplified polymorphic DNA analysis to detect genetic change in
sugarcane during tissue culture. Theoretical and Applied Genetics 90: 1169-1173.
Teakle, G., Manfield, I., Graham, J. and Gilmartin, P. 2002. Arabidopsis thaliana GATA
factors: organisation, expression and DNA-binding characteristics. Plant Molecular
Biology 50: 43-57.
Teeri, T.H., Herrera-Estrella, Depicker, A., Van Montagu, M. and Palva, E.T. 1986.
Identification of plant promoters in situ by T-DNA-mediated transcriptional fusions to
the npt-II gene. EMBO Journal 5:1755-1760.
Tingay, S., McElroy, D., Kalla, R., Fieg, S., Wang, M., Thornton, S. and Brettell, R.
1997. Agrobaterium tumefaciens-mediated barley transformation. Plant Journal 11:
1369-1376.
Tomkins, J.P., Yu, Y., Miller-Smith, H., Frisch, D.A., Woo, S.S. and Wing, R.A. 1999.
A Bacterial Artificial Chromosome library for sugarcane. Theoretical and Applied
Genetics 99: 4 19-424.
Tyagi, A. 2001. Plant gene and their expression. Current Science 80: 161-169.
Ulmasov, T., Hagen, T. and Guilfoyle, T.J. 1997. ARF1, a transcription factor that binds
to auxin response elements. Science 276: 1865-1868.

133
Umehara, Y., Inagaki, A., Tanoue, H., Yasukochi, T., Nagamura, Y., Saji, S., Fujimura,
T. and Minobe, Y. 1995. Construction and characterisation of a rice YAC library for
physical mapping. Molecular Breeding 1: 79-89.
Urao, T., Yamaguchi-Shinozaki, K., Urao, S. and Shinozaki, K. 1993. An Arabidopsis
myb homolog is induced by dehydration stress and its gene products binds to the
conserved MYB recognition sequence. Plant Cell 5: 1529-1539.
Vain, P., McMullen, M.D. Finer, J.J. 1993. Osmotic treatment enhances particle
bombardment-mediated transient and stable transformation of maize. Plant Cell Reports
12: 84-88.
Vain, P., Finer, K. R., Engler, D. E., Pratt, R.C. and Finer, J. J. 1996. Intron-mediated
enhancement of gene expresion in maize (Zea mays L.) and bluegrass (Poa pratensis L.).
Plant Cell Report 15: 489-494.
van der Geest, A.H.M. and Hall, T.C. 1997. The β-phaseolin 5' matrix attachment region acts
as an enhancer facilitator. Plant Molecular Biology 33: 553-557.
van der Krol, A.R., Mur, L.A., Beld, M., Mol, J.N. and Stuitje, A.R. 1990. Flavonoid
genes in petunia: addition of a limited number of gene copies may lead to a suppression
of gene expression. Plant Cell 2: 29 1-299.
van der Merwer, M.J., Groenewald, J.H. and Botha, F.C. 2003. Isolation and evaluation
of a developmentally regulated sugarcane promoter. Proceedings of the South African
Sugar Cane Technologists 77: 146-169.
Vanhouten, W. and MacKenzie, S. 1999. Construction and characterisation of a common
bean bacterial artificial chromosome library. Plant Molecular Biology 40: 977-983.

134
Vasil, I.K. 1994. Molecular improvements of cereals. Plant Molecular Biology 25: 925-
937.
Vaucheret, H. 1993. Identification of a general silencer for 19S and 35S promoters in a
transgenic tobacco plant: 90bp of homology in the promoter sequence are sufficient for
trans-inactivation. CR Academy of Science Paris 316: 147 1-1483.
Vaucheret, H. and Fagard, M. 2001. Transcriptional gene silencing in plants: targets,
inducers and regulators. Trends in Genetics 17: 29-35.
Verdaguer, B., de Kochko, A., Beachy, R. N. and Fauquet, C. 1996. Isolation and
expression in transgenic tobacco and rice plants, of the cassava vein mosaic virus
(CsVMV) promoter. Plant Molecular Biology 31:1129-1139.
Verries, C., Pradal, M., Chatelet, P., Torregrosa, L. and Tesniere, C. 2004. Isolation and
analysis of the promoter of VvAdh2, a grapevine (Vitis vinifera L.) ripening-related gene.
Plant Science 167: 1067-1074.
Wang, Z. and Ge, Y. 2005. Rapid and efficient production of transgenic bermudagrass
and creeping bentgrass bypassing the callus formation phase. Functional Plant Biology
32: 769-776.
Wei, H., Albert, H.H. and Moore, P.H. 1999. Differential expression of sugarcane
polyubiquitin genes and isolation of promoters from two highly-expressed members of
the gene family. Journal of Plant Physiology 155: 513-519.
Wendel, J. 2000. Genome evolution in polyploids. Plant Molecular Biology 42: 225-
249.
Whitkus, R., Doebley, J. and Lee, M. 1992. Comparative genome mapping of sorghum
and maize. Genetics 132:1119-1130.

135
Wild, J., Hradecna Z. and Szybalski, W. 2007. Conditionally amplifiable BACs:
Switching from single-copy to high-copy vectors and genomic clones. Genome Research
12: 1434-1444.
Wilmink, A., van de Ven, B.C. and Dons, J.J. 1995. Activity of constitutive promoters in
various species from the Liliaceae. Plant Molecular Biology 28: 949-955.
Wing,R., Zhang, H. and Tanksley, S. 1994. Map-based cloning in crop plants. Tomato
as a model system: Genetic and physical mapping of jointless. Molecular and General
Genetics 242: 681-688.
Winicov. 2004. Expression of desirable proteins in plant roots and cell cultures. Patent
number WO/2004/0856 19.
Woo, S-S., Jiang, J., Gill, B.S., Paterson, A.H. and Wing, R.A. 1994. Construction and
characterisation of a bacterial artificial chromosome library of Sorghum bicolor. Nucleic
Acids Research 22: 4922-493 1.
Xiao, K., Zhang, C., Harrison, M. and Wang, Z. 2005. Isolation and characterisation of
a novel plant promoter that directs strong constitutive expression of transgenes in plants.
Molecular Breeding 15: 221-23 1.
Xie, Y. Liu, Y., Meng, M., Chen, L. and Zhu, Z. 2003. Isolation and identification of a
super strong plant promoter from cotton leaf curl Multan virus. Plant Molecular Biology
53: 1-14.
Xu, D., McElroy, D., Thornburg, R. W. and Wu, R. 1993. Systemic induction of a potato
pin2 promoter by wounding, methyl jasmonate, and abscisic acid in transgenic rice
plants. Plant Molecular Biology 22: 573-588.

136
Yamamoto, Y. T., Taylor, C. G., Acedo, G. N., Cheng, C. -L. and Conkling, M. A. 1991.
Characterisation of cis-acting sequences regulating root-specific gene expression in
tobacco. Plant Cell 3: 371-382.
Yanagisawa, S. and Schmidt, R. 1999. Diversity and similarity among
recognition sequences of Dof transcription factors. Plant Journal 17: 209-2 14.
Yanagisawa, S. 2000. Dof1 and Dof2 transcription factors are associated with
expression of multiple genes involved in carbon metabolism in maize. The Plant
Journal 21: 281- 288.
Yang, M., Bower, R., Burow, M.D., Paterson, A.H. and Mirkov, T.E. 2003. Genomics,
Molecular genetics and Biotechnology. A rapid and direct approach to identify
promoters that confer high levels of gene expression in monocotyledonous. Crop
Science 43: 1805-1813.
Yoshida, K. and Shinmyo, A. 2000. Transgene expression systems in plant, a
natural bioreactor. Journal of Bioscience and Bioengineering 90: 353-362.
Zhao, Y., Liu, Q. and Davis, R.E. 2004. Transgene expression in strawberries driven
by a heterologous phloem-specific promoter. Plant Cell Reports 23: 224-230.
Zhang, W. McElroy, D. and Wu,R. 1991. Analysis of rice Act 5' region activity
in transgenic rice plants. The Plant Cell 3: 1155-1165.

137
Appendix A
1 AAGCTTAAGA AACTTTTTTC ACGGATCAAG CTCGTTACGA AAAACGATCT 51 AGCACCGCGA AAGGGGCTAC TGTTGGGTCT ATGCTTCGTC GCCGAAGGTC 101 TTATAGAAAG AAGTGATCCT CGGATGAAGC TGTTCGCACA AGATAGCCGA 151 AGGTGCCTTT TCGCAGAGCT TCGGCATTAC AAACCGACTT AAAGATAGAA 201 TGACCTTTTA GTCCATAAAG GTCTGAGTCA AACGTTGTAA GTTCTTATAA 251 GGGGCATACT TGTAATTCCT CACAGGCTGC GTCCTGTGCC TATAAATAGT 301 GAACAGTATT CCGTTACTGT TCACGCATTT TCTGACATTT TGCAATCGCA 351 TTTCTCGGAA TACAACCTTT GTCAAGGCAT AGGTATCATT GTATTTTATG 401 ATTCAATATA TTAAGTGAAT ATTATATAAT GCATCTGTGG ATCATTTATT 451 CATTCTTACC TTTTACTTTG CATTATTCTA CAACGTTTAT TGAAAATTTA 501 TTACGAAGGT TCAACTTCGT AATAAGACGC TTATCAACCT TCGTCTAAGA 551 TCCATTATCC TCAAAGGTAT AATGCTTCGC GGACGAAGGA CAGTATCATT 601 TAACATTCTA TGTTGCCTTG TTCTTAATTC ATAGCATTTG AGAACAAGTC 651 CCCAACAGAG ATAGCCTGAT ATCTGAACTT TGGAAAGTGG TGGAATGTAC 701 AATTCCAAAT TAAATAAGTT ACTTTATTGA GTGAATTCGC CCCGATAATT 751 CCTTCAACAG TCTTGCTCCC AAACACGTCC TACAAGTTTC TTCATCCTTT 801 GTGTCTTCTT TATGTCTTAC AACTGTTAGA TATGTATTAG ACGAAATCAA 851 CCTCTCATGT TCTTATACTC ATATGAGTTC GATAAATACT TTATCCGTCT 901 TAGTTTTTAA CACGTAACCA CTTTTAGTTC GAAGACCAAA AATTGTATGT 951 AATTCTTTAT ATACTATTGC ATCGACATAT GCATGTCTAA AAAGAGAATA 1001 CACCTTATAT TATGACATTA GAATAAATAT ATAGTGGTTA TTCCTTATAT 1051 TAGGAGGACA GAGGGAGAAC ATATCCAAGG CACACTATGG AGTTCATGAT 1101 CGAAACACAT GATGACTGGG TGTGTTTGTT GGTTAATTAA ATAAAAGAAG 1151 AAATTTCCTT TCTTCAAATT TTGATCTGTC CCTTTCACTC CTGTCCATGT 1201 AACTGTCTGC CACTCCACTG AGACACAAGG ATAAGGATAA GAGGTATTAC 1251 CGTTTTAAAT GATGGATTAA ATACTTTCTC TGTTCTTTTT TATTTGTCGC 1301 GGTTTAGTTA AAAATGAACT AGCTTACGAT AAATATTGGA GAACGGAAGT 1351 AGTATAATTT ATGGCTTTGT CATTGTCGAA CTCAAGGCCG CACCAATATG 1401 ATTGAACTAC GGTAAAGTGT TCAATTTCAA GATATATTAG AGCCAATGAC 1451 AGAAATTATA TATTCTCAAG GAAAATATTT GCTAATAACA ACAACGACGA 1501 CAACAACAAC AACAATAATA ATAATAAAAG GATGTCATAA AATTACTTGT 1551 TGAAGCTCCT CCTATTAAGC AGCTAGTGCA TTTGCGTAGA TTTACTCTCC 1601 CTATTCATCA TCTATACTCT CTCATCAAGC TGTAACATAA TTCTCGCTAT 1651 ATCTATGTTC GAGCACCTTA ATATAAAAAA ATTACAGTAG CAGCCCCCTC 1701 CTGATTTCCA AAGAAAGACA TAATTGTTAA AACGAGAAAA GAAAAAACTC 1751 GCGAATACTC CATAGTATTT TGCGTACGTA CGTTCGTCCA GTTCAGCCAA 1801 CGACGAGGAG GTAGGGTTCA ATATTATGAC CCGATTATTA TCCCATCGTG 1851 GCACATATAG CCTTGTCCTT GATGACTAAT TCGAGATGCA ATTCTAATTC 1901 TCACCGTGTA TATAATCGAC TAGGTAACAC AGAAAACAAG CCTTTTTTCT 1951 TTGTCGATTA ATCGCACTGG TCTGGACTCT GGACCGTTGC TTTTTGGTGA 2001 CGTGCAGTTG TGCACCCATA TCACAAAACA GCGTGTAAAT AGGCAACCTC 2051 GAAGTTCGAA TCGACACCTC ACACGTCACA CCAGAAGGGA CGCAAGAAAA 2101 GAAACAAAAT TATACTATTA TTGCAATAGA TCCAGCGTCC AAAAAAAAGG 2151 AGAGGTTAGC TATAGACTTA GCTAATAACT TTGCTGATCT AGCCCCTCCG 2201 CCGAATTCCA AAACCACATG ATAGTAGTAG GCTCAATGTC ATACAGATAC 2251 AGTGGAAAGG AGGCACATTC ACCGGCCACA GCTAACCCGA CAACCGGGCC 2301 CCCTGCTGTC TTCCTTTGCC GCGCGCCTCT AATAATCTCG TACGTACGAC 2351 CAAATTAAAA CGCTAATCAA CAATCTCTTC CCCGTACGTA ACCAAAGCTG 2401 CCGAAATGTC CCCTCGCTGA TTTTTAATTT GGCTCAATTT AACTACGGAC 2451 GACGCCAAGG ACGGCGTACA GCGTGCAGCA ACAATGAGGC GCAGCCCAGC 2501 GCAGCGAGCC AGCGTGCGAC GCACATGCAA TGAAGCCTCT ACAGCTCCGC
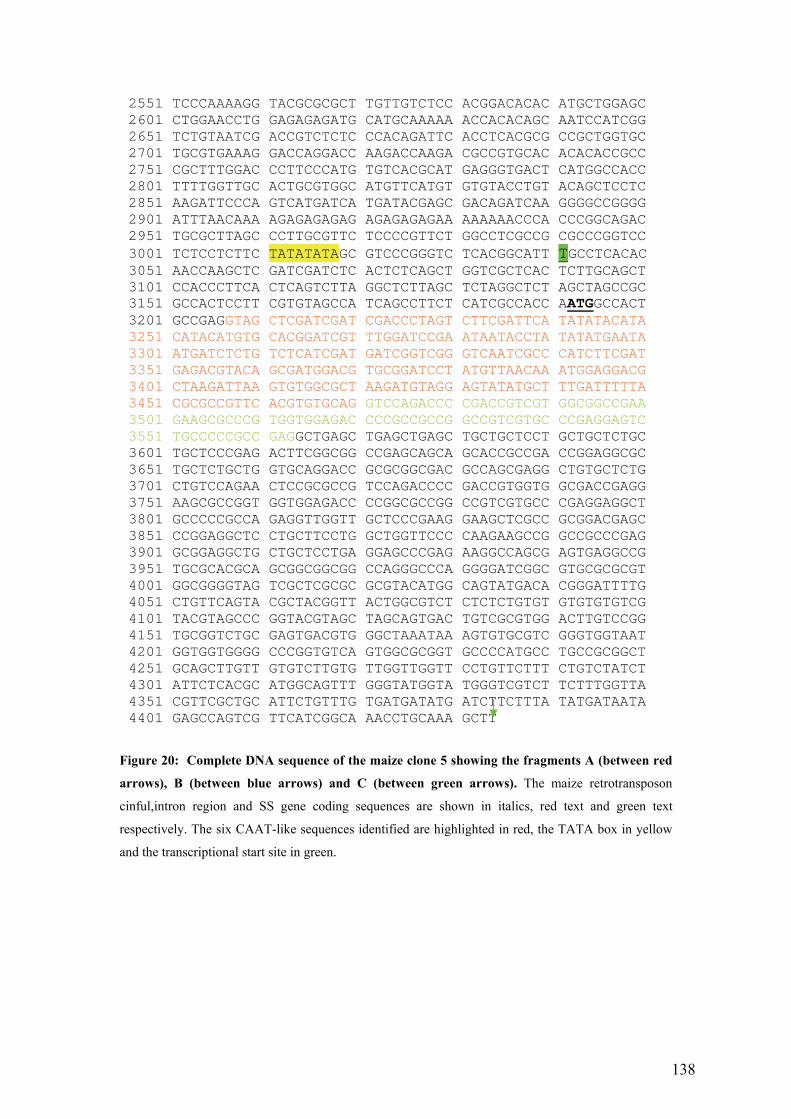
138
2551 TCCCAAAAGG TACGCGCGCT TGTTGTCTCC ACGGACACAC ATGCTGGAGC 2601 CTGGAACCTG GAGAGAGATG CATGCAAAAA ACCACACAGC AATCCATCGG 2651 TCTGTAATCG ACCGTCTCTC CCACAGATTC ACCTCACGCG CCGCTGGTGC 2701 TGCGTGAAAG GACCAGGACC AAGACCAAGA CGCCGTGCAC ACACACCGCC 2751 CGCTTTGGAC CCTTCCCATG TGTCACGCAT GAGGGTGACT CATGGCCACC 2801 TTTTGGTTGC ACTGCGTGGC ATGTTCATGT GTGTACCTGT ACAGCTCCTC 2851 AAGATTCCCA GTCATGATCA TGATACGAGC GACAGATCAA GGGGCCGGGG 2901 ATTTAACAAA AGAGAGAGAG AGAGAGAGAA AAAAAACCCA CCCGGCAGAC 2951 TGCGCTTAGC CCTTGCGTTC TCCCCGTTCT GGCCTCGCCG CGCCCGGTCC 3001 TCTCCTCTTC TATATATAGC GTCCCGGGTC TCACGGCATT UTUGCCTCACAC 3051 AACCAAGCTC GATCGATCTC ACTCTCAGCT GGTCGCTCAC TCTTGCAGCT 3101 CCACCCTTCA CTCAGTCTTA GGCTCTTAGC TCTAGGCTCT AGCTAGCCGC 3151 GCCACTCCTT CGTGTAGCCA TCAGCCTTCT CATCGCCACC A UATG UGCCACT 3201 GCCGAGGTAG CTCGATCGAT CGACCCTAGT CTTCGATTCA TATATACATA 3251 CATACATGTG CACGGATCGT TTGGATCCGA ATAATACCTA TATATGAATA 3301 ATGATCTCTG TCTCATCGAT GATCGGTCGG GTCAATCGCC CATCTTCGAT 3351 GAGACGTACA GCGATGGACG TGCGGATCCT ATGTTAACAA ATGGAGGACG 3401 CTAAGATTAA GTGTGGCGCT AAGATGTAGG AGTATATGCT TTGATTTTTA 3451 CGCGCCGTTC ACGTGTGCAG GTCCAGACCC CGACCGTCGT GGCGGCCGAA 3501 GAAGCGCCCG TGGTGGAGAC CCCGCCGCCG GCCGTCGTGC CCGAGGAGTC 3551 TGCCCCCGCC GAGGCTGAGC TGAGCTGAGC TGCTGCTCCT GCTGCTCTGC 3601 TGCTCCCGAG ACTTCGGCGG CCGAGCAGCA GCACCGCCGA CCGGAGGCGC 3651 TGCTCTGCTG GTGCAGGACC GCGCGGCGAC GCCAGCGAGG CTGTGCTCTG 3701 CTGTCCAGAA CTCCGCGCCG TCCAGACCCC GACCGTGGTG GCGACCGAGG 3751 AAGCGCCGGT GGTGGAGACC CCGGCGCCGG CCGTCGTGCC CGAGGAGGCT 3801 GCCCCCGCCA GAGGTTGGTT GCTCCCGAAG GAAGCTCGCC GCGGACGAGC 3851 CCGGAGGCTC CTGCTTCCTG GCTGGTTCCC CAAGAAGCCG GCCGCCCGAG 3901 GCGGAGGCTG CTGCTCCTGA GGAGCCCGAG AAGGCCAGCG AGTGAGGCCG 3951 TGCGCACGCA GCGGCGGCGG CCAGGGCCCA GGGGATCGGC GTGCGCGCGT 4001 GGCGGGGTAG TCGCTCGCGC GCGTACATGG CAGTATGACA CGGGATTTTG 4051 CTGTTCAGTA CGCTACGGTT ACTGGCGTCT CTCTCTGTGT GTGTGTGTCG 4101 TACGTAGCCC GGTACGTAGC TAGCAGTGAC TGTCGCGTGG ACTTGTCCGG 4151 TGCGGTCTGC GAGTGACGTG GGCTAAATAA AGTGTGCGTC GGGTGGTAAT 4201 GGTGGTGGGG CCCGGTGTCA GTGGCGCGGT GCCCCATGCC TGCCGCGGCT 4251 GCAGCTTGTT GTGTCTTGTG TTGGTTGGTT CCTGTTCTTT CTGTCTATCT 4301 ATTCTCACGC ATGGCAGTTT GGGTATGGTA TGGGTCGTCT TCTTTGGTTA 4351 CGTTCGCTGC ATTCTGTTTG TGATGATATG ATCTTCTTTA TATGATAATA 4401 GAGCCAGTCG TTCATCGGCA AACCTGCAAA GCTT
Figure 20: Complete DNA sequence of the maize clone 5 showing the fragments A (between red
arrows), B (between blue arrows) and C (between green arrows). The maize retrotransposon
cinful,intron region and SS gene coding sequences are shown in italics, red text and green text
respectively. The six CAAT-like sequences identified are highlighted in red, the TATA box in yellow
and the transcriptional start site in green.

139