Embed Size (px)
Citation preview

STEM Starter AcademyAnnual Evaluation Report, Year 6
November 12, 2020
Jeremiah Johnson, Senior Research Manager
Ivana Zuliani, Research Manager
Catherine Jett, Senior Research Analyst
Donna Spraggon, Senior Research Analyst
Jackie Stein, Senior Research Analyst
Gaby Stevenson, Senior Research Analyst

1
STEM Starter Academy
STEM Starter Academy
DHE launched SSA system-wide at all 15 Massachusetts
community colleges in January 2014. From its inception,
the SSA initiative has focused on at-scale implementation
while encouraging local site adaptation. Over the years, a collaborative learning community has emerged, bringing
together state initiative leaders, college program staff, and administrators to share insights and inform both
system-level and institutional guidance, data collection, and program evaluation.
Throughout the initiative, DHE has engaged with data and evaluation to inform decisions about SSA at both the
college and the system levels. The UMass Donahue Institute (UMDI) has partnered with DHE as an external
evaluator of the initiative since the program began.
This Report
This report summarizes findings related to the SSA initiative’s overall effectiveness in terms of key student
outcomes, based on data from SSA Years 1–6 (2014–2019). These findings include descriptive data about SSA
participants as well as results from rigorous statistical
analyses to assess the impacts of SSA on student success.
To contextualize these findings, the first part of this
report provides some background on SSA and the broader
landscape of higher education. In previous reports, UMDI provided extensive detail characterizing SSA during each
phase of its implementation. This report, however, is intended to be a high-level overview as the SSA initiative
closes its seventh year.
Annual Evaluation Report—Year 6
The STEM Starter Academy (SSA) is a Massachusetts Department of Higher Education (DHE) initiative to recruit, ready, retain, and ensure completion of credentials by significantly more students through community college STEM pathway programs that result in job placement within STEM professions or transfer to university STEM programs.
Participant Characteristics......................................... 10
Evidence & Outcomes................................................ 11
Equity & Diversity........................................................ 3
Core Principles............................................................. 6
Program Development................................................ 7
Context
Contents
Findings
Spotlight: Key Findings
SSA has served nearly 31,000 students who reflect the diversity of the community college population.
64% of SSA participants have achieved positive outcomes (degree/certificate, 4-year transfer, STEM workforce entry, retention) and have achieved those outcomes at higher rates than their non-SSA peers.
Black SSA participants are twice as likely* to achieve positive outcomes—and they earn STEM degrees and certificates at higher rates—than their non-SSA peers.
Analyses show that SSA students are achieving positive outcomes. More work is needed within the program to impact STEM degree and certificate attainment to a statistically significant level. *Odds ratios are presented in Appendix C

2
Context

SSA participants generally reflect the racial and
ethnic diversity of Massachusetts community college
students. That said, SSA has consistently served a
higher proportion of Black students compared to
the overall community college population.
3
Equity & Diversity
Massachusetts’ increasingly diverse population and need for a diverse STEM-skilled workforce shape the context in which SSA has developed
Massachusetts’ community colleges have become more diverse; SSA participants broadly reflect this diversity
Of all students in Massachusetts public higher education,
43% are enrolled at community colleges.2 Among these students, racial and ethnic diversity has increased over
the past 10 years, with students of color making up nearly half of all Massachusetts community college students in
fall 2019 (compared to 34% in fall 2009). Massachusetts community colleges also serve a higher percentage of low-
income students and those above age 25 than the Commonwealth’s public 4-year colleges and universities.3
Community colleges provide a critical on-ramp and connection to STEM education and careers, and are particularly important for serving students who reflect a broader cross-section of societal diversity than is typical of 4-year institutions.1
Community college students differ in key ways from students at 4-year colleges
Community colleges are known for their affordability,
open access, and representation of students who have
often been considered “nontraditional,” such as older
students, those enrolled part time, and those balancing
work and family responsibilities.4
Massachusetts community colleges serve high proportions
of students of color, low-income students, and adult
learners. Of community college students nationally, over
60% work full or part time, 29% are first-generation
college students, and 20% are students with disabilities.5
Also, 40%–60% of Black, Latinx, and Native American
undergraduates are enrolled in community colleges.
The goals and academic trajectories of community
college students are often more varied than those of
their 4-year counterparts.6 For example, community
college students in STEM programs are more likely to
require developmental education and are less likely to have continuous enrollment with no stop-outs.7
Community college students may also seek a variety of
end points: some work toward an associate degree, some work toward a certificate for a job requirement, and
others aim to transfer to a 4-year institution. Finally, non-academic barriers—like needing to work full time—can
influence course load and academic engagement.
34% students of color
49% students of color
STEM enrollment has mirrored these broader shifts in racial and ethnic diversity at Massachusetts community
colleges. In fall 2009, 34% of STEM students were students of color. By fall 2018—for the first time—a
majority (52%) of community college students in the
STEM pipeline were students of color.
Information about SSA participant characteristics—
including race/ethnicity, gender, and age—is included on page 8.
Fall 2009 Fall 2019
Racial and Ethnic Diversity at Massachusetts Community Colleges

4
Equity & Diversity
Ongoing inequities in student outcomes indicate a need for higher education to adapt in order to meet the needs of a diverse population
Increased diversity is not reflected in equitable student outcomes
While college populations are becoming more diverse, equitable outcomes are lagging. Nationally, Black and Latinx students in community colleges graduate at lower rates than the overall community college population.8
Lower income students are less likely than their higherincome peers to transfer to 4-year schools or earn a bachelor’s degree after transfer.9 These disparities also exist in Massachusetts, where Black and Latinx students graduate at lower rates than White students.10
Across the nation, students studying in STEM fields are increasingly likely to be from underrepresented groups—including people of color and single parents—but completion rates are lower for students from these groups compared to their White and Asian counterparts.11
These trends likely contribute to the underrepresentation of women, Black, and Latinx workers in the STEM workforce.12
Across the higher education landscape, disparities in completion outcomes have drawn attention to the ways institutions have been underprepared to serve students from traditionally underrepresented populations.
Higher education is adapting in order to support students with diverse needs
Higher education is in a phase of transition and self-reflection in response to these inequities. Students are increasingly diverse, but colleges are not adequately prepared to address the needs of nontraditional populations.15 Students face barriers beyond the academic sphere, including:
• first-generation status;
• inadequate access to technology and Internet;
• lack of support at home; or,
• responsibilities outside of college.
Between White and Black or Latinx students at
MA community colleges (2015–2018).14
Equity gaps in MassachusettsData from the Massachusetts DHE show:
33
10+
Between White females and Latino males at MA public colleges or universities (2017).13
Percentage-point gap in college graduation rates
Percentage-point gap in timely completion of gateway courses and on-time credit accumulation
Community colleges’ current model—in which students have many options but little direction (sometimes called
"cafeteria-style”)—may not be a good fit for students from underrepresented backgrounds.16
On the other hand, implementing a guided-pathways
model—like the one currently used in Massachusetts—offers more direction to students, encouraging them to
“start with the end in mind” by establishing a plan early on and revisiting it often. These strategies have been
linked to helping students graduate at faster rates.17
In SSA, the shift to case management incorporates this kind of directed guidance, along with a more sustained
and personalized approach to student support.18
“[Community colleges] work to educate our most disenfranchised students. I believe it will be the
student-ready colleges, not those who are serving only college-ready students, that will
survive the next shakeout of higher education.”
Carlos Santiago, Commissioner, DHE

5
Equity & Diversity
Improving outcomes for today’s diverse group of students requires a focus on equity within higher education
As open-access institutions, community colleges are in a unique position to address barriers that students face. SSA is part of a state-wide commitment to addressing issues of equity in higher education.
Massachusetts has committed to
addressing issues related to equity in
higher education
The Massachusetts Board of Higher Education (BHE) has
“adopted equity as the top performance and policy priority for Massachusetts public higher education.”22 BHE
expressed a commitment to maintaining high levels of educational attainment for all students in the
Commonwealth—particularly students from underserved
and underrepresented populations. Similarly, DHE has
made an equity agenda one of its strategic initiatives and
is working with state colleges and universities to “develop
a system-wide strategic framework to achieve equity.”23
“States that are seeing the needle move in terms of college completion have a specific
focus on equity and are committed to equitable outcomes for all students.”
Yolanda Watson Spiva, President, Complete College America24
There is a need for continued growth in
higher education around issues of equity,
diversity, and access
Historically, and today, structural inequities—including institutional racism—permeate systems of higher
education.19 Acknowledging this fact is a necessary first step toward achieving significant change for all students.
Beyond recognizing that structural inequities exist,
research suggests that necessary shifts include changes to institutional culture, program design and development,
and allocation of targeted resources.20 For example, while
the community college system may be the “most
egalitarian system of higher education in the world,” increased and continued funding of supports for
underrepresented and nontraditional students is key to adequately addressing issues of equity.21
Efforts to increase equity must consider barriers to access that may be linked to students’ diverse circumstances and
backgrounds. The COVID-19 pandemic has brought
increased attention to these barriers, as the inequitable
impacts of the disease and the related social and economic ramifications have become evident. For
example, SSA administrators reported student struggles with familial financial hardship (as the economy faltered)
and access to technology (as college programs shifted
toward virtual modalities). The current crisis will likely
have long-term implications for educational equity.
“Because of COVID-19, we are truly seeing the barriers that students have … It really
separates out the haves and the have nots.”
NECC Administrator
SSA aligns with and supports the Commonwealth’s
commitment to equity by:
• recognizing the untapped potential of
underrepresented student populations;
• supporting differentiated approaches to meeting
student needs; and,
• engaging in an iterative process of learning, evaluation, and application to implement, at scale,
best practices that support all students.

6
Core Principles
At-scale launch, local adaptation, and collaboration foster innovation
Launched at-scale with local flexibility
DHE launched SSA simultaneously across all 15 Massachusetts public community colleges in 2014. The
initiative’s design included both system-wide guiding
principles and flexibility for local site-level adaptation,
elements supported by research on best practices for
scaling educational reforms.25
Cycles of innovation
Iterative innovation has been an important part of SSA from its inception. In the original RFP, DHE encouraged
SSA sites to test innovative strategies in order to “refine the definition and implementation of the STEM Starter
Academy as a model of student success across the Massachusetts community college system.”26
Attending to equity
The SSA community has come to recognize that engaging
with equity is key to supporting community college student success. This is especially true in STEM fields,
which pose particular access challenges for students who
have been in underserved educational settings. As SSA has
evolved, the initiative’s design and implementation have
been increasingly attentive to issues of equity and
diversity.
Collaborative learning community
From the beginning, SSA has been a collaborative
endeavor. Representatives from the 15 institutions regularly convene to share information about practices,
resources, and insights into implementation.
This learning community has persisted for 6 years,
providing continuity to the initiative and sustaining connections between institutions. SSA institutions,
through participation in working groups, have also advised
DHE on initiative design, implementation, and evaluation.
When combined with flexibility for local adaptation, this
kind of collaboration supports a positive feedback loop
between design and implementation that is key to successful reform—with benefits that accrue both to the
participants and their serving institutions.27
“We need a robust workforce that reflects our core strengths as a Commonwealth—diverse, well educated, innovative and collaborative. SSA
provides all students, statewide, the opportunity to access, grow, and thrive through STEM.”
David Cedrone, Associate Commissioner of Workforce Development, DHE
Through a combination of system-level leadership, multi-site collaboration, and local flexibility, the SSA initiative has fostered a unique context in which innovations at the system and institution levels inform one another. This allows for the testing, adaptation, and replication of best practices to support student success.
Collaborative
Flexible
At-scale
Innovation

7
In the early years, SSA implementation focused broadly on recruitment into and readiness for STEM pathways. This
was key, as students considering and attending community college are less likely than their 4-year
counterparts to have been exposed to a wide array of occupational choices within STEM fields.28
SSA sites worked to build interest in and awareness of
STEM fields—and specifically to raise awareness of
community colleges as entry points to STEM careers. Practices included high school outreach, hands-on
challenge events, and visits to college laboratory spaces.
Building readiness for college and for STEM involved programming such as STEM-focused summer bridge-to-
college programs and math readiness activities—practices that the literature suggests can help smooth students’
transition from high school to college.29
In an effort to bolster recruitment, SSA developed relationships, reputations, and name recognition within
their institutions and in their surrounding communities.
Program Development
Over time, SSA has evolved through an iterative process of learning, evaluation, and application
In Years 3–5, SSA programs turned their focus to increasing retention and readying students for
completion. This focus included attention to both academic and non-academic factors.
To support student persistence, SSA sites emphasized building relationships to connect students to each other
and to faculty, program administrators, and support
resources.30 Practices included, for example, cohort
activities, leadership opportunities, and chances for casual interaction with peers, faculty, and staff.
Phase 1 (Years 1–3): Recruitment and readiness
Phase 2 (Years 3–5): Retention and relationships
From the outset, DHE envisioned that a collaborative SSA community would continue to refine the STEM Starter Academy as a model for promoting student success.
0
2,000
4,000
6,000
Y1* Y2 Y3 Y4 Y5 Y6
SSA participation has remained steady, despite overall declines in community college enrollment.
As of Fall 2019, SSA has directly served 30,964 students
Cultivating a sense of belonging—specifically conveying a sense of being
known and cared about by institutional actors—can be particularly important
for retaining underrepresented students in STEM fields.31
Acknowledging that money is often a factor in college student attrition, some SSA programs offered financial
support to participants, through scholarships, paid internships, stipends, tuition waivers, or in-kind help.32
To prepare students for career and transfer, sites created or connected students to internships, research
opportunities, and professional mentorships.33 They also
offered resume review sessions, networking events, field
trips, and 2- to 4-year transfer academies.

8
Beginning in Year 6, DHE began developing a case management model that would transition SSA programs
from discrete interventions focused on particular
elements of a student’s academic trajectory (recruitment,
readiness, retention, completion) to a model with a core
focus on supporting a set of students along a through-
line from entry to completion.
The introduction of this model marked a data-driven
change in emphasis and practice for SSA. At launch, SSA
focused on filling gaps in services for students at individual
points along their paths from entry to completion. By the
end of Year 5, SSA data showed that the majority of
participants (over 75%) had been actively engaged with SSA for only a single term. Based on such findings and on
STEM completion data, DHE and the SSA community broadened that original focus, embracing a model that
ensures supportive connections at every point along a student’s trajectory (see page 11).
In depth connections and relationships inherent in this
model help students feel integrated in the college community. This may be particularly helpful for
nontraditional students—and especially for those who are floundering in the current circumstances being shaped by
the COVID-19 pandemic.
Program Development
The SSA learning community is developing its latest innovation: a focus on supporting students along a through-line from entry to completion
The SSA Case Management model is sustained, strategic, and
personalized—features that the literature suggests helps students have better long-term outcomes.34
Phase 3 (Year 6+): Case management and through-line Spotlight: SSA case management
At the heart of the SSA case management model is an
intensive approach to supporting community college
STEM students—or those thinking about STEM—and connecting them to appropriate academic and non-
academic services. The goal of the model is to identify and resolve barriers and challenges that inhibit
student success in STEM and to support students from entry through to completion. Both the model and its
implementation are in their early stages.
In fall 2019, DHE began collaborating with SSA colleges to identify core elements of its case management
model. In its prototypical form, this model includes:
the identification of an academic pathway (with clearly established career or transfer goals);
the development and monitoring of an academic plan;
monitoring math and gateway course completion;
participation in STEM professional or STEM
leadership opportunities;
community-building activities with peers; and,
post-community-college support.
As the SSA case management model continues to
evolve, it holds promise as a strategy for addressing equity gaps in STEM outcomes. Some research-based
strategies included in the SSA case management model are considered particularly effective with traditionally
underserved populations. For instance, research has shown that providing transparency and structure to
students has led to positive results.35

9
Findings

Asian5%
Black21%
Latinx19%
White47%
Other8%
10
Participant Characteristics
SSA participants reflect the diversity of community college students
SSA was designed to serve undeclared students and STEM-interested students. STEM students make up a
consistently higher proportion of SSA participants than
they do of the entire community college population.
SSA participants come from a broad range of personal backgrounds, into which quantitative data offer a small
window. Overall, just over half of SSA participants are female (Figure 1). While representation varies, this is
important because women continue to be under-represented in many STEM fields.36
One third of SSA participants overall are considered to be non-traditional aged students (not shown). These students
are age 25 and older when they first participate. Overall, over half of SSA participants (54%) attend school part time
(not shown).
In fall 2019, 57% of SSA participants were STEM students, compared to 31% of community
college students overall.
Regarding race/ethnicity, participants are generally similar
to the community college population, though the SSA
program serves a slightly larger proportion of students of color. Just under half of participants are White (Figure 1),
fewer than community college students overall.
STEM status
SSA consistently serves a higher proportion of Black students compared to the community college population overall.
Demographic characteristics
Figure 1: Demographic Characteristics of SSA Participants Overall, 2014–2019
Female53%
Male46%
Unknown 1%
Race/Ethnicity Gender

11
Evidence & Outcomes
SSA Year First Participated
Earned degree or certificate
Transferred to 4-year institution
Retained at original CC in Fall 2019
Transferred to 2-year institution
Indeterminatestatus
Year 1 42% 10% 4% 4% 40%
Year 2 37% 11% 5% 4% 44%
Year 3 35% 11% 9% 3% 41%
Year 4 27% 11% 17% 3% 41%
Year 5 15% 10% 33% 2% 39%
Year 6 5% 5% 58% 2% 30%
Year 7 0% 0% 99% 0% 1%
Overall 23% 9% 30% 3% 36%
†Mutually exclusive outcomes are listed from left to right in order of priority (e.g. “earned a degree or certificate” is considered a higher outcome than “transferred to 4-year institution”). Some Group 1–3 (Primary) Participants were not trackable (i.e., were not found in HEIRS). This includes those who did not have a SSN, and those who had been assigned a student ID number (for tracking within an institution) but had not registered for a course (e.g., high school participants that returned to high school).37
Table 1: Highest Outcome Achieved as of Fall 2019, by Year of First SSA Participation†
In addition to completing descriptive analyses, UMDI
evaluated the effectiveness of the SSA intervention using
rigorous, quasi-experimental, matched-comparison-group designs. These statistical analyses compared the
outcomes of SSA participants with those of similar students who did not participate in the intervention. A full
description of quantitative methods is included in
Appendix B. Results from these analyses are discussed on
the following two pages.
Two outcomes were assessed using this design:
1. Positive educational outcomes—a broad measure of student progress and retention that includes those
who were retained, completed, transferred to a 4-year institution, or joined the STEM workforce.
2. STEM degree and certificate earning—an important
measure of success that is part of the SSA program
goals.
SSA students continue to advance toward higher-level outcomes years after initial participationSSA participants were assessed for the highest outcome achieved as of Fall 2019 (Table 1). Overall, almost two
thirds of participants to date (64%) have earned a degree or certificate, have transferred to a 4-year institution,
have joined the STEM workforce, or are continuing their education at the community college (see “Overall” row).
In general, students continued to achieve higher-level outcomes with each additional year since starting with
SSA. The proportion of students earning degrees and
certificates rose each year, from 5% among those who
started in Year 6, to 15% among the Year 5 cohort, and eventually to 42% among those who started in Year 1.
Transfer to a 4-year institution (without earning a degree
or certificate at the community college) reached 10%–11% and remained in that range for the Year 1 to Year 5
cohorts.
Quasi-experimental modeling procedures
Overall, 64% of SSA participants have achieved positive outcomes.
12
Evidence & Outcomes
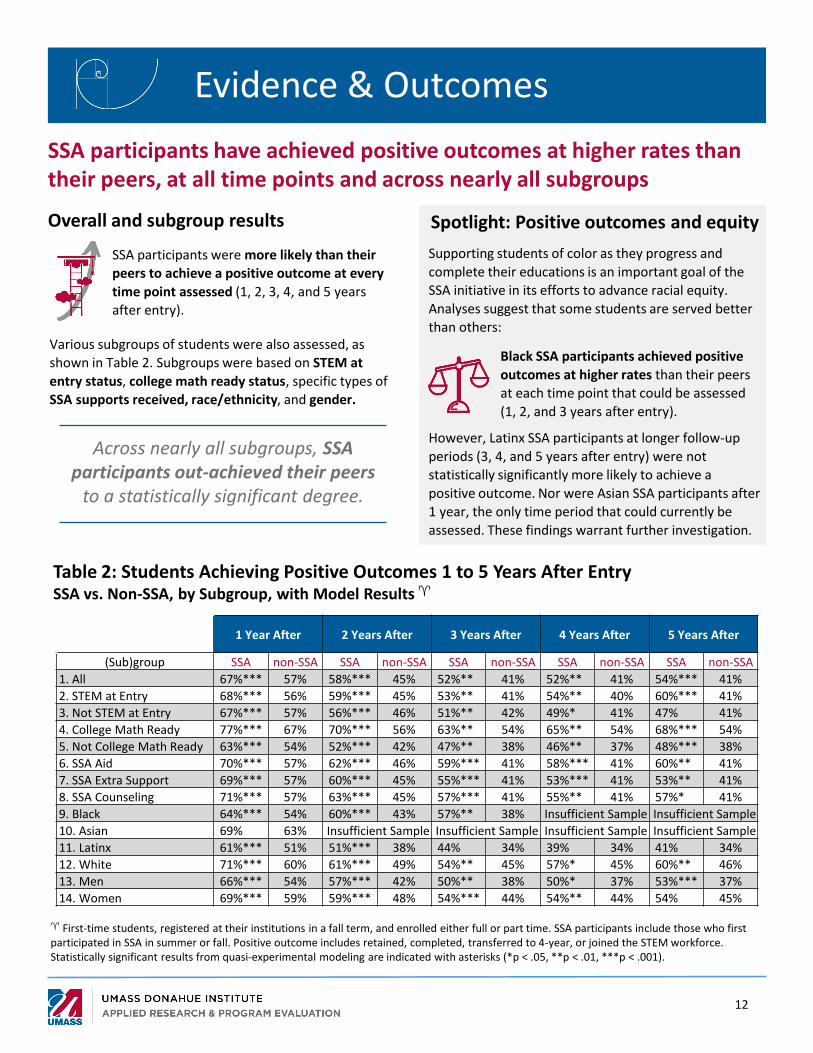
First-time students, registered at their institutions in a fall term, and enrolled either full or part time. SSA participants include those who first participated in SSA in summer or fall. Positive outcome includes retained, completed, transferred to 4-year, or joined the STEM workforce. Statistically significant results from quasi-experimental modeling are indicated with asterisks (*p < .05, **p < .01, ***p < .001).
1 Year After 2 Years After 3 Years After 4 Years After 5 Years After
(Sub)group SSA non-SSA SSA non-SSA SSA non-SSA SSA non-SSA SSA non-SSA
1. All 67%*** 57% 58%*** 45% 52%** 41% 52%** 41% 54%*** 41%
2. STEM at Entry 68%*** 56% 59%*** 45% 53%** 41% 54%** 40% 60%*** 41%
3. Not STEM at Entry 67%*** 57% 56%*** 46% 51%** 42% 49%* 41% 47% 41%
4. College Math Ready 77%*** 67% 70%*** 56% 63%** 54% 65%** 54% 68%*** 54%
5. Not College Math Ready 63%*** 54% 52%*** 42% 47%** 38% 46%** 37% 48%*** 38%
6. SSA Aid 70%*** 57% 62%*** 46% 59%*** 41% 58%*** 41% 60%** 41%
7. SSA Extra Support 69%*** 57% 60%*** 45% 55%*** 41% 53%*** 41% 53%** 41%
8. SSA Counseling 71%*** 57% 63%*** 45% 57%*** 41% 55%** 41% 57%* 41%
9. Black 64%*** 54% 60%*** 43% 57%** 38% Insufficient Sample Insufficient Sample
10. Asian 69% 63% Insufficient Sample Insufficient Sample Insufficient Sample Insufficient Sample
11. Latinx 61%*** 51% 51%*** 38% 44% 34% 39% 34% 41% 34%
12. White 71%*** 60% 61%*** 49% 54%** 45% 57%* 45% 60%** 46%
13. Men 66%*** 54% 57%*** 42% 50%** 38% 50%* 37% 53%*** 37%
14. Women 69%*** 59% 59%*** 48% 54%*** 44% 54%** 44% 54% 45%
Table 2: Students Achieving Positive Outcomes 1 to 5 Years After EntrySSA vs. Non-SSA, by Subgroup, with Model Results
SSA participants were more likely than their
peers to achieve a positive outcome at every
time point assessed (1, 2, 3, 4, and 5 years after entry).
SSA participants have achieved positive outcomes at higher rates than their peers, at all time points and across nearly all subgroups
Spotlight: Positive outcomes and equity
Supporting students of color as they progress and
complete their educations is an important goal of the SSA initiative in its efforts to advance racial equity.
Analyses suggest that some students are served better than others:
Black SSA participants achieved positive
outcomes at higher rates than their peers
at each time point that could be assessed
(1, 2, and 3 years after entry).
However, Latinx SSA participants at longer follow-up
periods (3, 4, and 5 years after entry) were not
statistically significantly more likely to achieve a
positive outcome. Nor were Asian SSA participants after
1 year, the only time period that could currently be
assessed. These findings warrant further investigation.
Overall and subgroup results
Across nearly all subgroups, SSA participants out-achieved their peers
to a statistically significant degree.
Various subgroups of students were also assessed, as shown in Table 2. Subgroups were based on STEM at
entry status, college math ready status, specific types of
SSA supports received, race/ethnicity, and gender.

13
Evidence & Outcomes
First-time students, registered at their institutions in a fall term, and enrolled full time. SSA participants include those who first participated in SSA in summer or fall. Statistically significant results from quasi-experimental modeling are indicated with asterisks (*p < .05, **p < .01, ***p < .001).
2 Years After 3 Years After 4 Years After 5 Years After
(Sub)group SSA non-SSA SSA non-SSA SSA non-SSA SSA non-SSA
1. All 4% 2% 10% 5% 14% 7% 17% 9%
2. STEM at Entry 7% 7% 17% 14% 23% 20% 26% 23%
3. Not STEM at Entry 1% 0% 1% 1% 3% 3% 5% 4%
4. College Math Ready 7%** 3% 14%* 6% 19%** 10% 29%* 14%
5. Not College Math Ready 3% 2% 8% 4% 12% 6% 11% 7%
6. SSA Aid 6% 2% 16%* 5% 20% 7% 22% 9%
7. SSA Extra Support 4% 2% 12% 5% 14% 7% 15% 9%
8. SSA Counseling 6% 2% 14%* 5% 18% 7% 21% 9%
9. Black 4% 2% 11%* 3% Insufficient Sample Insufficient Sample
10. Asian Insufficient Sample Insufficient Sample Insufficient Sample Insufficient Sample
11. Latinx 3% 1% 8% 4% 9% 5% Insufficient Sample
12. White 4% 3% 11% 5% 14% 8% 15% 10%
13. Men 5% 3% 11% 5% 16% 7% 18% 8%
14. Women 3% 2% 9% 4% 12% 7% 14% 9%
Table 3: Students Earning STEM Degrees and Certificates 2 to 5 Years After EntrySSA vs. Non-SSA, by Subgroup, with Model Results
Analyses show that SSA students are achieving positive outcomes, but more work is needed to address STEM degrees and certificates
SSA participants appear to earn STEM degrees and certificates at higher rates than their peers, but not to a statistically significant level. Additional data are needed to clarify this ambiguous result.
Spotlight: Successes in STEM completion
For nearly all groups, effects of participation were positive but not statistically significant. There were
positive and significant results for two groups:
Black SSA participants earned STEM
degrees and certificates at higher rates than their peers 3 years after entry, the
furthest time point that could be assessed.
Among college math ready students, SSA
participants earned STEM degrees and certificates at significantly higher rates
than their peers at all time points.
SSA participants were not statistically
significantly more likely to earn a STEM degree
or certificate at every time point assessed (2, 3,
4, and 5 years after entry), as shown in Table 3.
Analyzing the statistical significance of modeling results
allows for more certainty that the data represents impacts that are not due to chance alone. It also ensures that
baseline differences between SSA participants and non-participants are taken into account.
Across all groups, the percentage of students earning
STEM degrees and certificates appears to be higher for SSA participants than for non-participants. Statistically
significant differences are noted (*).
Overall and subgroup results

14
End Notes
1. Malcom, S., & Feder, M. (Ed.) (2016). Barriers and opportunities for 2-year and 4-year STEM degrees:
Systemic changes to support students’ diverse
pathways. http://www.nap.edu/21739; Dimino, M.
(2019). How outcomes metrics can better reflect community college performance.
http://www.thirdway.org/report/how-outcomes-metrics-can-better-reflect-community-college-
performance
2. Massachusetts Association of Community Colleges.
(n.d.). Fast facts. https://www.masscc.org/about-mcceo/fast-facts. Data from this source is from
FY2018.
3. Ibid.; Massachusetts DHE Data Center (n.d.). Report:
Adult learners at Massachusetts public colleges&
universities—realities& opportunities.
https://www.mass.edu/datacenter/2017adultlearners.asp
4. Dimino (2019).
5. Ibid.
6. Zinshteyn, M. (2019). An Inside Higher Ed special report. Success at scale: Strategies to improve
outcomes for underserved students. Inside Higher Ed.
https://www.insidehighered.com/content/success-scale-strategies-improve-outcomes-underserved-
students
7. Malcom & Feder (2016).
8. Smith, A. (2019, February 24). Next on college completion agenda: Equity. Inside Higher Ed.
https://www.insidehighered.com/news/2019/02/25/community-colleges-focus-equity-next-piece-
completion-agenda; Malcom & Feder (2016).
9. Libassi, C. J. (2018, May 23). The neglected college
race gap: Racial disparities among college
completers.
https://cdn.americanprogress.org/content/uploads/2018/05/22135501/CollegeCompletions-Brief1.pdf
10. Retrieved from the Massachusetts Department of Higher Education website:
https://www.mass.edu/datacenter/equityspotlight-
latinomales.asp
11. Malcom & Feder (2016).
12. This excludes health fields, where women are 75%
of the workforce. Adapted from Funk & Parker (2018). Women and men in STEM often at odds
over workplace equity. Pew Research Center:
https://www.pewsocialtrends.org/2018/01/09/dive
rsity-in-the-stem-workforce-varies-widely-across-jobs/
13. Retrieved from the Massachusetts Department of Higher Education website:
https://www.mass.edu/datacenter/equityspotlight-latinomales.asp
14. Retrieved from the Massachusetts Department of Higher Education website:
https://www.mass.edu/datacenter/PMRS/reports/2019/Success-Completion.asp
15. Dimino (2019); Dowd, A., & Bensimon, E. A. (2015).Engaging the “race question”, accountability and
equity in U.S. higher education. In J.Banks (Ed.), Multicultural Education Series. Teachers College,
Columbia University.
16. Bailey, T., Smith Jaggars S., & Jenkins, D. (2015).
Redesigning America’s community colleges: A clearer path to student success. Harvard University
Press; Lee, J. (2015, September 17). Rethinking community college to boost enrollment and
completion [Blog post]. https://www.brookings.edu/blog/the-
avenue/2015/09/17/rethinking-community-college-
to-boost-enrollment-and-completion
17. Bailey (2015); Schwartz, N. (2019, April 15).
Community colleges embracing “guided pathways”
see pay-off. EducationDive. https://www.educationdive.com/news/community-
colleges-embracing-guided-pathways-see-payoff/552684.

15
End Notes
18. See more about the SSA case management approach on page 8.
19. Rodriguez, F. C. (2015). Why diversity and equity
matter: Reflections from a community college
president. New Directions for Community Colleges
2015(172 ), 15–24.; Dowd & Bensimon (2015);
Malcom-Piqueux, L., & Bensimon, E. M. (2017). Taking equity-minded action to close equity gaps.
Peer Review, 19(2), 5.
20. For example, see Rodriguez (2015).
21. Rodriguez (2015, p.15)
22. Retrieved from the Massachusetts of Higher
Education website: https://www.mass.edu/datacenter/PMRS/reports/2
019/Success-Completion.asp
23. Ibid.
24. Ibid.
25. Datnow, A., Hubbard, L., & Mehan, H. (2002).
Extending educational reform. Taylor & Francis; Kezar, A. (2011). What is the best way to achieve
broader reach of improved practices in higher education? Innovative Higher Education, 36(4), 235–
247.
26. STEM Starter Academy RFP (2013).
27. Snyder, J., Bolin, F., & Zumwalt, K. (1992).
Curriculum implementation. Handbook of research
on curriculum, 40(4), 402–435; McLaughlin, M. W., & Mitra, D. (2001). Theory-based change and
change-based theory: Going deeper, going broader. Journal of Educational Change, 2(4), 301–323;
Coburn, C. E. (2003). Rethinking scale: Moving beyond numbers to deep and lasting change.
Educational researcher, 32(6), 3–12; Datnow, A., Hubbard, L., & Mehan, H. (2002); Gehrke, S., &
Kezar, A. (2017). The roles of STEM faculty
communities of practice in institutional and
departmental reform in higher education. American Educational Research Journal, 54(5), 803–833.
Kezar, A., & Gehrke, S. (2017). Sustaining communities of practice focused on STEM reform.
The Journal of Higher Education, 88(3), 323–349;
Daly, A. J. (2010). Mapping the terrain: Social
network theory and educational change. In A. J. Daly (Ed.), Social network theory and educational
change (pp. 1–17). Harvard Education Press.
28. Boroch, D., & Hope, L. (2009). Effective practices for
promoting the transition of high school students to
college: A review of literature with implications for
California community college practitioners. Academic Senate for California Community Colleges;
Hagedorn, L. S., & Purnamasari, A. V. (2012). A realistic look at STEM and the role of community
colleges. Community College Review, 40(2), 145–164.
29. Boroch, D., & Hope, L. (2009). Math readiness, in particular, continues to be a barrier for community
college students interested in STEM, and SSA practices such as co-requisite remediation are
considered best practices by the research community:
a. Bragg, D. D. (2012). two-year college mathematics and student progression in
STEM programs of study. In National
Research Council and National Society for
Engineering report: Community colleges in the evolving STEM education landscape:
Summary of a summit. http://www.nap.edu/catalog.php?record_id
=13399;
b. Chaplot, P., Rassen, E., Davis Jenkins, P., &
Johnston, R. (2013). Principles of redesign:
Promising approaches to transforming
student outcomes. Community College
Research Center, Columbia University.
16
End Notes
c. Many sites have worked to contextualize their college navigation courses for STEM,
and this is supported by the literature, which
suggests that creating engaging
opportunities to learn college navigation skills that feel relevant to students’ plans and
goals can help with retention.Karp, M.M. (2011). Toward a new
understanding of non-academic student
support: Four mechanisms encouraging
positive student outcomes in the community college (Working Paper No. 28). Community
College Research Center.
d. Nodine, T., Jaeger, L., Venezia, A., & Bracco,
K. R. (2012). Connection by design: Students’ perceptions of their community college
experiences. WestEd.
e. Chaplot, P., Rassen, E., Davis Jenkins, P., &
Johnston, R. (2013).
f. Dadgar, M., Venezia, A., Nodine, T., &
Bracco, K.R. (2013). Providing structured pathways to guide students toward
completion. WestEd.
g. Scrivener, S., & Coghlan, E. (2012). Opening
doors to student success: A synthesis of findings from an evaluation at six community
colleges (MDRC paper). http://www.mdrc.org/publication/opening-
doors-student-success
30. Practices that are supported by research. For
example:
a. Karp, M. M., Hughes, K. L., & O'Gara, L.
(2010). An exploration of Tinto's integration
framework for community college students.
Journal of College Student Retention:
Research, Theory & Practice, 12(1), 69–86.
b. Karp (2011).
c. Hodara, M. (2013). Improving students’ college math readiness: A review of the
evidence on postsecondary interventions
and reforms (Working Papers Series).
Community College Research Center. http://dx.doi.org/10.7916/D8M32SS7
d. Packard, B. W. L. (2012). Effective outreach, recruitment, and mentoring into STEM
pathways: Strengthening partnerships with
community colleges. In Community colleges
in the evolving STEM education landscape: Summary of a summit. National Research
Council and National Society for Engineering.
e. Scrivener& Coghlan (2012).
f. Deil-Amen, R. (2011). Socio-academic integrative moments: Rethinking academic
and social integration among two-year college students in career-related programs.
The Journal of Higher Education, 82(1), 54–91.
g. Strayhorn, T. L. (2019). College students' sense of belonging: A key to educational
success for all students (2nd ed.). Routledge.
h. Packard, B. W. L. (2004). Mentoring and
retention in college science: Reflections on the sophomore year. Journal of College
Student Retention: Research, Theory & Practice, 6(3), 289–300.
i. Starobin, S. S. (2004). Gender differences in college choice, aspirations, and self-concept
among community college students in science, mathematics, and engineering
[Unpublished doctoral dissertation].
University of North Texas.
31. Strayhorn (2019).
17
End Notes
32. Dowd, A. C., & Coury, T. (2006). The effect of loans
on the persistence and attainment of community
college students. Research in Higher Education, 47(1), 33–62; Hagedorn, L. S., Maxwell, W., &
Hampton, P. (2001). Correlates of retention for African-American males in community colleges.
Journal of College Student Retention: Research, Theory & Practice, 3(3), 243–263; Paulsen, M. B., &
John, E. P. S. (2002). Social class and college costs: Examining the financial nexus between college
choice and persistence. The Journal of Higher Education, 73(2), 189–236.
33. Literature suggests that undergraduate research
improves academic outcomes and encourages
students to pursue science careers.
a. Gregerman, S. R. (2008). The role of
undergraduate research in student retention,
academic engagement, and the pursuit of
graduate education. National Academy of
Science: Promising Practices in STEM
Education.
b. Hathaway, R. S., Nagda, B. A., & Gregerman,
S. R. (2002). The relationship of undergraduate research participation to
graduate and professional education pursuit: An empirical study. Journal of College
Student Development, 43(5), 614–631.
c. Jones, M. T., Barlow, A. E., & Villarejo, M.
(2010). Importance of undergraduate
research for minority persistence and
achievement in biology. The Journal of
Higher Education, 81(1), 82–115.
d. Lopatto, D. (2004). Survey of undergraduate research experiences (SURE): First findings.
Cell Biology Education, 3(4), 270–277.
e. Russell, S. H., Hancock, M. P., & McCullough,
J. (2007). Benefits of undergraduate research experiences. Science, 316(5824), 548–549.
f. Seymour, E., Hunter, A. B., Laursen, S. L., &
DeAntoni, T. (2004). Establishing the benefits
of research experiences for undergraduates in the sciences: First findings from a
three‐year study. Science Education, 88(4),
493–534.
34. Karp, M., Mechur, J., Stacey, G. W. (2013). What we know about nonacademic student supports:
Research overview. Community College Research Center, Columbia University.
http://dx.doi.org/10.7916/D88G8HPJ
35. Rassen, E., Chaplot, P., Jenkins, P. D., & Johnstone,
R. (2013). Understanding the student experience
through the loss/momentum framework: Clearing
the path to completion. Community College Research Center, Columbia University.
https://doi.org/10.7916/D8N58JC7
36. For example, see Chen, G. (2019). Fewer women
pursuing STEM programs at community college today. Community College Review.
https://www.communitycollegereview.com/blog/fewer-women-pursuing-stem-programs-at-
community-college-today; and Funk & Parker (2018).
37. See glossary in Appendix A for definition of terms used in this report (e.g., Indeterminate Status).
STEM workforce numbers are not shown in Table 1. This outcome was measured using an exit survey—
administered to current and former SSA participants—that received very low response rates.
Students who reported joining the STEM workforce
made up less than 1% of SSA participants. DHE will
continue to explore alternative measures for assessing this outcome.


![STEM community BLUEPRINT · [STEM COMMUNITY BLUEPRINT] ... Technology, Engineering, ... scale STEM education at the middle grades. The EYE on STEM Leadership Academy](https://img.pdfslide.net/doc/110x75/5ada1bd77f8b9add658c327e/stem-community-stem-community-blueprint-technology-engineering-scale.jpg)