Embed Size (px)
Citation preview

57 2/03
STEP 1d: VULNERABILITY ASSESSMENT
A Vulnerability Assessment gives quantitative estimates of the people and property in your community that arevulnerable to each hazard. The simplest technique to assess vulnerabilities is to compare the community profilemap with hazard maps for the same area, to find areas where hazards overlap with the locations of people,structures and infrastructure. Areas where hazards overlap with development should be examined more closelyto estimate what kinds of damages might occur during an emergency event. The goal should be to producespecific information that measures the threats from each hazard (depth of flooding, amount of serviceinterruption, amount of traffic delays, number of casualties, amounts of physical damage, economic costs,number of families displaced, and so on). As shown in the last section (on Risk Assessment), information suchas the number of persons at risk, the number of structures vulnerable to damage, or estimates of economiclosses, are all quantifiable concepts. There is no need at this point to reach perfect accuracy with thesemeasurements. In the hazard analysis, they will mainly be used to compare hazards with each other, to prioritizethem and determine which ones your community is most vulnerable to. An advanced hazard analysis can alsoallow a cost-benefit analysis to be performed, which will mathematically justify the expense of mitigationprojects, land use restrictions, and other important policy decisions. A Risk Assessment Table, as shownpreviously, is often merely a convenience to summarize the results of a detailed analysis. In a detailed analysis,hazard-specific disaster scenarios can be considered, in which "worst-case scenarios" are considered. Suchscenarios are essentially a brainstorming activity to aid in determining what additional impacts each hazardmight cause. The types of impacts that may be considered include:
• Impacts on specific sectors of the community (see previous page regarding multi-jurisdictional plans)• Damage to structures – the number and type of structures, estimated costs of damage (including contents)• Life safety consequences and issues (potential deaths, injuries, search and rescue situations, etc.)• Critical loss of function consequences and issues (lifelines, police/fire/EMS, special needs groups, etc.)• Public health consequences and issues such as contaminated water, disease, vector control (insects and
animals that can spread disease to humans), etc.• Economic consequences and issues (loss of business activity, unemployment, response and recovery costs)• Recovery issues and concerns (re-building public and private facilities, housing needs, project funding,
hazard mitigation, etc.)
After applying the various hazard-specific disaster scenarios, the community will have a good idea, in terms ofpotential numbers, of what it could reasonably expect to encounter in similar situations. It may not be necessaryto develop and apply scenarios for EVERY known hazard in the community. At this stage of the analysis,efforts may be focused toward the most important hazards. Each community will have to make thatdetermination based on its needs, priorities and resources. Vulnerabilities will later be addressed throughspecific mitigation strategies. (See steps 2 through 5.) Your plan should contain enough detail to helpFEMA estimate whether a particular mitigation project will pass a cost-benefit analysis (see Appendix B).
Text, tables and maps can be used to depict the consequences, issues and considerations raised in the disasterscenarios. This could then serve as a basis for determining community priorities for mitigation activities,emergency planning, and resource allocation. The results should also be used by the community’s land use andpublic facility planners to avoid allowing future developments in hazardous areas.
A Flood Vulnerability map appears on the next page as an example of identifying areas where a hazard overlapswith urban developments. Notice that this vulnerability map allows more detail because it focuses only on onesmall portion of a community, in which a floodplain overlaps with developed areas. The background layer ofthe map (identifying structures, water bodies, and other community features) was adapted from existing USGSinformation. (Such information can be obtained at http://www.topozone.com/, among other sources.) Areas onthis base map were then highlighted and marked with descriptive text boxes, using ordinary office software, toproduce a customized flood vulnerability map suitable for use in a hazard mitigation plan.
A second map (produced in the same way) follows the first one, to give some more ideas of the type of analysisthat is desirable when analyzing spatial hazards such as urban, riverine, and shoreline flooding. As notedbefore, these maps were originally in color to help readers sort through the provided information.

58 2/03
EXAMPLE OF FLOOD HAZARD SECTOR MAPFOR A VULNERABILITY ASSESSMENT
Appropriate text description would accompany these sorts of maps in an actual mitigation plan. Areas ofidentified vulnerabilities would also be included in the community's mitigation goals as they proceed from theirhazard analysis into developing an actual hazard mitigation plan. (This will be covered in the next section:"Step 2: Define Goals and Objectives.")
The areas identified on vulnerability maps can be compared with tax assessment or decennial census data toestimate the nature and number of persons and property at-risk. For commercial businesses, direct inquiries,
Recurrent andproblematic streetflooding
Recurrent andproblematicstreet flooding
Higher-riskfloodplain areas
HARRISONTOWNSHIP
Higher-riskfloodplain areas

59 2/03
surveys, or government information (from the economic census, County Business Patterns, the RegionalEconomic Information System) can be helpful for determining loss of jobs, productivity, and so on.
Impacts on area infrastructure and services should also be noted where possible. The locations of specificmitigation projects (such as the "pumping station improvements" in the map above) can also be identified, oncethese projects have been determined to be desirable for the community.
As with Risk Assessment information, a summary table can be produced that summarizes different types ofidentified hazard vulnerabilities in your community. Some of these may not be easily quantified, but are stillimportant to consider. A table appears on the next page to illustrate this.
Shoreline floodrisk areas
Will benefit frompumping stationimprovements
Street floodingencroaches onhomes
Floodplain areasnear drains HARRISON
TOWNSHIP
What is the Difference between Risk and Vulnerability?This workbook has tended to blend the Risk and Vulnerability Assessments together, because in hazardmitigation planning, there is not firm agreement about exactly where the line is drawn between theseconcepts when creating a hazard analysis. One tradition holds that risk is a more general concept, andvulnerability is a more specific, quantitative assessment of the anticipated effects of hazards. In a similarsense, one can see "risk" as describing specific hazards such as severe weather (a particular chance of acertain amount of snowfall, for example), while vulnerability then examines the sort of impact that suchhazards are actually likely to have on the community. A house may exist in a floodplain (according to a riskassessment) but if the house has been elevated above expected flood levels, it may not actually be vulnerableto such a hazard.
Any of these approaches can be fine, as long as the ultimate goals of a hazard analysis are achieved. Hazardsshould be assessed and vulnerable areas of the community should be identified. Priorities should be set,because any good analysis will reveal that some risks are more threatening than others. The best availableinformation and planning expertise should be utilized to sort through the many potential hazard impacts thatexist. The nature of hazards, information, and planning resources will vary in each community

60 2/03
(name of community) Vulnerability Determination: (year)(EXAMPLE)
HAZARD Sector Issues Life SafetyIssues
Loss ofFunction Issues
1. (FOREXAMPLE):Riverine Flooding
a. 80% of Pine Twp.residents are elderlyb. Only bridge inVillage of Stormy isfloodpronec. Seafarer Twp. hassummer populationincrease of 35,000peopled. City of RollingHills has manybusinesses in PineRiver floodplain
a. Flash flood on PineRiver could result inmany deaths andinjuriesb. Large number ofelderly residents incounty makes warningdifficultc. County has limitedwater rescue capabilityd. Propane tanks infloodplain notanchored
a. No backupgenerator in policestation in City ofRolling Hillsb. Rolling Hills firestation located infloodplainc. Several sewage liftstations in Pine Twp.are prone to flooddamaged. Gas main underPine River bridgevulnerable
Public HealthIssues
EconomicIssues
Recovery Issues
a. Floodingcontaminates privatewells in Pine Twp.b. Flooded buildingsbecome contaminatedc. Mosquito, rodentand snake populationsswell after floodingd. Flood-soaked debrisgets piled up for longperiods of time
a. Businesses in PineRiver floodplain mustclose for up to twoweeksb. Post-flood recoveryand cleanup costs arevery highc. Public facilities inRolling Hills incurrepetitive damage
a. Damaged publicfacilities cannot beused for up to twoweeks after floodb. Flooded residentsmust be temporarilyhoused for up to twoweeksc. Potential forbusiness closures dueto repetitive flooddamage
Another Technique for Prioritizing Hazards
A useful task in the Vulnerability Assessment is to rank hazards according to how vulnerable your community isto each of them. The Risk Assessment Summary Table shown previously had a column in which this rankingcould be inserted. Such ranking will help to prioritize mitigation efforts according to the severity of a hazard'srisks which they address. The technique of assigning appropriate monetary values to the various types of harmthat could occur has already been suggested as a vital part of an advanced hazard analysis document. As part ofa standard hazard analysis (or when certain types of vulnerability are not readily quantifiable in dollar terms), asomewhat simpler technique may be used to determine priorities and provide a framework for awareness,analysis, debate, and consensus-building in your community. The essential concept of this technique is to breakeach hazard into different components of risk and to weigh hazards against each other using a "weightedaverage." Instead of a normal average which would treat each aspect of a hazard as equal, a weighted averagespecifies that although all effects of a hazard may be significant, some hazard impacts are much more importantthan others, and therefore weigh more heavily in an overall assessment of the community's risks and priorities.The next few pages give a step-by-step description of how this technique can be used to determine yourcommunity's priorities, and to guide public understanding, input, debate, and agreement on the topics.
(NOTE: This information was presented as an optional technique under Appendix B in the previous edition ofthis workbook. It is now recommended that this, some similar technique such as the economic quantificationdescribed in the Risk Assessment section of this workbook, or a similarly detailed method shall be used toexplain how risks to your community were assessed and prioritized in your hazard analysis. The techniquegiven over the next few pages is really not that difficult so long as the instructions are understood and followedstep-by-step. If any questions arise, or if you wish to request more specific instruction, please contact the MikeSobocinski, Local Hazard Mitigation Planner with MSP-EMD, at 517/336-2053 or [email protected].)

61 2/03
This "weighted average" technique of assessing and prioritizing your hazards should be used if you have troubleusing another technique to quantify and compare the different hazards facing your community. It will also beextremely useful to describe to others (at meetings, or those reading your hazard analysis and hazard mitigationplan) how you assessed that your community is more vulnerable to some hazards than to others. You willespecially want to use a technique like the Hazard Assessment Ratings described here if you do not have theinformation or resources to assess your risks in economic terms using the cost-benefit analysis or somecomparable technique as described in the Risk Assessment Section.
This section will describe each step of the process. Even if you are unfamiliar with the reasoning behind the useof a "weighted average," in the end the results should make sense to you. You will probably want to discussyour choices and use of this technique with other local officials to be certain that your conclusions reflect thegoals and attitudes of your community. If they do, it will be much easier to gain community support and officialapproval for your emergency management goals and mitigation projects as a result of the mitigation plan thatwill emerge from this process.
1. Choose evaluation criteria – A hazard can be seen in terms of the many potential impacts it can have on yourcommunity. Let us begin the analysis by considering these aspects of hazards. A list of suggested hazardaspects appears in the left column of the table below. Look over this list and determine what aspects of a hazardare of most concern to those in your community. (If you need to, look over the list of natural, technological, andsocial/societal hazards on the next page. These are the types of hazards you will be prioritizing based on this listof hazard aspects.) Are rare but destructive events of greater concern than persistently annoying hazards? If so,then you will want to pick hazard aspects that reflect that judgement. Go through the list (you may add newitems to it if you like) and determine (in consultation with others whenever possible) which items you and thosein your community feel would be useful in evaluating each hazard. Check the column that you feel bestdescribes how important each aspect of a hazard is. If you decide not to consider a particular aspect, mark theright column called "Not Worth Considering." Those aspects will not be considered in the assessment that willfollow. Marking any other column means that an aspect will at least be given a little bit of consideration inassessing which hazards are more important. You may select these columns for only a few aspects, or mayselect the entire list as at least worth considering, and even add a few more of your own items to the end of thelist (such as recovery issues or public health concerns, as listed in the Vulnerability Determination Table). Theimportant point is to select at least some items as a basis for assessing hazard vulnerabilities in your area.
Hazard Aspect AlwaysVeryImportant
UsuallyImportant
SometimesImportant
Rarely ofImportance
Not WorthConsidering
Likelihood of OccurrenceCapacity to cause physical damagesSize of Affected AreaSpeed of Onset (amount of warning time)Percent of population affectedPotential for causing casualtiesPotential for negative economic effectsDuration of threat from hazardSeasonal risk patternEnvironmental impactPredictability of hazardAbility of hazard impacts to be mitigatedAvailability of warning systemsPublic awareness of hazardCorollary effects (ability to cause other hazards)(Other considerations may be added to this list)
2. Assign "weights" to express the importance of each hazard aspect – If you have decided that some hazardaspects are not worth considering, remove them from the list. All remaining hazard aspects are of at least a littleimportance to you, and you now need to convert your initial selections into a clearer means of weighing theimportance of some hazard aspects against others. You may have picked the entire list as being of someimportance, or you may have picked only a few aspects as worth considering. (The fewer you pick, the easierthe analysis will be, but at minimum you should probably include the likelihood of occurrence [risk], and somemeasures of harm that could be caused [such as casualties and physical destructiveness].) Your task now is to

62 2/03
convert your choices into a set of numbers that all add up to 100 (or, as percentages that all add up to the numberone).
Envision in your mind the total effect of things you consider harmful to your community. (These things shouldbe covered in some way on the list of hazard aspects you have selected.) Now picture harm to your communityas being made up of the sum of all these different aspects that you have selected as important: negativeeconomic effects, property damage, loss of life, and so on. Now picture that since harm is composed of thesethings, each of them makes up a portion of the whole, just as slices of pie make up the entire pie. If you havepicked some hazard aspects as being more important than others, the ones that were considered most importantshould therefore make up larger slices of the overall pie. You might feel that casualties were the most importanthazard aspect, followed by the likelihood of occurrence, but that environmental impacts and political awarenessof the hazard must not be completely ignored. If we picture these hazard aspects as slices of a pie, you shouldestimate how big a slice is adequate to give to each one of these concerns about hazards. If the importance ofcasualties is greater than current political awareness of a given hazard, you should assign that a larger slice ofpie. The size of each slice will be measured as a percentage of the whole. Take 100 percentage points anddivide them up between all the hazard aspects you have selected above, so that more important aspects are givenmore points than less important ones. It doesn't need to be perfect at first; you can go back and change thenumbers later on after you've thought about it more and discussed it with others in your community.
The result of your "pie-slicing" will be numbers attached to each selected hazard aspect, which will add up to atotal of 100 percentage points (which equals a whole). If you have picked four aspects and they are all equallyimportant, each one accounts for 25% of the whole. Perhaps they are not equal; maybe the casualties slice of thepie is 50 percent of the whole, being considered twice as important as another that then accounts for 25 percent.The other two aspects will have 25 percent together (possibly 10% for one and 15% for the other) so that thetotal of all hazard aspects will be 100%. The degree of importance you gave each aspect in the table above canhelp you estimate what percentage (from the total of 100) to assign it. Those considered "always veryimportant" should be assigned a greater percentage than those considered "Usually Important" or "SometimesImportant," and so on. After you have compared these hazard aspects for a while, make sure the add up to100% and roughly express how casualties compare with economic impacts, and so on, in your view of what ismost important or potentially harmful to your community. You will then be ready to use these "weights" tomake a balanced comparison of your community's hazards, based on the aspects of hazards that were consideredimportant.
3. Begin to make a Hazard Assessment Rating Table – Make a table with a list of all significant hazards goingdown the left-most column. In the top row, label the other columns of the table with the aspects for hazardevaluation that you have just selected and assigned percentages to. Do not yet place numbers into any of thecells within this table. Merely begin by listing the hazards along the left, and the evaluation criteria along thetop. An example appears on the next page.

63 2/03
Hazard Assessment Rating TableEXAMPLE: FOR INSTRUCTIONAL PURPOSES ONLY
Hazard LikelihoodofOccurrence(30%)
Percent ofpopulationaffected(20%)
Potential forcausingcasualties(20%)
Potential fornegativeeconomiceffects(15%)
Corollaryeffects(10%)
Publicawareness ofhazard(5%)
Civil disturbancesDroughtEarthquakesExtreme temperatureScrap tire firesStructural firesWildfiresDam failuresRiverine floodingShoreline floodingFixed site hazmat incidentHazmat transportation incidentInfrastructure failuresNuclear attackNuclear power plant accidentsOil & gas well accidentsPipeline accidentsPublic health emergenciesTerrorism/sabotage/WMDSubsidenceHailLightningSevere windsTornadoesTransportation accidentsWinter weather hazards
EXAMPLE: FOR INSTRUCTIONAL PURPOSES ONLY
4. Select rating scale for each hazard evaluation aspect – Next, each cell in the table will be filled in with anumber from a specific rating scale, such as from 0 to 10. Using this scale, a rating of 0 would represent acondition that poses no threat to the community, while a rating of 10 would represent a condition of serious andunmitigated threat. Numbers in between 0 and 10 will represent conditions between these two extremes. Eachnumber in a cell will represent the seriousness of a hazard in terms of one of the hazard evaluation aspects youhave chosen. (NOTE: this new scale from 0 to 10 is not related to the 100 percentage points that you previouslyassigned among these criteria – those percentages are use to show how much weight each hazard aspect is beinggiven; each rating from 0 to 10 will be adjusted by the percentage weights in a later step of this process.)
Before you fill in any specific numbers, you should give some thought to what the numbers between 0 and 10will mean. This will help your rating of the hazards to be consistent and accurate. To illustrate, let's considerthe criterion of "Likelihood of Occurrence." This is a measure that you may have chosen (and may have alreadyestimated in a Risk Assessment Summary Table). A rating of zero on this measure that would represent theleast threatening condition, which would mean that there is no chance of occurrence in your community. Arating of 10 would represent a continually occurring hazard. In between these extremes, you might placenumbers such as "3: usually occurs once every 10 years", "5: occurs every year", "8: occurs every week", or anyother estimates that you consider appropriate for the hazards affecting your community. Think about the rangeof likelihoods for all the hazards in your area and use that to determine what a "3," "5," "7," and other numberswill actually stand for. Once you have written out your rating scale, you should be able to use it to rate all yourcommunities hazards from 0 to 10 on this aspect of threat (in this example, "likelihood of occurrence" is theaspect being considered).
Proceed on to your next chosen criterion and again come up with some ideas about a rating scale from 0 to10.For example, "size of affected area" would have conditions ranging from "0: none of my community would beaffected" to "10: my entire community would be affected." Go through your entire list of selected hazardaspects and define what numbers from 0 to 10 can be used to describe the range of conditions, from the least

64 2/03
threatening to the most, for that particular aspect of any hazard. Make sure that 0 is always the least threateningcondition. For example, on "Ability of hazard impacts to be mitigated," the least threatening condition would bea hazard that is easy to completely eliminate, while the most threatening condition is one that is impossible tomitigate. (Strategies to improve preparedness, response, or recovery would be appropriate for such hazards, ifthey truly can't be mitigated.)
5. Rate each hazard from 0 to 10 on all the aspects you have chosen – Now you should begin to insert valuesinto each cell of the table you have made. It is recommended that this be done in pencil, or that extra space beleft to change these values later in the analysis. A computer spreadsheet can also be used, which allows changesto be made very easily in the table.
For each hazard listed in the left column, go across its row to the right and fill in a rating from 0 to 10. Thenumbers represent your assessment of each aspect of the hazard, using the rating scales you have just created.Below is an example of what a table might look like after this step has been completed. After you have filled inall empty cells of your table with a number from 0 to 10 like this, you will then be ready to calculate the overallrisk from each hazard.
Hazard Assessment Rating TableEXAMPLE: FOR INSTRUCTIONAL PURPOSES ONLY
ALL NUMBERS IN TABLESHOW HOW EACHHAZARD RATES ON ASCALE FROM 0 TO 10.
Hazard:
LikelihoodofOccurrence(30%)
Percent ofpopulationaffected(20%)
Potential forcausingcasualties(20%)
Potential fornegativeeconomiceffects(15%)
Corollaryeffects(10%)
Publicawareness ofhazard(5%)
Civil disturbances 2 2 3 6 3 1Drought 3 7 1 5 3 2Earthquakes 1 5 1 2 2 1Extreme temperature 7 9 3 3 4 4Scrap tire fires 1 1 1 4 2 1Structural fires 9 1 4 4 2 5Wildfires 5 5 5 5 3 9Dam failures 2 2 8 7 5 3Riverine flooding 7 2 4 4 5 8Shoreline flooding 4 1 2 4 2 7Fixed site hazmat incident 3 1 6 4 2 4Hazmat transportation incident 6 3 6 4 3 2Infrastructure failures 7 9 3 5 5 8Nuclear attack 1 10 7 10 9 3Nuclear power plant accidents 1 1 1 2 2 2Oil & gas well accidents 2 1 3 3 3 1Pipeline accidents 2 3 5 6 5 2Public health emergencies 3 4 4 5 3 2Terrorism/sabotage/WMD 2 4 7 7 8 1Subsidence 1 1 1 1 2 1Hail 5 4 1 2 3 2Lightning 5 2 2 4 4 2Severe winds 6 9 3 4 6 4Tornadoes 3 6 6 8 7 8Transportation accidents 6 2 5 6 4 2Winter weather hazards 8 9 4 5 7 4
SCALE: from 0 (poses the least threat) to 10 (poses the greatest threat)EXAMPLE: FOR INSTRUCTIONAL PURPOSES ONLY
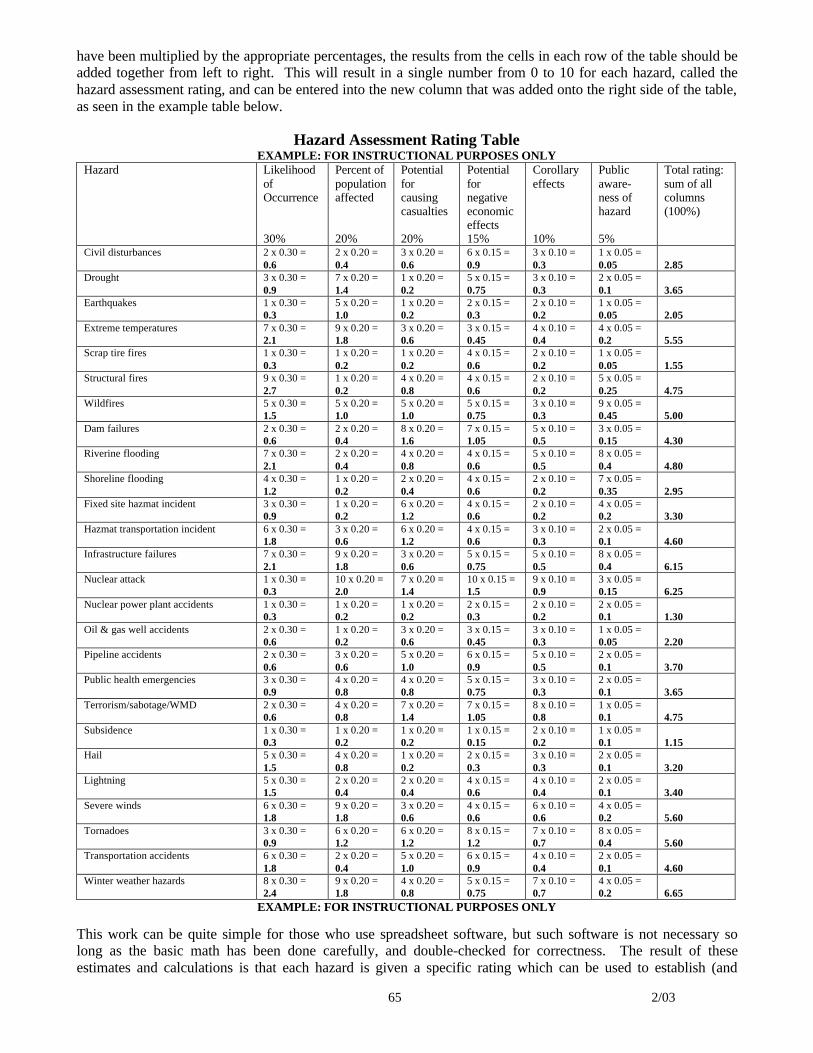
6. Calculate the overall hazard assessment ratings – The math is quite simple, since it only uses addition andmultiplication. A new column should be added on the right side of the Hazard Assessment Rating Table. Thenew column will contain the overall rating for each hazard, which will be calculated now. Take the percentageweight for each column and multiply it by the number in each cell that you have given a rating on the 0 to 10scale. Make sure that the same percentage is used for each entire (vertical) column in the table. In the exampletable above, each cell in the column marked "Likelihood of Occurrence (30%)" will be multiplied by .30—thenumerical equivalent of the percentage that was assigned to that aspect of the hazards. The next column marked"Percent of Population Affected (20%) will have each number multiplied by .20. After all the cells in the table
65 2/03
have been multiplied by the appropriate percentages, the results from the cells in each row of the table should beadded together from left to right. This will result in a single number from 0 to 10 for each hazard, called thehazard assessment rating, and can be entered into the new column that was added onto the right side of the table,as seen in the example table below.
Hazard Assessment Rating TableEXAMPLE: FOR INSTRUCTIONAL PURPOSES ONLY
Hazard LikelihoodofOccurrence
30%
Percent ofpopulationaffected
20%
Potentialforcausingcasualties
20%
Potentialfornegativeeconomiceffects15%
Corollaryeffects
10%
Publicaware-ness ofhazard
5%
Total rating:sum of allcolumns(100%)
Civil disturbances 2 x 0.30 =0.6
2 x 0.20 =0.4
3 x 0.20 =0.6
6 x 0.15 =0.9
3 x 0.10 =0.3
1 x 0.05 =0.05 2.85
Drought 3 x 0.30 =0.9
7 x 0.20 =1.4
1 x 0.20 =0.2
5 x 0.15 =0.75
3 x 0.10 =0.3
2 x 0.05 =0.1 3.65
Earthquakes 1 x 0.30 =0.3
5 x 0.20 =1.0
1 x 0.20 =0.2
2 x 0.15 =0.3
2 x 0.10 =0.2
1 x 0.05 =0.05 2.05
Extreme temperatures 7 x 0.30 =2.1
9 x 0.20 =1.8
3 x 0.20 =0.6
3 x 0.15 =0.45
4 x 0.10 =0.4
4 x 0.05 =0.2 5.55
Scrap tire fires 1 x 0.30 =0.3
1 x 0.20 =0.2
1 x 0.20 =0.2
4 x 0.15 =0.6
2 x 0.10 =0.2
1 x 0.05 =0.05 1.55
Structural fires 9 x 0.30 =2.7
1 x 0.20 =0.2
4 x 0.20 =0.8
4 x 0.15 =0.6
2 x 0.10 =0.2
5 x 0.05 =0.25 4.75
Wildfires 5 x 0.30 =1.5
5 x 0.20 =1.0
5 x 0.20 =1.0
5 x 0.15 =0.75
3 x 0.10 =0.3
9 x 0.05 =0.45 5.00
Dam failures 2 x 0.30 =0.6
2 x 0.20 =0.4
8 x 0.20 =1.6
7 x 0.15 =1.05
5 x 0.10 =0.5
3 x 0.05 =0.15 4.30
Riverine flooding 7 x 0.30 =2.1
2 x 0.20 =0.4
4 x 0.20 =0.8
4 x 0.15 =0.6
5 x 0.10 =0.5
8 x 0.05 =0.4 4.80
Shoreline flooding 4 x 0.30 =1.2
1 x 0.20 =0.2
2 x 0.20 =0.4
4 x 0.15 =0.6
2 x 0.10 =0.2
7 x 0.05 =0.35 2.95
Fixed site hazmat incident 3 x 0.30 =0.9
1 x 0.20 =0.2
6 x 0.20 =1.2
4 x 0.15 =0.6
2 x 0.10 =0.2
4 x 0.05 =0.2 3.30
Hazmat transportation incident 6 x 0.30 =1.8
3 x 0.20 =0.6
6 x 0.20 =1.2
4 x 0.15 =0.6
3 x 0.10 =0.3
2 x 0.05 =0.1 4.60
Infrastructure failures 7 x 0.30 =2.1
9 x 0.20 =1.8
3 x 0.20 =0.6
5 x 0.15 =0.75
5 x 0.10 =0.5
8 x 0.05 =0.4 6.15
Nuclear attack 1 x 0.30 =0.3
10 x 0.20 =2.0
7 x 0.20 =1.4
10 x 0.15 =1.5
9 x 0.10 =0.9
3 x 0.05 =0.15 6.25
Nuclear power plant accidents 1 x 0.30 =0.3
1 x 0.20 =0.2
1 x 0.20 =0.2
2 x 0.15 =0.3
2 x 0.10 =0.2
2 x 0.05 =0.1 1.30
Oil & gas well accidents 2 x 0.30 =0.6
1 x 0.20 =0.2
3 x 0.20 =0.6
3 x 0.15 =0.45
3 x 0.10 =0.3
1 x 0.05 =0.05 2.20
Pipeline accidents 2 x 0.30 =0.6
3 x 0.20 =0.6
5 x 0.20 =1.0
6 x 0.15 =0.9
5 x 0.10 =0.5
2 x 0.05 =0.1 3.70
Public health emergencies 3 x 0.30 =0.9
4 x 0.20 =0.8
4 x 0.20 =0.8
5 x 0.15 =0.75
3 x 0.10 =0.3
2 x 0.05 =0.1 3.65
Terrorism/sabotage/WMD 2 x 0.30 =0.6
4 x 0.20 =0.8
7 x 0.20 =1.4
7 x 0.15 =1.05
8 x 0.10 =0.8
1 x 0.05 =0.1 4.75
Subsidence 1 x 0.30 =0.3
1 x 0.20 =0.2
1 x 0.20 =0.2
1 x 0.15 =0.15
2 x 0.10 =0.2
1 x 0.05 =0.1 1.15
Hail 5 x 0.30 =1.5
4 x 0.20 =0.8
1 x 0.20 =0.2
2 x 0.15 =0.3
3 x 0.10 =0.3
2 x 0.05 =0.1 3.20
Lightning 5 x 0.30 =1.5
2 x 0.20 =0.4
2 x 0.20 =0.4
4 x 0.15 =0.6
4 x 0.10 =0.4
2 x 0.05 =0.1 3.40
Severe winds 6 x 0.30 =1.8
9 x 0.20 =1.8
3 x 0.20 =0.6
4 x 0.15 =0.6
6 x 0.10 =0.6
4 x 0.05 =0.2 5.60
Tornadoes 3 x 0.30 =0.9
6 x 0.20 =1.2
6 x 0.20 =1.2
8 x 0.15 =1.2
7 x 0.10 =0.7
8 x 0.05 =0.4 5.60
Transportation accidents 6 x 0.30 =1.8
2 x 0.20 =0.4
5 x 0.20 =1.0
6 x 0.15 =0.9
4 x 0.10 =0.4
2 x 0.05 =0.1 4.60
Winter weather hazards 8 x 0.30 =2.4
9 x 0.20 =1.8
4 x 0.20 =0.8
5 x 0.15 =0.75
7 x 0.10 =0.7
4 x 0.05 =0.2 6.65
EXAMPLE: FOR INSTRUCTIONAL PURPOSES ONLY
This work can be quite simple for those who use spreadsheet software, but such software is not necessary solong as the basic math has been done carefully, and double-checked for correctness. The result of theseestimates and calculations is that each hazard is given a specific rating which can be used to establish (and

66 2/03
explain) mitigation priorities in your community. In the example table on the next page, each hazard has ratingsassigned in the right-most column, and if these are placed in descending order, the example community's tophazards have been calculated as follows:
1. Winter weather hazards (rated 6.65)2. Nuclear attack (6.25)3. Infrastructure failures (6.15)4 & 5. Tornadoes and severe winds (5.60)6. Extreme temperatures (5.55)7. Wildfires (5.00)8. Riverine flooding (4.80)9 & 10. Structural fires and terrorism/sabotage/WMD11 & 12. Transportation accidents/transportation hazardous material incidents13. Dam failures
For this hypothetical community, other significant hazards are pipeline accidents, drought, public healthemergencies, lightning, fixed site hazardous material incidents, hail, shoreline flooding, and civil disturbances.The hypothetical community's least significant hazards were calculated to be oil & gas well accidents,earthquakes, scrap tire fires, nuclear accidents, and subsidence. For other communities, these calculationswould probably be much different. In multi-jurisdictional plans, it may be necessary to identify differentpriorities for each of the communities that are covered by the plan.
The results of this detailed technique are hazard rankings that can be entered into the Risk Assessment Table andused to establish which hazards are higher-priority. Proper use of this technique also provides a way to buildconsensus about these priorities, and to explain (or defend) decisions that have been made from these priorities.
The Vulnerability Assessment, and indeed the entire Hazard Analysis, can be considered complete when (1)specific areas of the community have been identified that are vulnerable to harm from hazards, (2) these areas ofvulnerability have been prioritized with estimates of which threats are most important to address, and (3)defensible explanations have been given as to why these areas are believed to be vulnerable to hazards, or howsuch vulnerabilities were determined. You will then be ready to plan how to mitigate such vulnerabilities.
Having a presentable and complete document explaining your hazard analysis will allow the information you'veresearched to be examined and used by many important people in your community, whether planners, officials,or others in emergency management. Feedback and suggestions from these people can be very useful andimportant for making the hazard analysis as accurate and useful as possible.
This section has given only a few examples of the techniques that can be used to assess risks, identifyvulnerabilities, and establish priorities. For more information about specific types of information and techniques
How much analysis is needed?This workbook tends to avoid giving fixed requirements about exactly how much analysis is required,because your mitigation plan must assess and then address all hazards that are significant for yourcommunity rather than to follow a specific blueprint or preconceived formula. Avoiding a "boiler plate"approach keeps community mitigation plans flexible, so they can be easily customized to meet an area'sneeds with the resources that are available to it. One community may already have plenty of data andplanning resources available, while another community may feel completely strapped and overwhelmed. Agood general principle is to use "best available data" in a way that is efficient and most pertinent to yourcommunity's resources and challenges. (Each community's hazards, priorities, and resources are different, sotheir plans will be also.) On the negative side, those who are new to mitigation planning may find it easier tobe given specific lists of what to do, to swiftly complete a quality hazard mitigation plan simply bycompleting each step on a checklist. Although this document remains flexible by providing few specificchecklists, you should study Appendix C if your plan is intended to fulfill grant requirements for federalhazard mitigation programs and meet the planning requirements of the Disaster Mitigation Act of 2000. Ifyou seek "best practices" for analyzing high-priority hazards, please refer to the information in Appendix B.

67 2/03
that can be used to analyze different sorts of hazards in your community, please refer to Appendix B in thisworkbook. It will describe the ways that you can think about and measure the risk from each type of hazard thatmay be a priority in your community.
If your community is developing a hazard mitigation plan so as to meet the requirements of the DisasterMitigation Act of 2000 (and the federal regulations that are based on it), please refer to Appendix C in thisworkbook. Appendix C will also be a necessary reference if you are receiving federal grant money from theFlood Mitigation Assistance Program (FMAP), the Hazard Mitigation Grant Program (HMGP), the Pre-DisasterMitigation Program (PDMP) or Project Impact (PI). Although it has been stated that FEMA intends tostandardize the planning requirements for all these programs into a single set of standards under the DisasterMitigation Act of 2000 (DMA2000), it may be important for you to distinguish between the new DMA2000requirements and the standards that had previously been used for hazard mitigation planning under otherprograms. Appendix C should be extremely helpful on these matters.
Because hazard mitigation planning is new to many communities and planning offices, most communities inMichigan will be dealing with it for the first time during the years 2003 and 2004, when FEMA is funding theseactivities to assist in meeting their new requirement that communities will be required to have an locally adoptedand FEMA-approved local hazard mitigation plan in order to be eligible to receive federal hazard mitigationproject funds under the grant programs named above. Most communities will therefore be creating a documentthat specifically addresses hazard mitigation at the local level—this document would be called a "stand-alone"plan if it only addresses hazard mitigation. The alternative to this is to integrate hazard analysis and mitigationactivities into community comprehensive plans. Comprehensive plans are documents that guide land use anddevelopment in a community for a number of years into the future (usually between 5 and 20 years).Comprehensive plans may also be called master plans, development plans, or land use plans. They generallycontain a broad and integrated perspective on your community's needs and goals, with more detailed subsectionsthat address topics such as zoning, economic development, transportation, recreation, environment and openspace, energy, infrastructure, and capital facilities. There may be related plans that have been produced for yourcommunity, such as for solid waste management or watershed management. If your community is in theprocess of updating one or more of these plans during the next year or two, it may be possible to integratehazard mitigation into such planning activities. Appendix D in this workbook gives information on how suchintegration can be achieved. Because many hazards can be created or worsened by long-term decisions that didnot take such issues into account, it is important that such a problem be corrected by including hazard mitigationin future planning considerations. A long-term goal of the Michigan State Police Emergency ManagementDivision, and the governor-appointed Michigan Hazard Mitigation Coordinating Council (MHMCC), is thatcoordination and partnerships be formed between planning and emergency management activities andprofessions throughout the state.
SummaryAt this stage, your community should have a good idea of what the its problems are, which will provide a solidfoundation for setting hazard mitigation goals and identifying more specific hazard mitigation activities as partof its planning process. In the next step of the planning process, you will develop broad goals and more specificobjectives as you use your hazard analysis to determine what your community will do to lessen its potential tobe harmed by natural, technological, and social/societal hazards.