Embed Size (px)
Citation preview
Copyright 2020 IEEE. Personal use of this material is permitted. Permission from IEEE must be obtained for all other uses, including reprinting/republishing this material of advertising or promotional purposes, creating new collective works, forresale or redistribution to servers or lists, or reuse of any copyrighted component of this work in other works. Pre-print of article that will appear at the 2020 IEEE International Conference on Robotics and Automation.
Hierarchical Multi-Process Fusion for Visual Place Recognition
Stephen Hausler and Michael Milford
Abstract— Combining multiple complementary techniquestogether has long been regarded as a way to improve perfor-mance. In visual localization, multi-sensor fusion, multi-processfusion of a single sensing modality, and even combinationsof different localization techniques have been shown to resultin improved performance. However, merely fusing togetherdifferent localization techniques does not account for thevarying performance characteristics of different localizationtechniques. In this paper we present a novel, hierarchicallocalization system that explicitly benefits from three varyingcharacteristics of localization techniques: the distribution oftheir localization hypotheses, their appearance- and viewpoint-invariant properties, and the resulting differences in where inan environment each system works well and fails. We showhow two techniques deployed hierarchically work better thanin parallel fusion, how combining two different techniquesworks better than two levels of a single technique, evenwhen the single technique has superior individual performance,and develop two and three-tier hierarchical structures thatprogressively improve localization performance. Finally, wedevelop a stacked hierarchical framework where localizationhypotheses from techniques with complementary characteristicsare concatenated at each layer, significantly improving retentionof the correct hypothesis through to the final localization stage.Using two challenging datasets, we show the proposed systemoutperforming state-of-the-art techniques.
I. INTRODUCTION
A hierarchical approach to localization is a well-established process with roots in computational efficiencyand provides a method of improving spatial accuracy oflocalization. Hierarchies have also been discovered in themammalian brain, both in the structure of grid cells inthe Hippocampus [1], and in the visual pathway of theVisual Cortex [2]. In this research we ask the question:does a hierarchical approach to visual localization providea direct improvement to the localization success rate whendifferent image processing methods are used, and how shouldsuch a hierarchical approach be structured? To answer thisquestion, we perform an extensive investigation into combin-ing different combinations of local, global and deep learntimage descriptors in a hierarchical localization pipeline. Weshowcase our findings using the datasets Nordland and BerlinKurfurstendamm. The Nordland dataset tests our hierarchicalfusion under severe appearance change but no viewpointchange, while Berlin verifies these results under severeviewpoint change.
In this paper we provide the following contributions:
The work of S. Hausler was supported by a Research Training ProgramStipend. The work of M. Milford was supported by the Australian Re-search Council Future Fellowship under Grant FT140101229. The authorsare with the ARC Centre of Excellence for Robotic Vision, Queens-land University of Technology, Brisbane, QLD 4000, Australia (e-mail:[email protected]).
Tier 1 Ranking
Tier 2 Ranking
Tier 3 Ranking
1 2 3 4 5
Query Image
Candidate Reference Images +
Only LookOnce
Database Images
HybridNet Gist
KAZE
HOGNetVLAD
Final Match
Union ofCandidates
Union ofCandidates
Average of Difference Scores
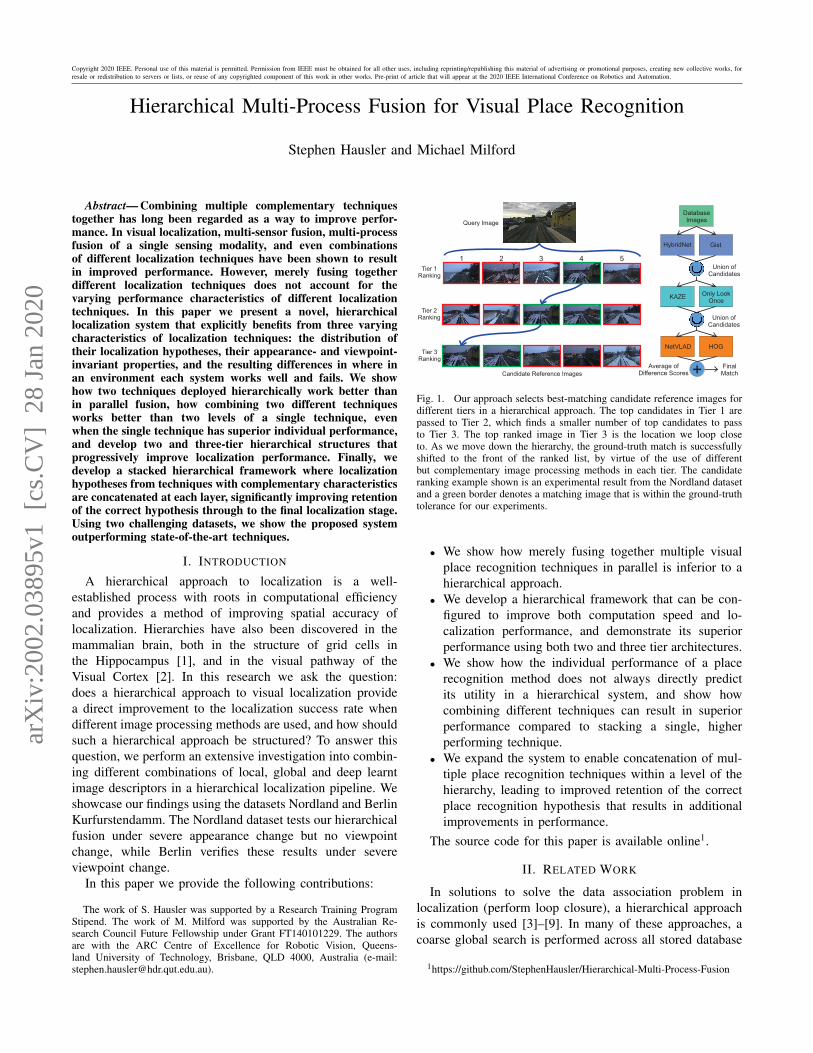
Fig. 1. Our approach selects best-matching candidate reference images fordifferent tiers in a hierarchical approach. The top candidates in Tier 1 arepassed to Tier 2, which finds a smaller number of top candidates to passto Tier 3. The top ranked image in Tier 3 is the location we loop closeto. As we move down the hierarchy, the ground-truth match is successfullyshifted to the front of the ranked list, by virtue of the use of differentbut complementary image processing methods in each tier. The candidateranking example shown is an experimental result from the Nordland datasetand a green border denotes a matching image that is within the ground-truthtolerance for our experiments.
• We show how merely fusing together multiple visualplace recognition techniques in parallel is inferior to ahierarchical approach.
• We develop a hierarchical framework that can be con-figured to improve both computation speed and lo-calization performance, and demonstrate its superiorperformance using both two and three tier architectures.
• We show how the individual performance of a placerecognition method does not always directly predictits utility in a hierarchical system, and show howcombining different techniques can result in superiorperformance compared to stacking a single, higherperforming technique.
• We expand the system to enable concatenation of mul-tiple place recognition techniques within a level of thehierarchy, leading to improved retention of the correctplace recognition hypothesis that results in additionalimprovements in performance.
The source code for this paper is available online1.
II. RELATED WORK
In solutions to solve the data association problem inlocalization (perform loop closure), a hierarchical approachis commonly used [3]–[9]. In many of these approaches, acoarse global search is performed across all stored database
1https://github.com/StephenHausler/Hierarchical-Multi-Process-Fusion
arX
iv:2
002.
0389
5v1
[cs
.CV
] 2
8 Ja
n 20
20
image representations before a second, fine-grained searchis used to filter the set of candidates produced by theglobal search [4]. Often the second search will utilisecomputationally-intensive geometric approaches, such asBundle Adjustment [10] and Co-visibility Clustering [5].
In these hierarchies, a wide-variety of image descriptorshave been used. These descriptors fall into the categoriesof global [11], [12], local [13], [14] and deep learnt [15],[16]. Commonly a different category of descriptor is usedin different stages of a hierarchical approach. Maohai et.al. performed a two-stage localization hierarchy, using acolor histogram global image descriptor to provide a coarselocalization and then evaluated the resultant candidates usingSIFT feature matching [8]. A more advanced version ofthis was developed which uses the PHOG descriptor atthe first stage of the hierarchy, then uses FAST cornerswith LDB binary descriptors [6]. Their work also includedRANSAC verification and a Bayes Filter to further improvelocalization. Prior work has also investigated the combinationof deep-learnt and local features in a hierarchy, showing thataccurate 6-DoF pose estimates can be produced at real-timeif the set of candidates is first filtered using a deep-learntglobal descriptor [5].
A single image descriptor can also be used in a hierarchy.One approach is to sub-analyze the images, for example,using patch-verification and Sum-of-Absolute Differences[17]. Alternatively, a sequence of images can be interpretedacross multiple spatial scales, providing a hierarchical set ofmulti-scale clustered descriptors of the current scene [3].
While many of the aforementioned localization approacheshave used one or two image processing methods in theirhierarchy, none of those approaches use an arbitrarily largenumber of methods. Fusing a large number of image de-scriptors has had some related investigation, such as SRAL[18], which simultaneously used six different types of visualfeatures. In the author’s previous work, four different imageprocessing methods were fused in a temporal sequence[19]. Neither of these two approaches utilised a hierarchicalframework, while this work showcases using multiple imageprocessing methods in a hierarchy.
III. PROPOSED APPROACH
In this work we present a sequence of investigations intohierarchical fusion of place recognition techniques whichinform subsequent design of a novel, high performing hierar-chical place recognition framework. In a typical hierarchicallocalization system, loop closure candidates from a first,computationally cheap localization method are used to definea set of potential matches for evaluation by a second, com-putationally expensive sub-system. This pipeline allows forefficient real-time localization, even in long-term navigationtrials. In our experiments we use a three-tier hierarchy,however, our proposal is customizable and can be appliedto any arbitrary number of tiers. Each tier uses a differentimage processing method to evaluate the similarity betweenthe currently viewed scene and the provided candidates.Additionally, we include the option of adding additional
image processing methods within a particular tier [20], suchthat the selected candidates from that tier becomes the unionof the best candidates from the multiple methods withinthat tier. In this section, we will begin by describing theconfiguration of each image processing method we use inour experiments.
A. Design and Configuration of Image Processing Methods
For this work, we selected a total of six different imageprocessing methods (half hand-crafted, half deep learnt).Our proposed approach is equally applicable to methods notchosen and any of the following methods can be replacedwith an alternate approach.
Histogram of Oriented Gradients (HOG) - we use Dalaland Trigg’s HOG [11] with a cell size of 30 by 30 pixels.We also re-size the input images to 300 by 300 pixels, whichassists in alleviating small appearance variations while alsoreducing the size of the feature vector produced by HOG.
Gist - uses Gabor filters to extract gradients from animage, for a range of spatial scales and frequencies [12].Using the default settings, Gist outputs a 512 dimensionfeature vector from an input image.
KAZE - is a local feature detector and descriptor similarto SURF [14] or SIFT [21], except it has demonstratedimproved feature quality but is also computationally expen-sive [13]. We match features between two images usingMATLAB’s built-in matchFeatures function, and specify amatch filter with a MatchThreshold of 20 and a MaxRatio of0.7. By applying the filter, we remove incoherent matcheswhich fail Lowe’s ratio test [21]. The distance betweena query and a database image is then the sum of theresidual distances between the twenty strongest matchingfeatures. The database images with the smallest distance areconsidered the best matching candidates.
NetVLAD - is a neural network designed for placerecognition, inspired by the success of VLAD [15]. We usethe network pre-trained on Pittsburgh 30k and re-size ourimages to fit the input size of the network. We match imagesusing the computed NetVLAD feature vector, which has adimensionality of 4096.
HybridNet - is a re-trained version of AlexNet, trainedon images recorded by a collection of security cameras overan extended period of time [22]. In our use of this network,we extract a feature vector from the Conv5 layer and use anaggressive method of dimensionality reduction. We composethe feature vector by aggregating the spatial (W x H) positionof non-zero maximum activations across all the feature maps.As W and H are both dimension 13 in Conv5, this methodproduces a feature of dimension 169.
Only Look Once - in this method, later convolutionallayers are used to find spatial regions with the strongestactivations [23]. Multiple region descriptors are then createdfrom the activations within each of these spatial regions inan earlier convolutional layer. To calculate the similaritybetween two images, these region descriptors are crossmatched. This image processing method can match imagesacross both viewpoint and appearance variations, but it is
computationally expensive. We use the open-source versionof Only Look Once2 to calculate the image similarity score.
B. Computation of Normalized Difference Scores
Each aforementioned image processing method produces adifference score between the current query image and eitherevery database image or the set of candidates in the previoustier of the hierarchy. These raw difference scores have a widevariation in their data spread. Therefore we use min-maxnormalization to normalize all difference scores to the rangeof 0 to 1, where 1 denotes the best matching database imageand 0 the worst.
Dnorm =D −max(D)
min(D)−max(D)(1)
C. Fusion of Multiple Methods in a Hierarchy
The first tier of our hierarchy performs a global searchacross all database images, and returns kt1 nearest neigh-bour candidates with respect to the current query image. Ifmultiple image processing methods are used in the first tier,then the returned candidates are the union of the nearestneighbours from each method in tier 1:
C(kt1) = C(km1) ∪ C(km2).. ∪ C(kmn) (2)
where m1..mn are the methods from tier 1, up to n methodsin this tier. C denotes the set of candidates, with a numberof candidates up to k.
Candidates C(kt1) are then passed to the second tier ofthe hierarchy, to be evaluated by a more fine-grained searchacross this smaller set of ‘potentially good’ candidates. Theimage processing methods in tier 2 can and likely should bedifferent to those in tier 1, with characteristics that enable thedifferentiation of perceptually aliased candidates. Becausetier 2 only has to analyze a small number of candidates,rather than the entire database, the methods used can be morecomputationally intensive. kt2 nearest neighbour candidatesare selected from this tier, comparing each candidate tothe current query image, with the formulation described inEquations 3 and 4.
kt2 < kt1 (3)
C(kt2) = C(km1) ∪ C(km2).. ∪ C(kmn) (4)
Methods m in tier 2 are different to the n methods in tier1 and the values of n can be different or the same betweentiers.
At this point, further tiers can be added as needed,continuing to pass a shrinking pool of candidates. However,once the final tier of the hierarchy is reached, a best matchconsensus is determined. As the best match is a singularvalue, the union operator can no longer be applied betweendifferent image processing methods in the one layer. Instead,we calculate the mean normalized difference score acrossthese multiple methods. The largest mean scoring candidate
2https://github.com/scutzetao/IROS2017 OnlyLookOnce
is then selected as the best match from the final tier of thehierarchy, as described by Equations 5 and 6.
Dt3 =D(kt2)m1 +D(kt2)m2 + ..D(kt2)mn
n(5)
bestCand = argmax(Dt3) (6)
With a selection of complementary image processingmethods, accurate localization can generally be achieved atthis final tier. However, an edge case can exist where theearlier layers successfully identify the global best match can-didate while the later layer, with a different image processingmethod, is unable to identify the correct match. To guardagainst this condition, we provide an extension which fusesthe difference scores from the best matching candidates inearlier layers to the final layer decision process.
D. Enhancing Localization using Earlier Layers
To further improve localization, the mean normalizeddifference from the final tier is added to difference scoresfrom those same candidates in earlier tiers. Assuming a threetier hierarchy, the final tier will produce kt2 normalised dif-ference scores for a list of C(kt2) candidates. The differencescores from earlier layers are then extracted for the finaltier candidate set, resulting in kt2 scores per layer. To makescoring equivalent and hence combinable across tiers, were-normalize the extracted difference scores to fall in therange of 0 to 1. Because earlier tier methods may be worse-performing comparing to later tier methods, we include theoption of biasing the summation (making it less fair) usingpre-calibrated weight scalars for each tier:
Dfinal = Dt3W3 +Dt2W2 +Dt1W1 (7)
where Dt2 and Dt1 are the normalized subset of all dif-ference scores, as described by Equations 8-10. For all ourexperiments, we set the weight scalers to the values 1, 0.75and 0.5. Our choice is based on the observation that theRecall at 1 performance is generally better in the later tiersthan in the earlier tiers (see Section IV.).
Because the candidates passed to later layers are theconcatenation of candidates from each method in the sametier, we want to use the maximum difference scores toguarantee that only the best performing method in a layeris being used in the final calculation. We begin by findingthe maximum difference score for each candidate id acrossthe different methods:
Dt2 = max(Dm1, Dm2, .., Dmn) (8)
Dt2 = Dt2(i ∈ C(kt2)) for i = 1 : size(Dt2) (9)
Dt2 =Dt2 −min(Dt2)
max(Dt2)−min(Dt2)(10)
Equations 8-10 are repeated for Dt1 and any other tiersprior to the last tier.
The final step involves performing normalization by stan-dardizing the data to have mean 0 and standard deviation of1.
Dfinal =Dfinal − µ(Dfinal)
σ(Dfinal)(11)
The best matching candidate is then the maximum scorein Dfinal. In our results, we call this the Combined recall.
IV. RESULTS
A. Dataset Configuration
We evaluate our proposal using the publicly available andwidely used datasets Nordland [24] and Berlin Kurfursten-damm [25]. These two datasets capture a range of rele-vant place recognition challenges with significant appearancevariation on Nordland and large viewpoint shifts on Berlin.We split each dataset into train and test sets and we usethe training set to evaluate different combinations of imageprocessing methods in our hierarchical approach.
The Nordland dataset consists of a 728 km train tripthrough Norway, across four different seasons. In our exper-iments we use the Summer and Winter seasons, where ourdatabase contains Winter images while our query set is fromSummer. To generate our training and test sets, we extractedframes at 1 FPS from the original videos, omitting sectionswhere the train is either stopped or in a tunnel [16]. Ourtraining set contains 1000 frames extracted from the startof the Nordland train trip. Our test set also contains 1000frames, except these frames are taken from a later section ofthe train route. For all experimental results on Nordland weuse a ground-truth tolerance of 10 frames.
The Berlin Kurfurstendamm dataset contains a collectionof images downloaded from Mapillary [26], captured inthe city of Berlin along the road Kurfurstendamm. For ourtraining set, we use 280 images recorded from a bicycle asour query set. Our reference set contains 314 images capturedby both a car and a bus driving on the same road. Our testset is similar, except the query images are recorded by adifferent bicycle, travelling on the same road on a differentdate with several years time gap between the two query sets.We use a ground-truth tolerance of 50 meters, since there isa large real-world distance between successive frames.
B. Evaluate Individual Methods on Train Set
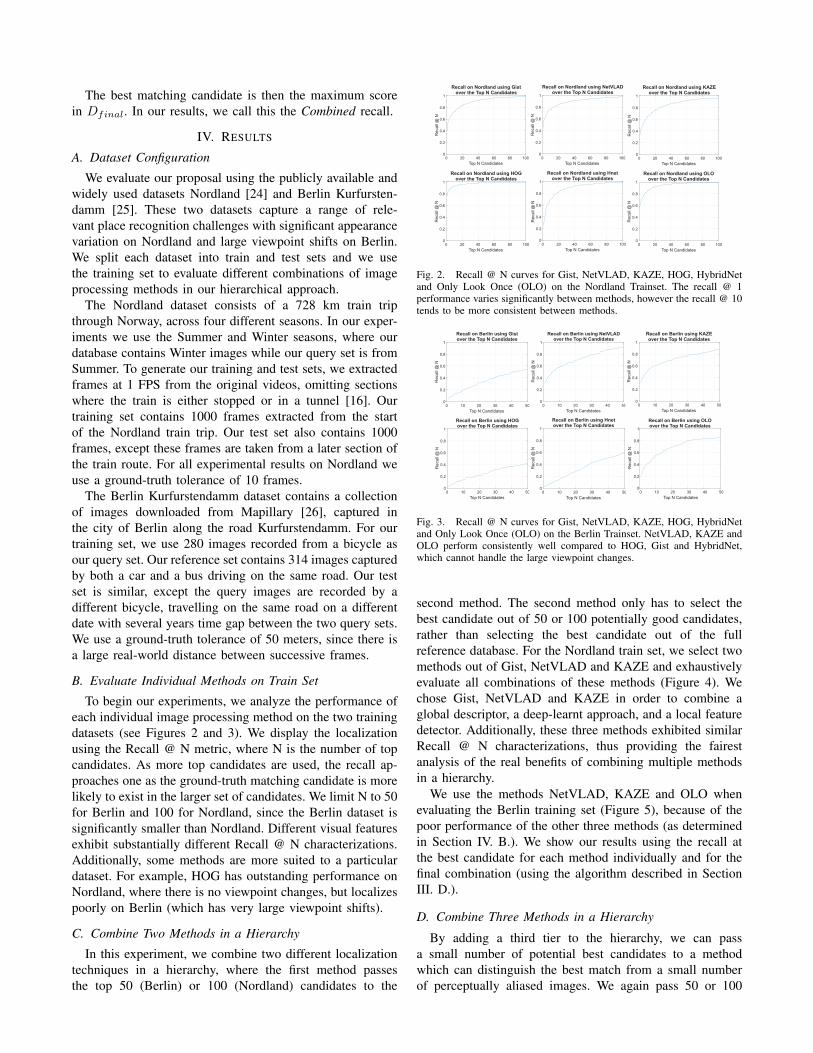
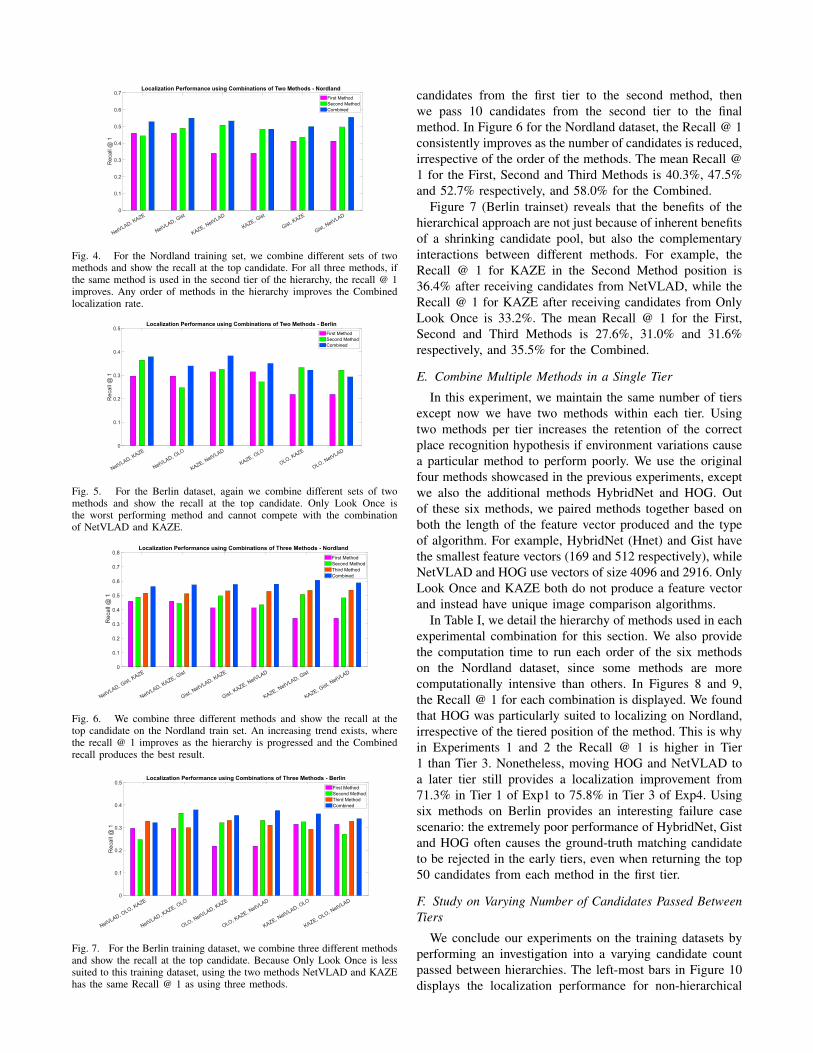
To begin our experiments, we analyze the performance ofeach individual image processing method on the two trainingdatasets (see Figures 2 and 3). We display the localizationusing the Recall @ N metric, where N is the number of topcandidates. As more top candidates are used, the recall ap-proaches one as the ground-truth matching candidate is morelikely to exist in the larger set of candidates. We limit N to 50for Berlin and 100 for Nordland, since the Berlin dataset issignificantly smaller than Nordland. Different visual featuresexhibit substantially different Recall @ N characterizations.Additionally, some methods are more suited to a particulardataset. For example, HOG has outstanding performance onNordland, where there is no viewpoint changes, but localizespoorly on Berlin (which has very large viewpoint shifts).
C. Combine Two Methods in a Hierarchy
In this experiment, we combine two different localizationtechniques in a hierarchy, where the first method passesthe top 50 (Berlin) or 100 (Nordland) candidates to the
0 20 40 60 80 100
Top N Candidates
0
0.2
0.4
0.6
0.8
1
Recall on Nordland using OLOover the Top N Candidates
Re
call
@ N
0 20 40 60 80 100
Top N Candidates
0
0.2
0.4
0.6
0.8
1
Recall on Nordland using Gistover the Top N Candidates
Re
call
@ N
0 20 40 60 80 100
Top N Candidates
0
0.2
0.4
0.6
0.8
1
Recall on Nordland using NetVLADover the Top N Candidates
Re
call
@ N
0 20 40 60 80 100
Top N Candidates
0
0.2
0.4
0.6
0.8
1
Recall on Nordland using KAZEover the Top N Candidates
Re
ca
ll @
N
0 20 40 60 80 100
Top N Candidates
0
0.2
0.4
0.6
0.8
1
Recall on Nordland using HOGover the Top N Candidates
Re
call
@ N
0 20 40 60 80 100
Top N Candidates
0
0.2
0.4
0.6
0.8
1
Recall on Nordland using Hnetover the Top N Candidates
Re
call
@ N
Fig. 2. Recall @ N curves for Gist, NetVLAD, KAZE, HOG, HybridNetand Only Look Once (OLO) on the Nordland Trainset. The recall @ 1performance varies significantly between methods, however the recall @ 10tends to be more consistent between methods.
0 10 20 30 40 50
Top N Candidates
0
0.2
0.4
0.6
0.8
1
Re
ca
ll @
N
Recall on Berlin using Gistover the Top N Candidates
0 10 20 30 40 50
Top N Candidates
0
0.2
0.4
0.6
0.8
1
Recall
@ N
Recall on Berlin using NetVLADover the Top N Candidates
0 10 20 30 40 50
Top N Candidates
0
0.2
0.4
0.6
0.8
1
Re
call
@ N
Recall on Berlin using KAZEover the Top N Candidates
0 10 20 30 40 50
Top N Candidates
0
0.2
0.4
0.6
0.8
1
Re
call
@ N
Recall on Berlin using HOGover the Top N Candidates
0 10 20 30 40 50
Top N Candidates
0
0.2
0.4
0.6
0.8
1
Reca
ll @
N
Recall on Berlin using Hnetover the Top N Candidates
0 10 20 30 40 50
Top N Candidates
0
0.2
0.4
0.6
0.8
1
Re
ca
ll @
N
Recall on Berlin using OLOover the Top N Candidates
Fig. 3. Recall @ N curves for Gist, NetVLAD, KAZE, HOG, HybridNetand Only Look Once (OLO) on the Berlin Trainset. NetVLAD, KAZE andOLO perform consistently well compared to HOG, Gist and HybridNet,which cannot handle the large viewpoint changes.
second method. The second method only has to select thebest candidate out of 50 or 100 potentially good candidates,rather than selecting the best candidate out of the fullreference database. For the Nordland train set, we select twomethods out of Gist, NetVLAD and KAZE and exhaustivelyevaluate all combinations of these methods (Figure 4). Wechose Gist, NetVLAD and KAZE in order to combine aglobal descriptor, a deep-learnt approach, and a local featuredetector. Additionally, these three methods exhibited similarRecall @ N characterizations, thus providing the fairestanalysis of the real benefits of combining multiple methodsin a hierarchy.
We use the methods NetVLAD, KAZE and OLO whenevaluating the Berlin training set (Figure 5), because of thepoor performance of the other three methods (as determinedin Section IV. B.). We show our results using the recall atthe best candidate for each method individually and for thefinal combination (using the algorithm described in SectionIII. D.).
D. Combine Three Methods in a Hierarchy
By adding a third tier to the hierarchy, we can passa small number of potential best candidates to a methodwhich can distinguish the best match from a small numberof perceptually aliased images. We again pass 50 or 100
Localization Performance using Combinations of Two Methods - Nordland
NetVLAD, KAZE
NetVLAD, Gist
KAZE, NetVLAD
KAZE, Gist
Gist, KAZE
Gist, NetVLAD
0
0.1
0.2
0.3
0.4
0.5
0.6
0.7
Re
ca
ll @
1
First Method
Second Method
Combined
Fig. 4. For the Nordland training set, we combine different sets of twomethods and show the recall at the top candidate. For all three methods, ifthe same method is used in the second tier of the hierarchy, the recall @ 1improves. Any order of methods in the hierarchy improves the Combinedlocalization rate.
Localization Performance using Combinations of Two Methods - Berlin
NetVLAD, KAZE
NetVLAD, OLO
KAZE, NetVLAD
KAZE, OLO
OLO, KAZE
OLO, NetVLAD
0
0.1
0.2
0.3
0.4
0.5
Re
call
@ 1
First Method
Second Method
Combined
Fig. 5. For the Berlin dataset, again we combine different sets of twomethods and show the recall at the top candidate. Only Look Once isthe worst performing method and cannot compete with the combinationof NetVLAD and KAZE.
Localization Performance using Combinations of Three Methods - Nordland
NetVLAD, Gist, K
AZE
NetVLAD, KAZE, G
ist
Gist, NetVLAD, K
AZE
Gist, KAZE, N
etVLAD
KAZE, NetVLAD, G
ist
KAZE, Gist, N
etVLAD0
0.1
0.2
0.3
0.4
0.5
0.6
0.7
0.8
Re
call
@ 1
First Method
Second Method
Third Method
Combined
Fig. 6. We combine three different methods and show the recall at thetop candidate on the Nordland train set. An increasing trend exists, wherethe recall @ 1 improves as the hierarchy is progressed and the Combinedrecall produces the best result.
Localization Performance using Combinations of Three Methods - Berlin
NetVLAD, OLO, K
AZE
NetVLAD, KAZE, O
LO
OLO, NetVLAD, K
AZE
OLO, KAZE, N
etVLAD
KAZE, NetVLAD, O
LO
KAZE, OLO, N
etVLAD0
0.1
0.2
0.3
0.4
0.5
Reca
ll @
1
First Method
Second Method
Third Method
Combined
Fig. 7. For the Berlin training dataset, we combine three different methodsand show the recall at the top candidate. Because Only Look Once is lesssuited to this training dataset, using the two methods NetVLAD and KAZEhas the same Recall @ 1 as using three methods.
candidates from the first tier to the second method, thenwe pass 10 candidates from the second tier to the finalmethod. In Figure 6 for the Nordland dataset, the Recall @ 1consistently improves as the number of candidates is reduced,irrespective of the order of the methods. The mean Recall @1 for the First, Second and Third Methods is 40.3%, 47.5%and 52.7% respectively, and 58.0% for the Combined.
Figure 7 (Berlin trainset) reveals that the benefits of thehierarchical approach are not just because of inherent benefitsof a shrinking candidate pool, but also the complementaryinteractions between different methods. For example, theRecall @ 1 for KAZE in the Second Method position is36.4% after receiving candidates from NetVLAD, while theRecall @ 1 for KAZE after receiving candidates from OnlyLook Once is 33.2%. The mean Recall @ 1 for the First,Second and Third Methods is 27.6%, 31.0% and 31.6%respectively, and 35.5% for the Combined.
E. Combine Multiple Methods in a Single Tier
In this experiment, we maintain the same number of tiersexcept now we have two methods within each tier. Usingtwo methods per tier increases the retention of the correctplace recognition hypothesis if environment variations causea particular method to perform poorly. We use the originalfour methods showcased in the previous experiments, exceptwe also the additional methods HybridNet and HOG. Outof these six methods, we paired methods together based onboth the length of the feature vector produced and the typeof algorithm. For example, HybridNet (Hnet) and Gist havethe smallest feature vectors (169 and 512 respectively), whileNetVLAD and HOG use vectors of size 4096 and 2916. OnlyLook Once and KAZE both do not produce a feature vectorand instead have unique image comparison algorithms.
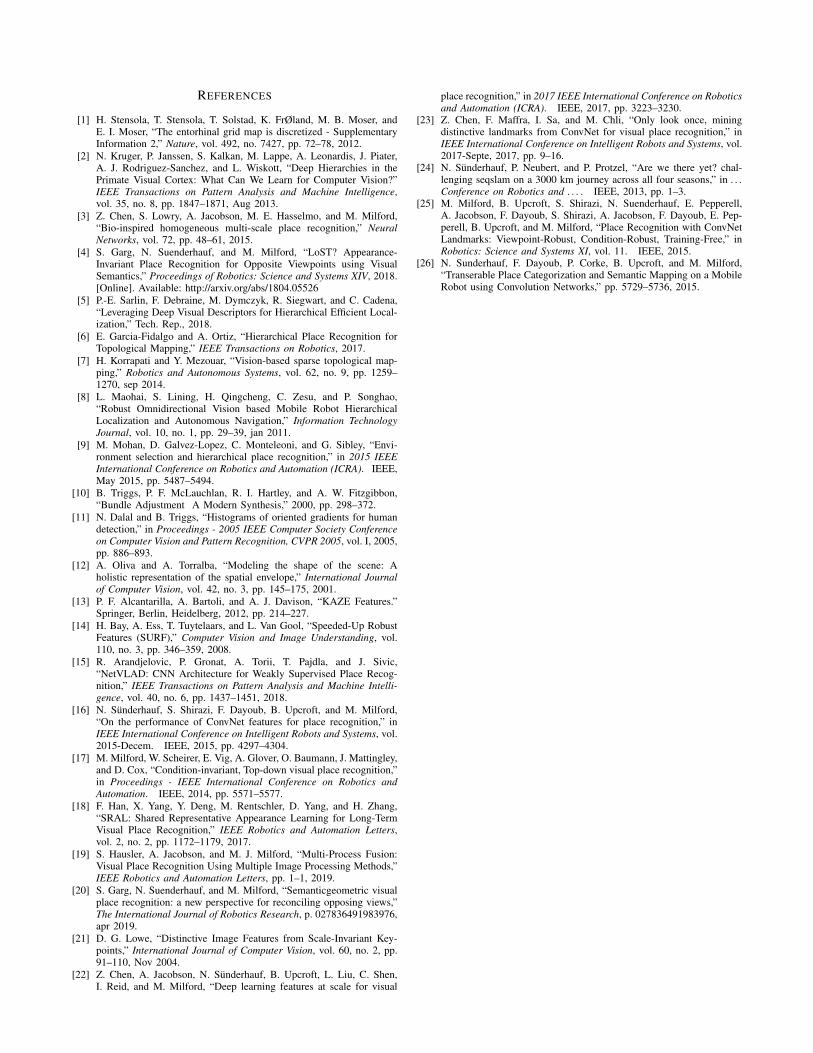
In Table I, we detail the hierarchy of methods used in eachexperimental combination for this section. We also providethe computation time to run each order of the six methodson the Nordland dataset, since some methods are morecomputationally intensive than others. In Figures 8 and 9,the Recall @ 1 for each combination is displayed. We foundthat HOG was particularly suited to localizing on Nordland,irrespective of the tiered position of the method. This is whyin Experiments 1 and 2 the Recall @ 1 is higher in Tier1 than Tier 3. Nonetheless, moving HOG and NetVLAD toa later tier still provides a localization improvement from71.3% in Tier 1 of Exp1 to 75.8% in Tier 3 of Exp4. Usingsix methods on Berlin provides an interesting failure casescenario: the extremely poor performance of HybridNet, Gistand HOG often causes the ground-truth matching candidateto be rejected in the early tiers, even when returning the top50 candidates from each method in the first tier.
F. Study on Varying Number of Candidates Passed BetweenTiers
We conclude our experiments on the training datasets byperforming an investigation into a varying candidate countpassed between hierarchies. The left-most bars in Figure 10displays the localization performance for non-hierarchical
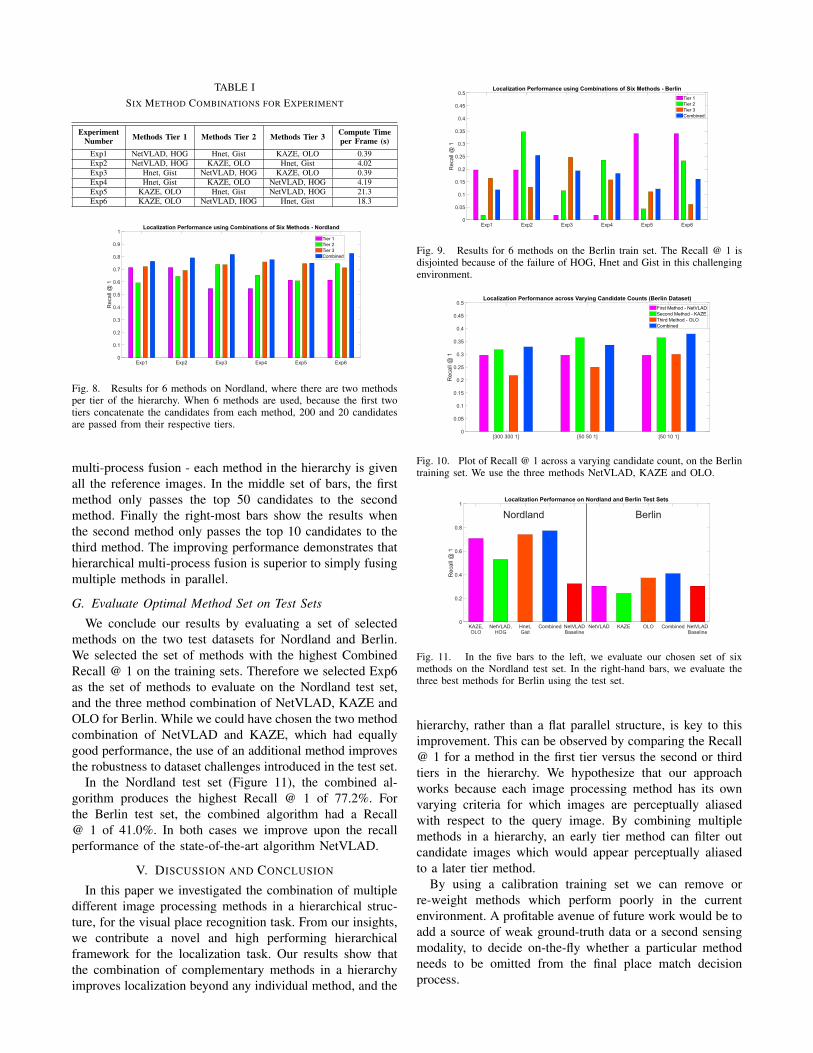
TABLE ISIX METHOD COMBINATIONS FOR EXPERIMENT
ExperimentNumber Methods Tier 1 Methods Tier 2 Methods Tier 3 Compute Time
per Frame (s)Exp1 NetVLAD, HOG Hnet, Gist KAZE, OLO 0.39Exp2 NetVLAD, HOG KAZE, OLO Hnet, Gist 4.02Exp3 Hnet, Gist NetVLAD, HOG KAZE, OLO 0.39Exp4 Hnet, Gist KAZE, OLO NetVLAD, HOG 4.19Exp5 KAZE, OLO Hnet, Gist NetVLAD, HOG 21.3Exp6 KAZE, OLO NetVLAD, HOG Hnet, Gist 18.3
Localization Performance using Combinations of Six Methods - Nordland
Exp1 Exp2 Exp3 Exp4 Exp5 Exp60
0.1
0.2
0.3
0.4
0.5
0.6
0.7
0.8
0.9
1
Re
ca
ll @
1
Tier 1
Tier 2
Tier 3
Combined
Fig. 8. Results for 6 methods on Nordland, where there are two methodsper tier of the hierarchy. When 6 methods are used, because the first twotiers concatenate the candidates from each method, 200 and 20 candidatesare passed from their respective tiers.
multi-process fusion - each method in the hierarchy is givenall the reference images. In the middle set of bars, the firstmethod only passes the top 50 candidates to the secondmethod. Finally the right-most bars show the results whenthe second method only passes the top 10 candidates to thethird method. The improving performance demonstrates thathierarchical multi-process fusion is superior to simply fusingmultiple methods in parallel.
G. Evaluate Optimal Method Set on Test Sets
We conclude our results by evaluating a set of selectedmethods on the two test datasets for Nordland and Berlin.We selected the set of methods with the highest CombinedRecall @ 1 on the training sets. Therefore we selected Exp6as the set of methods to evaluate on the Nordland test set,and the three method combination of NetVLAD, KAZE andOLO for Berlin. While we could have chosen the two methodcombination of NetVLAD and KAZE, which had equallygood performance, the use of an additional method improvesthe robustness to dataset challenges introduced in the test set.
In the Nordland test set (Figure 11), the combined al-gorithm produces the highest Recall @ 1 of 77.2%. Forthe Berlin test set, the combined algorithm had a Recall@ 1 of 41.0%. In both cases we improve upon the recallperformance of the state-of-the-art algorithm NetVLAD.
V. DISCUSSION AND CONCLUSION
In this paper we investigated the combination of multipledifferent image processing methods in a hierarchical struc-ture, for the visual place recognition task. From our insights,we contribute a novel and high performing hierarchicalframework for the localization task. Our results show thatthe combination of complementary methods in a hierarchyimproves localization beyond any individual method, and the
Localization Performance using Combinations of Six Methods - Berlin
Exp1 Exp2 Exp3 Exp4 Exp5 Exp60
0.05
0.1
0.15
0.2
0.25
0.3
0.35
0.4
0.45
0.5
Re
call
@ 1
Tier 1
Tier 2
Tier 3
Combined
Fig. 9. Results for 6 methods on the Berlin train set. The Recall @ 1 isdisjointed because of the failure of HOG, Hnet and Gist in this challengingenvironment.
Localization Performance across Varying Candidate Counts (Berlin Dataset)
[300 300 1] [50 50 1] [50 10 1]0
0.05
0.1
0.15
0.2
0.25
0.3
0.35
0.4
0.45
0.5
Re
ca
ll @
1
First Method - NetVLAD
Second Method - KAZE
Third Method - OLO
Combined
Fig. 10. Plot of Recall @ 1 across a varying candidate count, on the Berlintraining set. We use the three methods NetVLAD, KAZE and OLO.
Localization Performance on Nordland and Berlin Test Sets
0
0.2
0.4
0.6
0.8
1
Re
call
@ 1
KAZE,OLO
NetVLAD,HOG
Hnet,Gist
Combined NetVLADBaseline
NetVLAD KAZE OLO Combined NetVLADBaseline
Nordland Berlin
Fig. 11. In the five bars to the left, we evaluate our chosen set of sixmethods on the Nordland test set. In the right-hand bars, we evaluate thethree best methods for Berlin using the test set.
hierarchy, rather than a flat parallel structure, is key to thisimprovement. This can be observed by comparing the Recall@ 1 for a method in the first tier versus the second or thirdtiers in the hierarchy. We hypothesize that our approachworks because each image processing method has its ownvarying criteria for which images are perceptually aliasedwith respect to the query image. By combining multiplemethods in a hierarchy, an early tier method can filter outcandidate images which would appear perceptually aliasedto a later tier method.
By using a calibration training set we can remove orre-weight methods which perform poorly in the currentenvironment. A profitable avenue of future work would be toadd a source of weak ground-truth data or a second sensingmodality, to decide on-the-fly whether a particular methodneeds to be omitted from the final place match decisionprocess.
REFERENCES
[1] H. Stensola, T. Stensola, T. Solstad, K. FrØland, M. B. Moser, andE. I. Moser, “The entorhinal grid map is discretized - SupplementaryInformation 2,” Nature, vol. 492, no. 7427, pp. 72–78, 2012.
[2] N. Kruger, P. Janssen, S. Kalkan, M. Lappe, A. Leonardis, J. Piater,A. J. Rodriguez-Sanchez, and L. Wiskott, “Deep Hierarchies in thePrimate Visual Cortex: What Can We Learn for Computer Vision?”IEEE Transactions on Pattern Analysis and Machine Intelligence,vol. 35, no. 8, pp. 1847–1871, Aug 2013.
[3] Z. Chen, S. Lowry, A. Jacobson, M. E. Hasselmo, and M. Milford,“Bio-inspired homogeneous multi-scale place recognition,” NeuralNetworks, vol. 72, pp. 48–61, 2015.
[4] S. Garg, N. Suenderhauf, and M. Milford, “LoST? Appearance-Invariant Place Recognition for Opposite Viewpoints using VisualSemantics,” Proceedings of Robotics: Science and Systems XIV, 2018.[Online]. Available: http://arxiv.org/abs/1804.05526
[5] P.-E. Sarlin, F. Debraine, M. Dymczyk, R. Siegwart, and C. Cadena,“Leveraging Deep Visual Descriptors for Hierarchical Efficient Local-ization,” Tech. Rep., 2018.
[6] E. Garcia-Fidalgo and A. Ortiz, “Hierarchical Place Recognition forTopological Mapping,” IEEE Transactions on Robotics, 2017.
[7] H. Korrapati and Y. Mezouar, “Vision-based sparse topological map-ping,” Robotics and Autonomous Systems, vol. 62, no. 9, pp. 1259–1270, sep 2014.
[8] L. Maohai, S. Lining, H. Qingcheng, C. Zesu, and P. Songhao,“Robust Omnidirectional Vision based Mobile Robot HierarchicalLocalization and Autonomous Navigation,” Information TechnologyJournal, vol. 10, no. 1, pp. 29–39, jan 2011.
[9] M. Mohan, D. Galvez-Lopez, C. Monteleoni, and G. Sibley, “Envi-ronment selection and hierarchical place recognition,” in 2015 IEEEInternational Conference on Robotics and Automation (ICRA). IEEE,May 2015, pp. 5487–5494.
[10] B. Triggs, P. F. McLauchlan, R. I. Hartley, and A. W. Fitzgibbon,“Bundle Adjustment A Modern Synthesis,” 2000, pp. 298–372.
[11] N. Dalal and B. Triggs, “Histograms of oriented gradients for humandetection,” in Proceedings - 2005 IEEE Computer Society Conferenceon Computer Vision and Pattern Recognition, CVPR 2005, vol. I, 2005,pp. 886–893.
[12] A. Oliva and A. Torralba, “Modeling the shape of the scene: Aholistic representation of the spatial envelope,” International Journalof Computer Vision, vol. 42, no. 3, pp. 145–175, 2001.
[13] P. F. Alcantarilla, A. Bartoli, and A. J. Davison, “KAZE Features.”Springer, Berlin, Heidelberg, 2012, pp. 214–227.
[14] H. Bay, A. Ess, T. Tuytelaars, and L. Van Gool, “Speeded-Up RobustFeatures (SURF),” Computer Vision and Image Understanding, vol.110, no. 3, pp. 346–359, 2008.
[15] R. Arandjelovic, P. Gronat, A. Torii, T. Pajdla, and J. Sivic,“NetVLAD: CNN Architecture for Weakly Supervised Place Recog-nition,” IEEE Transactions on Pattern Analysis and Machine Intelli-gence, vol. 40, no. 6, pp. 1437–1451, 2018.
[16] N. Sunderhauf, S. Shirazi, F. Dayoub, B. Upcroft, and M. Milford,“On the performance of ConvNet features for place recognition,” inIEEE International Conference on Intelligent Robots and Systems, vol.2015-Decem. IEEE, 2015, pp. 4297–4304.
[17] M. Milford, W. Scheirer, E. Vig, A. Glover, O. Baumann, J. Mattingley,and D. Cox, “Condition-invariant, Top-down visual place recognition,”in Proceedings - IEEE International Conference on Robotics andAutomation. IEEE, 2014, pp. 5571–5577.
[18] F. Han, X. Yang, Y. Deng, M. Rentschler, D. Yang, and H. Zhang,“SRAL: Shared Representative Appearance Learning for Long-TermVisual Place Recognition,” IEEE Robotics and Automation Letters,vol. 2, no. 2, pp. 1172–1179, 2017.
[19] S. Hausler, A. Jacobson, and M. J. Milford, “Multi-Process Fusion:Visual Place Recognition Using Multiple Image Processing Methods,”IEEE Robotics and Automation Letters, pp. 1–1, 2019.
[20] S. Garg, N. Suenderhauf, and M. Milford, “Semanticgeometric visualplace recognition: a new perspective for reconciling opposing views,”The International Journal of Robotics Research, p. 027836491983976,apr 2019.
[21] D. G. Lowe, “Distinctive Image Features from Scale-Invariant Key-points,” International Journal of Computer Vision, vol. 60, no. 2, pp.91–110, Nov 2004.
[22] Z. Chen, A. Jacobson, N. Sunderhauf, B. Upcroft, L. Liu, C. Shen,I. Reid, and M. Milford, “Deep learning features at scale for visual
place recognition,” in 2017 IEEE International Conference on Roboticsand Automation (ICRA). IEEE, 2017, pp. 3223–3230.
[23] Z. Chen, F. Maffra, I. Sa, and M. Chli, “Only look once, miningdistinctive landmarks from ConvNet for visual place recognition,” inIEEE International Conference on Intelligent Robots and Systems, vol.2017-Septe, 2017, pp. 9–16.
[24] N. Sunderhauf, P. Neubert, and P. Protzel, “Are we there yet? chal-lenging seqslam on a 3000 km journey across all four seasons,” in . . .Conference on Robotics and . . . . IEEE, 2013, pp. 1–3.
[25] M. Milford, B. Upcroft, S. Shirazi, N. Suenderhauf, E. Pepperell,A. Jacobson, F. Dayoub, S. Shirazi, A. Jacobson, F. Dayoub, E. Pep-perell, B. Upcroft, and M. Milford, “Place Recognition with ConvNetLandmarks: Viewpoint-Robust, Condition-Robust, Training-Free,” inRobotics: Science and Systems XI, vol. 11. IEEE, 2015.
[26] N. Sunderhauf, F. Dayoub, P. Corke, B. Upcroft, and M. Milford,“Transerable Place Categorization and Semantic Mapping on a MobileRobot using Convolution Networks,” pp. 5729–5736, 2015.

![arXiv:2005.08135v1 [cs.CV] 17 May 2020Michael Milford School of Electrical Engineering and Computer Science, Queensland University of Technology, Brisbane, QLD 4000, Australia E-mail:](https://img.pdfslide.net/doc/110x75/5f4a796b35a1e204d117680b/arxiv200508135v1-cscv-17-may-2020-michael-milford-school-of-electrical-engineering.jpg)