Embed Size (px)
Citation preview
Stereochemistry and Position-Dependent Effects of
Carcinogens on TATA/TBP Binding
Supplementary Material
Qing Zhang† Tamar Schlick*
Department of Chemistry and Courant Institute of Mathematical Sciences, New York University, 251 Mercer Street, New York, NY 10012 * To whom correspondence should be addressed (email: [email protected]) † Current address: Department of Molecular Biology, The Scripps Research Institute, 10550 North Torrey Pines Road, Mail Drop MB-5, La Jolla, CA 92037
Appendix S1: Remodeling of TATA DNA
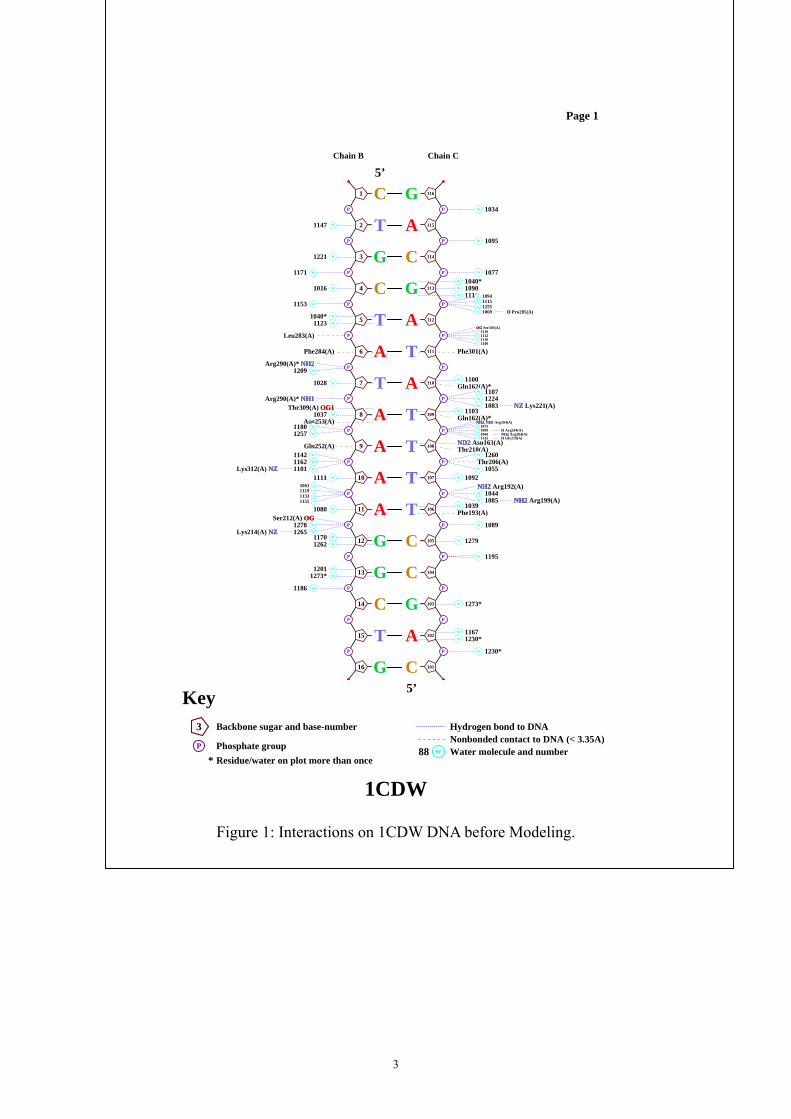
The TATA DNA in the experiment has 25 basepairs (bp), but we keep the length of 1CDW PDB DNA to be 16 bp without appending since the rest 9 bp are not in contact with TBP. We then modify the sequence of the 16 bp DNA to the corresponding experimental sequence.
Experimental sequence: 5′−GAATTCCG TATAAATA CGTGTCGTG−3′ PDB sequence: 5′−CTGC TATAAAAG GCTG−3′ Model sequence: 5′−TCCG TATAAATA CGTG−3′
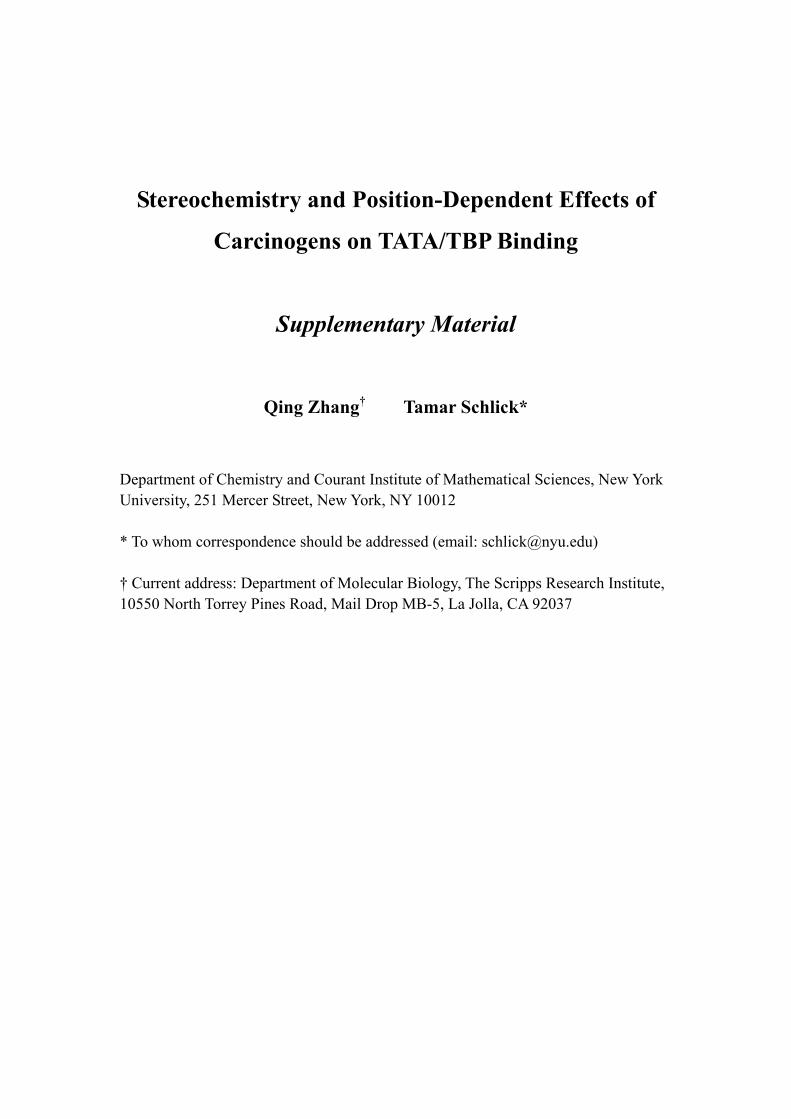
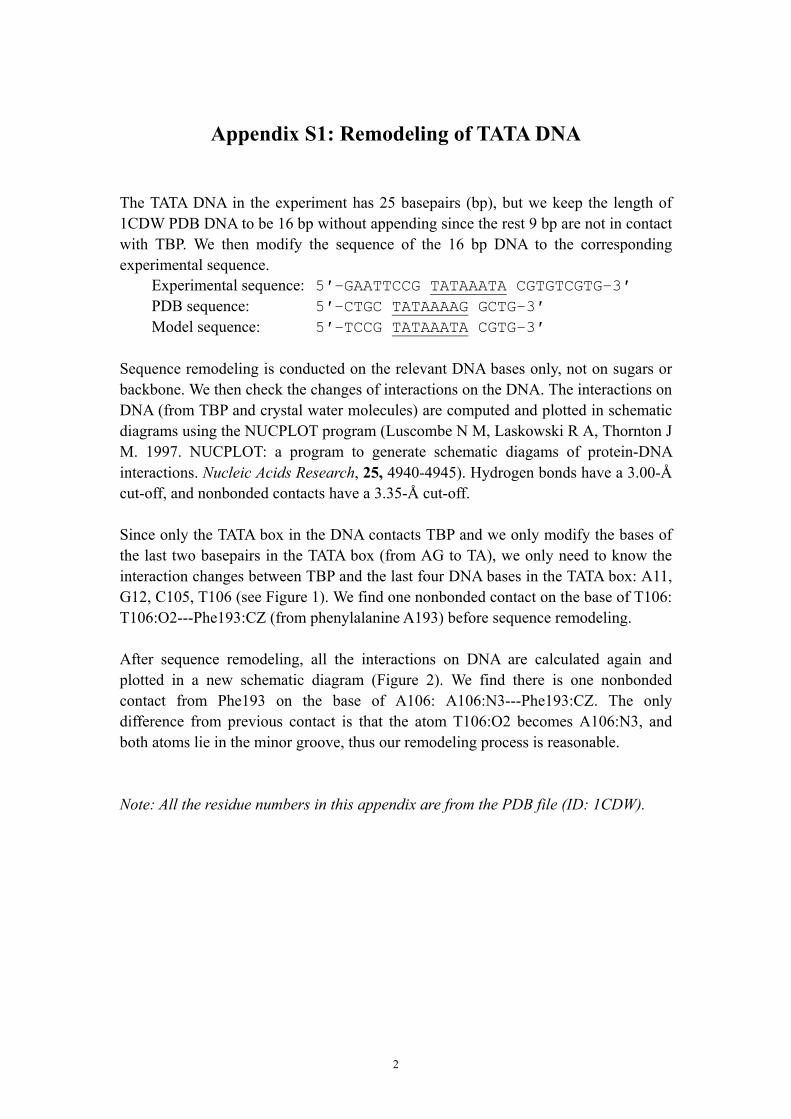
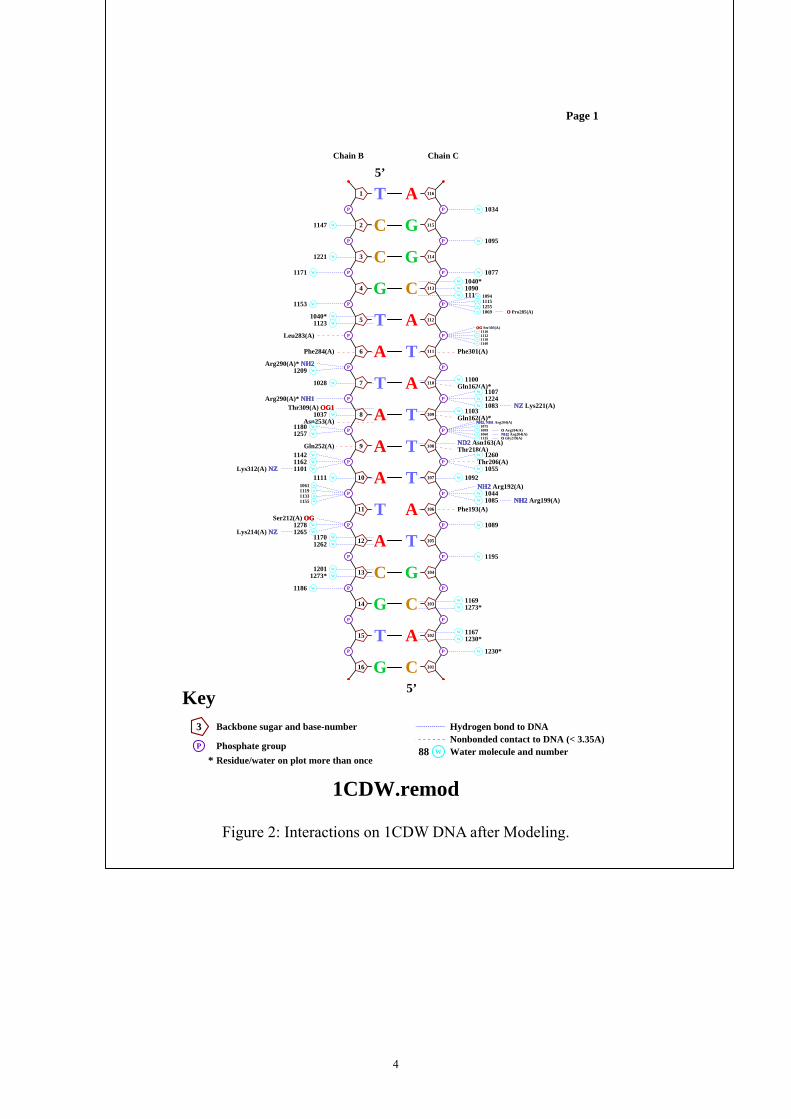
Sequence remodeling is conducted on the relevant DNA bases only, not on sugars or backbone. We then check the changes of interactions on the DNA. The interactions on DNA (from TBP and crystal water molecules) are computed and plotted in schematic diagrams using the NUCPLOT program (Luscombe N M, Laskowski R A, Thornton J M. 1997. NUCPLOT: a program to generate schematic diagams of protein-DNA interactions. Nucleic Acids Research, 25, 4940-4945). Hydrogen bonds have a 3.00-Å cut-off, and nonbonded contacts have a 3.35-Å cut-off. Since only the TATA box in the DNA contacts TBP and we only modify the bases of the last two basepairs in the TATA box (from AG to TA), we only need to know the interaction changes between TBP and the last four DNA bases in the TATA box: A11, G12, C105, T106 (see Figure 1). We find one nonbonded contact on the base of T106: T106:O2---Phe193:CZ (from phenylalanine A193) before sequence remodeling. After sequence remodeling, all the interactions on DNA are calculated again and plotted in a new schematic diagram (Figure 2). We find there is one nonbonded contact from Phe193 on the base of A106: A106:N3---Phe193:CZ. The only difference from previous contact is that the atom T106:O2 becomes A106:N3, and both atoms lie in the minor groove, thus our remodeling process is reasonable. Note: All the residue numbers in this appendix are from the PDB file (ID: 1CDW).
2
C G
T
G C
C G
T
T
T
T
T
T
T
G C
G C
C G
T
G C
5’
Chain B Chain C
5’
1CDW
Key3 Backbone sugar and base-number
P Phosphate group
* Residue/water on plot more than once
Hydrogen bond to DNANonbonded contact to DNA (< 3.35A)
W88 Water molecule and number
W 1034
W1147
W 1095
W1221
W 1077
W1016
W1171W 1040*W 1090W 1116W 1094
W 1115W 1255W 1069 ro285(A)
W1040*W1123
W1153
r303(A) W 1110W 1112W 1118W 1140
Phe284(A)
Leu283(A)
Phe301(A)
W1028
Arg290(A)* NH2NH2W1209
W 1100Gln162(A)*
W 1107W 1224W 1083 NZ Lys221(A) NZThr309(A)
W1037Asn253(A)
Arg290(A)* NH1NH1
W 1103Gln162(A)*
NH2, NH1 Arg204(A) NH2, NH1NH2,W 1075W 1009W 1060W 1135
g204(A) NH2 Arg204(A) NH2O Gly219(A) O
Gln252(A)
W1180W1257
ND2 Asn163(A) ND2Thr218(A)
W 1260Thr206(A) W 1055
W1111
W1142W1162W1101Lys312(A) NZNZ
W 1092NH2 Arg192(A) NH2W 1044W 1085 NH2 Arg199(A) NH2
W1080
W1061W1119W1133W1155
W 1039Phe193(A)
W 1089
W1170W1262
Ser212(A)W1278W1265Lys214(A) NZNZ
W 1279
W 1195
W1201W1273*
W1186
W 1273*
W 1167W 1230*
W 1230*
1 116
P
2
P
115
P
3
P
114
P
4
P
113
P
5
P
112
P
6
P
111
P
7
P
110
P
8
P
109
P
9
P
108
P
10
P
107
P
11
P
106
P
12
P
105
P
13
P
104
P
14
P
103
P
15
P
102
P
16
P
101
Page 1
A
A
A
A
A
A
A
A
A
O PO
OG SeOG
OG1OG1
O ArO
OGOG
Figure 1: Interactions on 1CDW DNA before Modeling.
3
T
C G
C G
G C
T
T
T
T
T
T
T
T
C G
G C
T
G C
5’
Chain B Chain C
5’
1CDW.remod
Key3 Backbone sugar and base-number
P Phosphate group
* Residue/water on plot more than once
Hydrogen bond to DNANonbonded contact to DNA (< 3.35A)
W88 Water molecule and number
W 1034
W1147
W 1095
W1221
W 1077W1171W 1040*W 1090W 1116W 1094
W 1115W 1255W 1069 ro285(A)
W1040*W1123
W1153
r303(A) W 1110W 1112W 1118W 1140
Phe284(A)
Leu283(A)
Phe301(A)
W1028
Arg290(A)* NH2NH2W1209
W 1100Gln162(A)*
W 1107W 1224W 1083 NZ Lys221(A) NZThr309(A)
W1037Asn253(A)
Arg290(A)* NH1NH1
W 1103Gln162(A)*
NH2, NH1 Arg204(A) NH2, NH1NH2,W 1075W 1009W 1060W 1135
g204(A) NH2 Arg204(A) NH2O Gly219(A) O
Gln252(A)
W1180W1257
ND2 Asn163(A) ND2Thr218(A)
W 1260Thr206(A) W 1055
W1111
W1142W1162W1101Lys312(A) NZNZ
W 1092NH2 Arg192(A) NH2W 1044W 1085 NH2 Arg199(A) NH2
W1061W1119W1133W1155
Phe193(A)
W 1089
W1170W1262
Ser212(A)W1278W1265Lys214(A) NZNZ
W 1195
W1201W1273*
W1186
W 1169W 1273*
W 1167W 1230*
W 1230*
1 116
P
2
P
115
P
3
P
114
P
4
P
113
P
5
P
112
P
6
P
111
P
7
P
110
P
8
P
109
P
9
P
108
P
10
P
107
P
11
P
106
P
12
P
105
P
13
P
104
P
14
P
103
P
15
P
102
P
16
P
101
Page 1
A
A
A
A
A
A
A
A
A
A
O PO
OG SeOG
OG1OG1
O ArO
OGOG
Figure 2: Interactions on 1CDW DNA after Modeling.
4
Appendix S2: Partial Charges and Other Added Force
Field Parameters of BP-Adenine Adducts
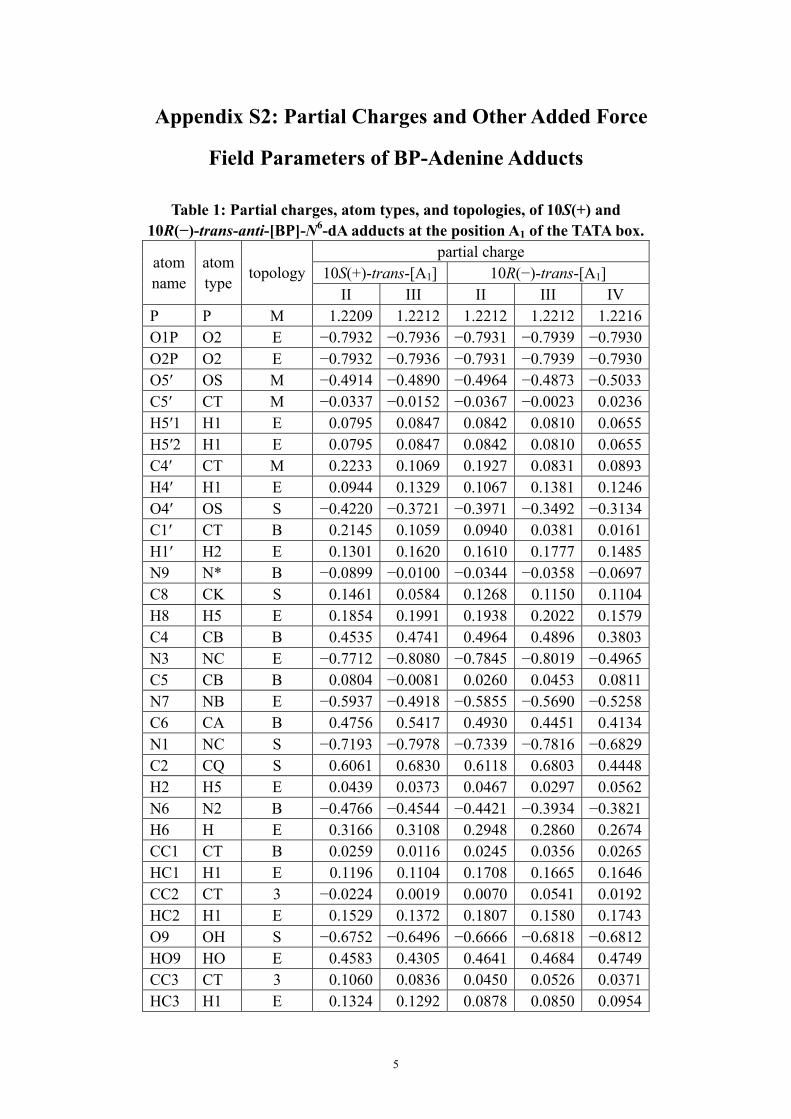
Table 1: Partial charges, atom types, and topologies, of 10S(+) and 10R(−)-trans-anti-[BP]-N6-dA adducts at the position A1 of the TATA box.
partial charge 10S(+)-trans-[A1] 10R(−)-trans-[A1]
atom name
atom type topology
II III II III IV P P M 1.2209 1.2212 1.2212 1.2212 1.2216 O1P O2 E −0.7932 −0.7936 −0.7931 −0.7939 −0.7930 O2P O2 E −0.7932 −0.7936 −0.7931 −0.7939 −0.7930 O5′ OS M −0.4914 −0.4890 −0.4964 −0.4873 −0.5033 C5′ CT M −0.0337 −0.0152 −0.0367 −0.0023 0.0236 H5′1 H1 E 0.0795 0.0847 0.0842 0.0810 0.0655 H5′2 H1 E 0.0795 0.0847 0.0842 0.0810 0.0655 C4′ CT M 0.2233 0.1069 0.1927 0.0831 0.0893 H4′ H1 E 0.0944 0.1329 0.1067 0.1381 0.1246 O4′ OS S −0.4220 −0.3721 −0.3971 −0.3492 −0.3134 C1′ CT B 0.2145 0.1059 0.0940 0.0381 0.0161 H1′ H2 E 0.1301 0.1620 0.1610 0.1777 0.1485 N9 N* B −0.0899 −0.0100 −0.0344 −0.0358 −0.0697 C8 CK S 0.1461 0.0584 0.1268 0.1150 0.1104 H8 H5 E 0.1854 0.1991 0.1938 0.2022 0.1579 C4 CB B 0.4535 0.4741 0.4964 0.4896 0.3803 N3 NC E −0.7712 −0.8080 −0.7845 −0.8019 −0.4965 C5 CB B 0.0804 −0.0081 0.0260 0.0453 0.0811 N7 NB E −0.5937 −0.4918 −0.5855 −0.5690 −0.5258 C6 CA B 0.4756 0.5417 0.4930 0.4451 0.4134 N1 NC S −0.7193 −0.7978 −0.7339 −0.7816 −0.6829 C2 CQ S 0.6061 0.6830 0.6118 0.6803 0.4448 H2 H5 E 0.0439 0.0373 0.0467 0.0297 0.0562 N6 N2 B −0.4766 −0.4544 −0.4421 −0.3934 −0.3821 H6 H E 0.3166 0.3108 0.2948 0.2860 0.2674 CC1 CT B 0.0259 0.0116 0.0245 0.0356 0.0265 HC1 H1 E 0.1196 0.1104 0.1708 0.1665 0.1646 CC2 CT 3 −0.0224 0.0019 0.0070 0.0541 0.0192 HC2 H1 E 0.1529 0.1372 0.1807 0.1580 0.1743 O9 OH S −0.6752 −0.6496 −0.6666 −0.6818 −0.6812 HO9 HO E 0.4583 0.4305 0.4641 0.4684 0.4749 CC3 CT 3 0.1060 0.0836 0.0450 0.0526 0.0371 HC3 H1 E 0.1324 0.1292 0.0878 0.0850 0.0954
5
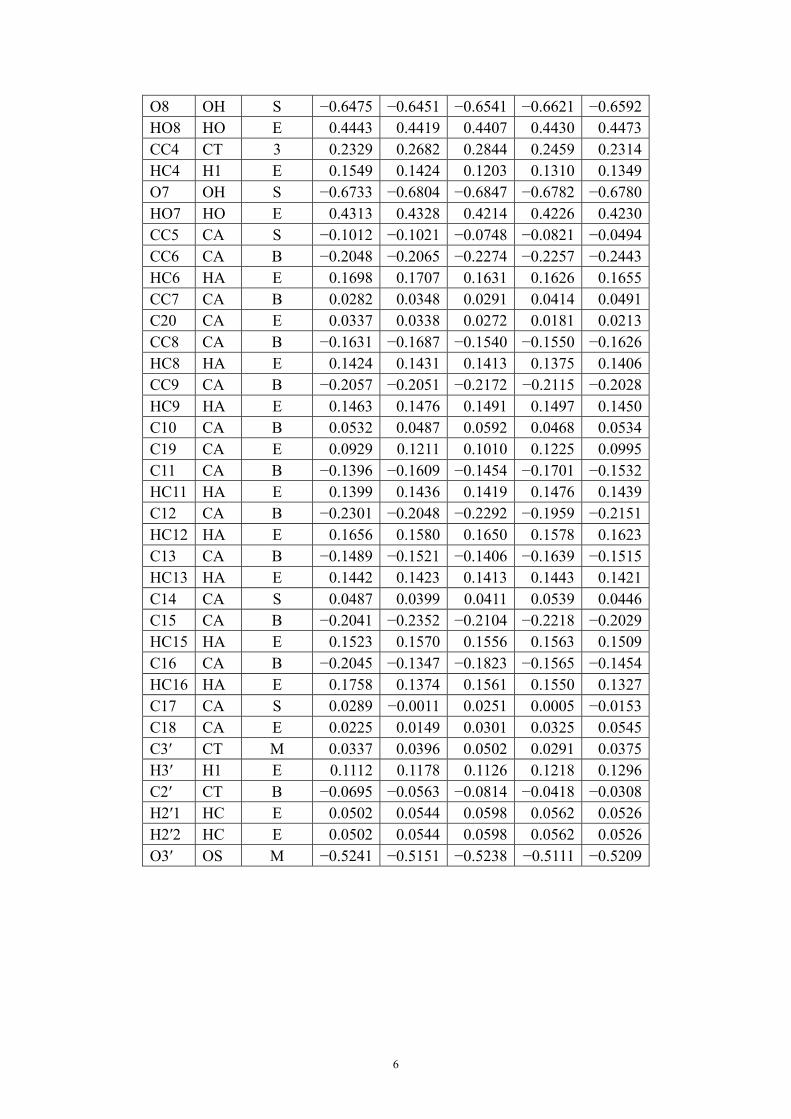
O8 OH S −0.6475 −0.6451 −0.6541 −0.6621 −0.6592 HO8 HO E 0.4443 0.4419 0.4407 0.4430 0.4473 CC4 CT 3 0.2329 0.2682 0.2844 0.2459 0.2314 HC4 H1 E 0.1549 0.1424 0.1203 0.1310 0.1349 O7 OH S −0.6733 −0.6804 −0.6847 −0.6782 −0.6780 HO7 HO E 0.4313 0.4328 0.4214 0.4226 0.4230 CC5 CA S −0.1012 −0.1021 −0.0748 −0.0821 −0.0494 CC6 CA B −0.2048 −0.2065 −0.2274 −0.2257 −0.2443 HC6 HA E 0.1698 0.1707 0.1631 0.1626 0.1655 CC7 CA B 0.0282 0.0348 0.0291 0.0414 0.0491 C20 CA E 0.0337 0.0338 0.0272 0.0181 0.0213 CC8 CA B −0.1631 −0.1687 −0.1540 −0.1550 −0.1626 HC8 HA E 0.1424 0.1431 0.1413 0.1375 0.1406 CC9 CA B −0.2057 −0.2051 −0.2172 −0.2115 −0.2028 HC9 HA E 0.1463 0.1476 0.1491 0.1497 0.1450 C10 CA B 0.0532 0.0487 0.0592 0.0468 0.0534 C19 CA E 0.0929 0.1211 0.1010 0.1225 0.0995 C11 CA B −0.1396 −0.1609 −0.1454 −0.1701 −0.1532 HC11 HA E 0.1399 0.1436 0.1419 0.1476 0.1439 C12 CA B −0.2301 −0.2048 −0.2292 −0.1959 −0.2151 HC12 HA E 0.1656 0.1580 0.1650 0.1578 0.1623 C13 CA B −0.1489 −0.1521 −0.1406 −0.1639 −0.1515 HC13 HA E 0.1442 0.1423 0.1413 0.1443 0.1421 C14 CA S 0.0487 0.0399 0.0411 0.0539 0.0446 C15 CA B −0.2041 −0.2352 −0.2104 −0.2218 −0.2029 HC15 HA E 0.1523 0.1570 0.1556 0.1563 0.1509 C16 CA B −0.2045 −0.1347 −0.1823 −0.1565 −0.1454 HC16 HA E 0.1758 0.1374 0.1561 0.1550 0.1327 C17 CA S 0.0289 −0.0011 0.0251 0.0005 −0.0153 C18 CA E 0.0225 0.0149 0.0301 0.0325 0.0545 C3′ CT M 0.0337 0.0396 0.0502 0.0291 0.0375 H3′ H1 E 0.1112 0.1178 0.1126 0.1218 0.1296 C2′ CT B −0.0695 −0.0563 −0.0814 −0.0418 −0.0308 H2′1 HC E 0.0502 0.0544 0.0598 0.0562 0.0526 H2′2 HC E 0.0502 0.0544 0.0598 0.0562 0.0526 O3′ OS M −0.5241 −0.5151 −0.5238 −0.5111 −0.5209
6
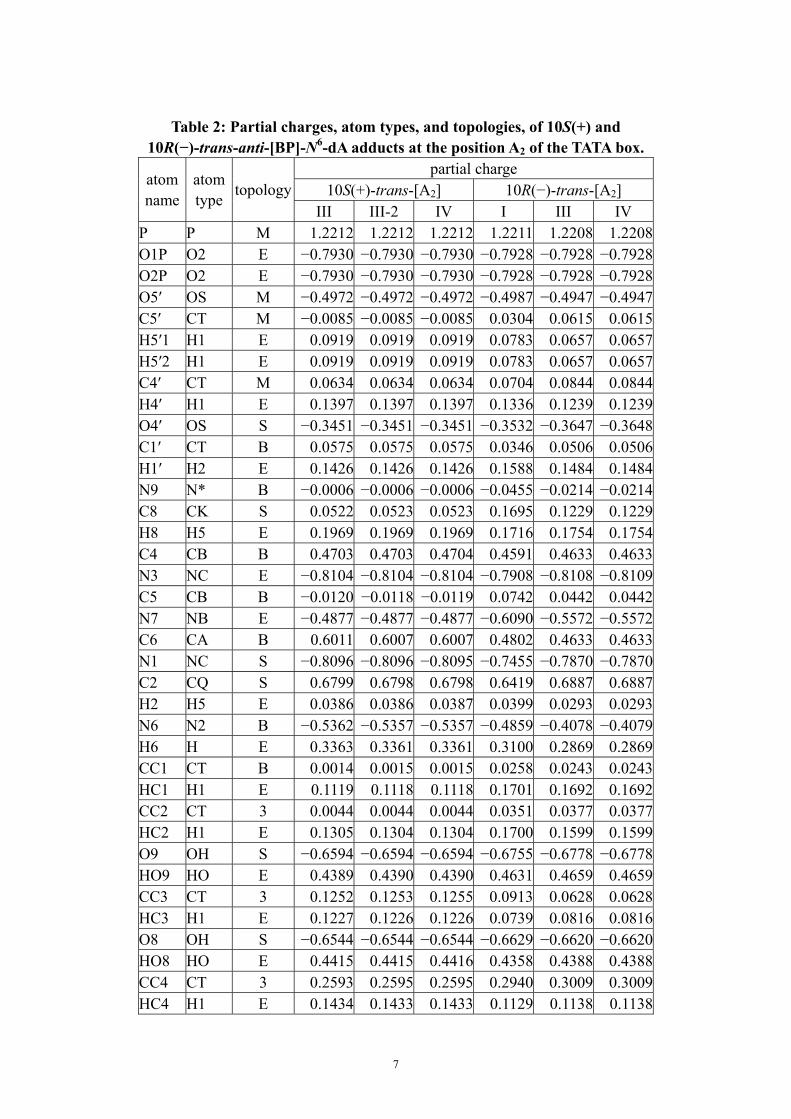
Table 2: Partial charges, atom types, and topologies, of 10S(+) and
10R(−)-trans-anti-[BP]-N6-dA adducts at the position A2 of the TATA box. partial charge
10S(+)-trans-[A2] 10R(−)-trans-[A2] atom name
atom type topology
III III-2 IV I III IV P P M 1.2212 1.2212 1.2212 1.2211 1.2208 1.2208O1P O2 E −0.7930 −0.7930 −0.7930 −0.7928 −0.7928 −0.7928O2P O2 E −0.7930 −0.7930 −0.7930 −0.7928 −0.7928 −0.7928O5′ OS M −0.4972 −0.4972 −0.4972 −0.4987 −0.4947 −0.4947C5′ CT M −0.0085 −0.0085 −0.0085 0.0304 0.0615 0.0615H5′1 H1 E 0.0919 0.0919 0.0919 0.0783 0.0657 0.0657H5′2 H1 E 0.0919 0.0919 0.0919 0.0783 0.0657 0.0657C4′ CT M 0.0634 0.0634 0.0634 0.0704 0.0844 0.0844H4′ H1 E 0.1397 0.1397 0.1397 0.1336 0.1239 0.1239O4′ OS S −0.3451 −0.3451 −0.3451 −0.3532 −0.3647 −0.3648C1′ CT B 0.0575 0.0575 0.0575 0.0346 0.0506 0.0506H1′ H2 E 0.1426 0.1426 0.1426 0.1588 0.1484 0.1484N9 N* B −0.0006 −0.0006 −0.0006 −0.0455 −0.0214 −0.0214C8 CK S 0.0522 0.0523 0.0523 0.1695 0.1229 0.1229H8 H5 E 0.1969 0.1969 0.1969 0.1716 0.1754 0.1754C4 CB B 0.4703 0.4703 0.4704 0.4591 0.4633 0.4633N3 NC E −0.8104 −0.8104 −0.8104 −0.7908 −0.8108 −0.8109C5 CB B −0.0120 −0.0118 −0.0119 0.0742 0.0442 0.0442N7 NB E −0.4877 −0.4877 −0.4877 −0.6090 −0.5572 −0.5572C6 CA B 0.6011 0.6007 0.6007 0.4802 0.4633 0.4633N1 NC S −0.8096 −0.8096 −0.8095 −0.7455 −0.7870 −0.7870C2 CQ S 0.6799 0.6798 0.6798 0.6419 0.6887 0.6887H2 H5 E 0.0386 0.0386 0.0387 0.0399 0.0293 0.0293N6 N2 B −0.5362 −0.5357 −0.5357 −0.4859 −0.4078 −0.4079H6 H E 0.3363 0.3361 0.3361 0.3100 0.2869 0.2869CC1 CT B 0.0014 0.0015 0.0015 0.0258 0.0243 0.0243HC1 H1 E 0.1119 0.1118 0.1118 0.1701 0.1692 0.1692CC2 CT 3 0.0044 0.0044 0.0044 0.0351 0.0377 0.0377HC2 H1 E 0.1305 0.1304 0.1304 0.1700 0.1599 0.1599O9 OH S −0.6594 −0.6594 −0.6594 −0.6755 −0.6778 −0.6778HO9 HO E 0.4389 0.4390 0.4390 0.4631 0.4659 0.4659CC3 CT 3 0.1252 0.1253 0.1255 0.0913 0.0628 0.0628HC3 H1 E 0.1227 0.1226 0.1226 0.0739 0.0816 0.0816O8 OH S −0.6544 −0.6544 −0.6544 −0.6629 −0.6620 −0.6620HO8 HO E 0.4415 0.4415 0.4416 0.4358 0.4388 0.4388CC4 CT 3 0.2593 0.2595 0.2595 0.2940 0.3009 0.3009HC4 H1 E 0.1434 0.1433 0.1433 0.1129 0.1138 0.1138
7
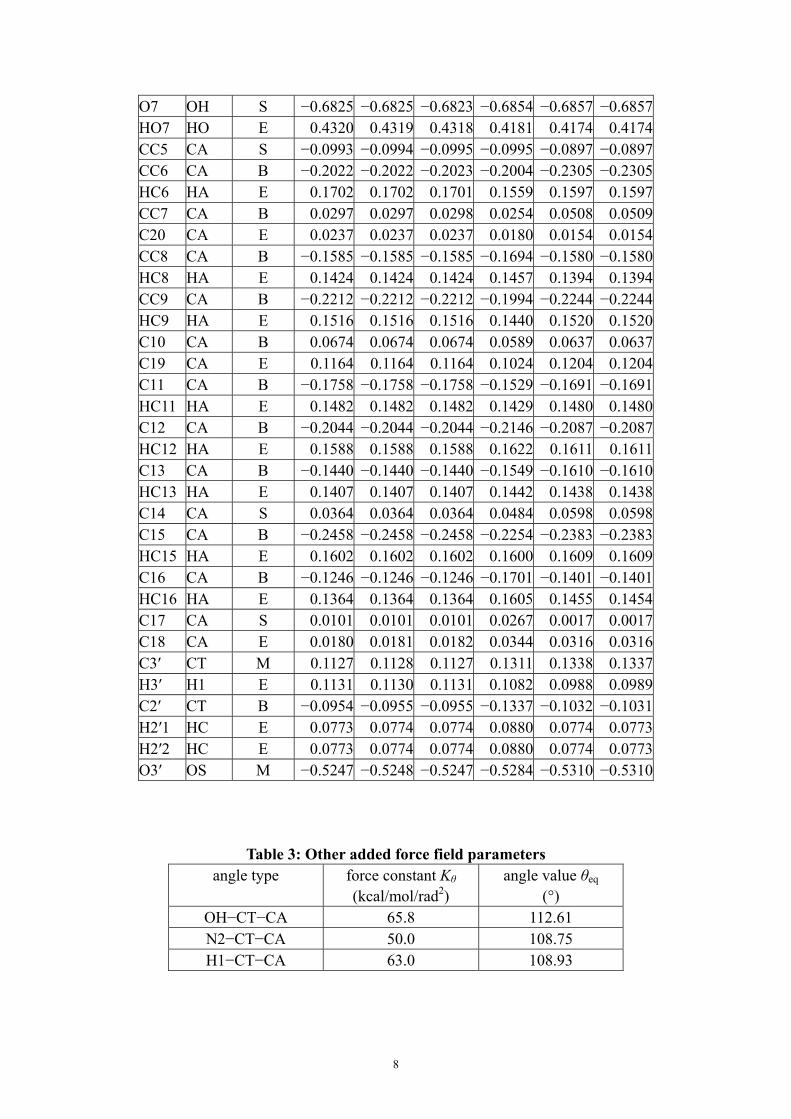
O7 OH S −0.6825 −0.6825 −0.6823 −0.6854 −0.6857 −0.6857HO7 HO E 0.4320 0.4319 0.4318 0.4181 0.4174 0.4174CC5 CA S −0.0993 −0.0994 −0.0995 −0.0995 −0.0897 −0.0897CC6 CA B −0.2022 −0.2022 −0.2023 −0.2004 −0.2305 −0.2305HC6 HA E 0.1702 0.1702 0.1701 0.1559 0.1597 0.1597CC7 CA B 0.0297 0.0297 0.0298 0.0254 0.0508 0.0509C20 CA E 0.0237 0.0237 0.0237 0.0180 0.0154 0.0154CC8 CA B −0.1585 −0.1585 −0.1585 −0.1694 −0.1580 −0.1580HC8 HA E 0.1424 0.1424 0.1424 0.1457 0.1394 0.1394CC9 CA B −0.2212 −0.2212 −0.2212 −0.1994 −0.2244 −0.2244HC9 HA E 0.1516 0.1516 0.1516 0.1440 0.1520 0.1520C10 CA B 0.0674 0.0674 0.0674 0.0589 0.0637 0.0637C19 CA E 0.1164 0.1164 0.1164 0.1024 0.1204 0.1204C11 CA B −0.1758 −0.1758 −0.1758 −0.1529 −0.1691 −0.1691HC11 HA E 0.1482 0.1482 0.1482 0.1429 0.1480 0.1480C12 CA B −0.2044 −0.2044 −0.2044 −0.2146 −0.2087 −0.2087HC12 HA E 0.1588 0.1588 0.1588 0.1622 0.1611 0.1611C13 CA B −0.1440 −0.1440 −0.1440 −0.1549 −0.1610 −0.1610HC13 HA E 0.1407 0.1407 0.1407 0.1442 0.1438 0.1438C14 CA S 0.0364 0.0364 0.0364 0.0484 0.0598 0.0598C15 CA B −0.2458 −0.2458 −0.2458 −0.2254 −0.2383 −0.2383HC15 HA E 0.1602 0.1602 0.1602 0.1600 0.1609 0.1609C16 CA B −0.1246 −0.1246 −0.1246 −0.1701 −0.1401 −0.1401HC16 HA E 0.1364 0.1364 0.1364 0.1605 0.1455 0.1454C17 CA S 0.0101 0.0101 0.0101 0.0267 0.0017 0.0017C18 CA E 0.0180 0.0181 0.0182 0.0344 0.0316 0.0316C3′ CT M 0.1127 0.1128 0.1127 0.1311 0.1338 0.1337H3′ H1 E 0.1131 0.1130 0.1131 0.1082 0.0988 0.0989C2′ CT B −0.0954 −0.0955 −0.0955 −0.1337 −0.1032 −0.1031H2′1 HC E 0.0773 0.0774 0.0774 0.0880 0.0774 0.0773H2′2 HC E 0.0773 0.0774 0.0774 0.0880 0.0774 0.0773O3′ OS M −0.5247 −0.5248 −0.5247 −0.5284 −0.5310 −0.5310
Table 3: Other added force field parameters angle type force constant Kθ
(kcal/mol/rad2) angle value θeq
(°) OH−CT−CA 65.8 112.61 N2−CT−CA 50.0 108.75 H1−CT−CA 63.0 108.93
8
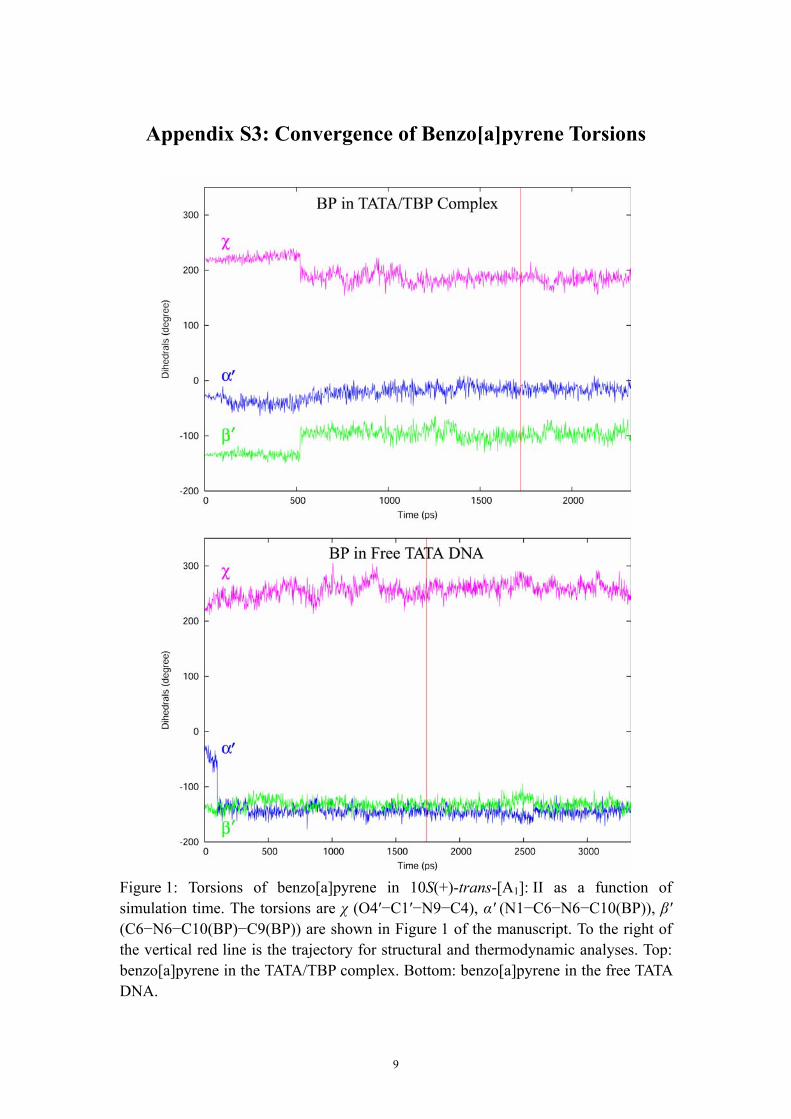
Appendix S3: Convergence of Benzo[a]pyrene Torsions
Figure 1: Torsions of benzo[a]pyrene in 10S(+)-trans-[A1]: II as a function of simulation time. The torsions are χ (O4′−C1′−N9−C4), α′ (N1−C6−N6−C10(BP)), β′ (C6−N6−C10(BP)−C9(BP)) are shown in Figure 1 of the manuscript. To the right of the vertical red line is the trajectory for structural and thermodynamic analyses. Top: benzo[a]pyrene in the TATA/TBP complex. Bottom: benzo[a]pyrene in the free TATA DNA.
9
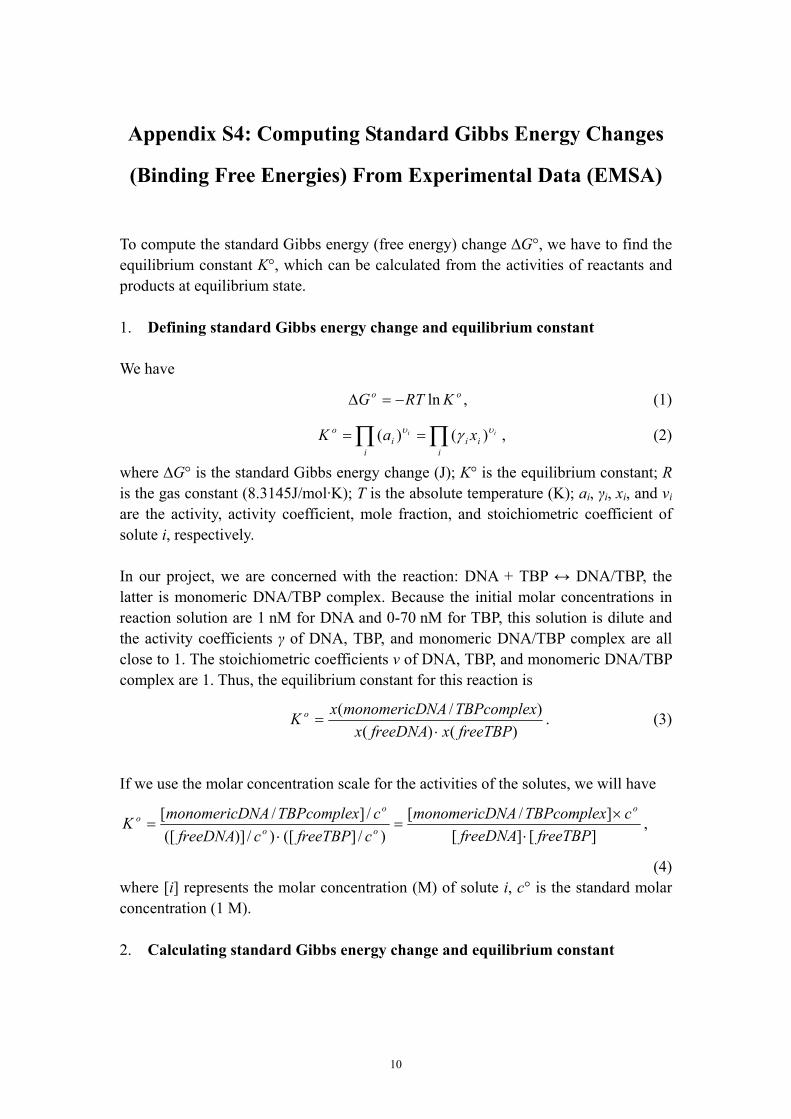
Appendix S4: Computing Standard Gibbs Energy Changes
(Binding Free Energies) From Experimental Data (EMSA)
To compute the standard Gibbs energy (free energy) change ∆G°, we have to find the equilibrium constant K°, which can be calculated from the activities of reactants and products at equilibrium state.
Defining standard Gibbs energy change and equilibrium constant 1. We have
,ln oo KRTG −=∆ (1)
∏∏ ==i
iii
io ii xaK υυ γ )()( , (2)
where ∆G° is the standard Gibbs energy change (J); K° is the equilibrium constant; R is the gas constant (8.3145J/mol·K); T is the absolute temperature (K); ai, γi, xi, and νi are the activity, activity coefficient, mole fraction, and stoichiometric coefficient of solute i, respectively. In our project, we are concerned with the reaction: DNA + TBP ↔ DNA/TBP, the latter is monomeric DNA/TBP complex. Because the initial molar concentrations in reaction solution are 1 nM for DNA and 0-70 nM for TBP, this solution is dilute and the activity coefficients γ of DNA, TBP, and monomeric DNA/TBP complex are all close to 1. The stoichiometric coefficients ν of DNA, TBP, and monomeric DNA/TBP complex are 1. Thus, the equilibrium constant for this reaction is
)()()/(
freeTBPxfreeDNAxTBPcomplexNAmonomericDxK o
⋅= . (3)
If we use the molar concentration scale for the activities of the solutes, we will have
][][]/[
)/]([)/)]([/]/[
freeTBPfreeDNAcTBPcomplexNAmonomericD
cfreeTBPcfreeDNAcTBPcomplexNAmonomericDK
o
oo
oo
⋅×
=⋅
= ,
(4) where [i] represents the molar concentration (M) of solute i, c° is the standard molar concentration (1 M).
Calculating standard Gibbs energy change and equilibrium constant 2.
10
D : free DNA
M : DNA in monomeric TBP-DNA complex
D : DNA in unknown forms2
D : DNA binds to TBP at the start of EMSA and then dissociates
1
Well: DNA cannot enter the gel
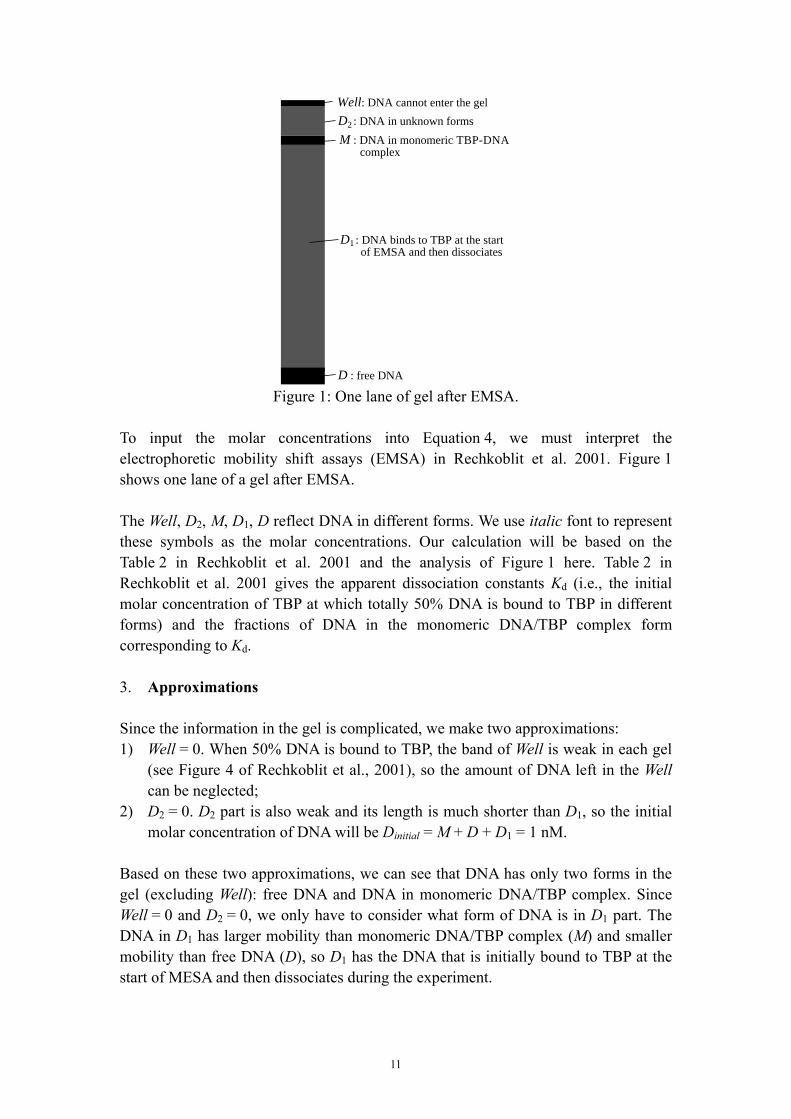
Figure 1: One lane of gel after EMSA.
To input the molar concentrations into Equation 4, we must interpret the electrophoretic mobility shift assays (EMSA) in Rechkoblit et al. 2001. Figure 1 shows one lane of a gel after EMSA. The Well, D2, M, D1, D reflect DNA in different forms. We use italic font to represent these symbols as the molar concentrations. Our calculation will be based on the Table 2 in Rechkoblit et al. 2001 and the analysis of Figure 1 here. Table 2 in Rechkoblit et al. 2001 gives the apparent dissociation constants Kd (i.e., the initial molar concentration of TBP at which totally 50% DNA is bound to TBP in different forms) and the fractions of DNA in the monomeric DNA/TBP complex form corresponding to Kd.
Approximations 3. Since the information in the gel is complicated, we make two approximations: 1) Well = 0. When 50% DNA is bound to TBP, the band of Well is weak in each gel
(see Figure 4 of Rechkoblit et al., 2001), so the amount of DNA left in the Well can be neglected;
2) D2 = 0. D2 part is also weak and its length is much shorter than D1, so the initial molar concentration of DNA will be Dinitial = M + D + D1 = 1 nM.
Based on these two approximations, we can see that DNA has only two forms in the gel (excluding Well): free DNA and DNA in monomeric DNA/TBP complex. Since Well = 0 and D2 = 0, we only have to consider what form of DNA is in D1 part. The DNA in D1 has larger mobility than monomeric DNA/TBP complex (M) and smaller mobility than free DNA (D), so D1 has the DNA that is initially bound to TBP at the start of MESA and then dissociates during the experiment.
11
Based on these two approximations, it is also clear that TBP binding with DNA exists only in monomeric DNA/TBP complex. TBP dimer does not exist in the gel or in the “Well” because it dissociates during a 30 min incubation (described in “Formation of TBP/Unmodified TATA DNA Complexes” part of “RESULTS” section of Rechkoblit et al. 2001. So the rest of TBP exists in free form.
Assumptions 4. D1 has high density in the gel, so we have to decide which part (free DNA or DNA in monomeric DNA/TBP complex) D1 belongs to. 1) Assumption 1: D1 belongs to free DNA, if the solution environment is the gel
buffer (see “MATERIALS AND METHODS” section of Rechkoblit et al. 2001). Then [freeDNA] = D + D1 = Dinitial − M = 1 nM − M, [monomericDNA/TBPcomplex] = M, [freeTBP] = TBPinitial − M = Kd − M. Because 1 nM = 10−9 M, we have
)101)(( 91 MMKcMKK
d
ooo
−×−×
== − ; (5)
Or 2) Assumption 2: D1 belongs to the DNA in monomeric DNA/TBP complex, if the
solution environment is the reaction buffer (see “MATERIALS AND METHODS” section of Rechkoblit et al. 2001). Then [monomericDNA/TBPcomplex] = 50%Dinitial = 0.5 nM, [freeDNA] = 50%Dinitial = 0.5 nM, [freeTBP] = TBPinitial − M = Kd − 0.5 nM. Because 1 nM = 10−9 M, we have
999
9
2 105.01
105.0)105.0(105.0
−−−
−
×−=
×××−××
==dd
ooo
KKcKK . (6)
Results 5.
The results are shown in Table 1 following. We use and in this work
because Assumption 2 is more reasonable.
oK 2oG2∆
12
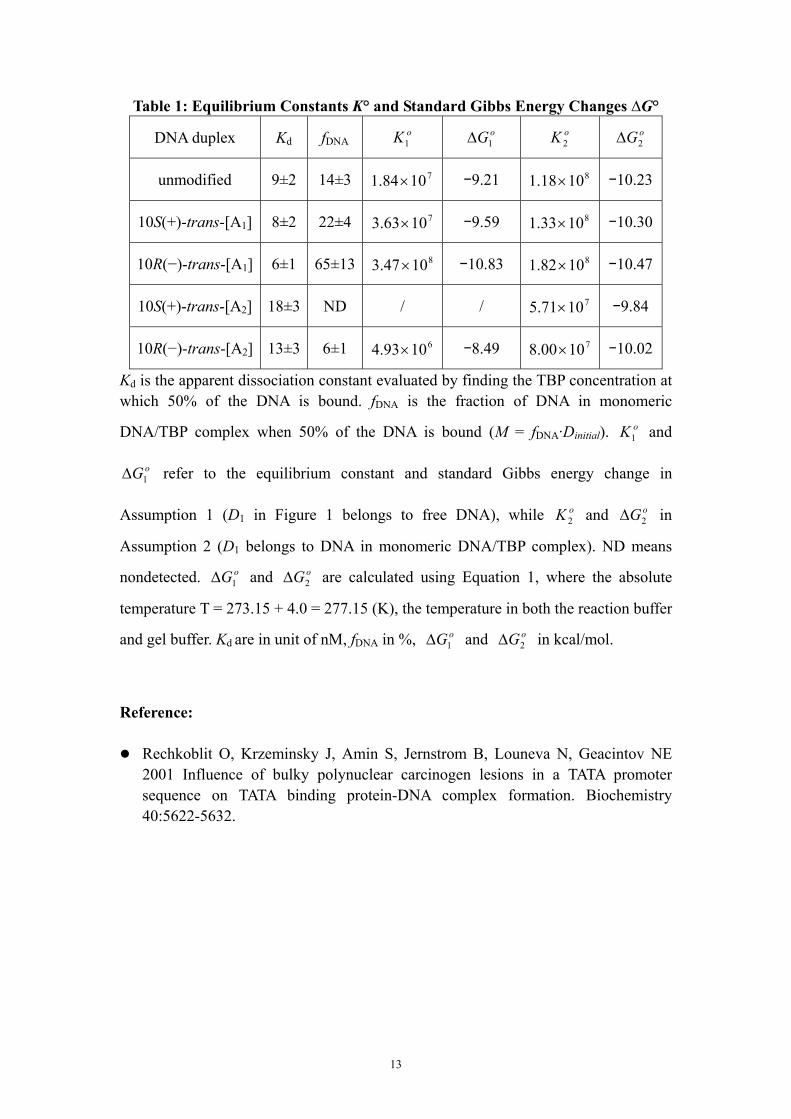
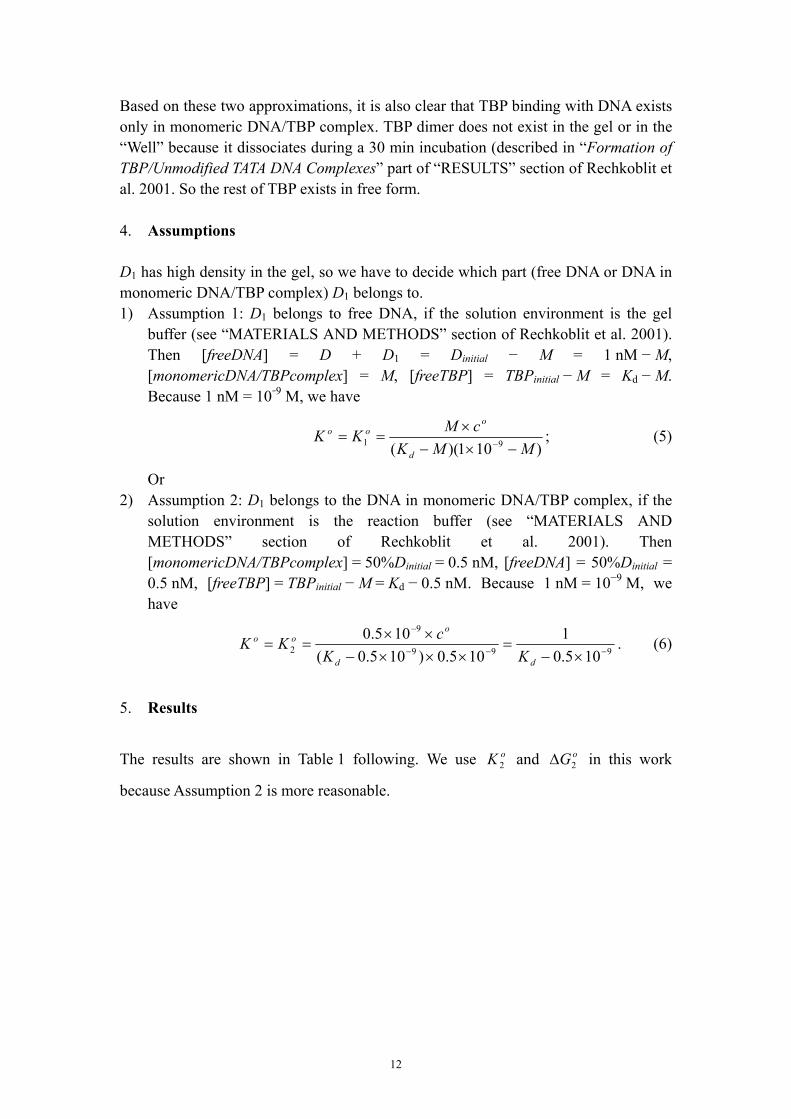
Table 1: Equilibrium Constants K° and Standard Gibbs Energy Changes ∆G°
DNA duplex Kd fDNA oK1 oG1∆ oK 2 oG2∆
unmodified 9±2 14±3 71084.1 × −9.21 81018.1 × −10.23
10S(+)-trans-[A1] 8±2 22±4 71063.3 × −9.59 81033.1 × −10.30
10R(−)-trans-[A1] 6±1 65±13 81047.3 × −10.83 81082.1 × −10.47
10S(+)-trans-[A2] 18±3 ND / / 71071.5 × −9.84
10R(−)-trans-[A2] 13±3 6±1 61093.4 × −8.49 71000.8 × −10.02
Kd is the apparent dissociation constant evaluated by finding the TBP concentration at which 50% of the DNA is bound. fDNA is the fraction of DNA in monomeric
DNA/TBP complex when 50% of the DNA is bound (M = fDNA·Dinitial). and
refer to the equilibrium constant and standard Gibbs energy change in
Assumption 1 (D
oK1
G2∆
oG1∆
1 in Figure 1 belongs to free DNA), while and in
Assumption 2 (D
oK 2o
1 belongs to DNA in monomeric DNA/TBP complex). ND means
nondetected. and are calculated using Equation 1, where the absolute
temperature T = 273.15 + 4.0 = 277.15 (K), the temperature in both the reaction buffer
and gel buffer. K
oG1∆ oG2∆
d are in unit of nM, fDNA in %, and ∆ in kcal/mol. oG1∆ oG2
Reference:
Rechkoblit O, Krzeminsky J, Amin S, Jernstrom B, Louneva N, Geacintov NE 2001 Influence of bulky polynuclear carcinogen lesions in a TATA promoter sequence on TATA binding protein-DNA complex formation. Biochemistry 40:5622-5632.
13
Appendix S5: Local Molecular Mechanics Interaction
Analysis
Comprehensive binding free energy analyses are computationally expensive. Here we compute local molecular mechanics interaction energies ∆EMM to see whether we could easily interpret the experimental binding affinities. The local region is defined by 32 residues: 3-9, 22-28, 40-41, 99, 133-135, 161-163, 166, 168, 177, 179, 183-187, where residue numbers 1-32 correspond to the DNA and 33-211 to TBP. These residues are within 5 Å from the A1 and A2 BP-binding sites and were selected based on the trajectories of all 12 systems. Table 1 shows the electrostatic interaction energies ∆Eele, van der Waals interaction energies ∆Evdw, and molecular mechanics interaction energies ∆EMM between TBP and TATA DNA, as well as the molecular mechanics energies EMM of the 12 TBP/DNA complexes. All energies are computed in the local region. The internal interaction energies ∆Eint are zero and not shown because there are no covalent bonds between TBP and TATA DNA. ∆EMM = ∆Eint + ∆Evdw + ∆Eele.
We can see that ∆EMM is dominated by ∆Eele because both TBP and TATA DNA are highly charged. ∆EMM differs widely, from −1068 to −1190 kcal/mol, with standard deviations around 15 to 36 kcal/mol. EMM differs from −44 to −200 kcal/mol with standard deviations around 26 to 49 kcal/mol. Because the differences in both ∆EMM and EMM are larger than their standard deviations, we cannot interpret the experimental binding free energy differences of <1 kcal/mol. Clearly, local molecular mechanics interaction analysis is insufficient to interpret global binding affinities.
14
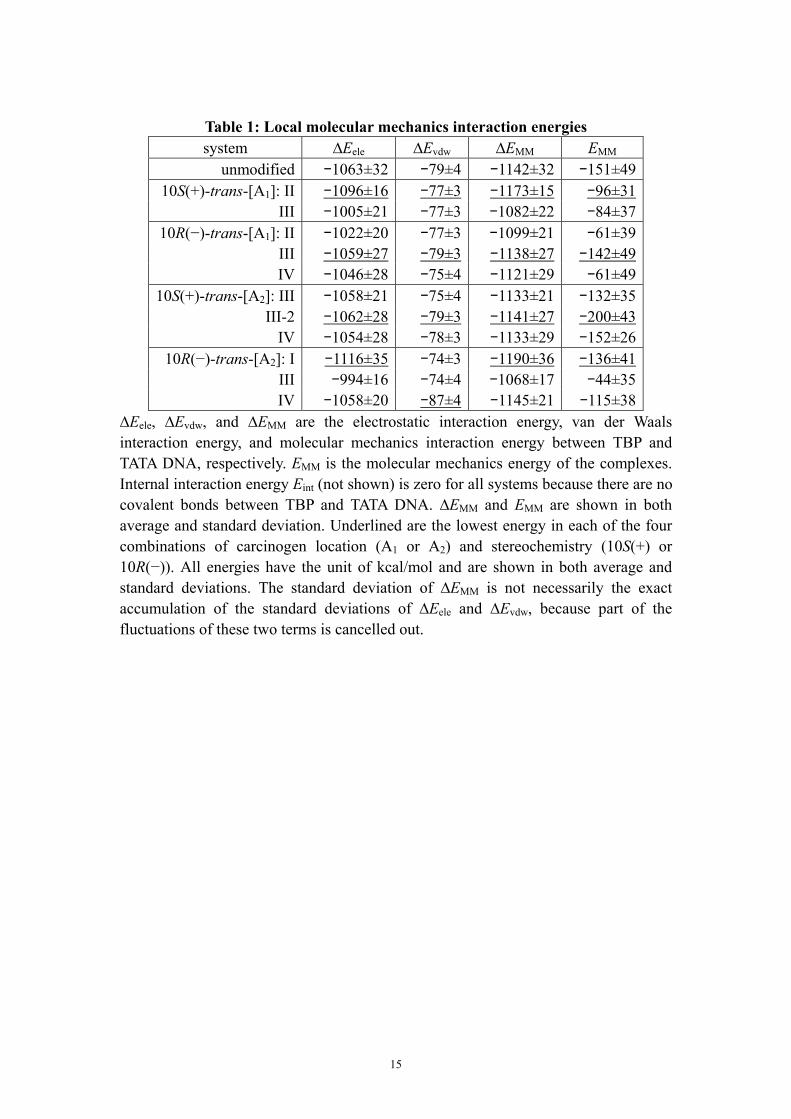
Table 1: Local molecular mechanics interaction energies system ∆Eele ∆Evdw ∆EMM EMM
unmodified −1063±32 −79±4 −1142±32 −151±49 10S(+)-trans-[A1]: II −1096±16 −77±3 −1173±15 −96±31
III −1005±21 −77±3 −1082±22 −84±37 10R(−)-trans-[A1]: II −1022±20 −77±3 −1099±21 −61±39
III −1059±27 −79±3 −1138±27 −142±49 IV −1046±28 −75±4 −1121±29 −61±49
10S(+)-trans-[A2]: III −1058±21 −75±4 −1133±21 −132±35 III-2 −1062±28 −79±3 −1141±27 −200±43
IV −1054±28 −78±3 −1133±29 −152±26 10R(−)-trans-[A2]: I −1116±35 −74±3 −1190±36 −136±41
III −994±16 −74±4 −1068±17 −44±35 IV −1058±20 −87±4 −1145±21 −115±38
∆Eele, ∆Evdw, and ∆EMM are the electrostatic interaction energy, van der Waals interaction energy, and molecular mechanics interaction energy between TBP and TATA DNA, respectively. EMM is the molecular mechanics energy of the complexes. Internal interaction energy Eint (not shown) is zero for all systems because there are no covalent bonds between TBP and TATA DNA. ∆EMM and EMM are shown in both average and standard deviation. Underlined are the lowest energy in each of the four combinations of carcinogen location (A1 or A2) and stereochemistry (10S(+) or 10R(−)). All energies have the unit of kcal/mol and are shown in both average and standard deviations. The standard deviation of ∆EMM is not necessarily the exact accumulation of the standard deviations of ∆Eele and ∆Evdw, because part of the fluctuations of these two terms is cancelled out.
15
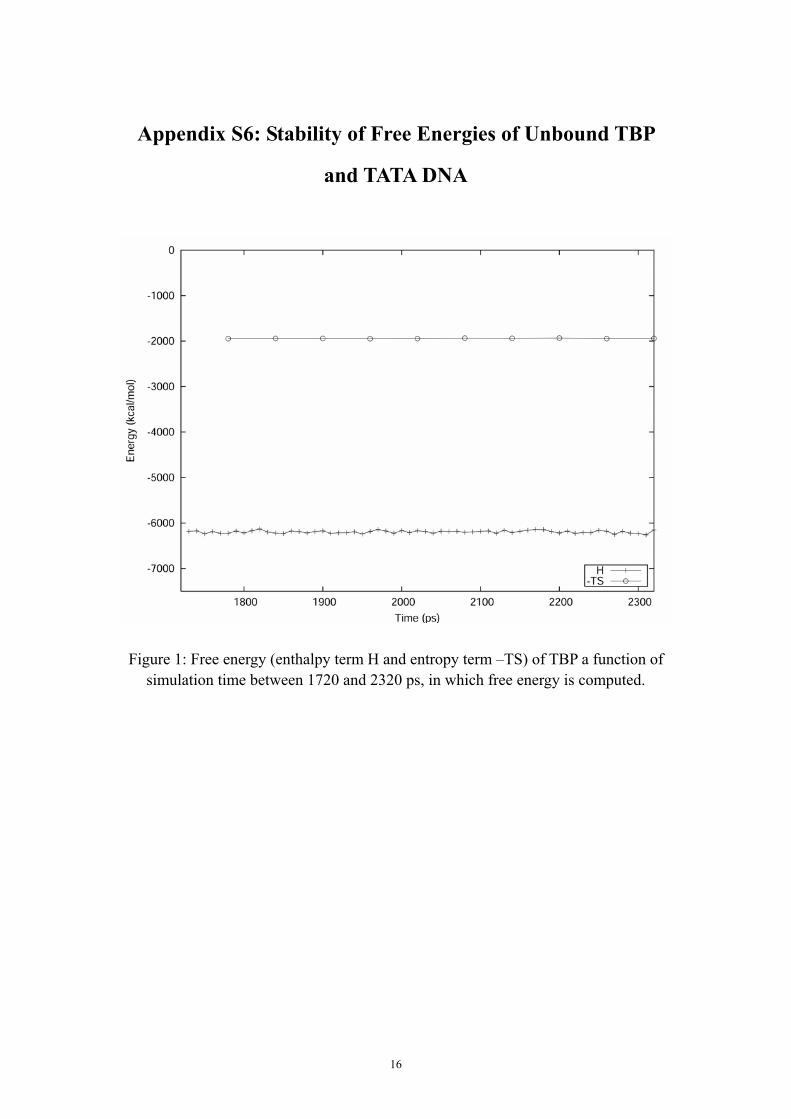
Appendix S6: Stability of Free Energies of Unbound TBP
and TATA DNA
Figure 1: Free energy (enthalpy term H and entropy term –TS) of TBP a function of simulation time between 1720 and 2320 ps, in which free energy is computed.
16
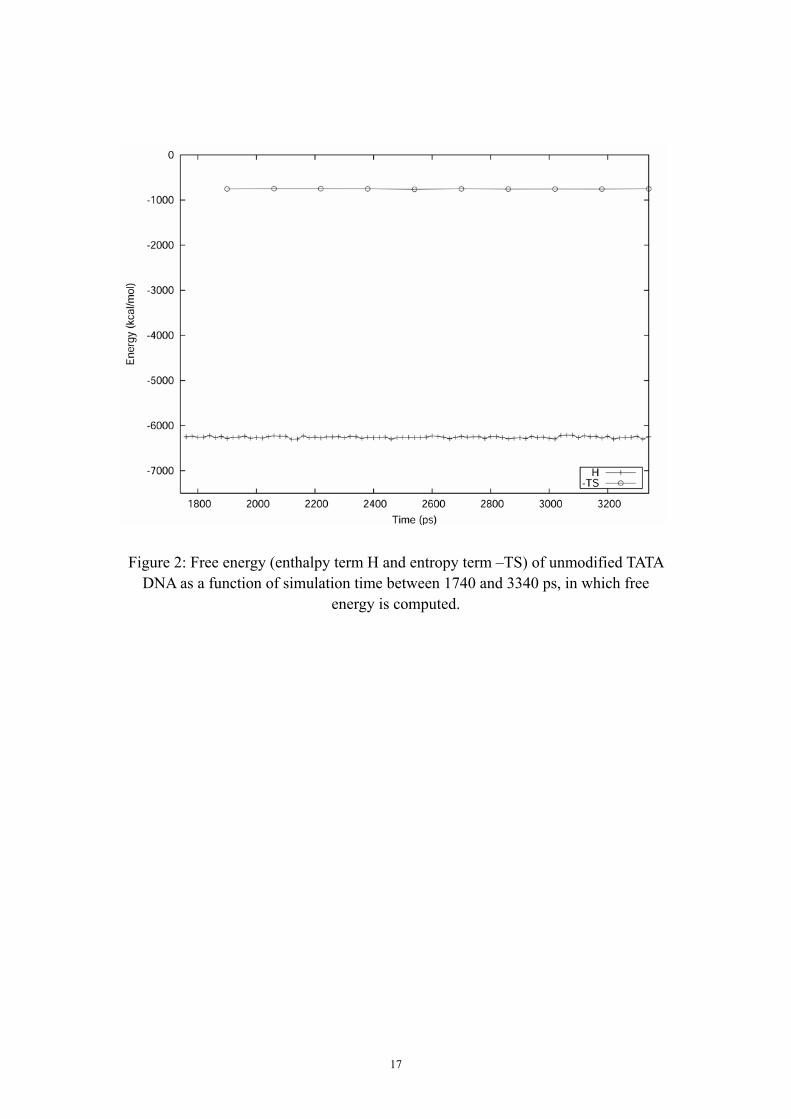
Figure 2: Free energy (enthalpy term H and entropy term –TS) of unmodified TATA DNA as a function of simulation time between 1740 and 3340 ps, in which free
energy is computed.
17
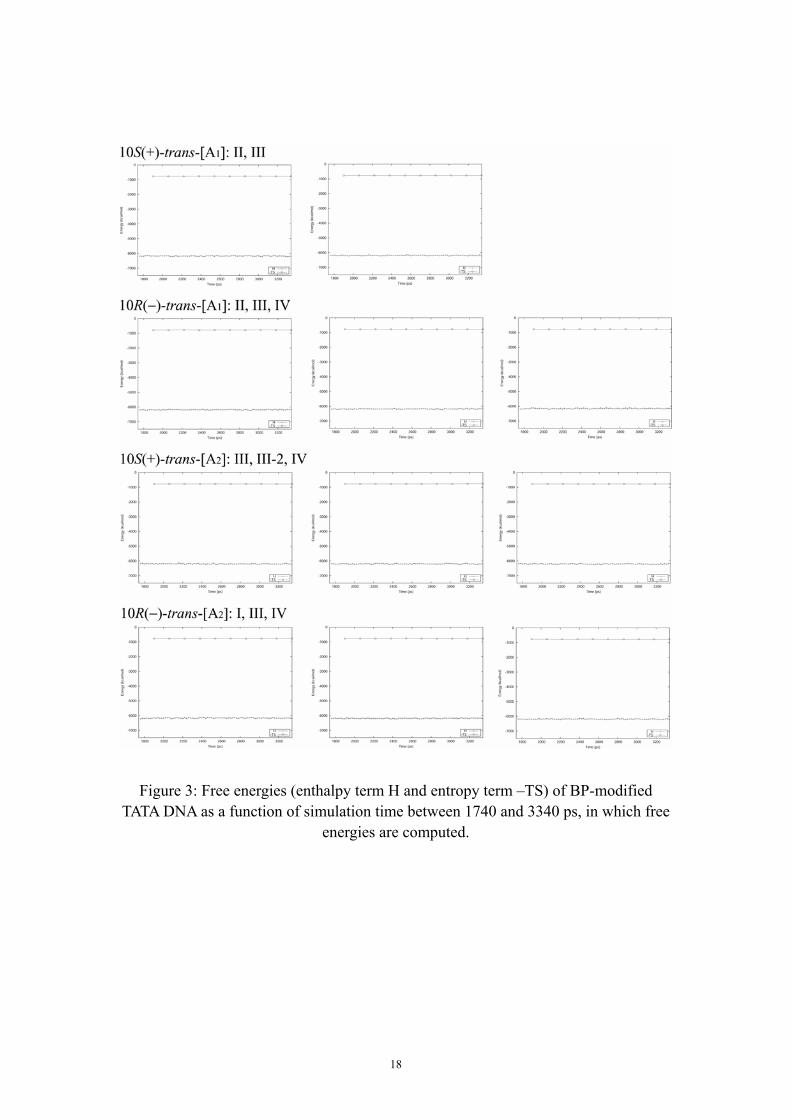
Figure 3: Free energies (enthalpy term H and entropy term –TS) of BP-modified TATA DNA as a function of simulation time between 1740 and 3340 ps, in which free
energies are computed.
18