Embed Size (px)
Citation preview
Stereographic ProjectionHonors 301
Professor Lee6 April 2005
Graham Barth
Stereographic Projection
Mapmaking has existed on planet Earth for thousands of years. From
the ancient Greeks with their intimate knowledge of the Mediterranean Sea
to modern data that can chart every border imaginable with great precision,
it has been an interesting and useful tool to project the components of a
three-dimensional sphere onto a two-dimensional plane. This projection has
allowed humans to set country borders, navigate oceans and rivers, and
provide effective and accurate ways to understand direction. It is the job of
the geographer to come up with methods of constructing these maps, and
stereographic projection is one of the best ones to utilize.
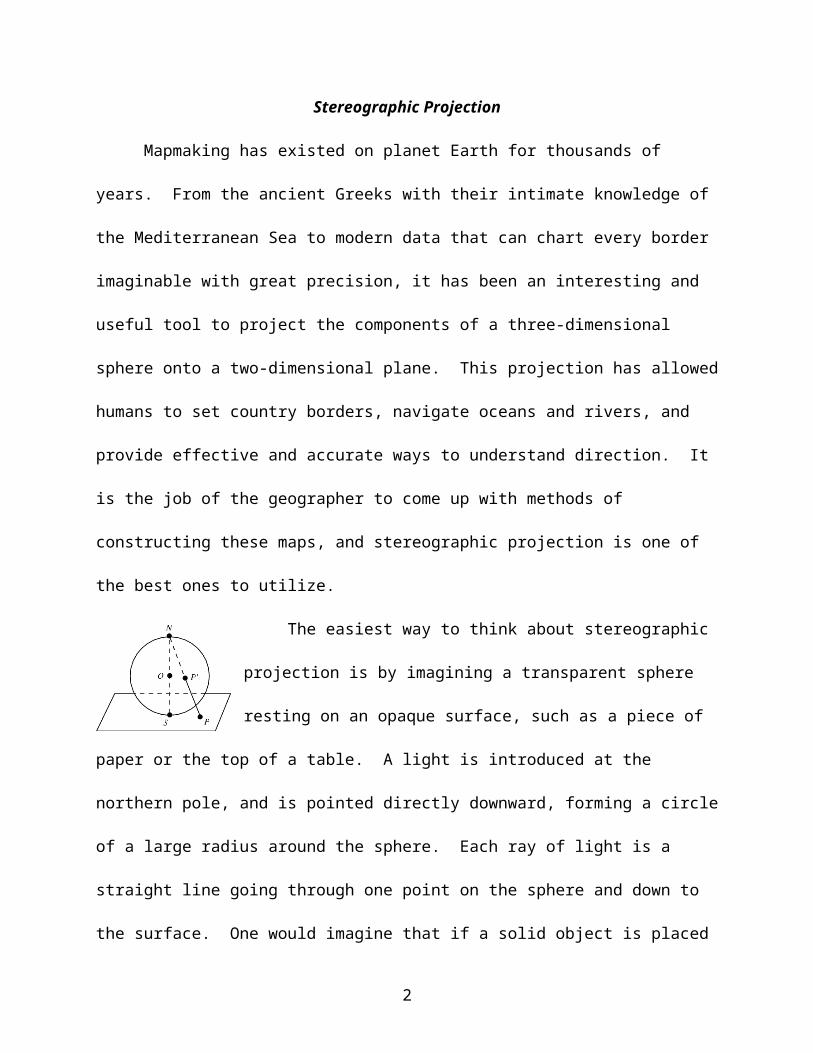
The easiest way to think about stereographic
projection is by imagining a transparent sphere resting on
an opaque surface, such as a piece of paper or the top of
a table. A light is introduced at the northern pole, and is
pointed directly downward, forming a circle of a large radius around the
sphere. Each ray of light is a straight line going through one point on the
sphere and down to the surface. One would imagine that if a solid object is
placed anywhere on the sphere, it would cause a shadow to appear on the
plane. The shadow would not necessarily represent an exact duplicate of
the object, because it could be longer or shorter, but it is the projection of
the object from the three-dimensional sphere to the two-dimensional plane.
Obviously, at the southern pole, the shadow would most represent its object
counterpart, and towards the equator it would become more skewed.
2

Overall, if one were to take the sphere and peel it like an orange, laying it
flat, the result would be a relatively accurate projection on a plane.
If, for example, a series of horizontal rings of varying radii were
placed around the sphere, one would expect to see small rings near the
southern pole that get larger as they go outward, like the rings of a tree.
The farther they go out, the more like horizontal lines they become. If this
sphere is “rolled,” one would see this map of perfect circles become more
and more skewed. The outermost circles would actually start to become
straight lines, and the middle circles would take on the shape of ovals or
ellipses from certain angles, with one side of the form very near to the
sphere and the other side farther away. Even with a quick ninety-degree
turn, the perfect circles would still be intact, but with the sphere residing
near the edge instead of in the complete center. These shadows are not
exactly like the rings surrounding the sphere, but they merely represent
their two-dimensional projection at that particular angle. Since the light at
the top of the sphere never changes position, it always pushes the same
rays of light through the same points on the sphere. The only thing that
changes is the position of the solid objects on the sphere relative to the
plane. This is why different projections of the Earth look different when
viewed at various angles.
Consider the example of the Earth. The South Pole would be a point
at the exact center of the plane, right where it touches the Earth. The view
of Antarctica would be very accurate, with almost no stretching of the
3

borders, and it would become more and more distorted as you move out to
the equator. The equator appears to be much larger than it actually is,
twice to be exact, and things to the north of the equator, such as Greenland,
are huge. The northern hemisphere is more distorted the farther up you go,
and the point representing the North Pole goes off into infinity in all
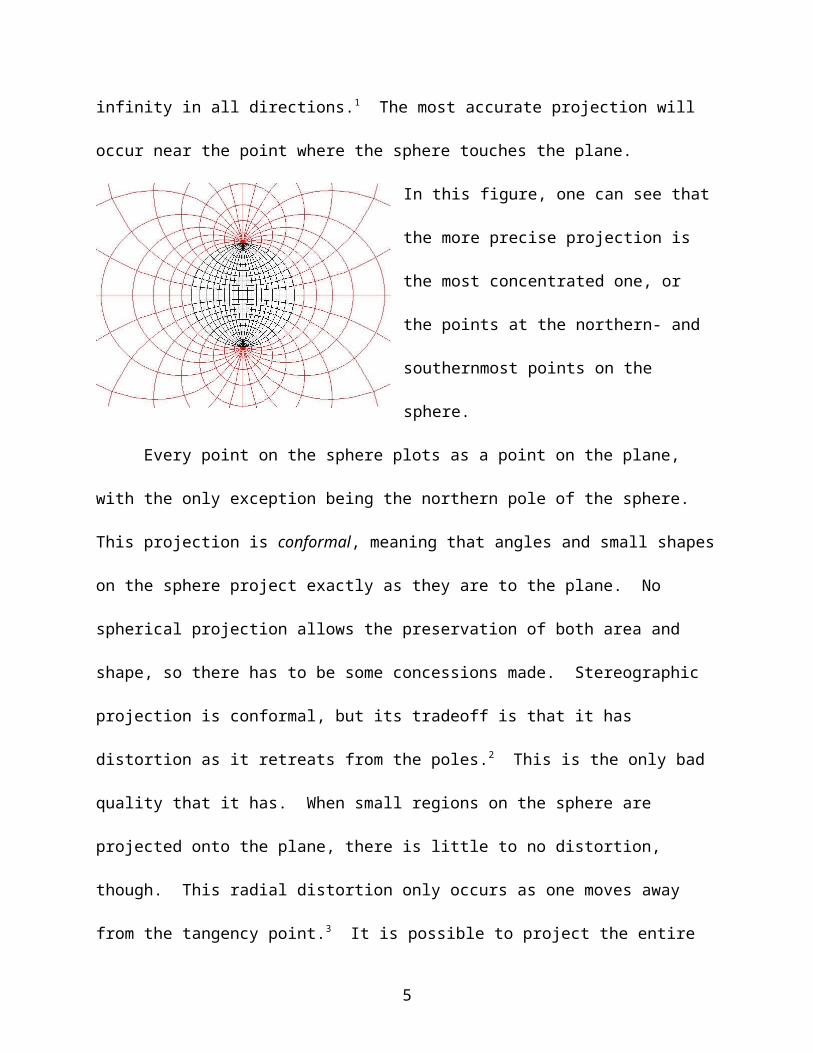
directions.1 The most accurate projection will occur near the point where
the sphere touches the plane.
In this figure, one can see that the
more precise projection is the most
concentrated one, or the points at the
northern- and southernmost points on
the sphere.
Every point on the sphere plots as
a point on the plane, with the only
exception being the northern pole of the sphere. This projection is
conformal, meaning that angles and small shapes on the sphere project
exactly as they are to the plane. No spherical projection allows the
preservation of both area and shape, so there has to be some concessions
made. Stereographic projection is conformal, but its tradeoff is that it has
distortion as it retreats from the poles.2 This is the only bad quality that it
has. When small regions on the sphere are projected onto the plane, there
is little to no distortion, though. This radial distortion only occurs as one
moves away from the tangency point.3 It is possible to project the entire
4
sphere onto one plane, with only the northern pole being absent. In theory
this seems relevant, because it would allow one to see the entire object in
one place without having to rotate it. But in practice, it is different. The
distortion is too great as the farthest objects are reached for any practical
utility. So, in the real world, stereographic projection is most commonly
used for those points close to the tangency point.
People use stereographic projection for different purposes.
Mineralogists use what is called a Wulff
stereonet, which is constructed using simple
geometry. Structural geologists use a
Schmidt stereonet, which is derived from a
more complicated algorithm so that every
square on the map is equal in area. The
Wulff stereographic projection is
constructed by projecting points from the sphere’s surface to the plane, just
like what was mentioned above. The only difference is that the plane cuts
through the center of the sphere in the Wulff model. Each point from the
upper hemisphere is plotted onto the plane, exactly where the line of
projection passes through the plane of projection.4 If one were to plot the
southern hemisphere, it would be inverted when the northern pole is used
as the point of projection. The Schmidt projections usually represent the
southern hemisphere.
5

The stereonet, or the system of longitudinal and latitudinal lines
encompassing a sphere, shows the projection of numerous great circles and
small circles. A great circle has its radius equal to that of the entire sphere.
It usually cuts through the equatorial plane and splits the sphere in half. A
small circle is any circle with radius less than that of the whole sphere. A
good way to imagine a small circle is to think of a point on the sphere, and
to imagine the sphere rotating on an axis which is not far from the point.
The path that the point takes along the sphere represents a small circle.5
The longitudinal lines of the earth are great circles, because they all go
through both the North and South Poles. They are each equal to the
equator, and if they were represented as planes, they would pass directly
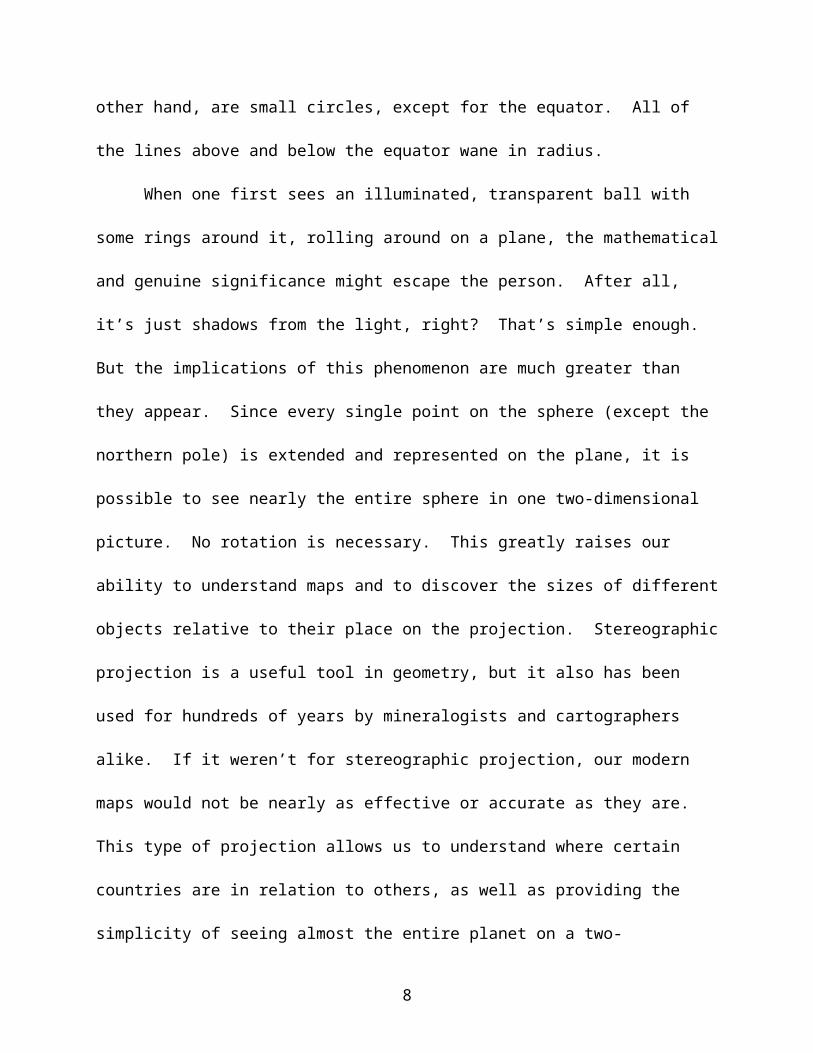
through the center of the earth. The latitudinal lines, on the other hand, are
small circles, except for the equator. All of the lines above and below the
equator wane in radius.
When one first sees an illuminated, transparent ball with some rings
around it, rolling around on a plane, the mathematical and genuine
significance might escape the person. After all, it’s just shadows from the
light, right? That’s simple enough. But the implications of this
phenomenon are much greater than they appear. Since every single point
on the sphere (except the northern pole) is extended and represented on the
plane, it is possible to see nearly the entire sphere in one two-dimensional
picture. No rotation is necessary. This greatly raises our ability to
understand maps and to discover the sizes of different objects relative to
6

their place on the projection. Stereographic projection is a useful tool in
geometry, but it also has been used for hundreds of years by mineralogists
and cartographers alike. If it weren’t for stereographic projection, our
modern maps would not be nearly as effective or accurate as they are. This
type of projection allows us to understand where certain countries are in
relation to others, as well as providing the simplicity of seeing almost the
entire planet on a two-dimensional plane. This only proves that
stereographic projection is a mathematical formula but has valid and real-
world applications. It is only when you get past the first glance that you
realize it is more than just a ball rolling on a plane.
7
References
(1) Banchoff, Thomas F. Beyond the Third Dimension. Scientific American Library. New York, NY, 1990. pp. 124-126
(2) Dutch, Steven. “Spherical Projections.” From University of Wisconsin – Green Bay Website. http://www.uwgb.edu/dutchs/structge/sphproj.htm
(3) ibid.
(4) “Mineralogy – Stereographic Projections” http://www.science.smith.edu/departments/Geology/Min_jb/StereoProjs.pdf
(5) ibid.
8


![STEREOGRAPHIC MAP PROJECTION OF CROATIA...CROATIA The stereographic projection has not been previously considered for the region of Croatia. A. Fashing [12] considered it for the area](https://img.pdfslide.net/doc/110x75/60c3cc2e11a4af2d2d1b5dae/stereographic-map-projection-of-croatia-croatia-the-stereographic-projection.jpg)


![On multiuser perspectives in passive stereographic virtual ... · of a stereographic projection technique can deeply affect user perception [4,5]. In more detail, it can affect the](https://img.pdfslide.net/doc/110x75/5fd60df9b8f07e155753d2a9/on-multiuser-perspectives-in-passive-stereographic-virtual-of-a-stereographic.jpg)