Embed Size (px)
DESCRIPTION
STERICYCLE (SRCL). Ross Pevitz Matt Storkman Shengdong Zhu RCMP Presentation April 10, 2007. Position. May, 2001 Bought 200 Shares Purchase for $19.47 ($3,894) Current Price is $81.92 ($16,384) $12,490 Unrealized Gain 5% of Portfolio. History. 1989- Stericycle founded - PowerPoint PPT Presentation
Citation preview
STERICYCLE(SRCL)
Ross PevitzMatt StorkmanShengdong Zhu
RCMP PresentationApril 10, 2007
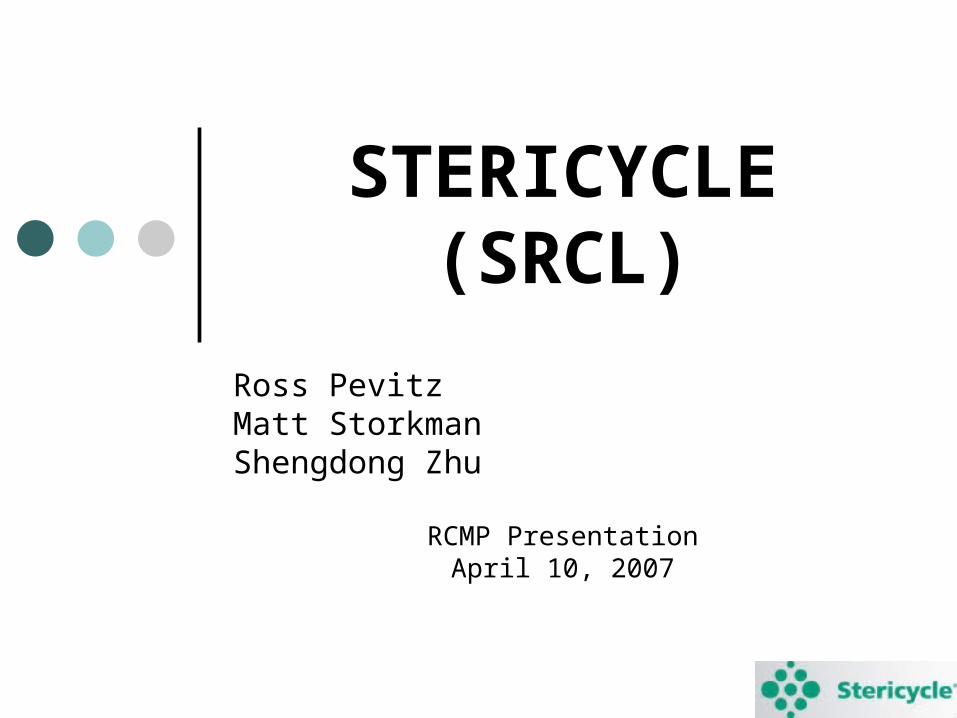
Position
May, 2001 Bought 200 SharesPurchase for $19.47 ($3,894)
Current Price is $81.92 ($16,384)$12,490 Unrealized Gain
5% of Portfolio
History
1989- Stericycle founded Medical Waste Tracking Act Strict regulations for dealing with Medical Waste Afford convenient, cost effective, and efficient solutions
1993- Acquired over 116 companies since 1993 1996- IPO 2000- North America’s Largest Provider of regulated
Medical Waste Management Services
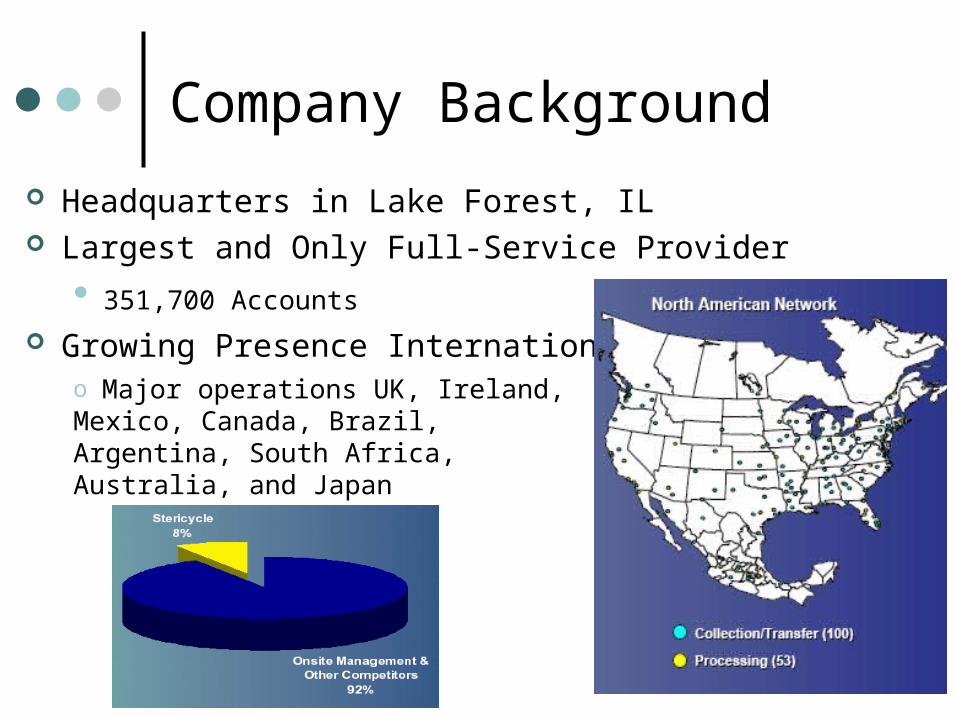
Company Background Headquarters in Lake Forest, IL Largest and Only Full-Service Provider
351,700 Accounts Growing Presence Internationally
o Major operations UK, Ireland, Mexico, Canada, Brazil, Argentina, South Africa, Australia, and Japan
Products and Services Mission: Help healthcare organizations reduce risk, provide a
safer workplace, and stay in compliance with national, state, and local regulations.
Offer collection, transportation, treatment, disposal, and recycling of medical waste Treatment: Incineration (burn), Proprietary Autoclaving (steam)
^Proprietary ETD, Electro-Thermal Deactivation (grinding) Stericycle Medical Waste Services
Bio-systems **Sharps Management Water Management Service RX Waste Compliance Program
**Pharmaceutical Services
Products and Services
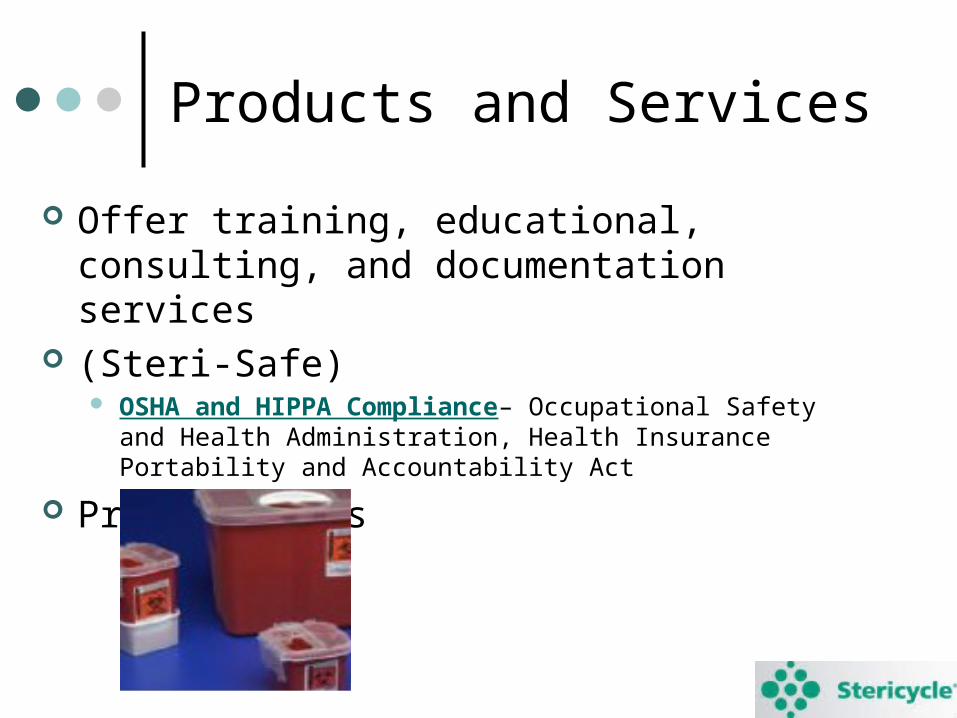
Offer training, educational, consulting, and documentation services
(Steri-Safe) OSHA and HIPPA Compliance– Occupational Safety and Health
Administration, Health Insurance Portability and Accountability Act
Product Sales
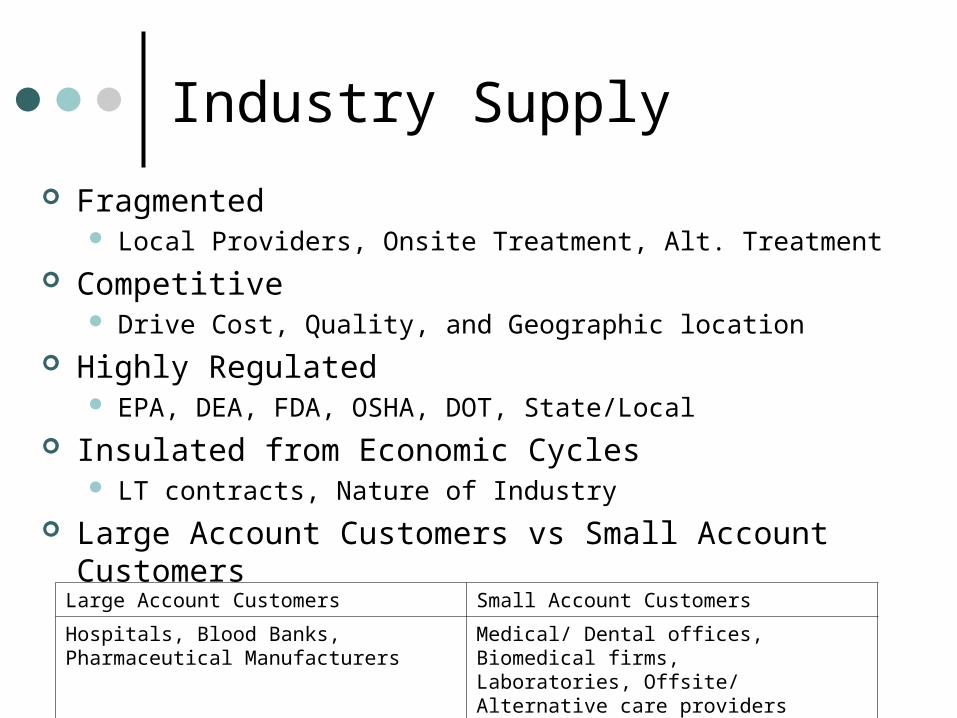
Industry Supply Fragmented
Local Providers, Onsite Treatment, Alt. Treatment Competitive
Drive Cost, Quality, and Geographic location Highly Regulated
EPA, DEA, FDA, OSHA, DOT, State/Local Insulated from Economic Cycles
LT contracts, Nature of Industry Large Account Customers vs Small Account Customers
Large Account Customers Small Account Customers
Hospitals, Blood Banks, Pharmaceutical Manufacturers
Medical/ Dental offices, Biomedical firms,Laboratories, Offsite/ Alternative care providers
Industry Demand Pressure to Reduce Healthcare Costs Aging Population
Baby Boomers Better Health Care
Stricter Environmental and Safety Regulations Larger Fines and Unaware market
Economic Risks
Interest Rate, Inflation, GDP, Competition Energy Costs
Transportation and Treatment
Foreign Exchange Risk Changing Government Regulations!!! Patent and Trademark Expiration Liabilities and Insurance
Clean up costs, personal injury, ect.
Competitive Advantages
Established Brand Name and Market Leader Strong Management Team Low Cost Operator
Economies of Scale Full Service Provider
Vertically Integrated, growing Horizontally Loyal and Diverse Customers
Revenue retention >95% Largest customers <2% of Revenues LT contracts with automatic renewal and price ↑ provisions
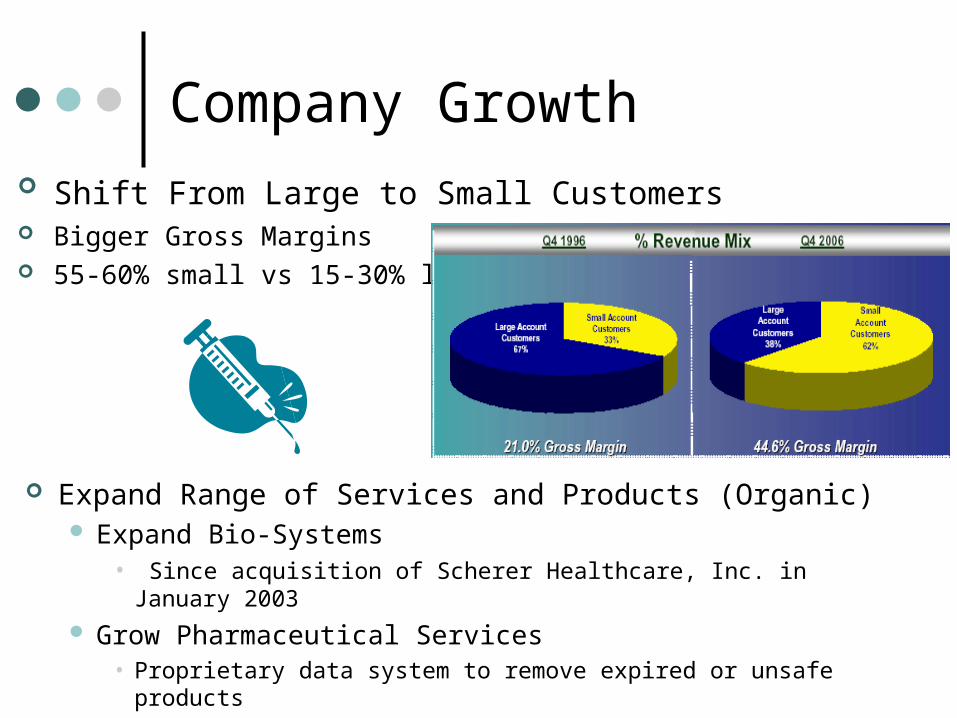
Company Growth Shift From Large to Small Customers Bigger Gross Margins 55-60% small vs 15-30% large
Expand Range of Services and Products (Organic) Expand Bio-Systems
• Since acquisition of Scherer Healthcare, Inc. in January 2003 Grow Pharmaceutical Services
• Proprietary data system to remove expired or unsafe products
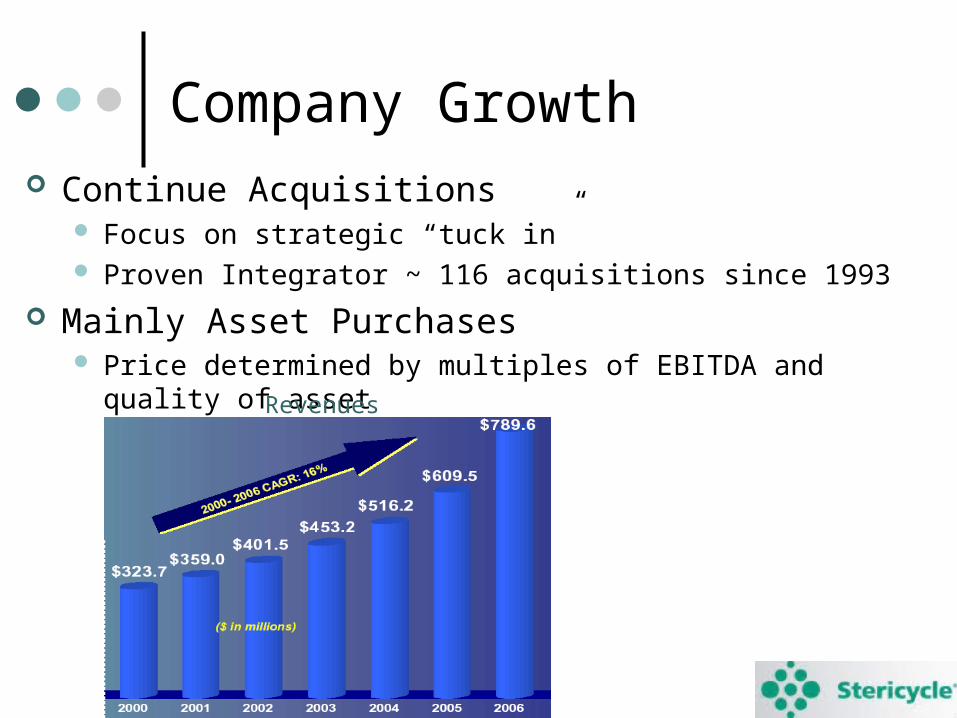
Company Growth Continue Acquisitions
Focus on strategic “tuck in” Proven Integrator ~ 116 acquisitions since 1993
Mainly Asset Purchases Price determined by multiples of EBITDA and quality of asset
Revenues
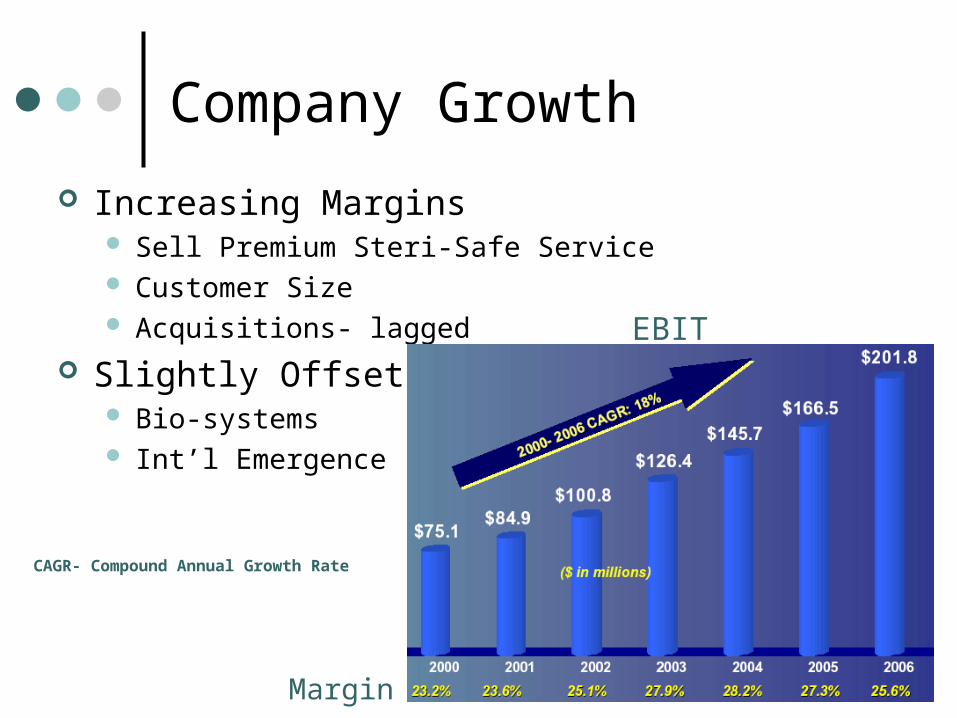
Company Growth Increasing Margins
Sell Premium Steri-Safe Service Customer Size Acquisitions- lagged
Slightly Offset Bio-systems Int’l Emergence
EBIT
Margins
CAGR- Compound Annual Growth Rate
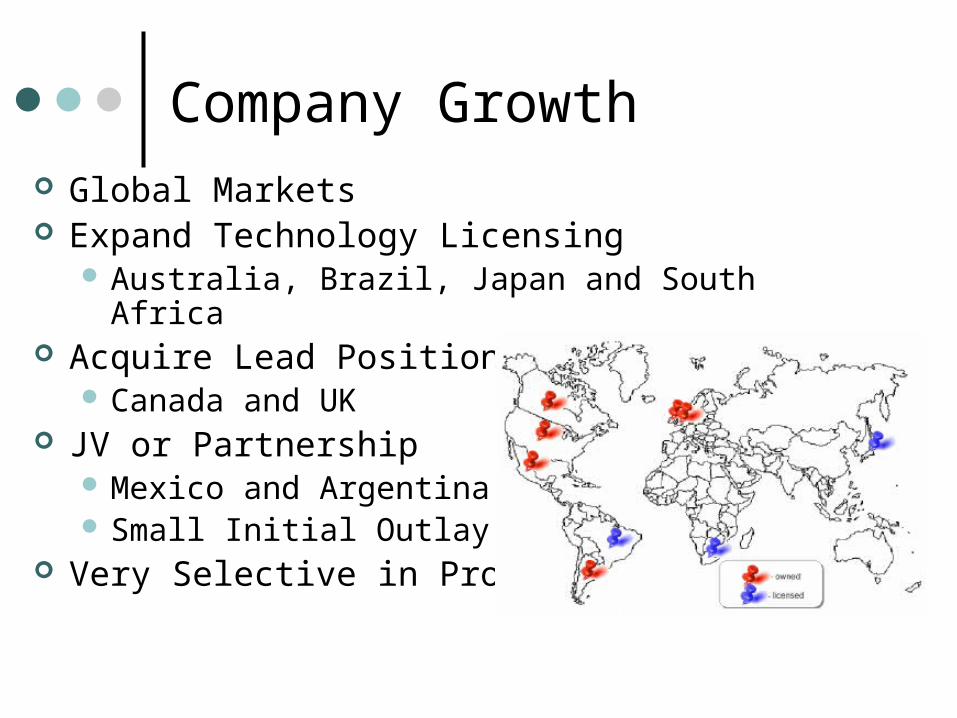
Company Growth Global Markets Expand Technology Licensing
Australia, Brazil, Japan and South Africa Acquire Lead Position
Canada and UK JV or Partnership
Mexico and Argentina Small Initial Outlay
Very Selective in Process
0
500
1,000
1,500
2,000
2,500
3,000
FY '04 FY '05 FY '06 2007 2008 2009 2010 2011 2012
US
D (
mm
)
0%
5%
10%
15%
20%
25%
30%
35%
Total operating revenues FCF Net Income EBIT Margin Net Profit Margin Revenue Growth Rate
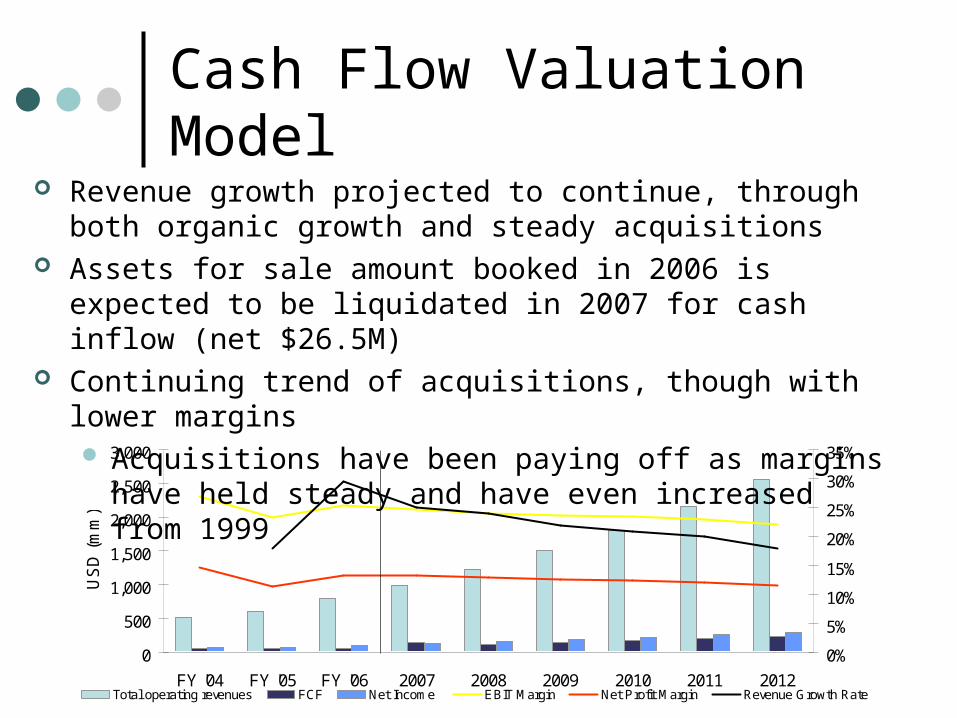
Cash Flow Valuation Model Revenue growth projected to continue, through both organic
growth and steady acquisitions Assets for sale amount booked in 2006 is expected to be
liquidated in 2007 for cash inflow (net $26.5M) Continuing trend of acquisitions, though with lower margins
Acquisitions have been paying off as margins have held steady and have even increased from 1999
-$150-$100
-$50$0
$50$100$150$200$250$300$350
FY '04 FY '05 FY '06 2007 2008 2009 2010 2011 2012 Terminal2012
Net Income Deprec & Amort Δ in NWC CapExp FCF
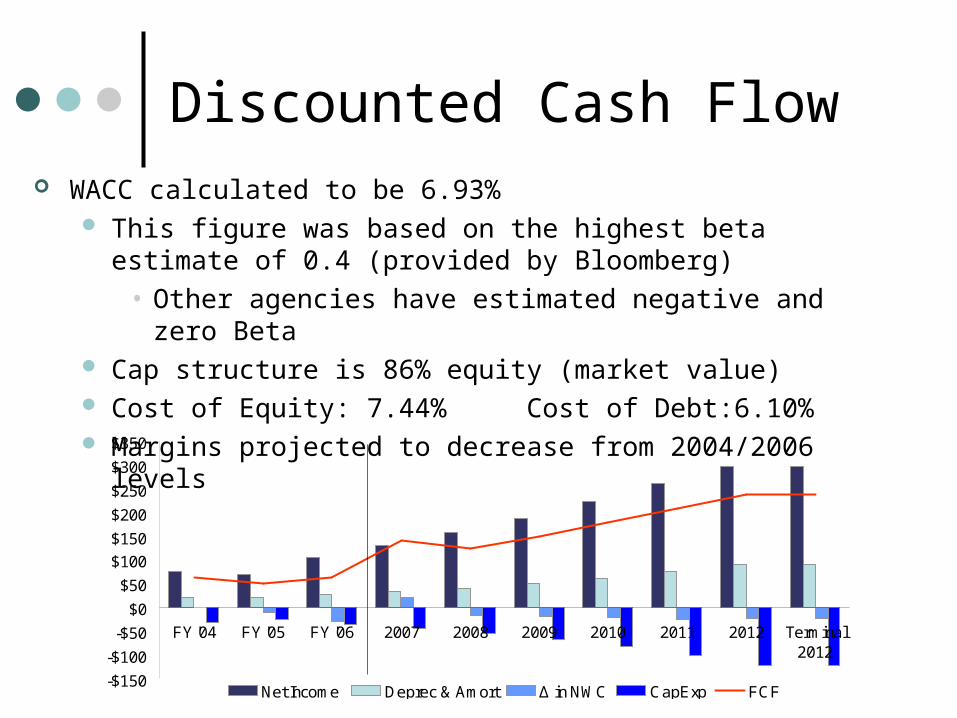
Discounted Cash Flow WACC calculated to be 6.93%
This figure was based on the highest beta estimate of 0.4 (provided by Bloomberg)
• Other agencies have estimated negative and zero Beta Cap structure is 86% equity (market value) Cost of Equity: 7.44% Cost of Debt:6.10% Margins projected to decrease from 2004/2006 levels
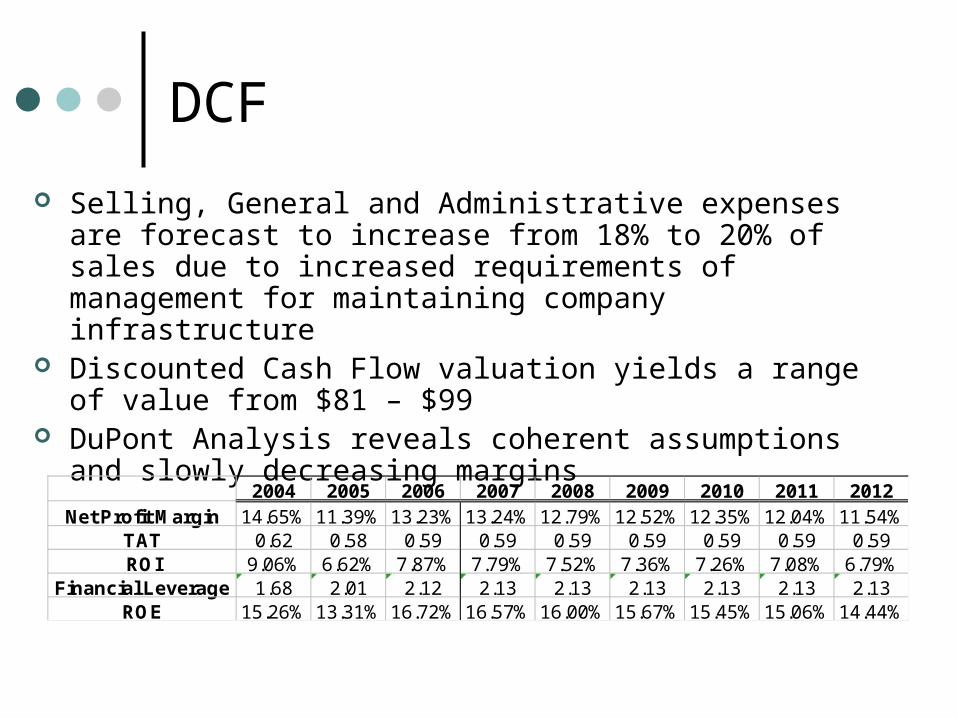
DCF Selling, General and Administrative expenses are forecast to
increase from 18% to 20% of sales due to increased requirements of management for maintaining company infrastructure
Discounted Cash Flow valuation yields a range of value from $81 – $99
DuPont Analysis reveals coherent assumptions and slowly decreasing margins
2004 2005 2006 2007 2008 2009 2010 2011 2012Net Profit Margin 14.65% 11.39% 13.23% 13.24% 12.79% 12.52% 12.35% 12.04% 11.54%
TAT 0.62 0.58 0.59 0.59 0.59 0.59 0.59 0.59 0.59ROI 9.06% 6.62% 7.87% 7.79% 7.52% 7.36% 7.26% 7.08% 6.79%
Financial Leverage 1.68 2.01 2.12 2.13 2.13 2.13 2.13 2.13 2.13ROE 15.26% 13.31% 16.72% 16.57% 16.00% 15.67% 15.45% 15.06% 14.44%
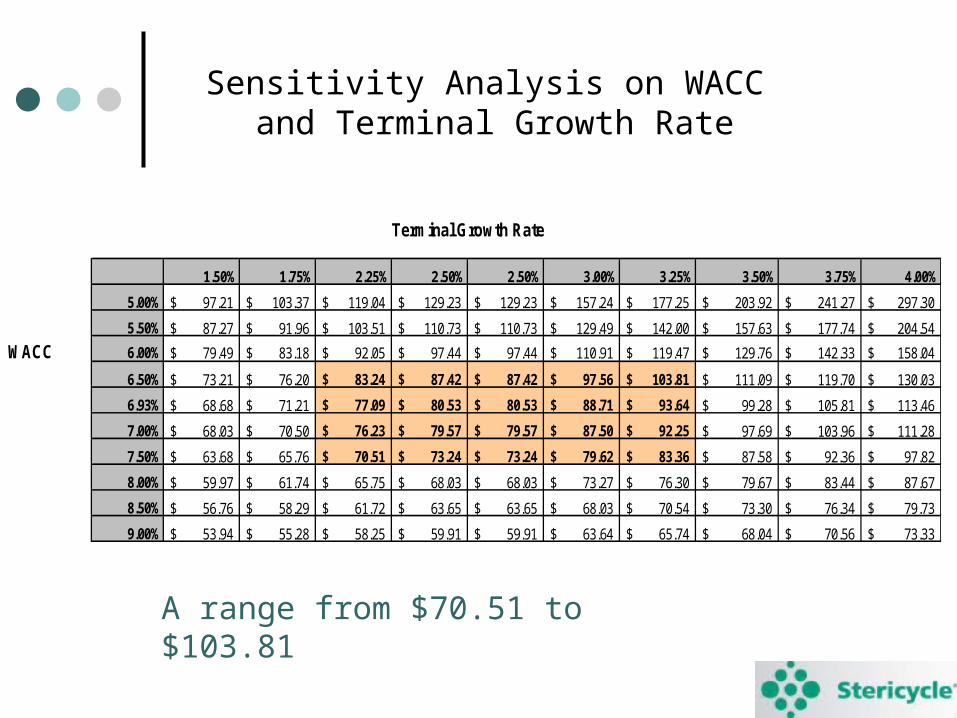
Sensitivity Analysis on WACC and Terminal Growth Rate
A range from $70.51 to $103.81
1.50% 1.75% 2.25% 2.50% 2.50% 3.00% 3.25% 3.50% 3.75% 4.00%5.00% 97.21$ 103.37$ 119.04$ 129.23$ 129.23$ 157.24$ 177.25$ 203.92$ 241.27$ 297.30$
5.50% 87.27$ 91.96$ 103.51$ 110.73$ 110.73$ 129.49$ 142.00$ 157.63$ 177.74$ 204.54$ 6.00% 79.49$ 83.18$ 92.05$ 97.44$ 97.44$ 110.91$ 119.47$ 129.76$ 142.33$ 158.04$
6.50% 73.21$ 76.20$ 83.24$ 87.42$ 87.42$ 97.56$ 103.81$ 111.09$ 119.70$ 130.03$
6.93% 68.68$ 71.21$ 77.09$ 80.53$ 80.53$ 88.71$ 93.64$ 99.28$ 105.81$ 113.46$
7.00% 68.03$ 70.50$ 76.23$ 79.57$ 79.57$ 87.50$ 92.25$ 97.69$ 103.96$ 111.28$
7.50% 63.68$ 65.76$ 70.51$ 73.24$ 73.24$ 79.62$ 83.36$ 87.58$ 92.36$ 97.82$
8.00% 59.97$ 61.74$ 65.75$ 68.03$ 68.03$ 73.27$ 76.30$ 79.67$ 83.44$ 87.67$
8.50% 56.76$ 58.29$ 61.72$ 63.65$ 63.65$ 68.03$ 70.54$ 73.30$ 76.34$ 79.73$
9.00% 53.94$ 55.28$ 58.25$ 59.91$ 59.91$ 63.64$ 65.74$ 68.04$ 70.56$ 73.33$
Terminal Growth Rate
WACC
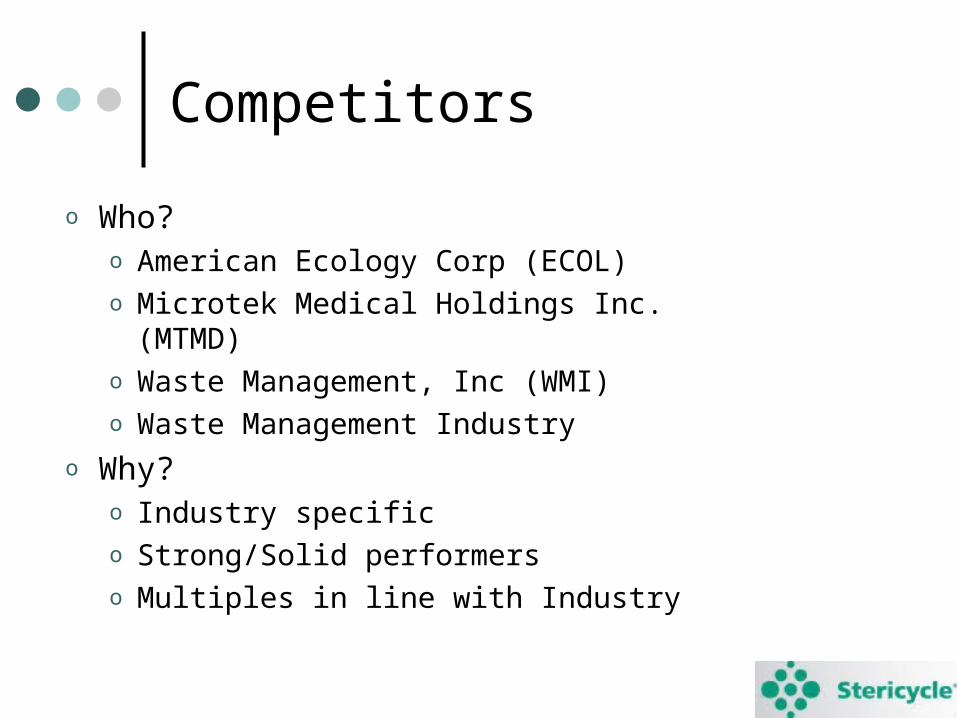
Competitors
o Who?o American Ecology Corp (ECOL)o Microtek Medical Holdings Inc. (MTMD)o Waste Management, Inc (WMI) o Waste Management Industry
o Why?o Industry specifico Strong/Solid performerso Multiples in line with Industry
Critical Multiples Comparison
o Gross Margino Operating Margins o Enterprise Value/Revenueo Enterprise Value/EBITDAo EPS
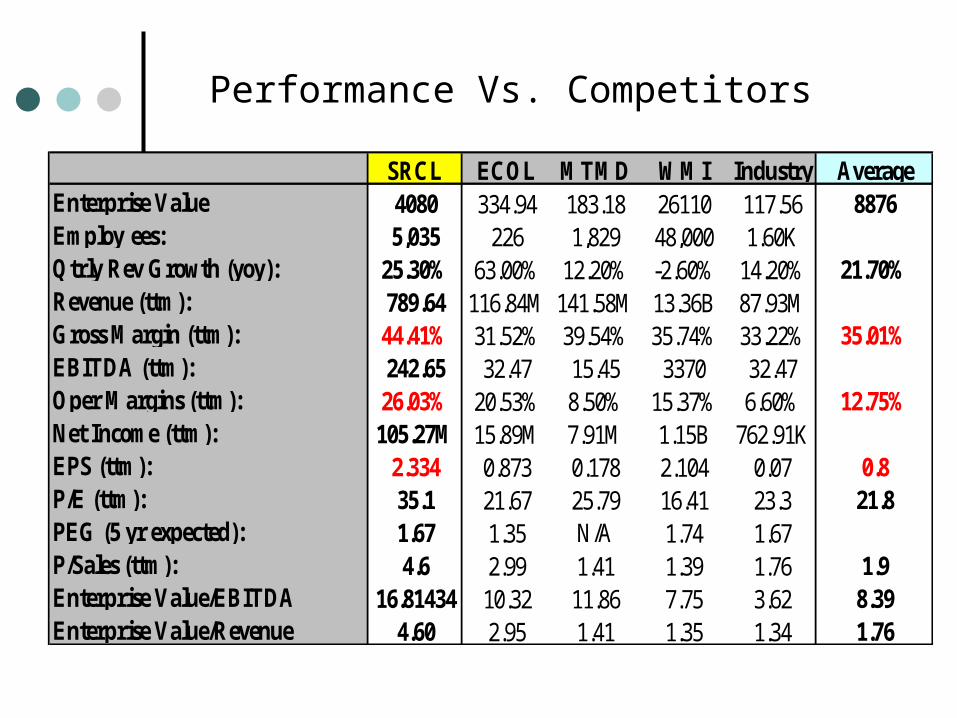
Performance Vs. Competitors
SRCL ECOL MTMD WMI Industry AverageEnterprise Value 4080 334.94 183.18 26110 117.56 8876Employ ees: 5,035 226 1,829 48,000 1.60KQtrly Rev Growth (yoy): 25.30% 63.00% 12.20% -2.60% 14.20% 21.70%Revenue (ttm): 789.64 116.84M 141.58M 13.36B 87.93MGross Margin (ttm): 44.41% 31.52% 39.54% 35.74% 33.22% 35.01%EBITDA (ttm): 242.65 32.47 15.45 3370 32.47Oper Margins (ttm): 26.03% 20.53% 8.50% 15.37% 6.60% 12.75%Net Income (ttm): 105.27M 15.89M 7.91M 1.15B 762.91KEPS (ttm): 2.334 0.873 0.178 2.104 0.07 0.8P/E (ttm): 35.1 21.67 25.79 16.41 23.3 21.8PEG (5 yr expected): 1.67 1.35 N/A 1.74 1.67P/Sales (ttm): 4.6 2.99 1.41 1.39 1.76 1.9Enterprise Value/EBITDA 16.81434 10.32 11.86 7.75 3.62 8.39Enterprise Value/Revenue 4.60 2.95 1.41 1.35 1.34 1.76
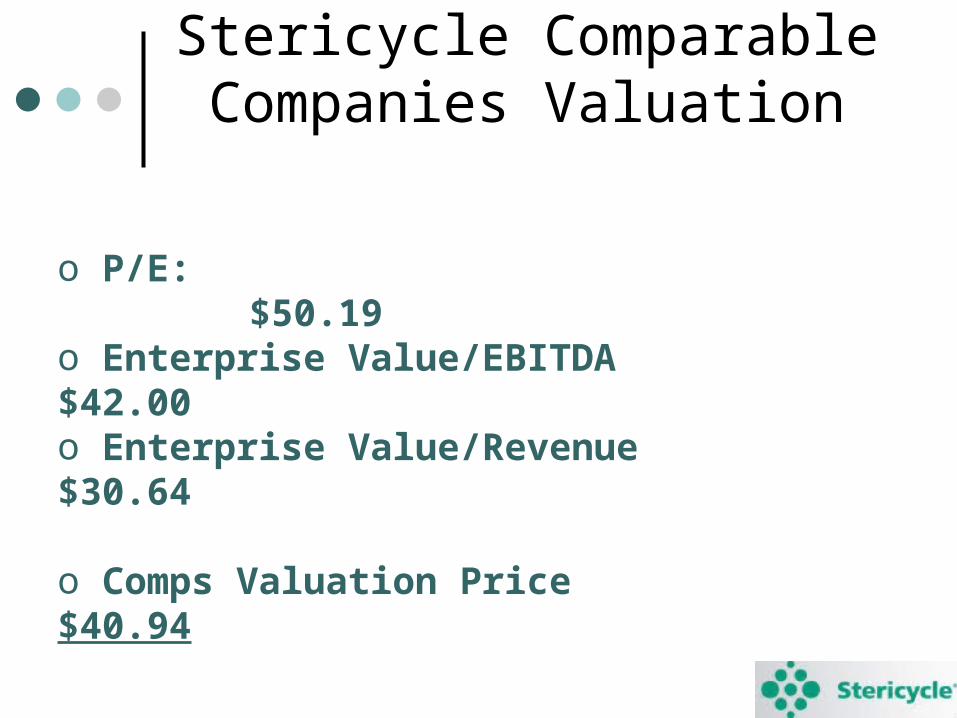
Stericycle Comparable Companies Valuation
o P/E: $50.19 o Enterprise Value/EBITDA $42.00 o Enterprise Value/Revenue $30.64
o Comps Valuation Price $40.94
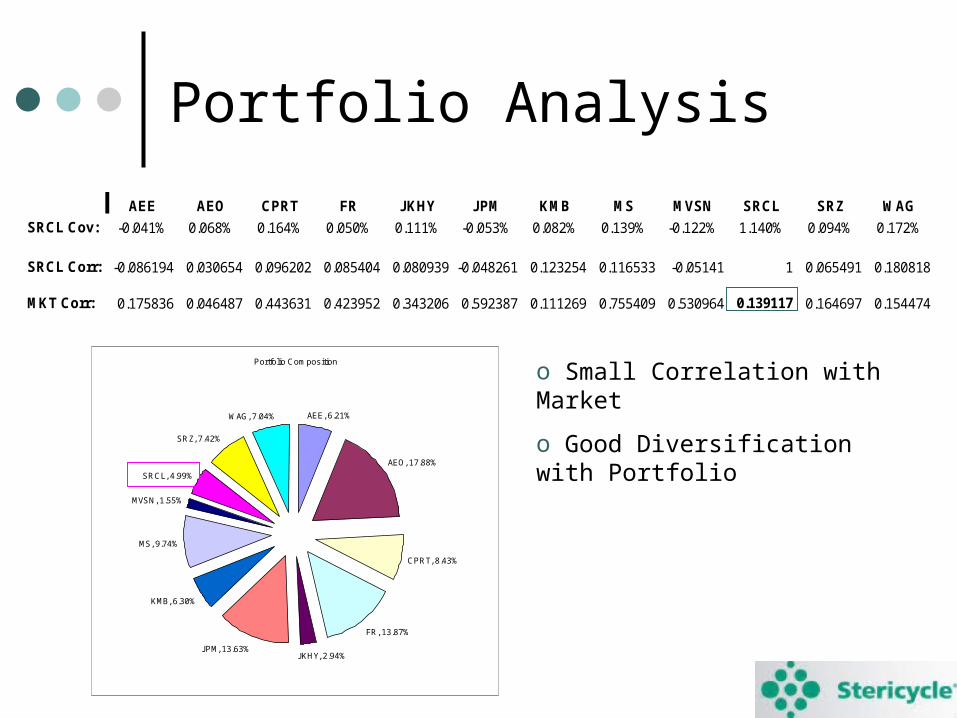
Portfolio Analysis
Portfolio Composition
AEE, 6.21%
AEO, 17.88%
CPRT, 8.43%
FR, 13.87%
JKHY, 2.94%JPM, 13.63%
KMB, 6.30%
MS, 9.74%
MVSN, 1.55%
SRCL, 4.99%
SRZ, 7.42%
WAG, 7.04%
AEE AEO CPRT FR JKHY JPM KMB MS MVSN SRCL SRZ WAGSRCL Cov: -0.041% 0.068% 0.164% 0.050% 0.111% -0.053% 0.082% 0.139% -0.122% 1.140% 0.094% 0.172%
SRCL Corr: -0.086194 0.030654 0.096202 0.085404 0.080939 -0.048261 0.123254 0.116533 -0.05141 1 0.065491 0.180818
MKT Corr: 0.175836 0.046487 0.443631 0.423952 0.343206 0.592387 0.111269 0.755409 0.530964 0.139117 0.164697 0.154474
o Small Correlation with Market
o Good Diversification with Portfolio
Valuation Discussion: Hold The low estimate of the discounted cash flow valuation
represents the current market price of SRCL $81 is also the year-high for the stock
Comparable company valuation places a much lower value on the stock SRCL is trading at a large premium compared to its
peers SRCL outperforms all of its peers in operating metrics
such as gross margin and operating margin DCF analysis and forecasting provide reasoning and
reinforce the market’s premium for SRCL Analyst Team recommends holding SRCL
Questions?
Love to Entertain!!!