Embed Size (px)
Citation preview

Steve Ingham
Kelvin Stagg
Chief Executive Officer
Chief Financial Officer
LSE: PAGE.L
Website: http://www.page.com/investors
11 April 2018
Q1 2018 Trading Update
“Another quarter of double
digit growth”

Headline Numbers
Kelvin Stagg, Chief Financial Officer

Q1 18
Headline Numbers Financial Review Regional Review Summary
3
Key financial highlights
A record quarter for the Group
£187.7m£170.2m Q1 2017
Gross Profit +12.3%+9.1% Q1 2017
+10.3%+19.7% Q1 2017
Growth in
Constant
Currency
Reported
Rates
Michael
Page
Page
Personnel
c. £91mc. £86m Q1 2017
Net Cash+10.8%+7.1% Q1 2017
+15.9%+14.0% Q1 2017

Financial Review

Q1 18
Headline Numbers Financial Review Regional Review Summary
76%
24%
Perm Temp
84%
16%
Perm Temp
59%
41%
Perm Temp
5
• Gross Profit growth in
permanent +13.9% to £142.1m
• Temporary +7.3% to £45.6m
• Perm:Temp ratio 76:24 broadly
in line with prior year
• Gross Profit growth in
permanent +12.5% to £107.5m
• Temporary +2.5% to £21.2m
• Gross Profit growth in
permanent +18.7% to £34.7m
• Temporary +12.0% to £24.4m
Strong brand growth with consistent mixBusiness balance reflects brands and geographic mix
Q1 18
Headline Numbers Financial Review Regional Review Summary
35%
24%
24%
17%
25%25%25%25%
Accounting and Financial Services
Legal, Technology, HR, Secretarial,Healthcare
Engineering, Property & Construction,Procurement & Supply Chain
Marketing, Sales and Retail
Discipline diversification progress
Gross Profit
by Discipline
£m 2018 2017 Reported % Constant %
Accounting and Financial
Services65.6 63.3 +3.6% +5.3%
Engineering, Property &
Construction, Procurement
& Supply Chain
45.1 36.5 +23.6% +25.6%
Legal, Technology, HR,
Secretarial, Healthcare44.4 37.8 +17.4% +19.9%
Marketing, Sales and
Retail32.6 32.6 +0.1% +2.1%
Group Total 187.7 170.2 +10.3% +12.3%
Specialist disciplines continue to deliver record growth
6
Q1 18
Headline Numbers Financial Review Regional Review Summary
1,532 1,631
5,497 5,680
0
1,000
2,000
3,000
4,000
5,000
6,000
7,000
8,000
Q4 2017 Q1 2018
He
ad
co
un
t
Support Staff Fee Earners
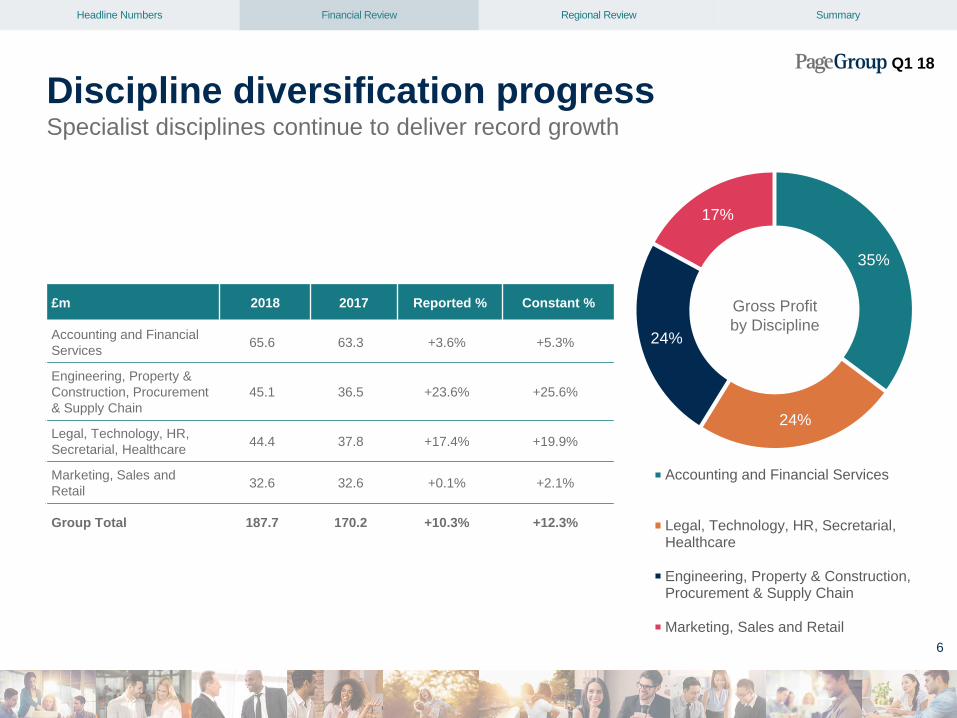
• Increase in fee earners of 183 (+3.3%)
• Fee earner headcount responds to trading
conditions, +82 in EMEA, -28 in the UK
• Fee earner headcount added in our Large, High
Potential markets, as well as where we saw
strongest growth
• Increase in support staff of 99 (+6.5%)
• Temporary additions made to support our strategic
operational support programmes
7
+4%
A new record headcountRatio of fee earners to support staff maintained at a record 78:22

Q1 18
Headline Numbers Financial Review Regional Review Summary
8
49
.5
51
.4
47
.8
43
.9
42
.8
45
.0
45
.0
45
.7
48
.1
52
.3
53
.5
56
.7
59
.9 68
.3
69
.2
70
.2 79
.2 87
.4
89
.1
93
.1 10
5.5 12
1.0
12
3.4
12
8.2
14
0.3
15
2.4
14
1.3
11
8.7
95
.0
83
.8
82
.3 90
.6 97
.9 11
1.7
11
2.8
11
9.9
12
7.3 1
47
.8
14
2.6
13
6.1
13
5.9
13
8.0
12
6.5
12
6.5
12
6.8
13
5.1
12
6.9
12
5.1
12
6.6
13
7.1
13
2.9
13
6.2
13
5.7
14
5.3
13
9.1
13
5.8
14
2.2 15
6.9
15
8.6
16
3.3
17
0.2
18
2.0
17
7.3
18
2.4
18
7.7
19
1.1
0
1000
2000
3000
4000
5000
6000
0
50
100
150
200
250
Q1
Q2
Q3
Q4
Q1
Q2
Q3
Q4
Q1
Q2
Q3
Q4
Q1
Q2
Q3
Q4
Q1
Q2
Q3
Q4
Q1
Q2
Q3
Q4
Q1
Q2
Q3
Q4
Q1
Q2
Q3
Q4
Q1
Q2
Q3
Q4
Q1
Q2
Q3
Q4
Q1
Q2
Q3
Q4
Q1
Q2
Q3
Q4
Q1
Q2
Q3
Q4
Q1
Q2
Q3
Q4
Q1
Q2
Q3
Q4
Q1
Q2
Q3
Q4
Q1
Q1
Fee E
arn
ers
& D
irecto
rs
Gro
ss P
rofit
(£m
) as r
eport
ed
Record fee earners, record gross profitInvestment reflects confidence in growth markets
2002 2003 2004 2005 2006 2007 2008 2009 2010 2011 2012 2013 2015 2016 20172014 2018
Q1 18 Constant currency

Regional Review
Steve Ingham, Chief Executive Officer

Q1 18
Headline Numbers Financial Review Regional Review Summary
50%
18%
18%
14%
25%25%25%25%EMEA UK Asia Pacific Americas
16 countries delivered a record quarter
Gross Profit
by Geography
Q1 2018 2017 Reported % Constant %
EMEA 94.7 78.6 +20.4% +18.2%
UK 33.8 36.4 -7.1% -7.1%
Asia Pacific 32.9 30.8 +6.7% +13.8%
Americas 26.3 24.4 +8.4% +20.4%
Group Total 187.7 170.2 +10.3% +12.3%
23 countries achieved YoY growth of over 10%
10
• A record quarter for our Large, High Potential markets +21%
• Americas fastest growing region, record quarters in North America and Latin
America

Q1 18
Headline Numbers Financial Review Regional Review Summary
France33%
S. Europe22%
Germany15%
Benelux15%
Other15%
• Michael Page (55% of EMEA) +19%, Page Personnel (45% of
EMEA) +18%
• France, second largest country in the Group +18%
• Germany +28%, Michael Page Interim +31%
• Southern Europe +15%, all countries achieved record quarters
despite challenging conditions in Catalonia
• Investment of 82 fee earners in response to continued favourable
trading conditions
11
50% of Group
Gross Profit
by Geography
EMEA saw strong market conditionsGross profit records in France, Germany and 6 other countries
£m 2018 2017 Reported % Constant %
Gross Profit 94.7 78.6 +20.4% +18.2%
Headcount 3,105 2,996 +3.6%

Q1 18
Headline Numbers Financial Review Regional Review Summary
London35%
North24%
South23%
Midlands18%
• Brexit continued to weigh on market sentiment
• Timing of Easter impacted results for the quarter
• Page Personnel +2%
• Strong performances from Legal +25% and Technology +28%
18% of Group
Gross Profit
by Geography
United Kingdom remained challengingAlthough positive growth in Page Personnel
£m 2018 2017 Reported %
Gross Profit 33.8 36.4 -7.1%
Headcount 1,409 1,407 +0.1%
12

Q1 18
Headline Numbers Financial Review Regional Review Summary
Greater China41%
Australasia27%
SE Asia & India20%
Japan12%
• Greater China, our third largest market and 7% of the Group,
strong growth +17%
• Japan +19%, continued focus on the domestic Nikkei market
• South-East Asia, strong performance +19% including
Singapore +19%
• Australia +6%, following fee earner investment and new office
in Canberra
18% of Group
Gross Profit
by Geography
Asia Pacific performed well6 countries achieved YoY growth of over 10%
£m 2018 2017 Reported % Constant %
Gross Profit 32.9 30.8 +6.7% +13.8%
Headcount 1,643 1,532 +7.2%
13

Q1 18
Headline Numbers Financial Review Regional Review Summary
USA50%
Brazil13%
Mexico13%
Canada5%
Rest of Latam19%
• US growth +17%, driven by Property & Construction
• Strong growth in regional offices +24%
• Latam +26%, including another quarter of double-digit growth
in Brazil +12%
• Elsewhere, record quarters for all countries including Mexico
+26%
14
14% of Group
Gross Profit
by Geography
Americas was our fastest growing regionRecord quarter for the region
£m 2018 2017 Reported % Constant %
Gross Profit 26.3 24.4 +8.4% +20.4%
Headcount 1,154 1,094 +5.5%

Summary

Q1 18
Headline Numbers Financial Review Regional Review Summary
Strong net cash position of c. £91m
Record Group headcount and fee earners
Continental Europe remains strong
Continue to invest in Large, High Potential markets
Gross Profit +12.3% in constant currency
Record quarter for the Group
16
A record Gross Profit performanceContinue to invest in Large, High Potential markets

Q1 18
Headline Numbers Financial Review Regional Review Summary
17
Page Vision and
strategy
ValueBreadth of
management
Digital
transformation
Workplace trends
Our views on RPO
From Vision to
Value
Non operational
transformation
Investor Afternoon – 15 May 2018

Appendix

Q1 18
Headline Numbers Financial Review Regional Review Summary
19
Delivering on our global diversification strategy
A growing international business
61%
39%
76%
24%
82%
18%
FY 2007 FY 2013 Q1 2018
Gross Profit
InternationalUK

Q1 18
Headline Numbers Financial Review Regional Review Summary
20
70% 69%
87% 89%
30% 31%
13% 11%
EMEA UK Asia Pacific Americas
Temp Perm
84%
59%
16%
41%
Michael Page Page Personnel
Geography Brands
Significant variations in recruitment mix

Q1 18
Headline Numbers Financial Review Regional Review Summary
1,174
1,657 1,657 1,466 1,444
1,708 2,075
2,763
3,837 3,654
2,515
3,273
3,797 3,624
3,810
4,278 4,484
4,711
5,497 5,680
-
1,000
2,000
3,000
4,000
5,000
6,000
1990-99 2000 2001 2002 2003 2004 2005 2006 2007 2008 2009 2010 2011 2012 2013 2014 2015 2016 2017 2018
Fe
e E
arn
er
He
ad
co
un
t
AMERICAS
ASIA
PACIFIC
EMEA
21
1985-1990 1990-19992000 2001 2002 2003 2004 2005 2006 2007 2008 2009 2010 2011 2012 2013 2014 2015 2016 2017
Portugal
(2000)
Switzerland
(2001)
Belgium
(2002)
Sweden
(2002)
Poland S Africa
Ireland
UAE
Austria
Turkey
Luxembourg
Morocco
ThailandIndonesiaTaiwanIndia
Malaysia
New
Zealand
Japan
(2001)
China
(2003)
Australia
(1985)
USA (1998) Brazil (2000) Canada Mexico Chile Colombia Peru
INT
ER
NA
TIO
NA
L G
RO
WT
H
France
(1986)
Netherlands
(1987)
Germany
(1993)
Spain
(1997)
Italy
(1997)
Hong Kong
(1995)
Singapore
(1996)
2,429
1,316
981
954
Argentina
UKASIA
PACIFICEMEA AMERICAS
Notable fee earner and international growth
Q1 18

Q1 18
Headline Numbers Financial Review Regional Review Summary
22
0
1000
2000
3000
4000
5000
6000
H1 H2 H1 H2 H1 H2 H1 H2 H1 H2 H1 H2 H1 H2 H1 H2 H1 H2 H1 H2 H1 H2 H1 H2 H1 H2 H1 H2 H1 H2
He
ad
co
un
t
Fee Earner Support Staff
2003 2004 2005 2006 2007 2008 2009 2010 2011 2012 2013 2014 2015 2016 2017
Fee earner investment and support staff

Q1 18
Headline Numbers Financial Review Regional Review Summary
23
2016 2017 2018
Q1 Q2 Q3 Q4 Q1 Q2 Q3 Q4 Q1
EMEA +10.3% +13.6% +10.4% +12.4% +14.8% +13.2% +12.6% +19.3% +18.2%
UK +0.0% -2.3% -4.7% -6.7% -0.1% -4.5% -7.6% -2.8% -7.1%
Asia Pacific -2.0% -3.3% -4.7% +1.7% +3.9% +6.8% +13.9% +14.9% +13.8%
– Asia -1.5% -6.9% -7.9% -0.5% +3.6% +10.2% +21.9% +20.8% +17.8%
– Australasia -3.0% +6.6% +3.9% +8.1% +4.7% -1.5% -4.4% +0.7% +4.3%
Americas -0.6% -1.1% -2.0% +0.9% +15.2% +13.8% +18.4% +18.8% +20.4%
– North America +9.2% -1.9% -10.8% -8.4% +12.5% +14.6% +26.5% +18.7% +16.4%
– Latin America -9.8% -0.1% +9.6% +14.3% +19.2% +12.8% +9.1% +19.0% +25.7%
Group Total +3.6% +3.7% +1.3% +3.8% +9.1% +7.7% +8.8% +13.8% +12.3%
Year-on-Year Gross Profit Rates

Q1 18
Headline Numbers Financial Review Regional Review Summary
24
Contacts
Jeremy Tatham – Group Financial Controller
Tel: +44 (0) 1932 264 143
Email: [email protected]
Web: http://www.page.com/investors
Date Event
15 May 2018 Investor Afternoon
11 July 2018 Q2 2018 Trading Update
8 August 2018 HY 2018 Results
10 October 2018 Q3 2018 Trading Update
Contacts and Calendar

Q1 18
Headline Numbers Financial Review Regional Review Summary
25
This presentation contains certain statements that are neither reported financial results nor other historical information.
The information contained in this presentation is not audited, is for personal use and informational purposes only and is
not intended for distribution to, or use by, any person or entity in any jurisdiction in any country where such distribution or
use would be contrary to law or regulation, or which would subject any member of the PageGroup plc group of companies
to any registration requirement. No representation or warranty, express or implied, is or will be made in relation to the
accuracy, fairness or completeness of the information or opinions made in this presentation.
Certain statements included or incorporated by reference within this presentation may constitute “forward-looking
statements” that are based on current expectations or beliefs, as well as assumptions about future events. There are risk
factors that can cause actual results to differ materially from those expressed in or implied by such statements.
Accordingly, no assurance can be given that any particular expectation will be met and reliance should not be placed on
any forward-looking statement.
PageGroup plc disclaims any intention or obligation to revise or update any forward-looking statements that may be made
in this presentation, regardless of whether those statements are affected as a result of new information, future events or
otherwise. Nothing in this presentation should be construed as a profit forecast.
This presentation does not constitute or form part of any offer or invitation to sell, or any solicitation of any offer to
purchase any shares in PageGroup plc, nor shall it or any part of it or the fact of its distribution form the basis of, or be
relied on in connection with, any contract or commitment or investment decision relating thereto, nor does it constitute a
recommendation regarding the shares of PageGroup plc. Past performance cannot be relied upon as a guide to future
performance. Liability arising from anything in this presentation shall be governed by English Law. Nothing in this
presentation shall exclude any liability under applicable laws that cannot be excluded in accordance with such laws.
Disclaimer