Embed Size (px)
Citation preview
Steve R. Meyer, Ph.D.Vice-President, Pork AnalysisEMI Analytics
2015 Pork Management Conference
Pork Industry Economic Outlook
The gospel according to Yogi . . .
“It’s tough to make predictions, especially about the future.”

Key factors for 2015 and beyond PEDv – or lack of it in U.S. hog herd HPAI in U.S. poultry – HUGE hit on
layers/eggs, only meat impact is turkey, chicken is okay -- so far – but represents the largest risk
Beef herd rebuilding is under way and likely accelerating – limiting current supplies
Fewer corn acres, more soybean acres – but the issue is weather and it is a mixed bag so far
U.S. consumer demand has been GREAT – will it hold?
The U.S. dollar
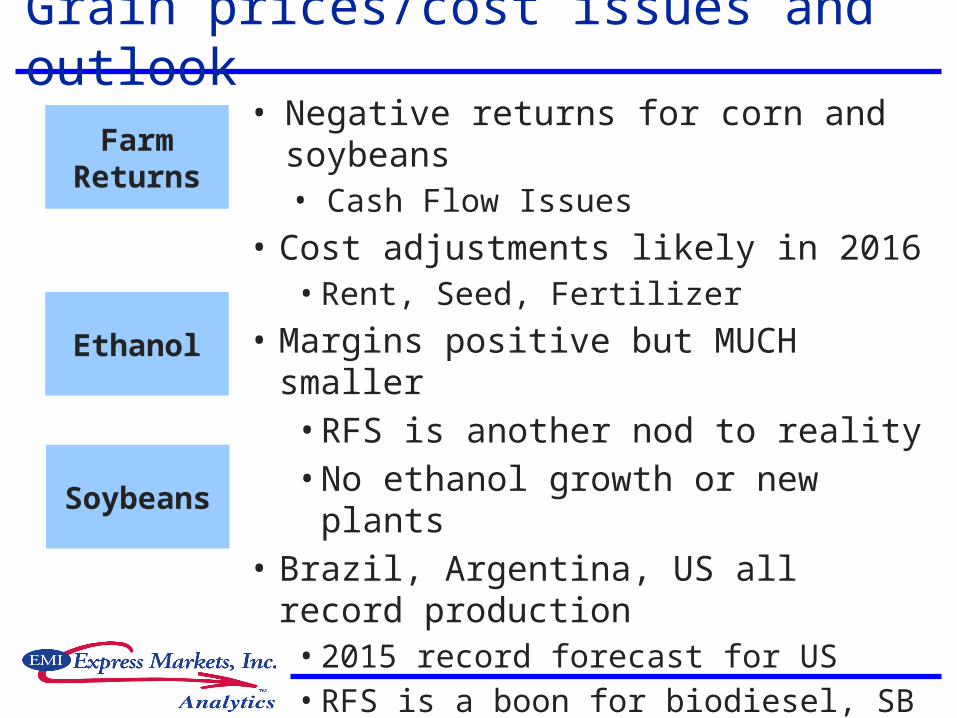
Grain prices/cost issues and outlook• Negative returns for corn and soybeans
• Cash Flow Issues
• Cost adjustments likely in 2016• Rent, Seed, Fertilizer
• Margins positive but MUCH smaller • RFS is another nod to reality• No ethanol growth or new plants
• Brazil, Argentina, US all record production• 2015 record forecast for US• RFS is a boon for biodiesel, SB oil• Lower meal prices assuming normal
weather
Farm Returns
Ethanol
Soybeans

CBOT Corn Futures
1.50
2.50
3.50
4.50
5.50
6.50
7.50
8.50
2006 2007 2008 2009 2010 2011 2012 2013 2014 2015 2016
Do
llars
per
Bu
shel
nearby futures, roll on first of month
May 2015 forward forecast
We expect Corn futures $3.50-$3.70
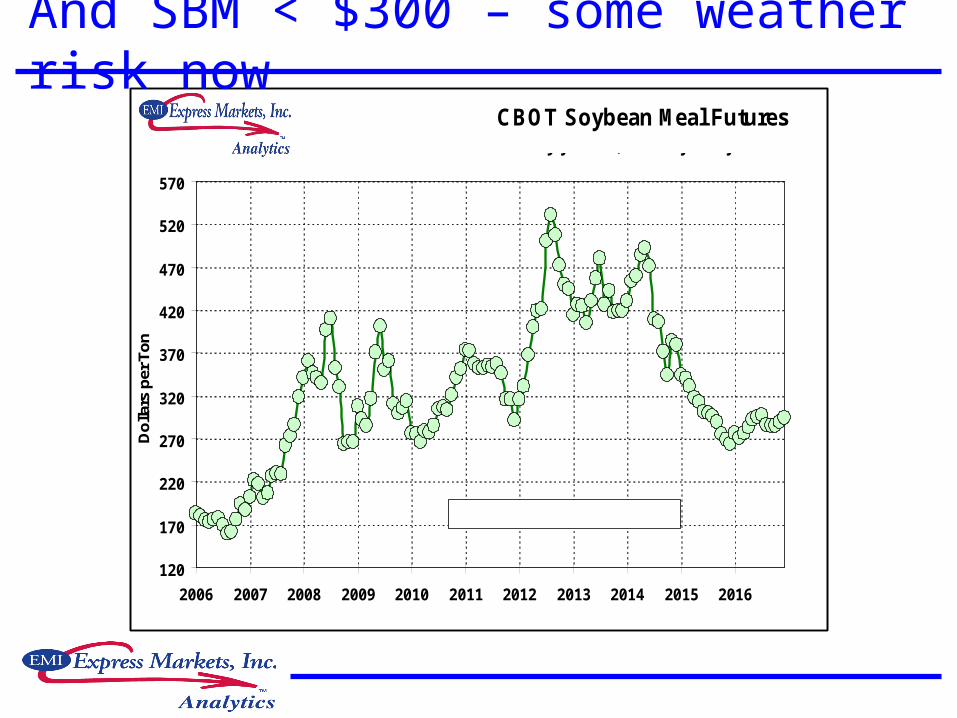
CBOT Soybean Meal Futures
120
170
220
270
320
370
420
470
520
570
2006 2007 2008 2009 2010 2011 2012 2013 2014 2015 2016
Do
llars
per
To
nnearby futures, roll on first of month
May 2015 forward forecast
And SBM < $300 – some weather risk now

‘15 costs continue to fall; ‘16 under $70/cwt
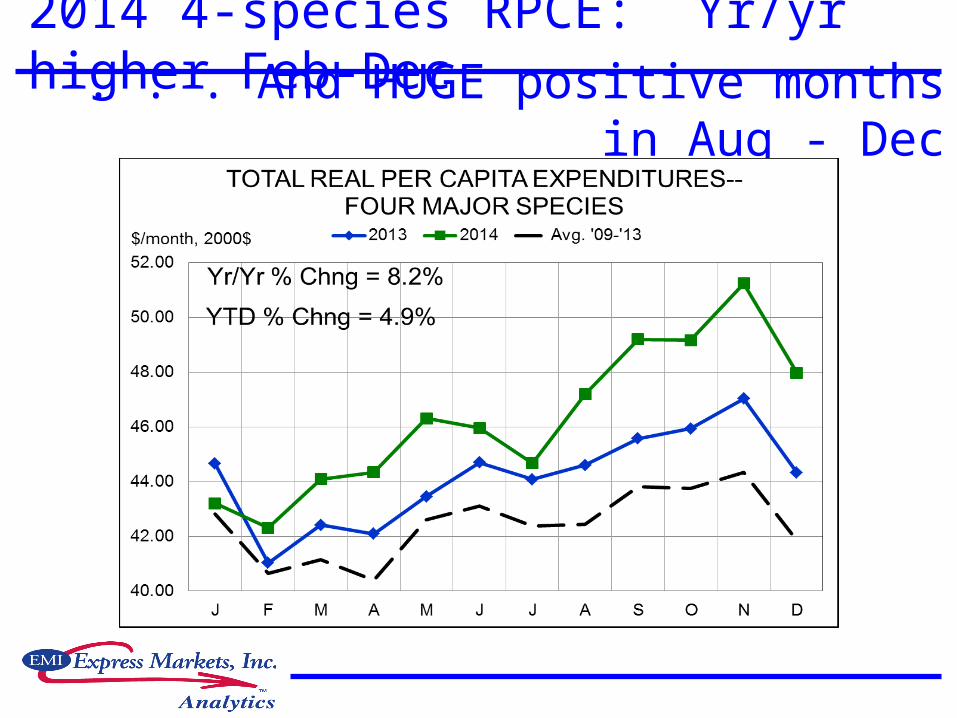
2014 4-species RPCE: Yr/yr higher Feb-Dec . . . And HUGE positive months in Aug
- Dec

All species have gained, pork slowed in April
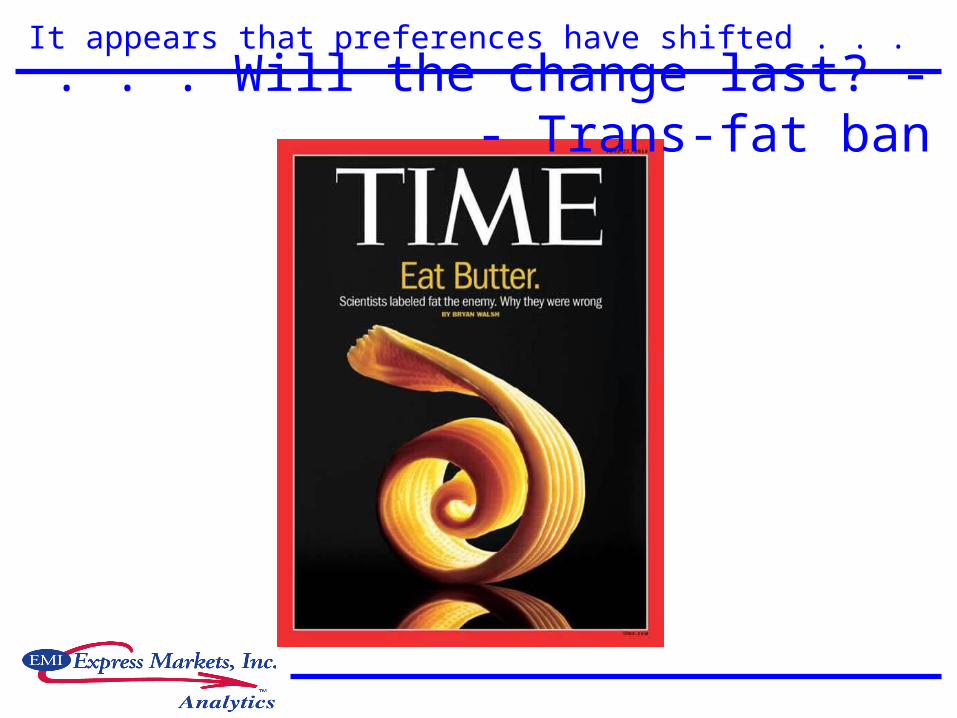
It appears that preferences have shifted . . .. . . Will the change last? - - Trans-
fat ban

Protein demand has been growing since ‘10
4-species RPCE - +5% vs. ‘14/‘13,- +9% vs. ‘14/‘12
Drivers:- Growing concern
about carbs- Fading fat phobia - New appreciation
for “good” from fats – Big Fat Surprise
- Better view of medical and dietician communities
. . .January’s $67.38 the highest since Sept ‘90
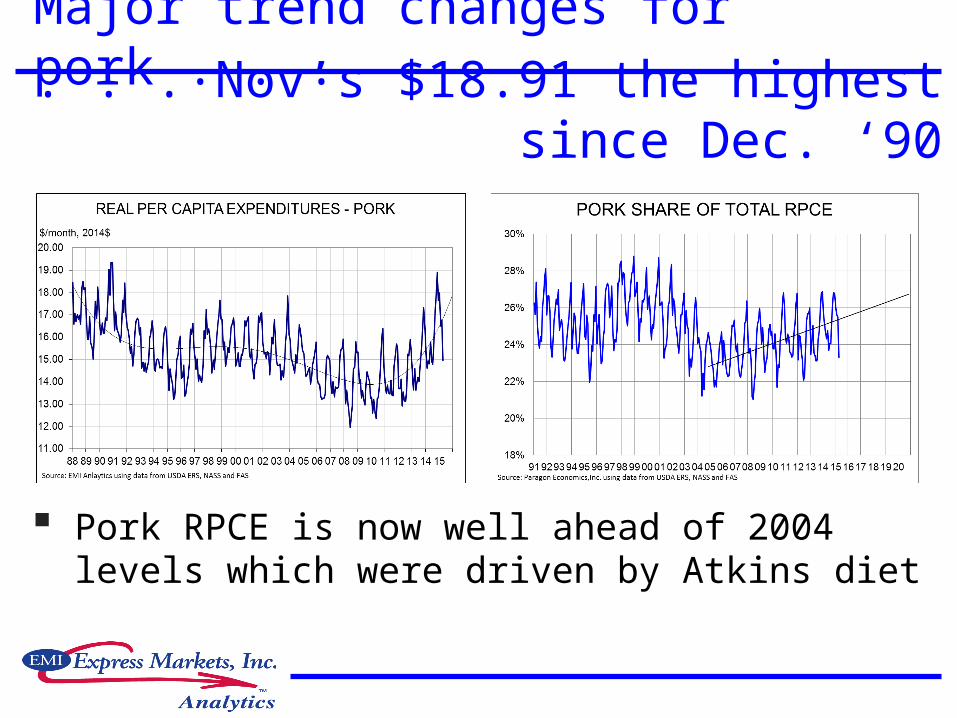
Major trend changes for pork . . .
Pork RPCE is now well ahead of 2004 levels which were driven by Atkins diet
. . . Nov’s $18.91 the highest since Dec. ‘90
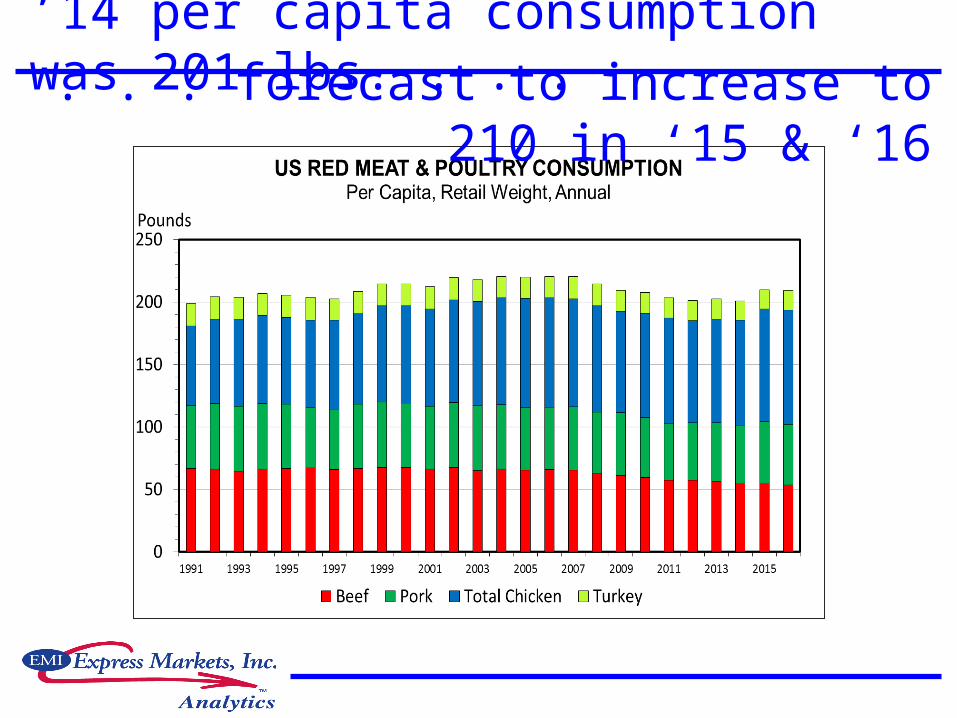
’14 per capita consumption was 201 lbs. . . .. . . forecast to increase to 210 in
‘15 & ‘16
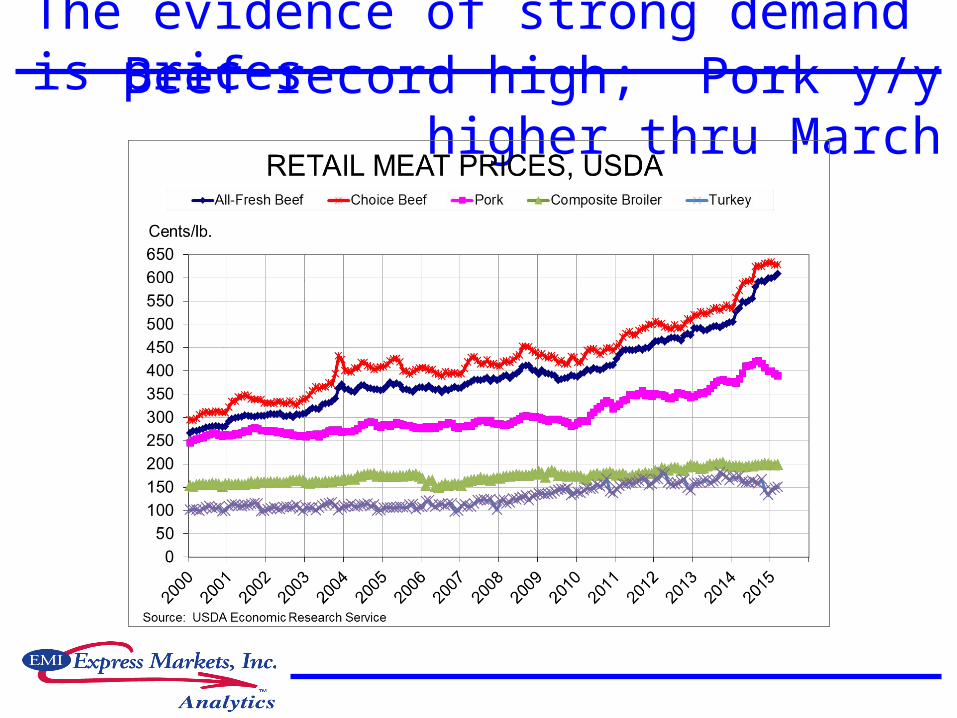
The evidence of strong demand is pricesBeef record high; Pork y/y higher
thru March

Record-large expenditures – with pork 2nd
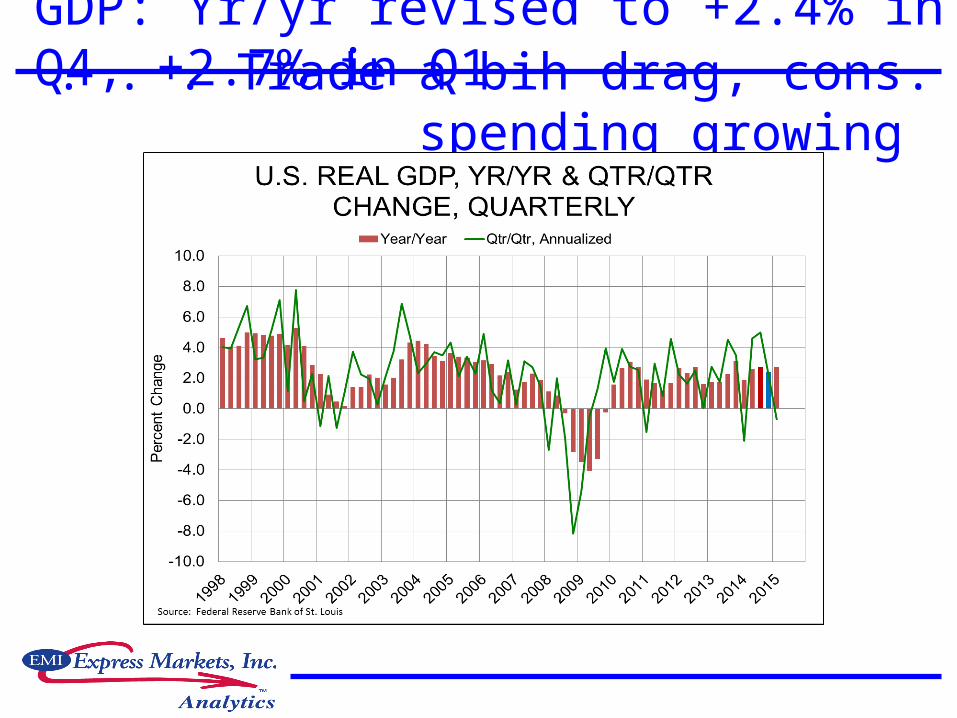
GDP: Yr/yr revised to +2.4% in Q4, +2.7% in Q1. . . Trade a bih drag, cons.
spending growing

RPDI growth was MUCH better in ’14 (+1.7%) . .Dec-Feb were all >3%, March 2.7%.
YTD is +3%
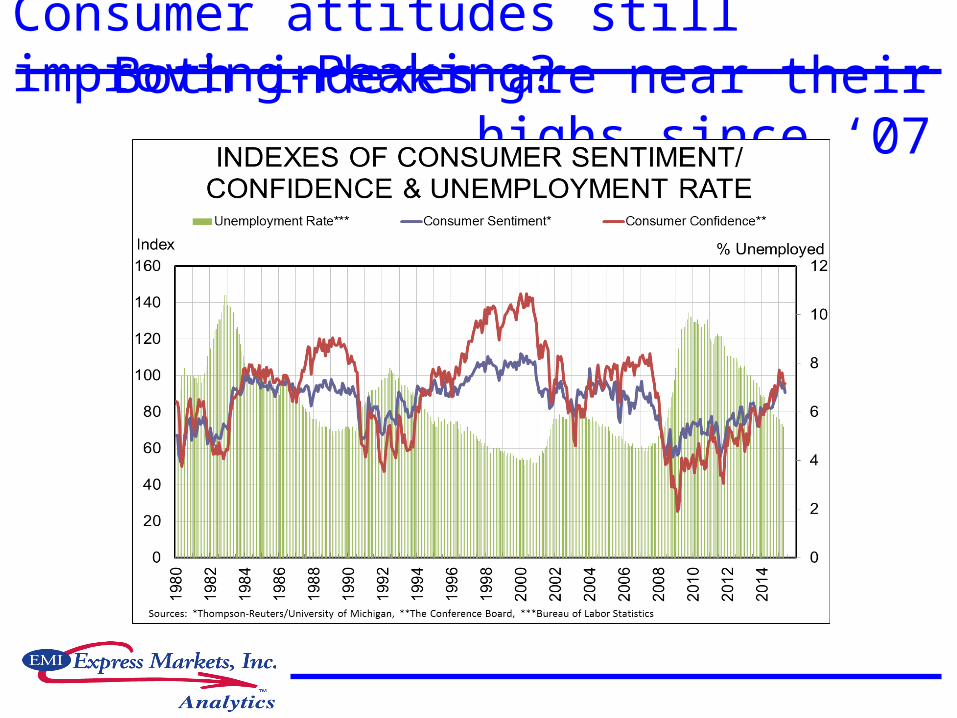
Consumer attitudes still improving-Peaking?Both indexes are near their highs
since ‘07
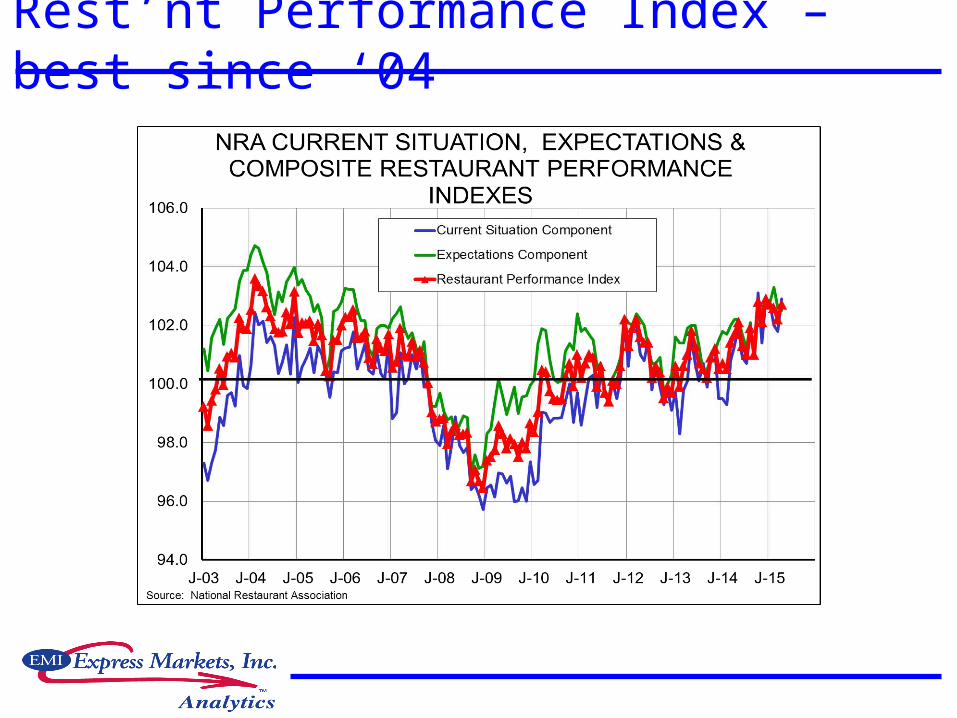
Rest’nt Performance Index – best since ‘04

And now – “cheap” oil and sub-$2 gas?Weekly crude oil futures
Monthly RBOB gasolinefutures
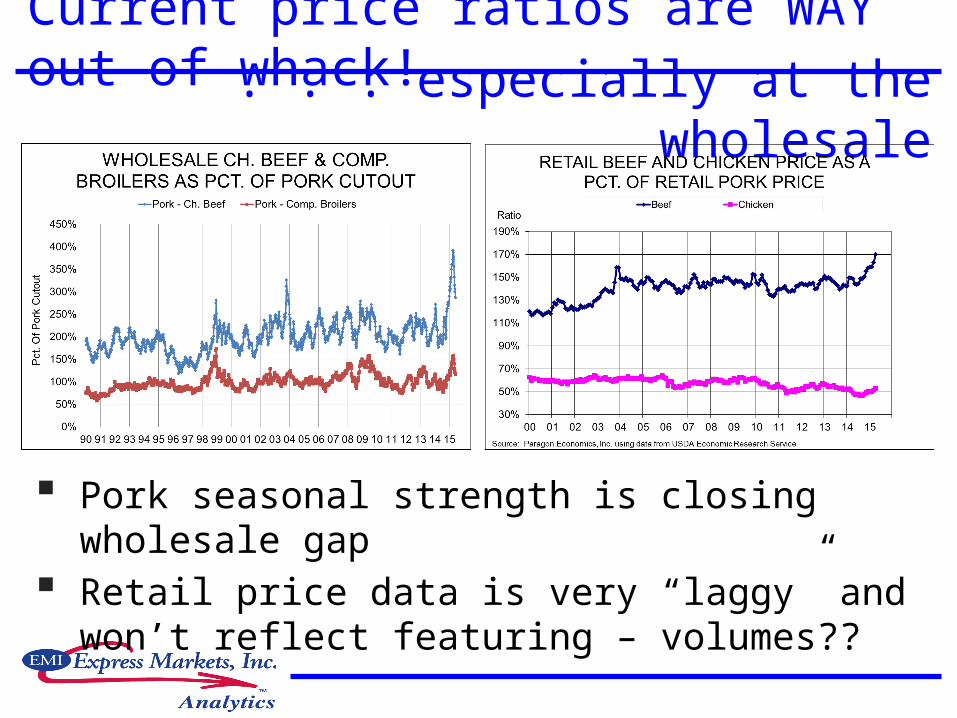
Current price ratios are WAY out of whack!
Pork seasonal strength is closing wholesale gap
Retail price data is very “laggy” and won’t reflect featuring – volumes??
. . . especially at the wholesale
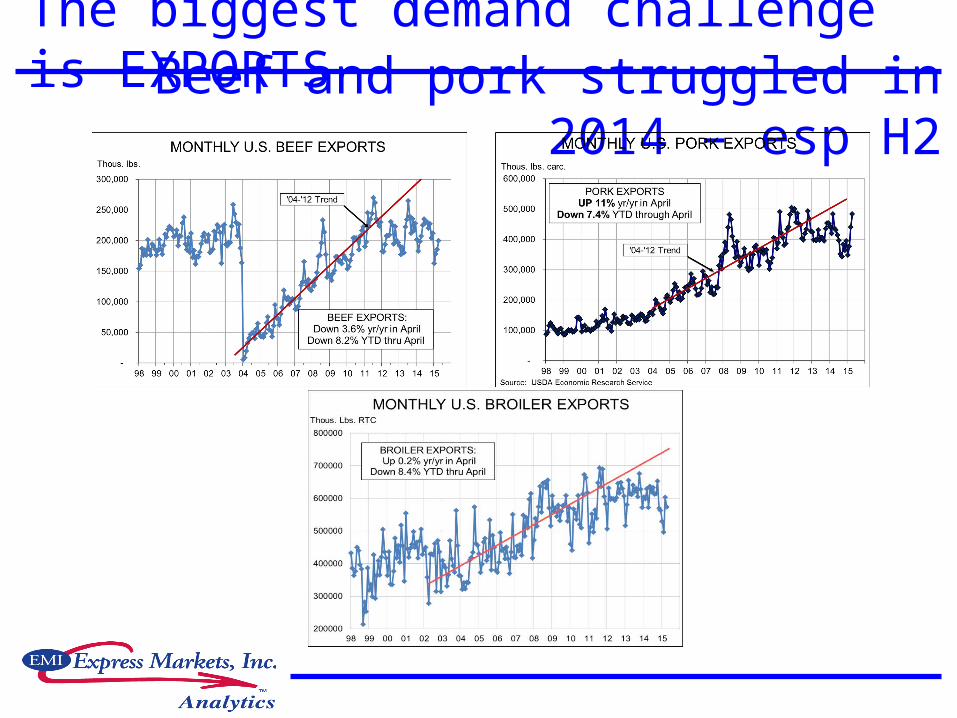
The biggest demand challenge is EXPORTSBeef and pork struggled in 2014 –
esp H2

Big issue #1: Low-hanging fruit picked! Flood of trade agreements in ‘90s – CFTA,
NAFTA, Uruguay Good number of unilateral agreements in
‘00s – CA/DR, Chile, Colombia, Australia – but running out of new partners
Potential game changer: Trans-Pacific Partnership
- Big impact will be Japan – remove gate price mechanism
- REQUIRES Trade Promotion Authority – passed but . . .
TTIP (EU) – still in doubt- I’m not optimistic about this one doing pork much
good- EU is a block of PROFESSIONAL PROTECTIONISTS

Big issue #2: West Coast port slowdown Began last July and got “serious” in Dec &
Jan Tentative agreement & back to work on
Feb. 22 New contract ratified May 22 Backlog began clearing in March but
product flow is just now returning to normal
Three issues remain: - Flood of product is now at importing
countries’ ports
- Broken relationships and trust must be
restored
- Shelf-space regained/re-earned
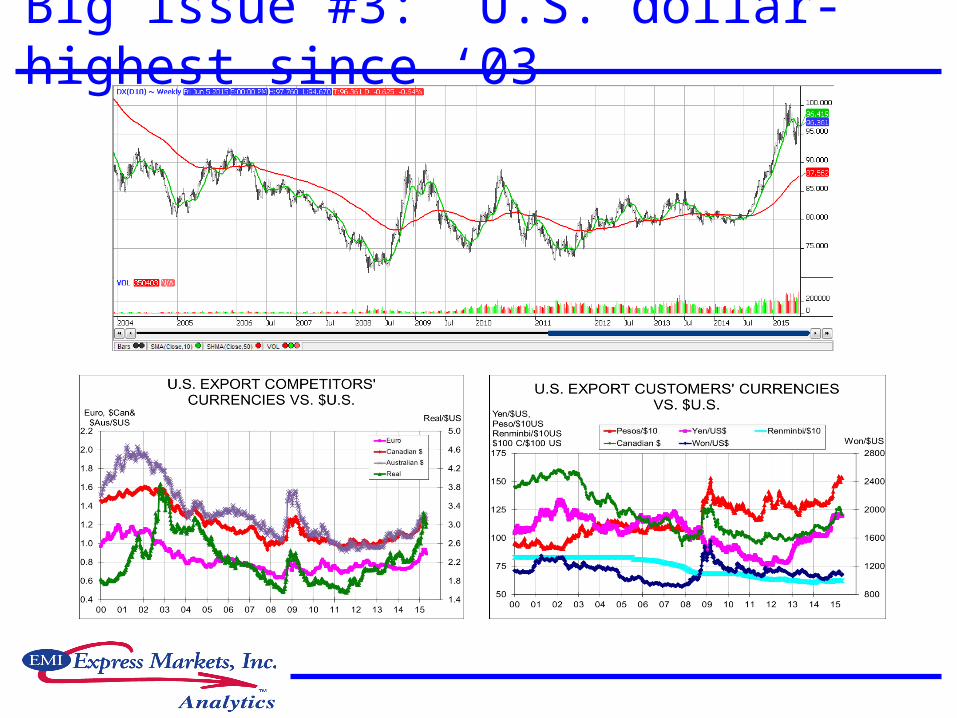
Big issue #3: U.S. dollar-highest since ‘03

Oil and $U.S. are negatively correlated
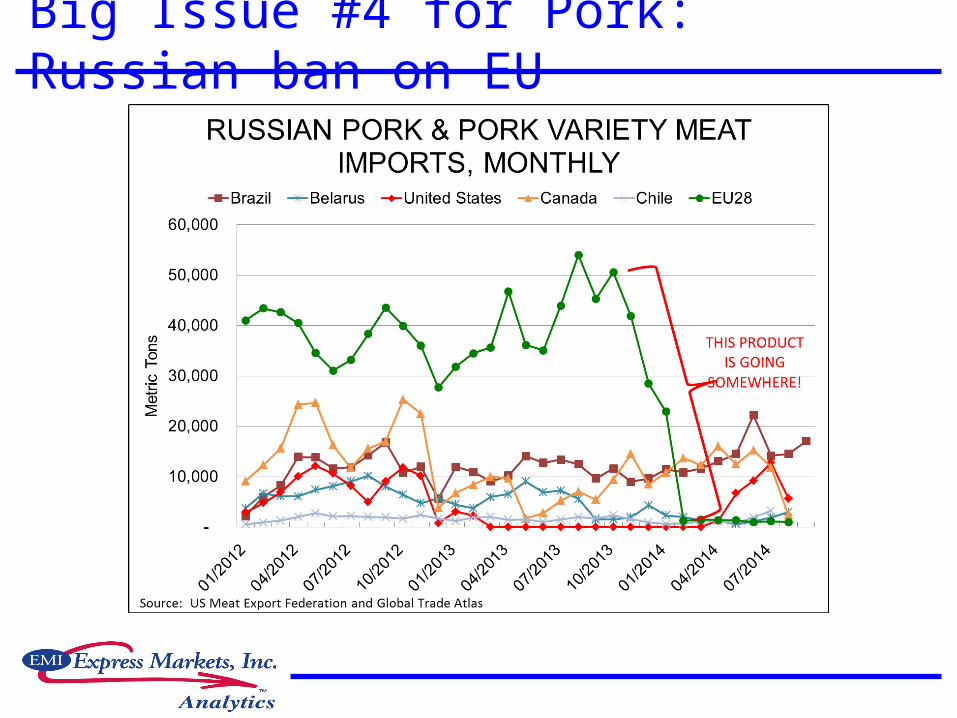
Big Issue #4 for Pork: Russian ban on EU
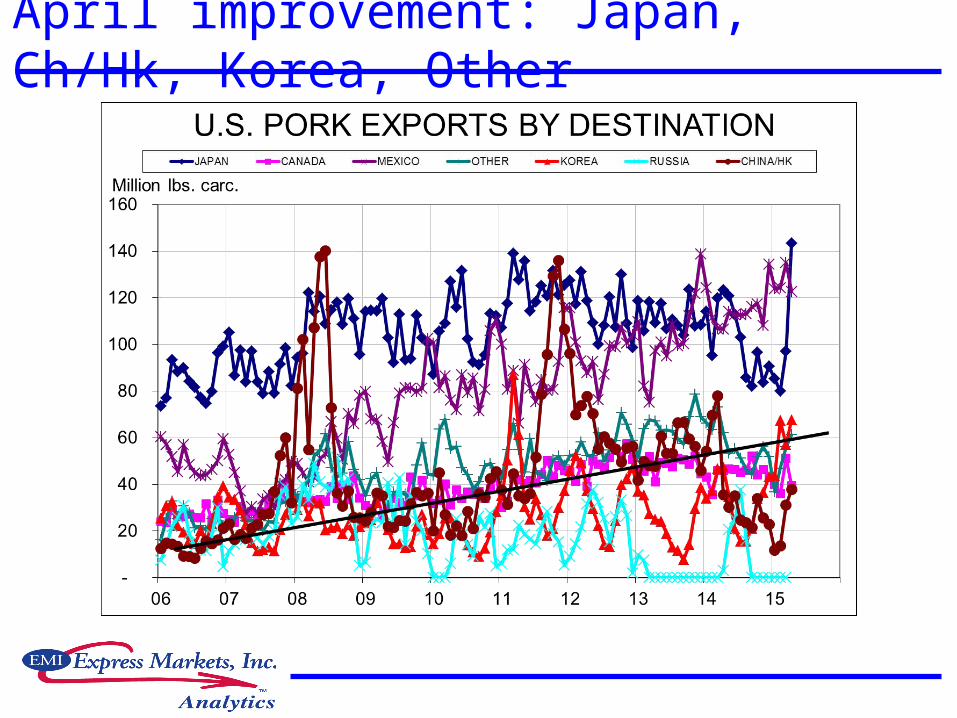
April improvement: Japan, Ch/Hk, Korea, Other

Total frozen meat/poultry 20.1% on April 30 Feb-Mar due to ports; April due to
pork, HPAI

April 30: Pork +20%, Beef +19%, Broiler +32%
Avian Influenza – through June 12 Only one new case week of June 12 - 2500
birds 47.091 million birds killed or destroyed
- 31.454 million laying hens and 5.874 million laying pullets (May 1 inventory was 295.9 million hens)
- 7.78 million turkeys – 3.3% of 2014 slaughter
The Southeast is critical- Arkansas: #3 for broiler and turkey production- Eastern TX and OK are important and not far
away!- Broiler production: GA and AL are #1 & #2, NC is
#4
VERY little actual impact on beef or pork yet What about this fall?

Locations and types of farms hit by HPAI
Source: Steiner Consulting Group

Location of turkeys – USDA NASS
Losses are subsiding
‘14 Slaughter
- MN: 19%- AR: 13%- NC: 12%- IN: 8%- MO: 7%
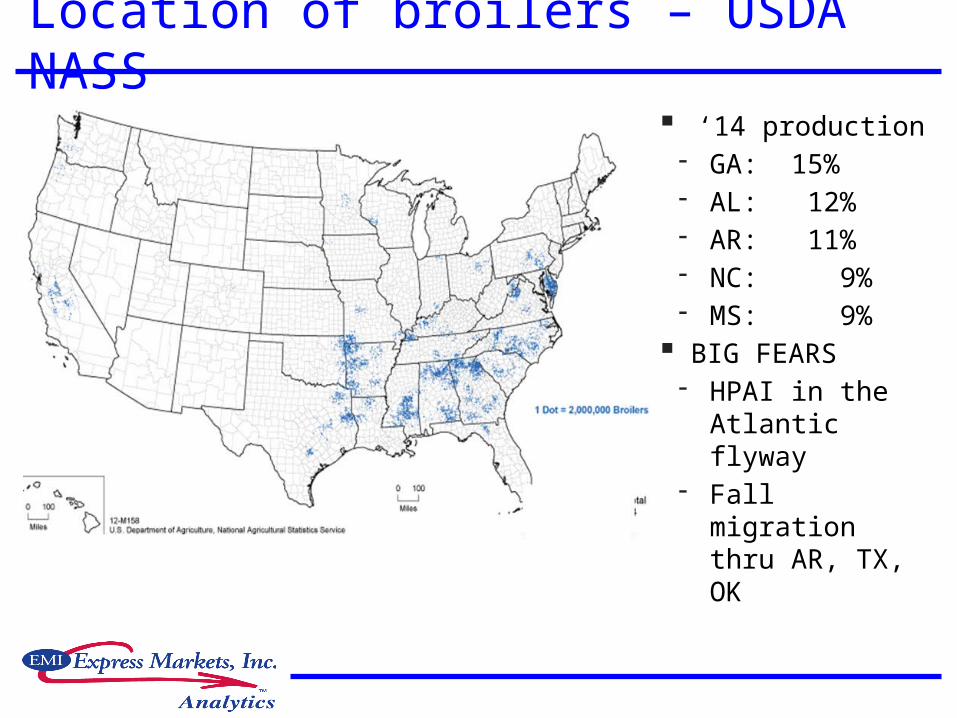
Location of broilers – USDA NASS
‘14 production- GA: 15%- AL: 12%- AR: 11%- NC: 9%- MS: 9%
BIG FEARS- HPAI in the
Atlantic flyway
- Fall migration thru AR, TX, OK
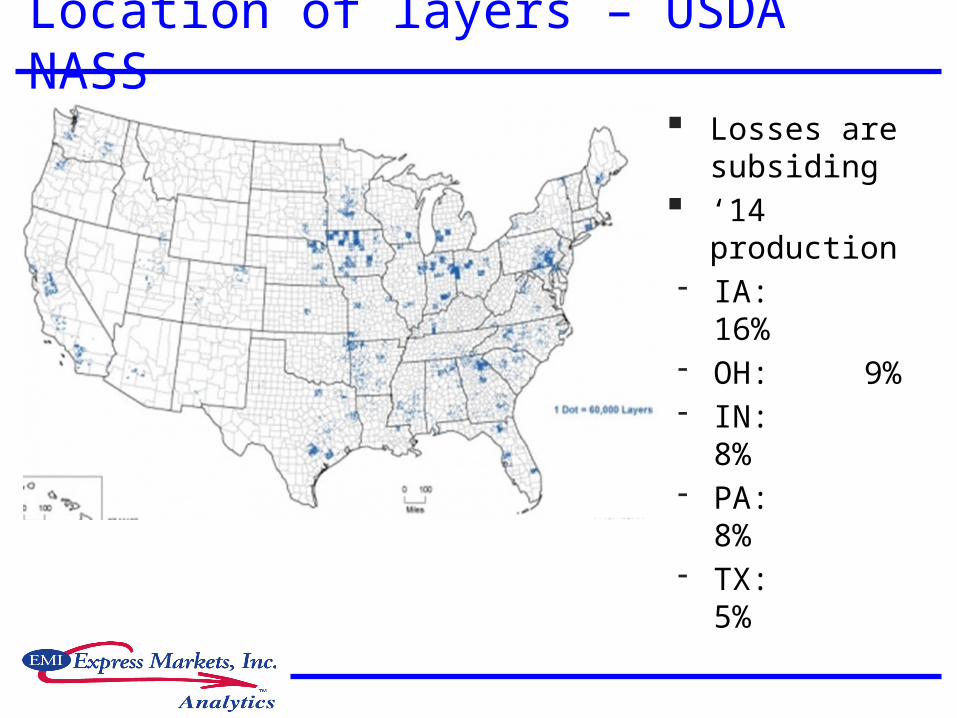
Location of layers – USDA NASS
Losses are subsiding
‘14 production
- IA: 16%- OH: 9%- IN: 8%- PA: 8%- TX: 5%
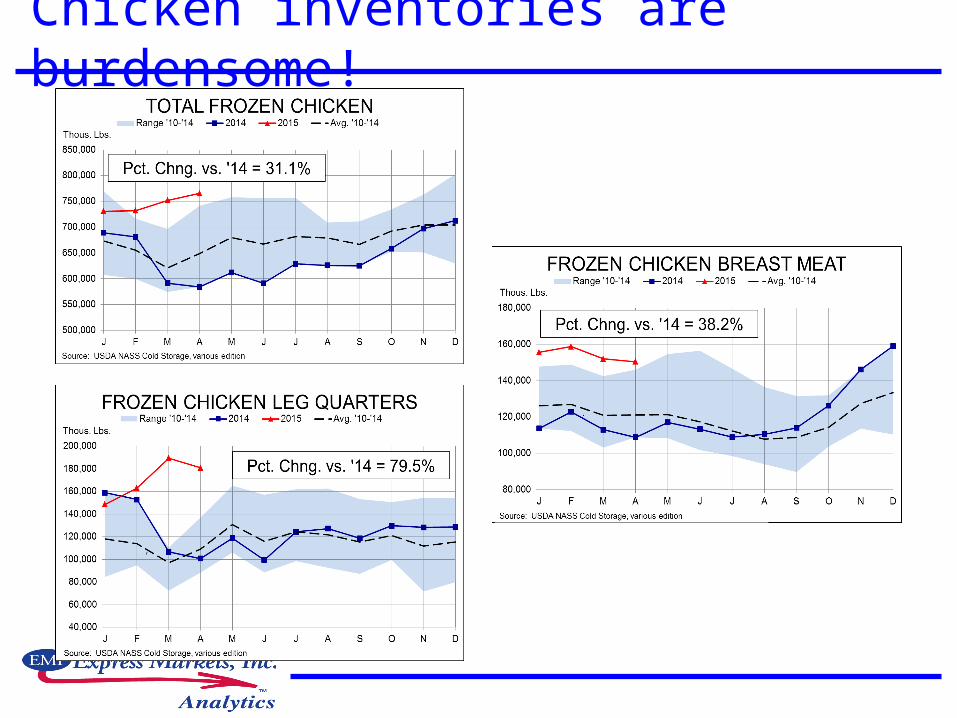
Chicken inventories are burdensome!

Broiler flock: Growth rate is increasing . . .Yr/yr: +1.5 to 2.5% July-Mar; 3% April,
3.5% May
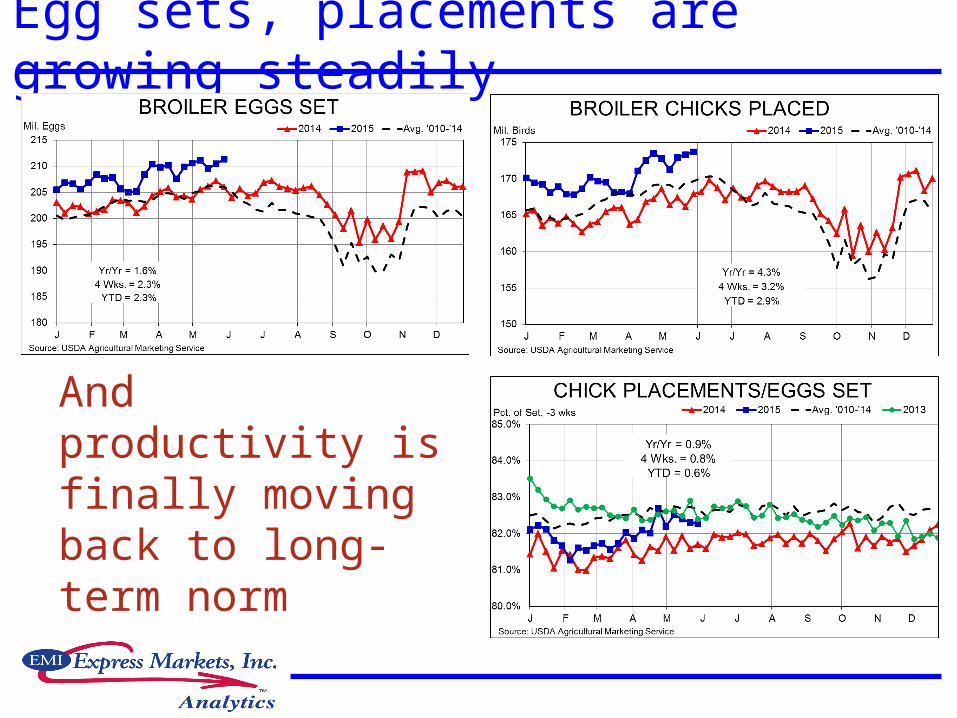
Egg sets, placements are growing steadily
And productivity is finally moving back to long-term norm

Chicken output is sharply higher YTD . . . On modest slaughter growth and
HUGE birds!
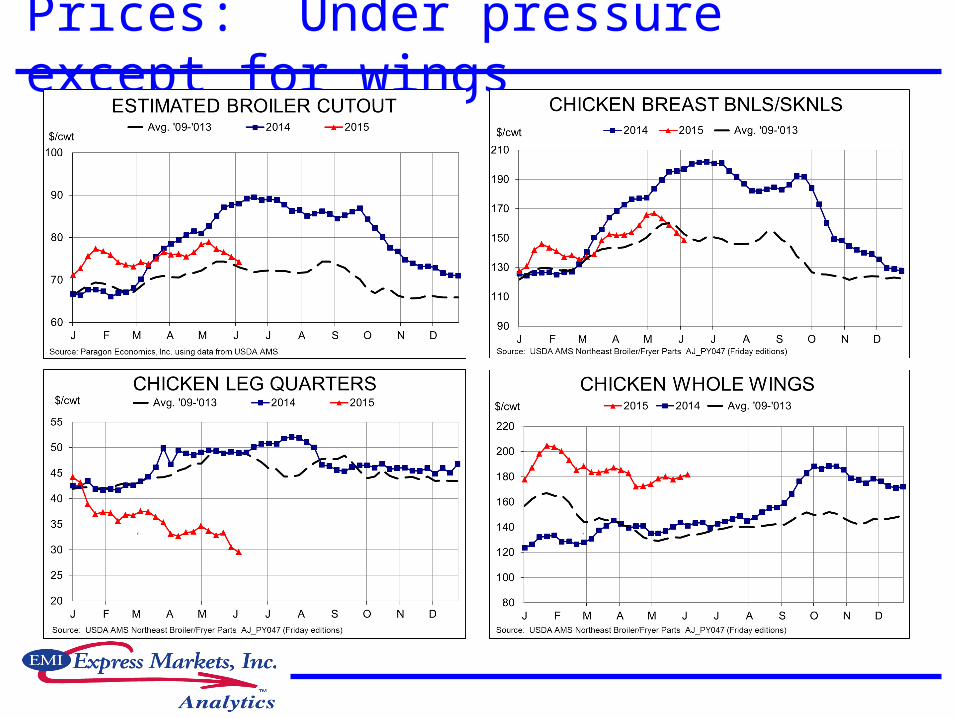
Prices: Under pressure except for wings
Expectations for chicken GROWTH – 3 to 4% and that may well be LOW!
- Companies are solving problems, big profit incentive
- BIG increase in bird weights will drive production
Chicken prices- 2.5-4.0# WOGs -- $101 to $104 rest of ’15 and 1st
half of ‘16- Med. B/S Breast -- $162-$165 thru Aug, $155 Sept,
$130-$130 rest of ’15, stronger 1st half of 2016- Whole wings -- $128 to $140 rest of ‘15, sharply
lower in ‘16 (as much as 15% lower in Q2)- Leg quarters -- $31 to $34 rest of ’15, $45-$50 1st
half of ‘16 -- THIS FORECAST MAY BE HIGH!!!
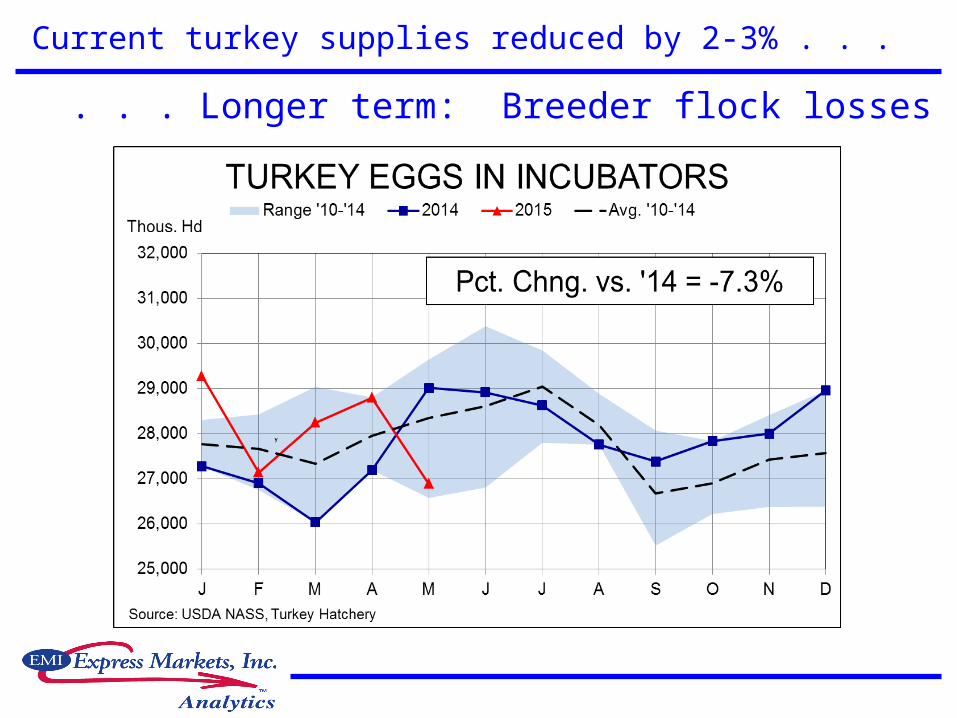
Current turkey supplies reduced by 2-3% . . .
. . . Longer term: Breeder flock losses
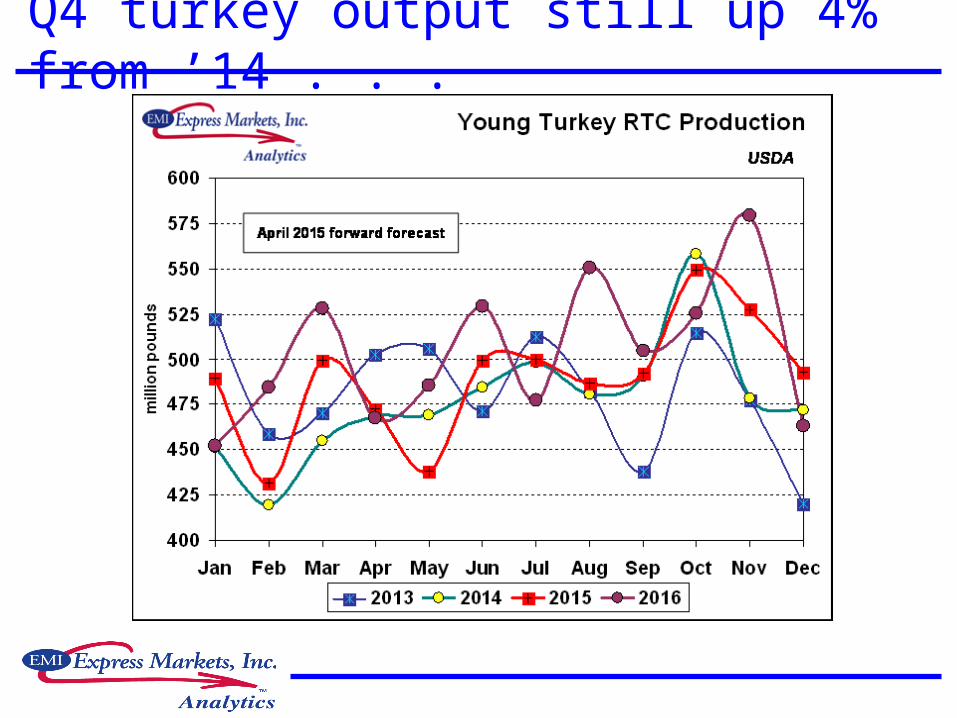
Q4 turkey output still up 4% from ’14 . . .

Turkey prices mixed due to HPAI & exports 16-24 Toms and 8-15 Hens both
$113 - $120 rest of 2015 – some topside risk
4-8 frozen breasts -- $128 - $130 Frozen thigh meat -- $130 - $142 (far
below last year’s $175) MD turkey (frozen) -- $26 to $30
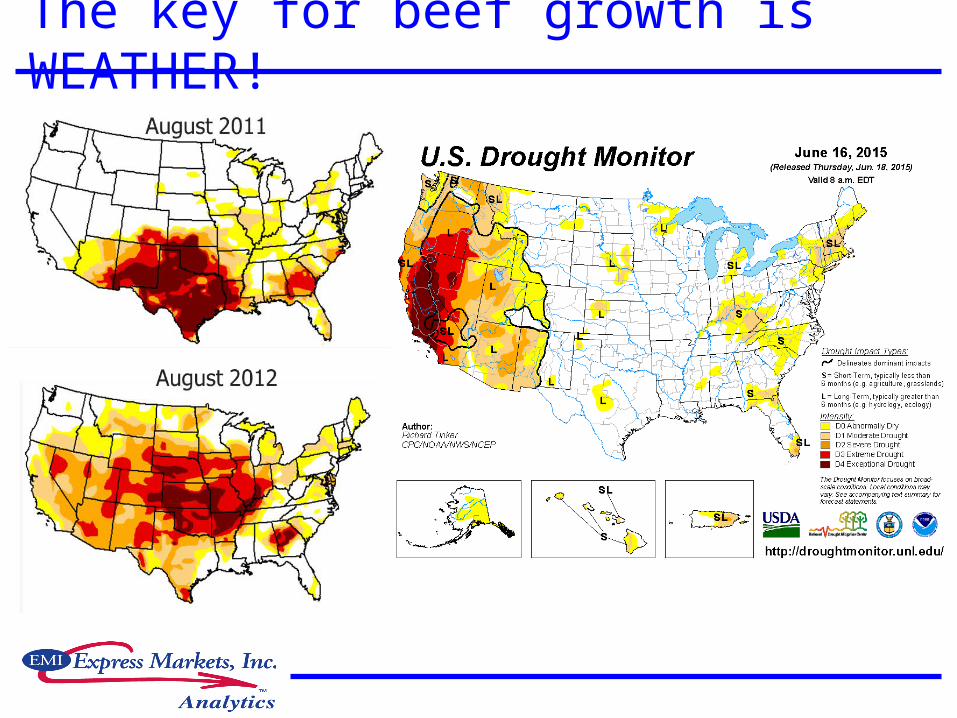
The key for beef growth is WEATHER!
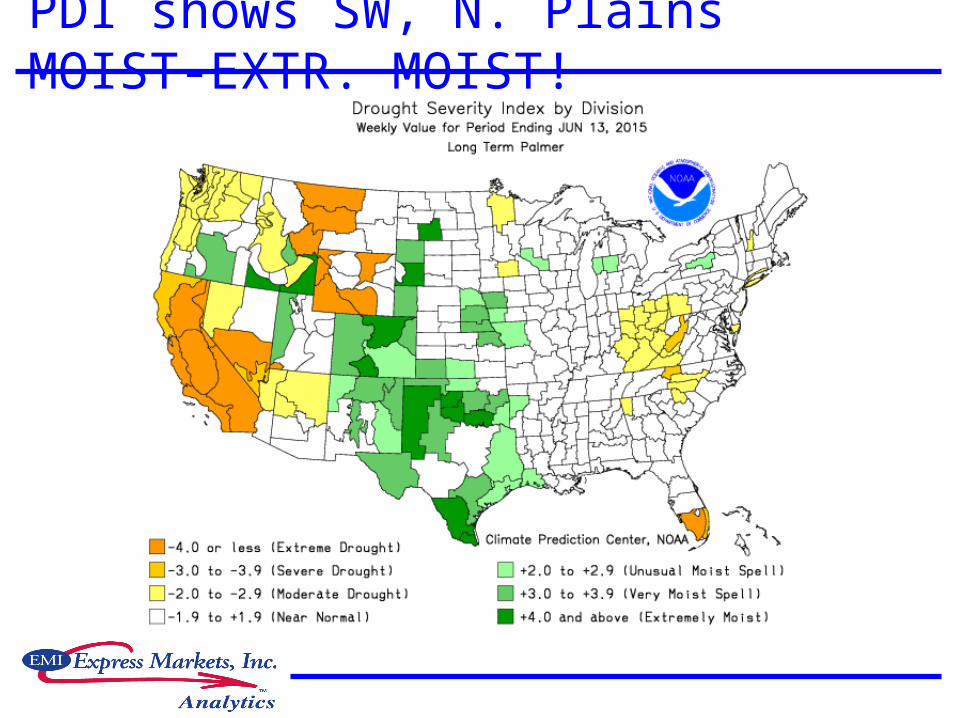
PDI shows SW, N. Plains MOIST-EXTR. MOIST!

Beef: Unprecedented cow/calf profits!
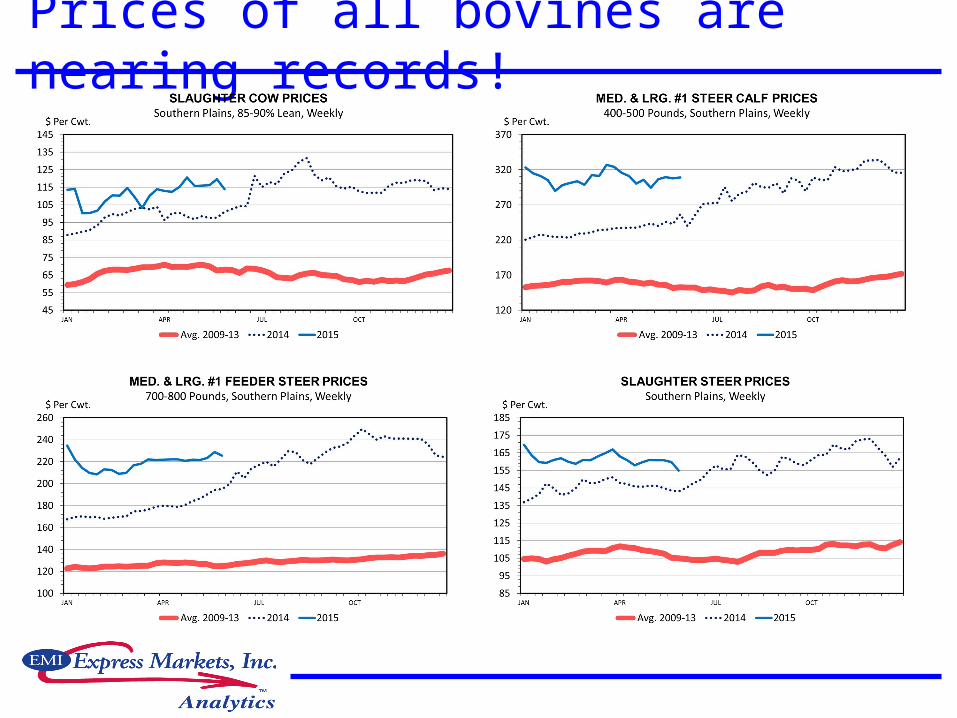
Prices of all bovines are nearing records!
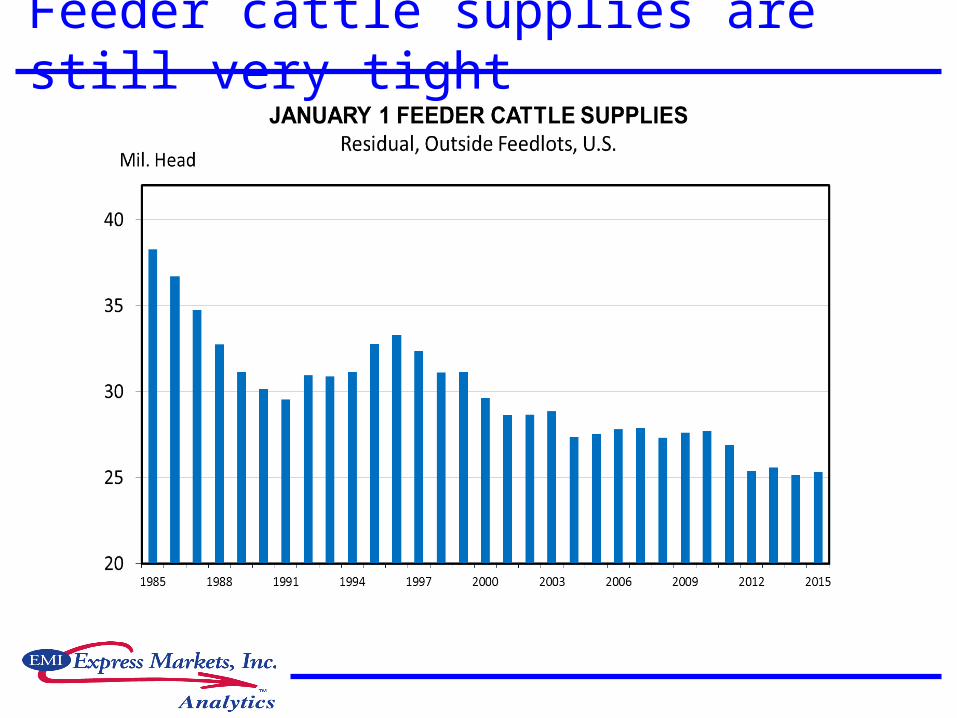
Feeder cattle supplies are still very tight
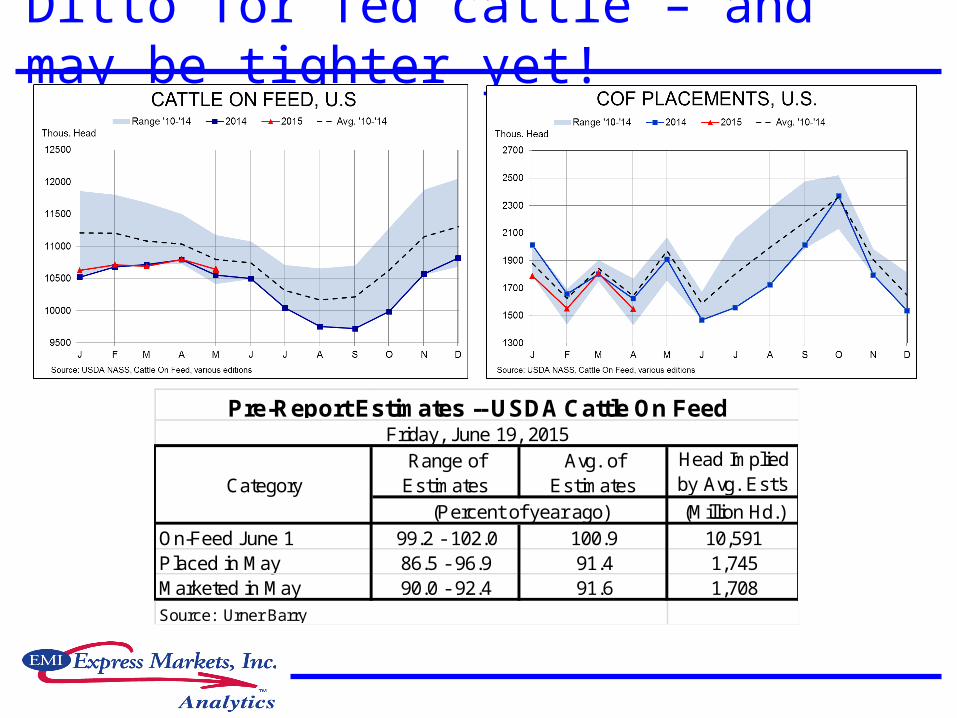
Ditto for fed cattle – and may be tighter yet!
Range of Estimates
Avg. of Estimates
Head Implied by Avg. Est's
(Million Hd.)On-Feed June 1 99.2 - 102.0 100.9 10,591Placed in May 86.5 - 96.9 91.4 1,745Marketed in May 90.0 - 92.4 91.6 1,708
Pre-Report Estimates -- USDA Cattle On FeedFriday, June 19, 2015
Category(Percent of year ago)
Source: Urner Barry
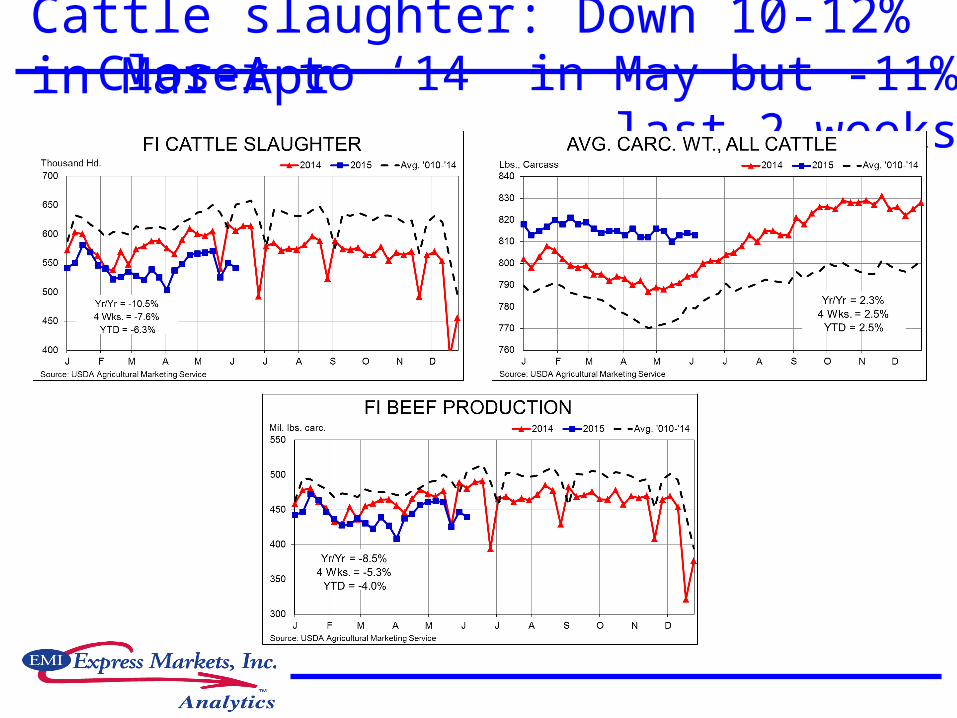
Cattle slaughter: Down 10-12% in Mar-AprCloser to ‘14 in May but -11% last 2
weeks
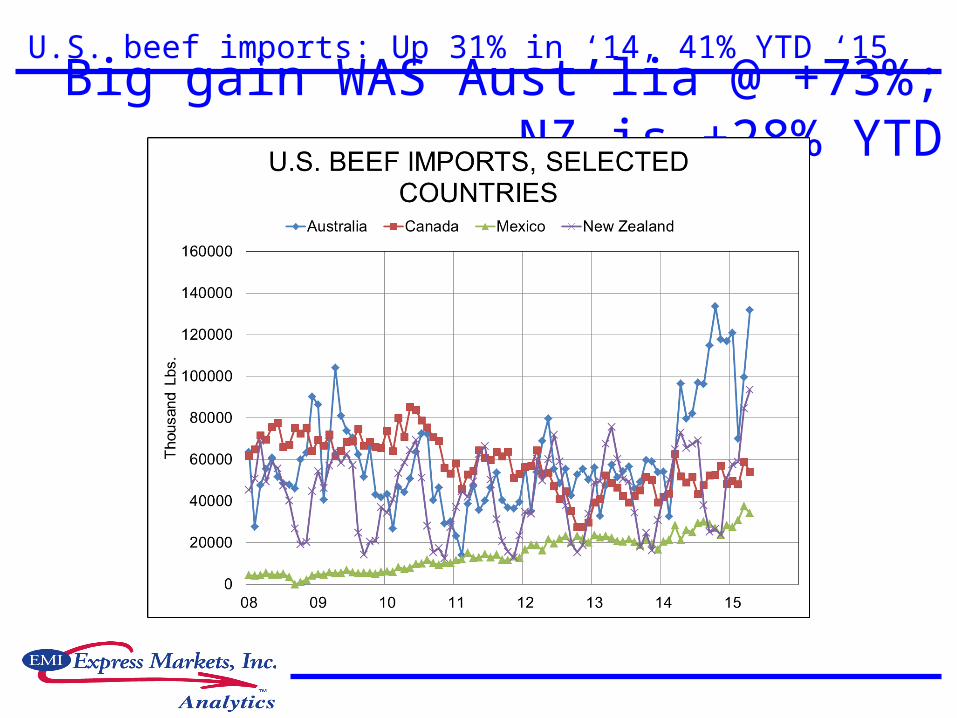
U.S. beef imports: Up 31% in ‘14, 41% YTD ‘15Big gain WAS Aust’lia @ +73%; NZ
is +28% YTD
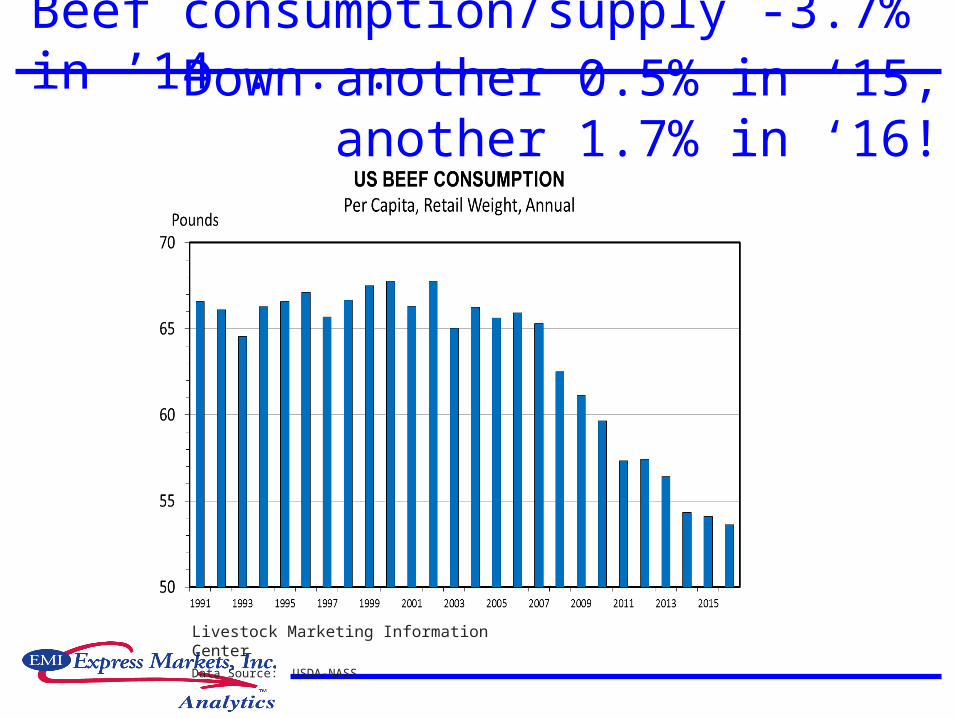
Beef consumption/supply -3.7% in ’14 . . . Down another 0.5% in ‘15, another
1.7% in ‘16!
Livestock Marketing Information CenterData Source: USDA-NASS

Female slaughter implies continuing growth. . . And -6% cow slaughter keeps grinds high!

Cutouts, cattle prices will stay near records
We expect a normal seasonal decline – now begun -- this summer on higher slaughter
Short April placements are bullish for fall prices & May placements may add to the bullishness
Choice cutout $240-$250 range this summer, challenging record highs this fall
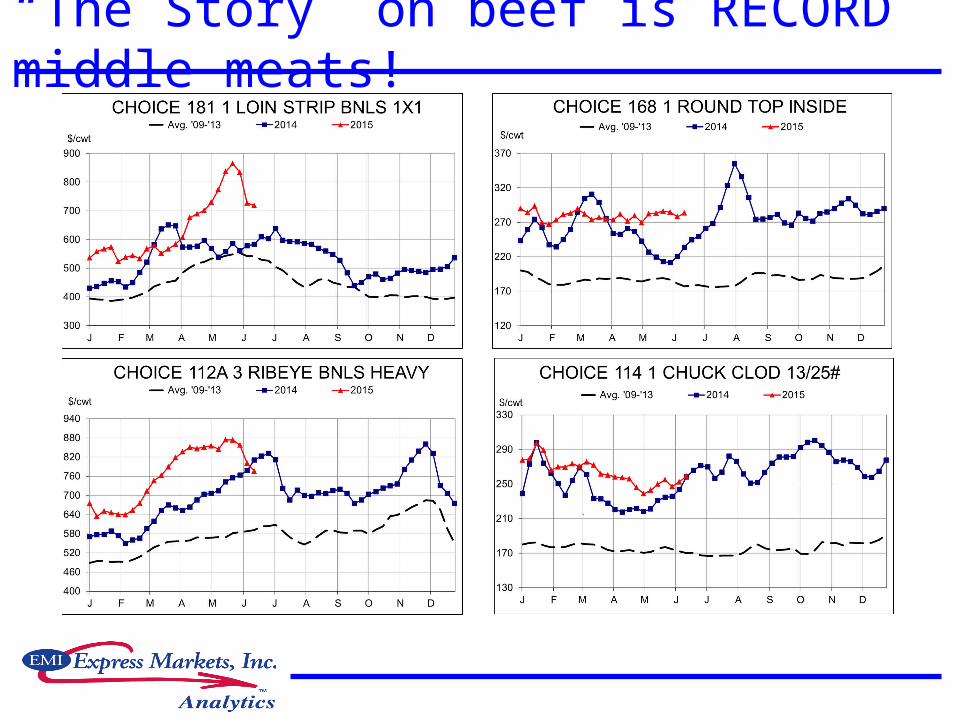
“The Story” on beef is RECORD middle meats!
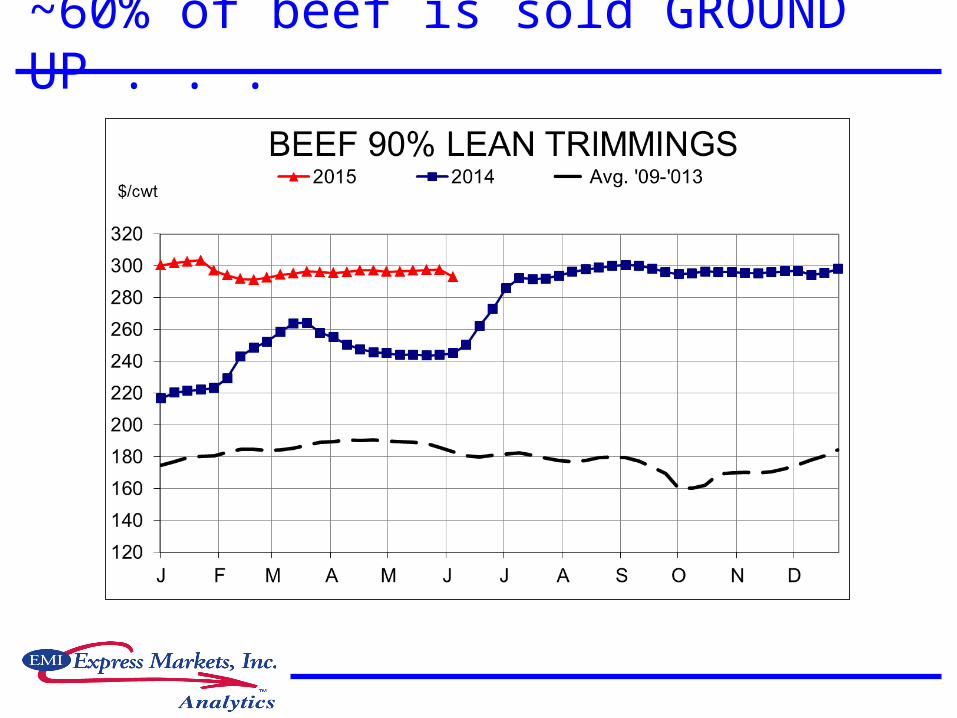
~60% of beef is sold GROUND UP . . .

Cattle and beef summary . . . Growth – but characteristically slow
- Biology, producer age, capital cost are all limiting factors
- Growth means tighter near term supply
HIGH prices through 2015 and 2016 will provide oppor-tunities for competitors
Winter futures selloff was technicals – not supported by product or cattle
Question: Long-term impacts of VERY HIGH prices on beef consumers?

Record profits in ‘14 – even with PEDv losses. . . profits most of ‘16 in spite of
selloff
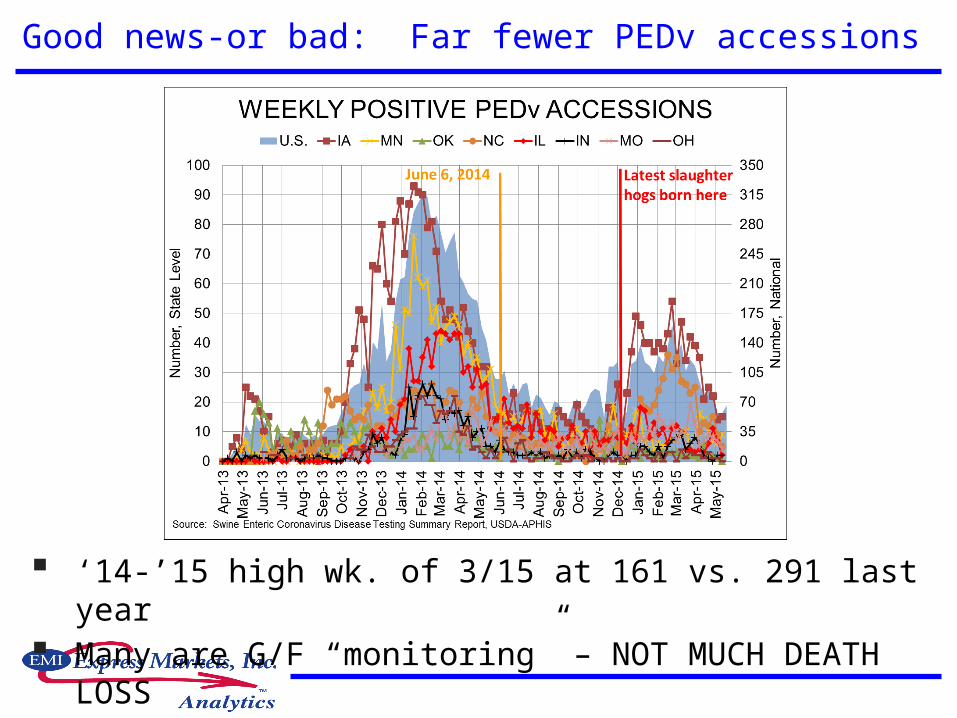
Good news-or bad: Far fewer PEDv accessions
‘14-’15 high wk. of 3/15 at 161 vs. 291 last year Many are G/F “monitoring” – NOT MUCH DEATH LOSS
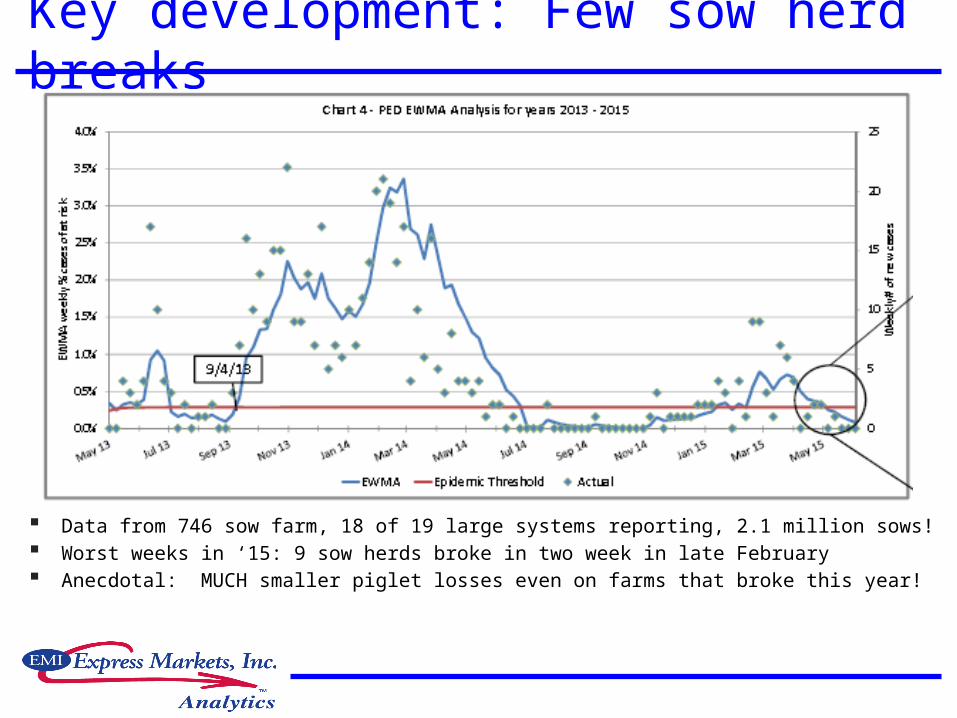
Key development: Few sow herd breaks
Data from 746 sow farm, 18 of 19 large systems reporting, 2.1 million sows! Worst weeks in ‘15: 9 sow herds broke in two week in late February Anecdotal: MUCH smaller piglet losses even on farms that broke this year!

PRRS was much quieter in ‘13-’14 – and now
U.M.’s PRRS sample does not cover N.C. where 174 strain is causing significant losses in February-April
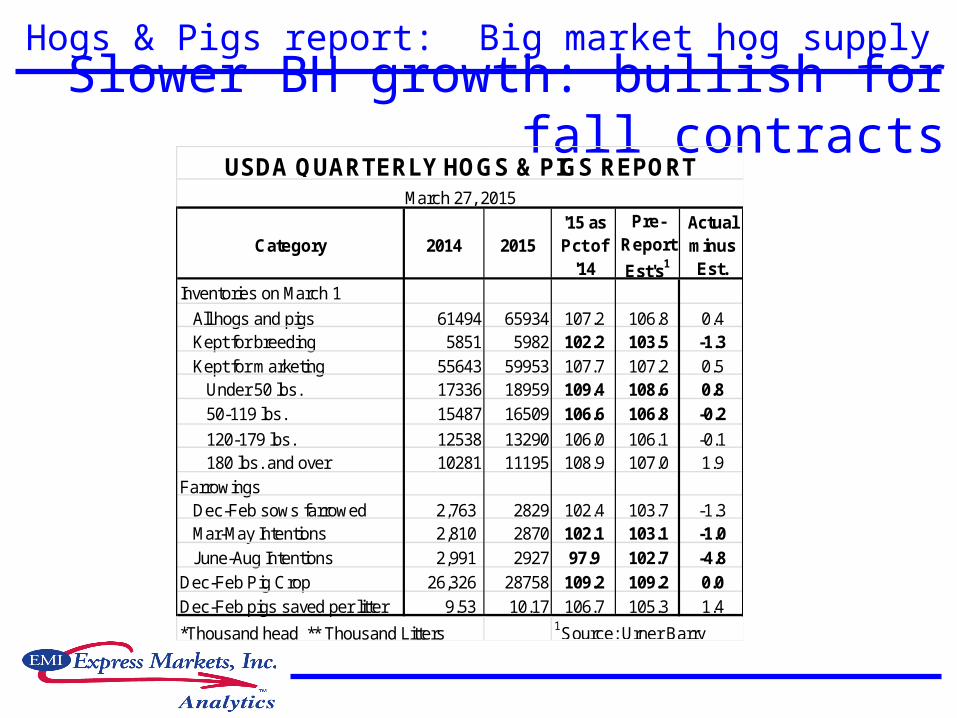
Hogs & Pigs report: Big market hog supply Slower BH growth: bullish for fall
contracts
Inventories on March 1
All hogs and pigs 61494 65934 107.2 106.8 0.4Kept for breeding 5851 5982 102.2 103.5 -1.3
Kept for marketing 55643 59953 107.7 107.2 0.5Under 50 lbs. 17336 18959 109.4 108.6 0.8
50-119 lbs. 15487 16509 106.6 106.8 -0.2
120-179 lbs. 12538 13290 106.0 106.1 -0.1180 lbs. and over 10281 11195 108.9 107.0 1.9
FarrowingsDec-Feb sows farrowed 2,763 2829 102.4 103.7 -1.3
Mar-May Intentions 2,810 2870 102.1 103.1 -1.0
June-Aug Intentions 2,991 2927 97.9 102.7 -4.8
Dec-Feb Pig Crop 26,326 28758 109.2 109.2 0.0
Dec-Feb pigs saved per litter 9.53 10.17 106.7 105.3 1.4
*Thousand head ** Thousand Litters 1Source: Urner Barry
Category 2014 2015'15 as Pct of
'14
Pre-Report
Est's1
Actual minus Est.
USDA QUARTERLY HOGS & PIGS REPORTMarch 27, 2015
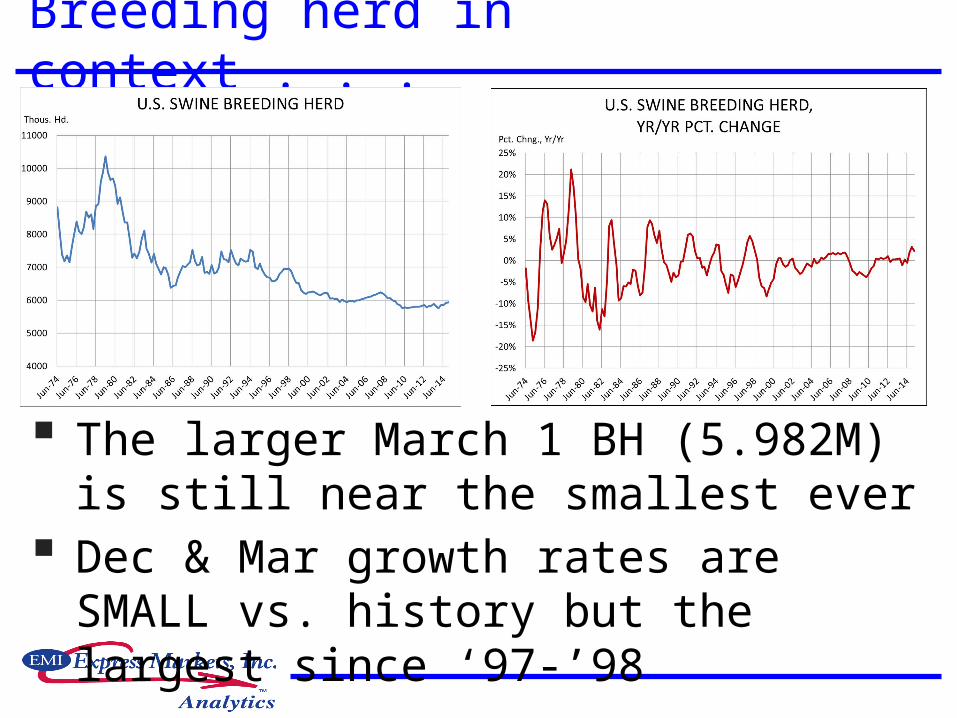
Breeding herd in context . . .
The larger March 1 BH (5.982M) is still near the smallest ever
Dec & Mar growth rates are SMALL vs. history but the largest since ‘97-’98
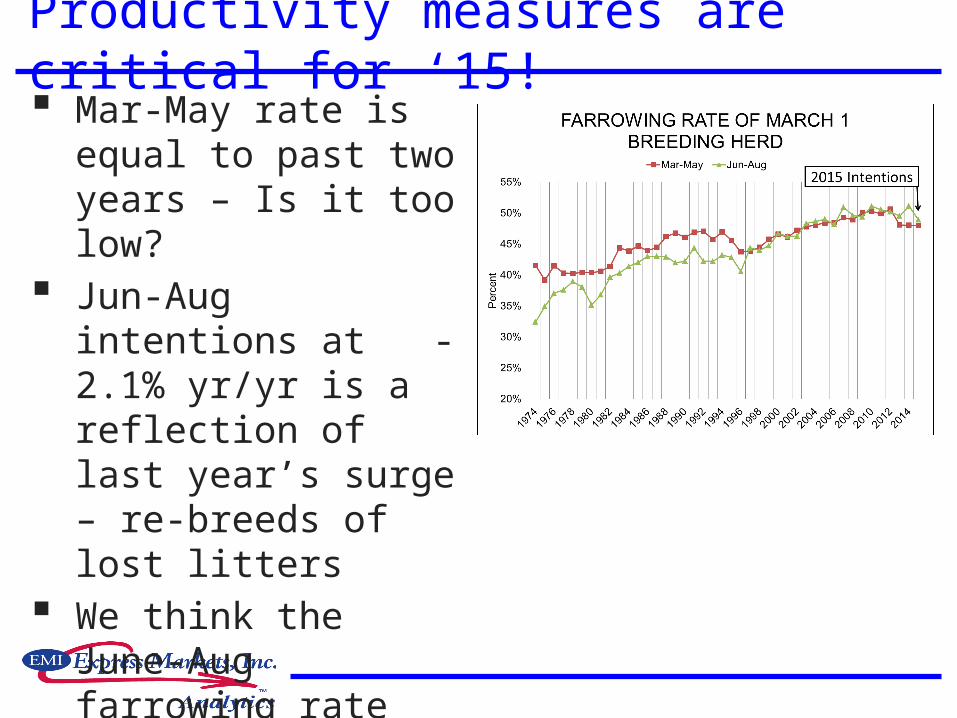
Productivity measures are critical for ‘15! Mar-May rate is
equal to past two years – Is it too low?
Jun-Aug intentions at -2.1% yr/yr is a reflection of last year’s surge – re-breeds of lost litters
We think the June-Aug farrowing rate and June-Aug intentions are reasonable
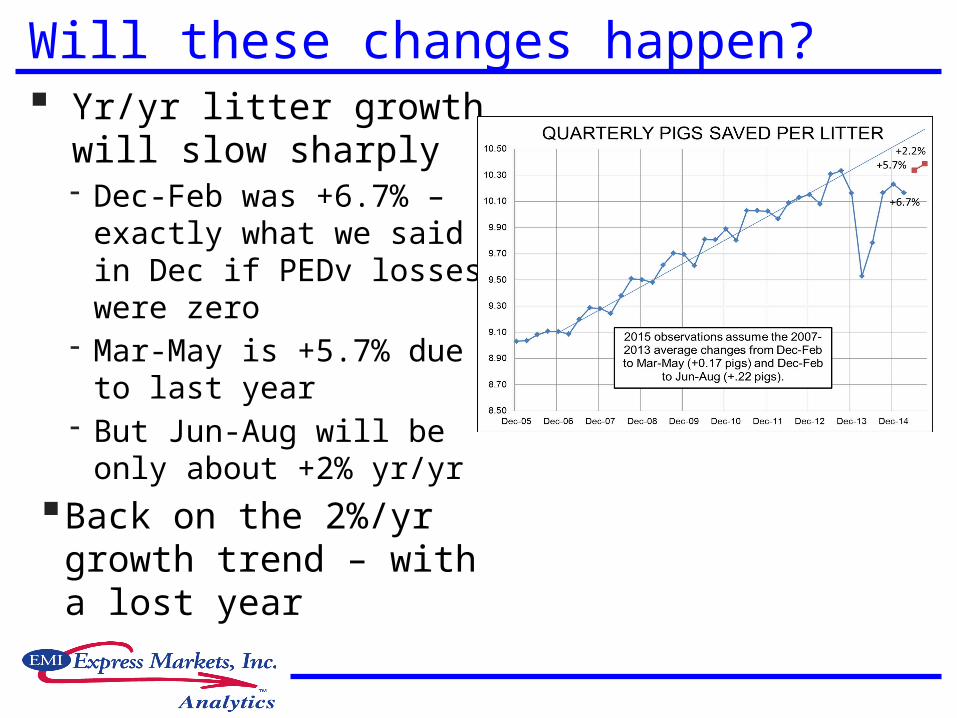
Will these changes happen? Yr/yr litter growth will
slow sharply- Dec-Feb was +6.7% –
exactly what we said in Dec if PEDv losses were zero
- Mar-May is +5.7% due to last year
- But Jun-Aug will be only about +2% yr/yr
Back on the 2%/yr growth trend – with a lost year
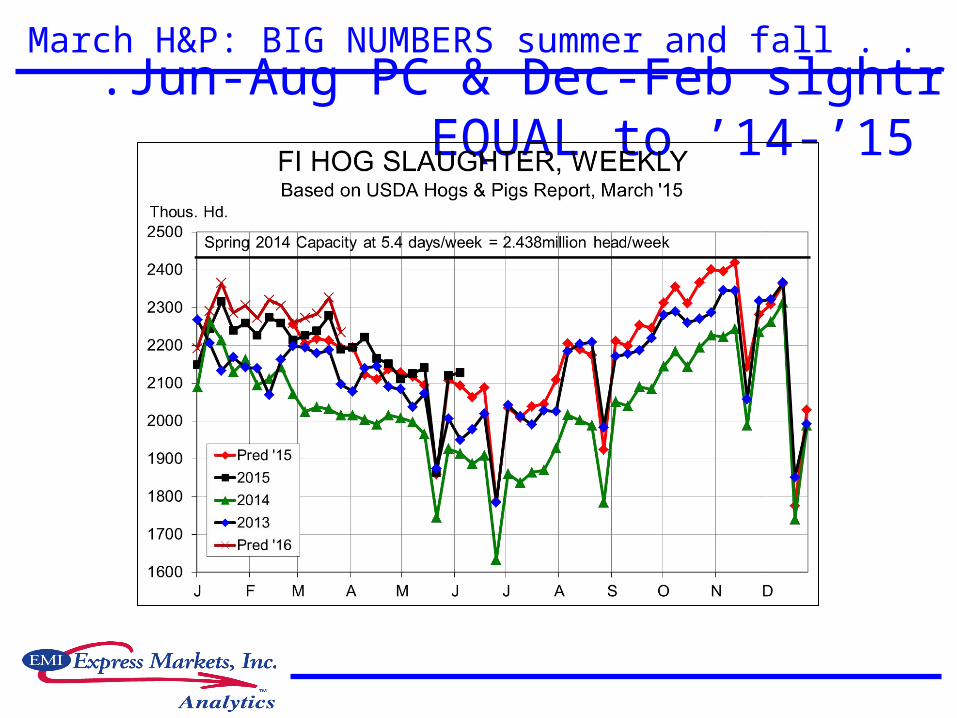
March H&P: BIG NUMBERS summer and fall . . .Jun-Aug PC & Dec-Feb slghtr
EQUAL to ’14-’15
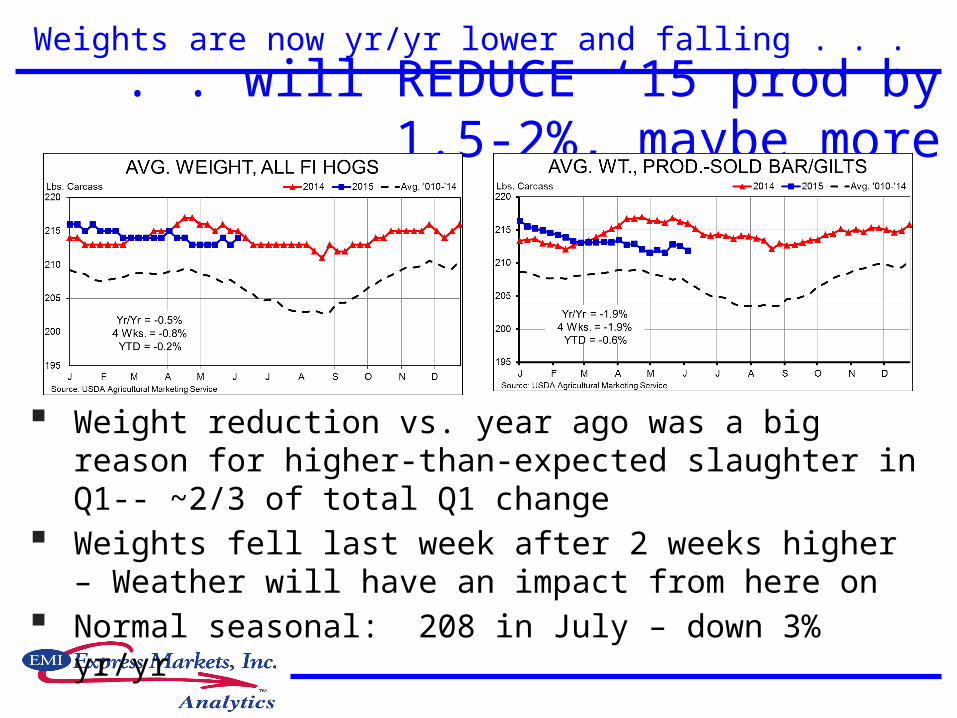
Weights are now yr/yr lower and falling . . .
Weight reduction vs. year ago was a big reason for higher-than-expected slaughter in Q1-- ~2/3 of total Q1 change
Weights fell last week after 2 weeks higher – Weather will have an impact from here on
Normal seasonal: 208 in July – down 3% yr/yr
. . will REDUCE ‘15 prod by 1.5-2%, maybe more

2014 production ended down only 1.4%. . . but is up 7.2% YTD and 9.3%
last week
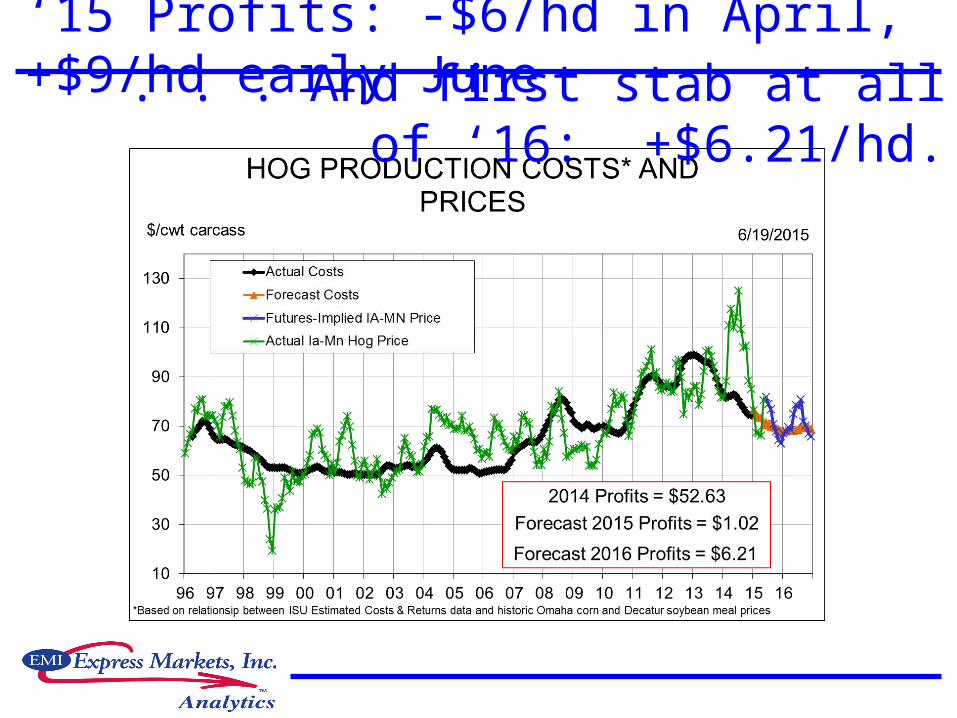
‘15 Profits: -$6/hd in April, +$9/hd early June . . . And first stab at all of ‘16: +
$6.21/hd.
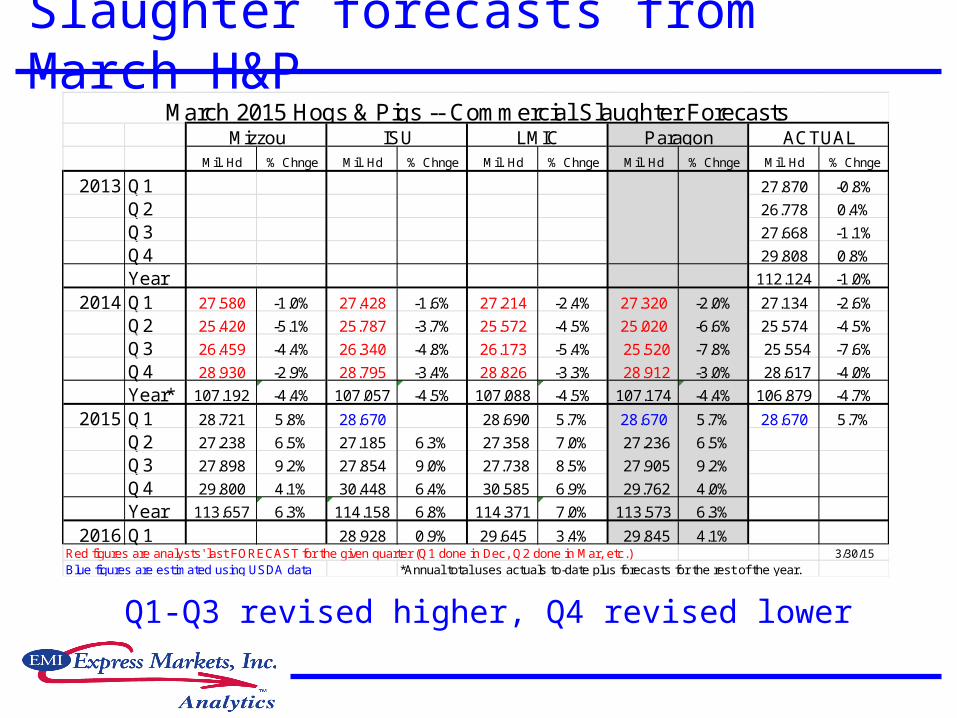
Slaughter forecasts from March H&P
Q1-Q3 revised higher, Q4 revised lower
Mil. Hd % Chnge Mil. Hd % Chnge Mil. Hd % Chnge Mil. Hd % Chnge Mil. Hd % Chnge
2013 Q1 27.870 -0.8%
Q2 26.778 0.4%
Q3 27.668 -1.1%
Q4 29.808 0.8%
Year 112.124 -1.0%
2014 Q1 27.580 -1.0% 27.428 -1.6% 27.214 -2.4% 27.320 -2.0% 27.134 -2.6%
Q2 25.420 -5.1% 25.787 -3.7% 25.572 -4.5% 25.020 -6.6% 25.574 -4.5%
Q3 26.459 -4.4% 26.340 -4.8% 26.173 -5.4% 25.520 -7.8% 25.554 -7.6%
Q4 28.930 -2.9% 28.795 -3.4% 28.826 -3.3% 28.912 -3.0% 28.617 -4.0%
Year* 107.192 -4.4% 107.057 -4.5% 107.088 -4.5% 107.174 -4.4% 106.879 -4.7%
2015 Q1 28.721 5.8% 28.670 28.690 5.7% 28.670 5.7% 28.670 5.7%
Q2 27.238 6.5% 27.185 6.3% 27.358 7.0% 27.236 6.5%
Q3 27.898 9.2% 27.854 9.0% 27.738 8.5% 27.905 9.2%
Q4 29.800 4.1% 30.448 6.4% 30.585 6.9% 29.762 4.0%
Year 113.657 6.3% 114.158 6.8% 114.371 7.0% 113.573 6.3%
2016 Q1 28.928 0.9% 29.645 3.4% 29.845 4.1%Red figures are analysts' last FORECAST for the given quarter (Q1 done in Dec, Q2 done in Mar, etc.) 3/30/15
Blue figures are estimated using USDA data *Annual total uses actuals to-date plus forecasts for the rest of the year.
Mizzou ISU LMIC Paragon ACTUALMarch 2015 Hogs & Pigs -- Commercial Slaughter Forecasts
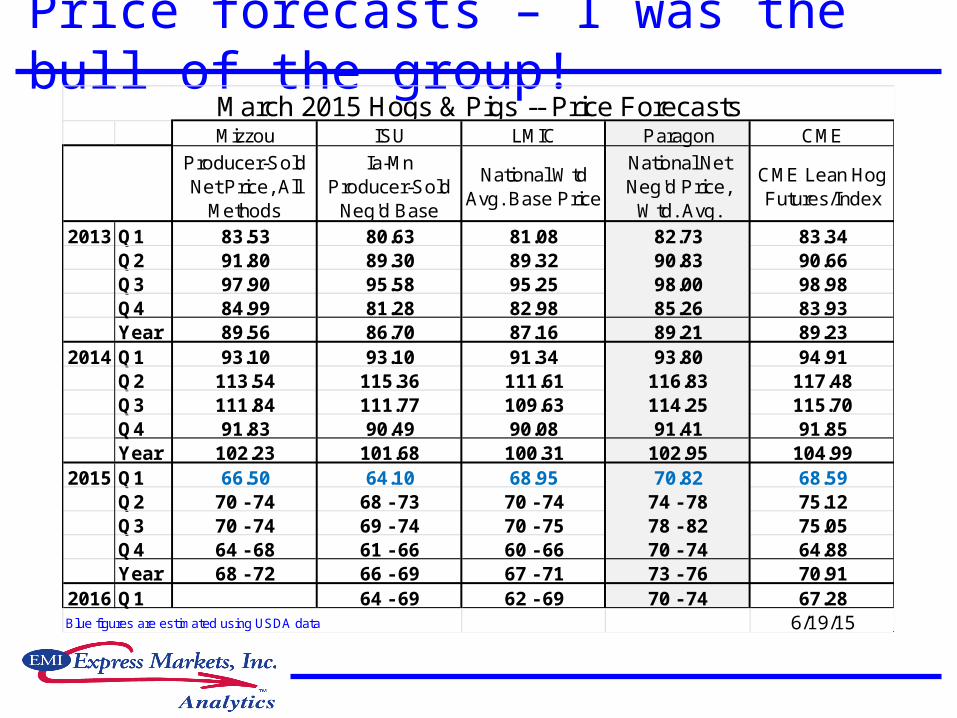
Price forecasts – I was the bull of the group!
Mizzou ISU LMIC Paragon CME
Producer-Sold Net Price, All
Methods
Ia-Mn Producer-Sold
Neg'd Base
National Wtd Avg. Base Price
National Net Neg'd Price,
Wtd. Avg.
CME Lean Hog Futures/Index
2013 Q1 83.53 80.63 81.08 82.73 83.34Q2 91.80 89.30 89.32 90.83 90.66Q3 97.90 95.58 95.25 98.00 98.98Q4 84.99 81.28 82.98 85.26 83.93Year 89.56 86.70 87.16 89.21 89.23
2014 Q1 93.10 93.10 91.34 93.80 94.91Q2 113.54 115.36 111.61 116.83 117.48Q3 111.84 111.77 109.63 114.25 115.70Q4 91.83 90.49 90.08 91.41 91.85Year 102.23 101.68 100.31 102.95 104.99
2015 Q1 66.50 64.10 68.95 70.82 68.59Q2 70 - 74 68 - 73 70 - 74 74 - 78 75.12Q3 70 - 74 69 - 74 70 - 75 78 - 82 75.05Q4 64 - 68 61 - 66 60 - 66 70 - 74 64.88Year 68 - 72 66 - 69 67 - 71 73 - 76 70.91
2016 Q1 64 - 69 62 - 69 70 - 74 67.28Blue figures are estimated using USDA data 6/19/15
March 2015 Hogs & Pigs -- Price Forecasts
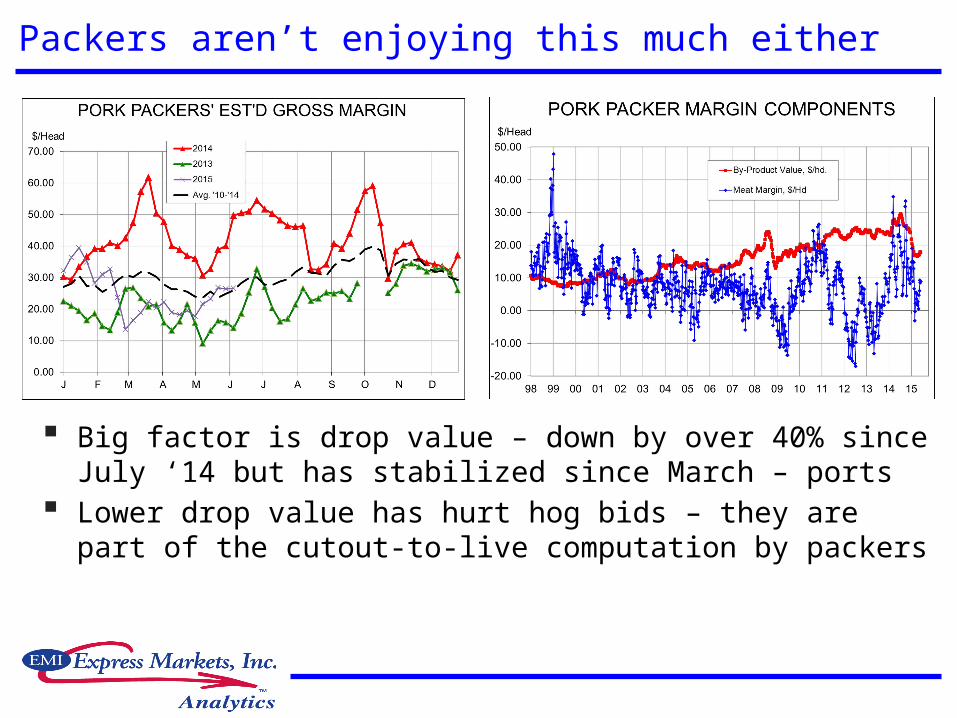
Packers aren’t enjoying this much either
Big factor is drop value – down by over 40% since July ‘14 but has stabilized since March – ports
Lower drop value has hurt hog bids – they are part of the cutout-to-live computation by packers

Pork stocks are a problem – ports, output3/31 picnics (+23), butts (+28), trim
(+52),
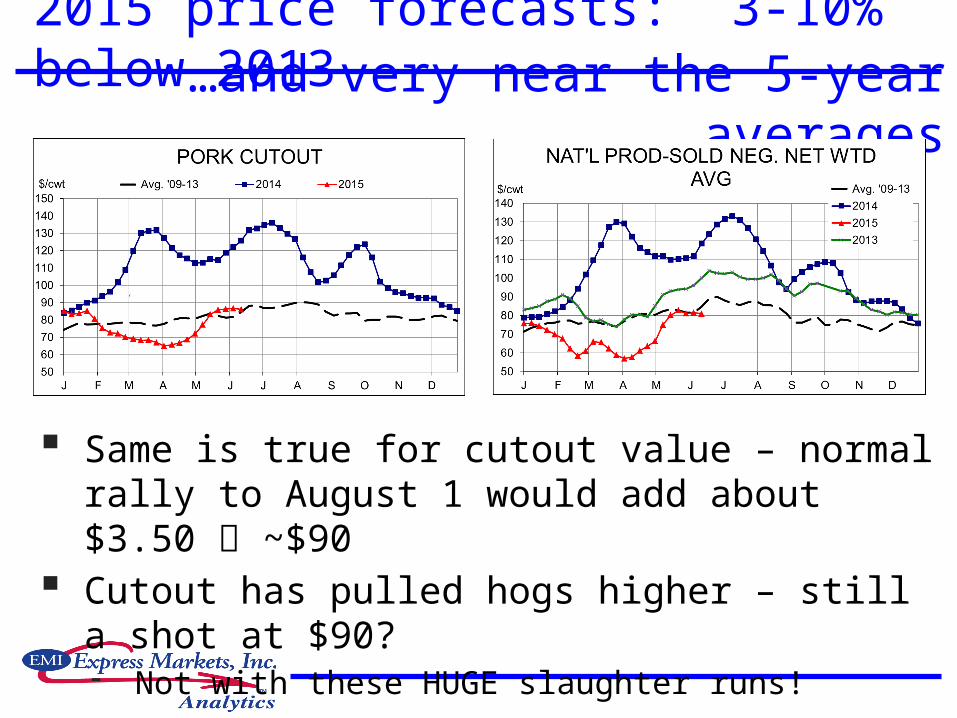
2015 price forecasts: 3-10% below 2013
Same is true for cutout value – normal rally to August 1 would add about $3.50 ~$90
Cutout has pulled hogs higher – still a shot at $90?- Not with these HUGE slaughter runs!
…and very near the 5-year averages
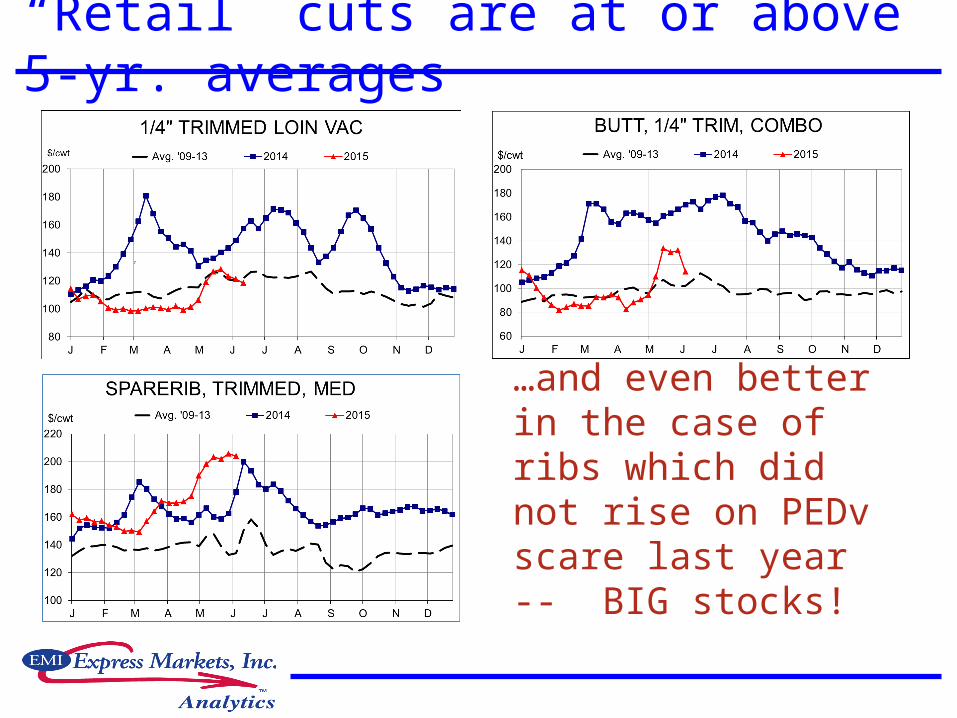
“Retail” cuts are at or above 5-yr. averages
…and even better in the case of ribs which did not rise on PEDv scare last year -- BIG stocks!

“Processing” cuts have improved . . .
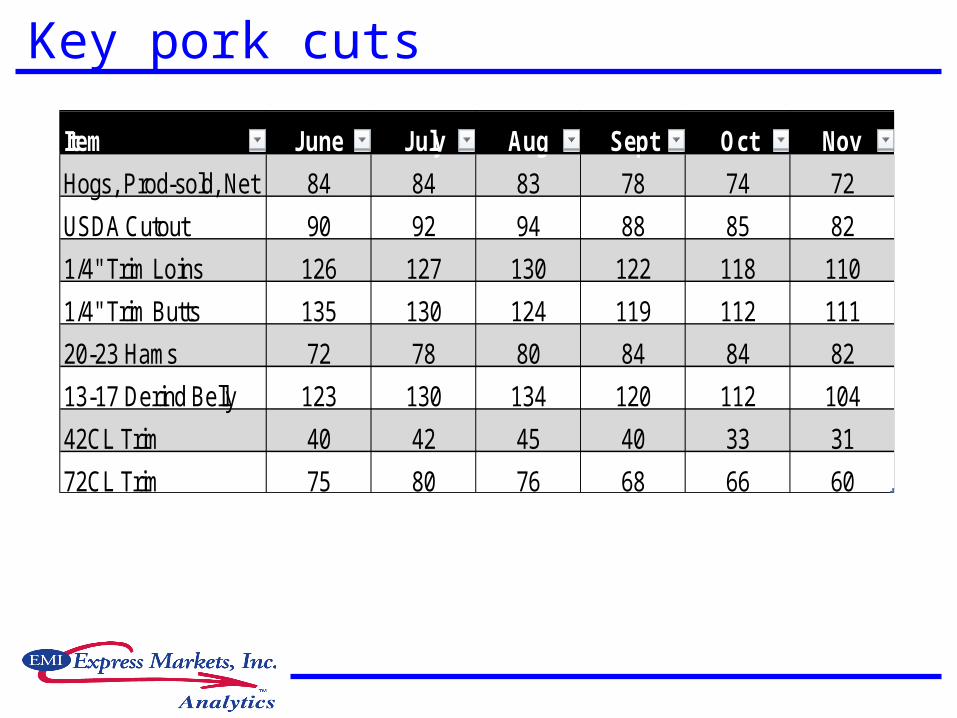
Key pork cuts
Item June July Aug Sept Oct Nov
Hogs, Prod-sold, Net 84 84 83 78 74 72
USDA Cutout 90 92 94 88 85 82
1/4" Trim Loins 126 127 130 122 118 110
1/4" Trim Butts 135 130 124 119 112 111
20-23 Hams 72 78 80 84 84 82
13-17 Derind Belly 123 130 134 120 112 104
42CL Trim 40 42 45 40 33 31
72CL Trim 75 80 76 68 66 60
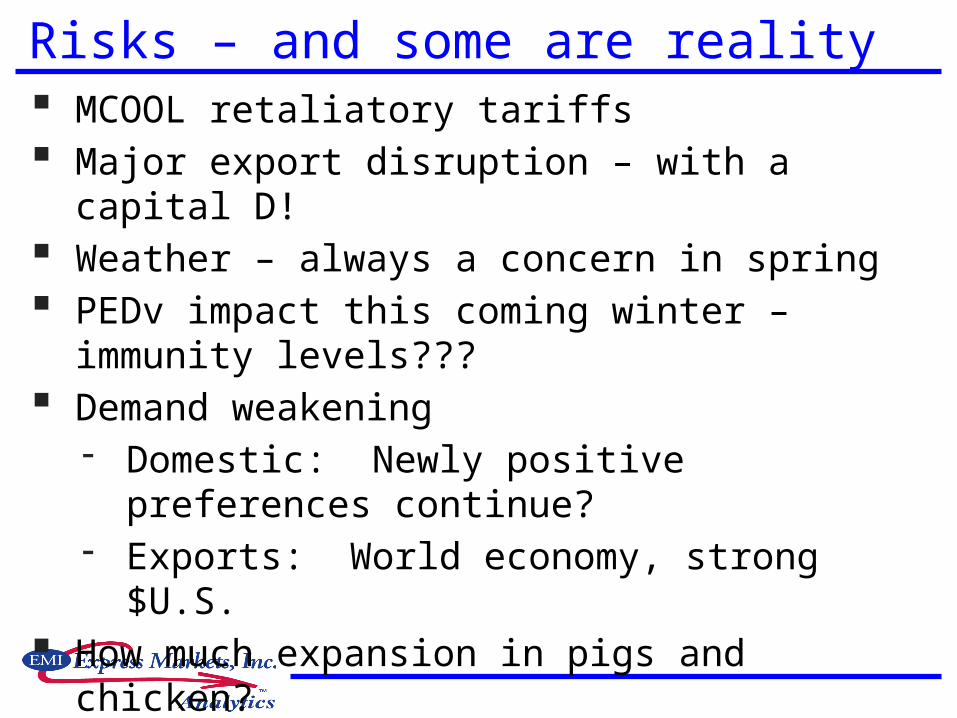
Risks – and some are reality MCOOL retaliatory tariffs Major export disruption – with a capital D! Weather – always a concern in spring PEDv impact this coming winter – immunity
levels??? Demand weakening
- Domestic: Newly positive preferences continue?
- Exports: World economy, strong $U.S. How much expansion in pigs and chicken? Hogs: Packing capacity – New plant in ’17

Questions and Discussion?