Embed Size (px)
Citation preview

Steven Lieberman
Assistant Director
Health and Human Resources Division
Congressional Budget Office
Lowering Medicare Costs: Regions or Beneficiaries?
National Health Policy ConferenceJanuary 28, 2004

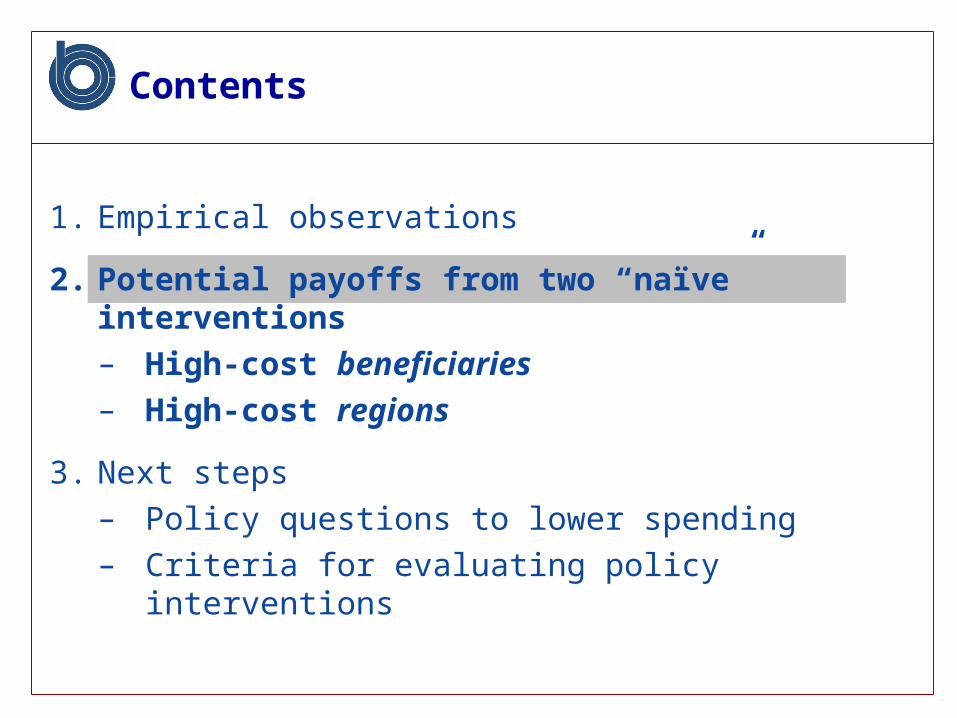
Contents
1. Empirical observations
2. Potential payoffs from two “naïve” interventions– High-cost beneficiaries– High-cost regions
3. Next steps– Policy questions to lower spending– Criteria for evaluating policy interventions

Empirical Observations
– More is not better Patients in high-spending regions received 60 percent more
care No better quality of or access to care If spending in all regions were lowered to levels in the lowest
decile, Medicare spending would fall by 29 percent
– Medicare spending is concentrated Most expensive 5 percent of beneficiaries accounted for 47
percent of total Medicare spending during 1995-1999
– Degree of concentration is similar across HRRs
– Many high spenders have persistently high spending 18 percent of beneficiaries were in the top quartile of spenders
in each year for at least two consecutive years during 1995-1999

Distribution of Medicare Spending and Beneficiaries
4%
30%
15%
37%
40%
15%
17%
1%
1%
40%
0%
10%
20%
30%
40%
50%
60%
70%
80%
90%
100%
Beneficiaries Spending
Notes: Data from a 5 percent random sample of fee-for-service (FFS) beneficiaries between 1995 and 1999.

Concentration of Medicare Spending
Notes: Data from a 5 percent random sample of fee-for-service (FFS) beneficiaries between 1995 and 1999. Spending reported in 1999 dollars.
Medicare Spending
Beneficiaries % of Total Mean
Top Quintile 84% $24,161
Fourth Quintile
12% $3,353
Third Quintile 3% $943
Bottom Two Quintiles
1% $155
Total 100% $5,753
Medicare Spending
Beneficiaries % of Total Mean
Top 1 % 17% $98,074
Top 5 % 47% $53,538
Top 10 % 66% $37,855

Distribution of Medicare Spending among HRRs
19% 20% 19%
29% 29% 30%
16% 16% 17%
36% 36% 34%
0%
20%
40%
60%
80%
100%
TopQuintileHRRs
All HRRs BottomQuintileHRRs
Top 1%
Top 1-5%
Top 5-10%
Low 90%
Notes: Data from a 5 percent random sample of fee-for-service (FFS) beneficiaries between 1995 and 1999. Excluded are beneficiaries who could not be assigned an HRR.

Persistence of Medicare Spending
High Cost
27% of Benes
75% of Costs
Low Cost
73% of Benes
25% of Costs
Persistent
18% of Benes
57% of Costs
Not Persistent
9% of Benes
18% of Costs
60% Alive
End of Year 5
40% Dead
End of Year 5
Year 1 Cohort of Beneficiaries
Notes: CBO analysis in “Concentration and Persistence of Expenditures among Medicare Beneficiaries.” Persistently high-cost group is defined as those who were in top 25 % of spending for at least 2 consecutive years during the 5-year period, 1995-1999.

Profiles of Beneficiaries by Spending Group
Spending Group (Mean Spending)
Top 5 Percent ($53,538)
Top 20 Percent ($24,161)
Bottom 40 Percent ($155)
Inpatient PPS Spending / Beneficiary $25,309 $11,119 None
Physician Spending / Beneficiary $8,872 $4,934 $129
Chronic Conditions•Congestive heart failure•Diabetes•Cognitive impairment
47%
35%
20%
36%
29%
16%
6%
10%
3%
Notes: Data from a 5 percent random sample of fee-for-service (FFS) beneficiaries between 1995 and 1999. Spending reported in 1999 dollars.
Contents
1. Empirical observations
2. Potential payoffs from two “naïve” interventions– High-cost beneficiaries– High-cost regions
3. Next steps– Policy questions to lower spending– Criteria for evaluating policy interventions

Potential Payoffs from Targeting High-Cost Beneficiaries vs. High-Cost Regions
By Beneficiary By HRR
% of Beneficiaries
% of Spending % of Beneficiaries % of Spending
Top 1% 16.7 % Top 0.7 % 1.2 %
Top 5% 45.8 % Top 4.9 % 7.0 %
Top 10% 65.1 % Top 9.8 % 13.1 %
Top Quintile 83.5 % Top 19.4 % 24.4 %
Fourth Quintile 12.0 % Next 20.3 % 21.9 %
Third Quintile 3.4 % Next 20.1 % 19.6 %
Bottom Two Quintiles
1.2 % Bottom 40.2 % 34.0 %
Notes: Data from a 5 percent random sample of fee-for-service (FFS) beneficiaries between 1995 and 1999. Excluded are beneficiaries who could not be assigned an HRR.

Potential Payoffs from Targeting High-Cost Beneficiaries vs. High-Cost Regions
0%
10%
20%
30%
40%
50%
60%
70%
80%
90%
100%
0% 10% 20% 30% 40% 50% 60% 70% 80% 90% 100%
Percent of Beneficiaries
Per
cen
t o
f E
xpen
dit
ure
s
Beneficiaries ordered from most to least expensive
Beneficiaries order from most to least intensive Region

Possible Policy Interventions
Intervention Target Possible Examples
High-Cost Regions •Establish and fund Comprehensive Centers for Medical Excellence (CCMEs)•Revise FFS payments to reward efficient care and reduce payments for HRRs with excessive supply-sensitive care
High-Cost Beneficiaries •Introduce case management/ disease management programs•Use risk screening/ predictive modeling
High-Cost Beneficiaries in High-Cost Regions
•Reduce the number of teaching hospital beds in high-cost HRRs•Case manage high-cost beneficiaries in high-cost HRRs
Possible interventions through reducing capacity, changing reimbursements and creating new programs

Challenges of the High-Cost Beneficiaries Approach
Generating savings from high-cost beneficiaries requires:
– Identifying who is, or will be, high cost Who survives but remains high cost? Could interventions change cost or outcome?
– Developing and implementing effective interventions Requires achieving lower costs or improved outcomes Should interventions be provider or patient focused?
– Rigorously demonstrating net savings Possibly use randomized control groups Capture costs of intervention and changes in benefit
spending

Challenges of High-Cost Regions Approach
Generating savings from high-cost HRRs requires:– Identifying who/ what will change practice patterns/ utilization
What to target? Could interventions cause changes in cost or outcome?
– Developing and implementing effective interventions Requires achieving lower costs or improved outcomes Where or on what should interventions be focused?
– Rigorously demonstrating net savings Possibly use randomized control groups Capture costs of intervention and changes in benefit spending

1. Empirical observations
2. Potential payoffs of two “naïve” interventions– High-cost beneficiaries– High-cost regions
3. Next steps– Policy questions to lower spending– Criteria for evaluating policy interventions
Contents

Policy Questions to Lower Spending
1. How best to identify excess spending?
2. What interventions would reduce excess spending?
3. How do we evaluate results of different policy interventions?

Criteria for Evaluating Policy Interventions
Criteria Regions Beneficiaries
Target efficiency Also include beneficiaries with low spending in high-cost regions
Target a small group of beneficiaries with very high spending
Number of people disrupted
Many Relatively few
Return on intervention
Possibly generate broad delivery system changes in utilization & savings within high-cost HRRs
Focus on persistently high spenders could lower their spending, but effect on system cost unknown