Embed Size (px)
Citation preview

1
Stewart-Martinello Final Report August, 2012
Transfer Students in Ontario: How Are They Faring?
Jo Stewart and Felice Martinello Brock University
St. Catharines, Ontario, L2S 3A1
[email protected] [email protected]
August, 2012
We would like to thank Melissa Dol for her valuable assistance with data collection. We also thank the Brock Registrar’s office for permission and help with the data.

2
I. Background
Examining the success of transfer students has become a priority in Ontario in recent
years (Policy Statement, 2011; Kerr, McCloy, Liu, 2010) due to the large number of post-
secondary students in Ontario transferring from college to university to complete a degree
(Association of Colleges of Applied Arts and Technology of Ontario, 2005; Embelton, 2008).
Given this large migration from college to university, it is vital that institutions in Ontario
engage in research to help determine what outcomes best define success amongst this population
of students, how to best measure those outcomes, how transfer students are faring according to
those measures, and how to foster success in these students. Despite the apparent need for
research in this area, relatively few empirical studies have been completed to examine student
success amongst college-to-university transfer students in Ontario. The current study was
initiated to investigate the level of success amongst transfer students at one university in Ontario.
Research focusing on how college transfer students may be a unique cohort compared to
university-to-university transfer students, and those entering university from secondary school is
extremely important because each of these groups may have different learning needs and
expectations that could affect their success. Learning how college students may be different from
the other two groups is also important when initiating programs that may enhance the success and
retention of college transfer students in university programs. Researchers at various Ontario
universities have completed research on the success of transfer students from a variety of
programs and perspectives (An Analysis, 2008; Bell, 1998; Craney, 2012; Measuring the Success,
2007; Menard et al, 2012; Stewart & Martinello, 2012). Some have found that college transfer
students have lower retention and graduation rates than non-transfer students (Craney, 2012;
Menard et al, 2012). Others have found that college transfer students are as successful as others

3
when graduation is the variable that is used to define success (Bell, 1998). One concern is that of
the few studies that have examined college-to-university transfer in Ontario, all have identified
student success differently. This leads to difficulty interpreting the often conflicting results.
According to Stewart and Martinello (2012), there are difficulties when examining the
change in grade point average (GPA) of students who transfer from college to university as a
measure of student success. Difficulties arise when one attempts to compare grades received
from two institutions that may have different course requirements or student expectations. Rather
than focus on GPA, these researchers examined different outcomes experienced by transfer
students in first-year classes at one Ontario university during the 2008-09 academic year. In their
study, college-to-university transfer students were compared to university-to-university transfer
students, and those entering university from secondary school on factors that included university
GPA, course withdrawals before completion, and the academic outcome for those students who
failed the first term of their courses.
When compared to students entering university from secondary school, Stewart and
Martinello (2012) report that college transfer students perform no better or worse in terms of
course grades and the likelihood of withdrawing from a course before completion. It was also
found that college students who failed their first term were able to demonstrate better academic
performance in their second term compared to the non-transfer students in the sample. There
was also indirect evidence for a drop in GPA from college to university.
Stewart and Martinello (2012) examined transfer student performance in first-year
courses in 2008-09. The students in that sample have now had the opportunity for four years of
study at Brock. This study examines the performance of these students up to the end of the
2011-12 academic year in order to determine whether the college transfer students who began
4
their studies at Brock University in 2008 have continued to succeed. Specifically, the
performance of the three groups (college transfer, university transfer, and secondary school
entrants) who took introductory-level Social Sciences courses at Brock University in 2008-09
were compared on a number of variables including number of credits attempted and completed,
grade point average, total number of course withdrawals and degree attainment after four years of
study at Brock University. In the discussion that follows, it should be noted that a typical full-
time student with a full course load completes five credits per year towards a three-year, fifteen
credit Pass BA, or towards a four-year Honours or non-Honours BA with Major.
II. Data
The data consist of individual observations on 2,594 Brock undergraduate students. Of
these, 155 of the students are transfers from community colleges, 72 are transfers from other
universities and the remaining 2,367 are non-transfer students who entered Brock from high
school with no transfer credits from other post secondary institutions. The students are a subset
of those examined in Stewart and Martinello (2012). All of the students were enrolled in at least
one first year Social Sciences course in the fall and winter terms of the 2008-09 academic year.
In this paper, however, the sample is restricted to only first year Brock students; i.e., those who
had not enrolled in courses at Brock previously and had no Brock credits before 2008-09.
The original selection of students from first year Social Science courses means that the
sample is generally not representative of the student population at Brock. We do not believe that
this is a significant problem, however, because the differences between the sample and the Brock
student population are not large. For example, female students make up 63% of the sample while
they comprised 59% of the student population at Brock in the fall of 2008. Not surprisingly, the
sample has higher proportions of students majoring in the Social Sciences (roughly 30% in the

5
sample versus 25% for Brock as a whole) and in the Humanities (roughly 17% in the sample
versus 14% for Brock as a whole). Conversely, Faculty of Business students are
underrepresented in the sample (roughly 2% in the sample versus 15% for Brock), as are Faculty
of Science students (roughly 3% in the sample versus 6% for Brock as a whole). Students with
majors in Applied Health Sciences make up 15.3% of the sample and this is quite close to the
16.6% found in the Brock student population. The sample includes students from all Faculties
since Brock students must take a first year Social Science course as part of their degree breadth
requirements. The percentages of Brock students in the various Faculties are taken from the web
pages of the Brock Office of Institutional Analysis (Brock Office, 2012) and they exclude
General Studies and Undeclared students. Students who are completing General Studies degrees
are admitted to that program either upon accepting an offer of admission from the university, or
upon choosing to complete that degree program. Students who are considered “Undeclared” are
typically those who once had a major discipline of study, but who were adjudicated out of their
programs due to poor academic performance in major courses.
The data report on several academic outcomes for each student: number of courses
completed, withdrawals from courses, number of credits earned, grade averages, graduations, and
major field of study for the fall terms to the summer terms of 2008-09, 2009-10, and 2010-11,
and for the fall and winter terms of 2011-12, which are the most recent data available at the time
of writing. For the discussions that follow Years 1, 2, 3, and 4 refer to the 2008-09, 2009-10,
2010-11, and 2011-12 academic years described above, respectively, and not to the students’
academic program years. All data were obtained from the Registrarial record at Brock University.
6
III. Method and Results
Students’ progress through their post-secondary programs is a complicated, multi-
dimensional process with many different characteristics. This means that many different
measures can be used to compare the progress of different groups of students.
Our approach is to examine the various measures of students’ progress one at a time in
separate subsections below. In every case the comparison is between the particular type of
transfer student (college or university) and non-transfer students. For each measure, bullet points
at the start of the subsection state the basic conclusions and then a fuller exposition follows. The
results for college transfer and university transfer students are usually presented separately within
each subsection since they are usually different from one another. But the results for both
university and college transfers are presented together in a few of the subsections below when
they are similar to one another.
The basic method is to calculate the averages or frequencies of particular measures of
students’ progress separately for college transfers, university transfers, and non-transfer students
and then compare each type of transfer student to non-transfer students. The hypothesis that there
is no difference between transfer and non-transfer students (in the average value or frequency of
the measure) is then tested separately for college and university transfer students. The p values
for the hypothesis tests are reported and cases where the hypothesis is rejected at the 1%, 5% and
10% significance levels are identified. Rejection of the hypothesis means that there are
statistically significant differences between that type of transfer students and non-transfer
students in that measure of students’ progress.
The simple comparisons of progress measures reported below do not control for the
effects of other student characteristics such as gender or major field of study. To address this, all
7
of the comparisons between transfer and non-transfer students are repeated with regression
analysis and controls for students’ gender and major. The dummy variables representing students’
major fields of study are often statistically significant in the regressions while gender,
surprisingly, is usually not. Overall however, the regression analyses, with the controls for
gender and major, yield essentially the same results as the simple comparisons shown below.
Thus, to save space, none of the regression estimate results are reported here, but they are
available upon request. The discussions below comment on whether the regression analysis
produced the same or slightly different results from those reported in the tables. Data on other
student characteristics such as family background and socio-economic status are not available in
the data.
Last, the following nomenclature is used to describe students’ activity in their programs at
Brock. If a student enrols in a course and does not drop the course before the end of the two-
week add/drop registration period then that course counts as an attempt. Students may withdraw
from a course after the add/drop registration period so not all course attempts are completed.
Course withdrawals must occur before a specified date (usually the end of the eighth week of the
term). If a student withdraws before this date, no final grade is assigned, and there is no
academic penalty for the attempt. If the student does not withdraw from a course before the last
withdrawal date then the course attempt is deemed to have been completed and a final grade is
assigned regardless of whether the student actually attended the course or wrote the final exam.
For completed course attempts, there are three possible outcomes:
• A failing final grade (less than 50%) is assigned so the student does not earn the credit value of the completed course attempt. This is a failed course attempt.
• A passing final grade (50% or higher) is assigned but the student has previously completed and passed the course (i.e., the student is repeating the course in an attempt to

8
achieve a higher grade) so the student does not earn the credit value of the course. This is referred to as a repeated course attempt.
• A passing final grade (50% or higher) is assigned and credit has not previously been given for the course, so the student earns the credit value of the course. This is a passed course attempt.
The numbers of attempts and withdrawals, and the numbers of failed and repeated course
attempts, are all measured by the credit values of the courses involved.
A. Student Persistence or Attrition
• College transfer students have lower persistence up to Year 3, but the differences are small and not statistically significant.
• College transfer students are much less likely to persist to Year 4 and the difference is statistically significant.
• University transfer students have higher persistence up to Year 3, but the differences are
small and not statistically significant. • University transfer students are much less likely to persist to Year 4, given that they
persisted to Year 3, and the difference is statistically significant.
Persistence is defined by whether students attempt at least one course in an academic year
given that they persisted (attempted at least one course) in an earlier year. Persistence occurs
when students enrol in courses regardless of what happens later in the course. Students may
withdraw from the courses before completion, or complete the courses and earn their credit
values or not, and the enrollment still counts as an attempt. The persistence measures are
adjusted for graduations in either 2010 or 2011. If students have graduated they are not included
in the any of the subsequent years’ measures of persistence.
The first three rows of Table 1 show persistence from one year to the next. They show the
percentage of students who attempted at least one course in that year given that they attempted at
least one course in the previous year. The last two rows of Table 1 show three and four year
measures of persistence starting from Year 1 (2008-09). The penultimate row shows the

9
percentage of students who attempted at least one course in Year 3 (2010-11), given that they
attempted at least one course in Year 1. The last row shows persistence from Year 1 (2008-09) to
Year 4 (2011-12).
College Transfer Students
Compared to non-transfer students, college transfers are less likely to persist from Year 1
to Year 2 but the difference is small and statistically insignificant. College transfer and non-
transfer students are virtually identical in their persistence from Years 2 to 3. College transfer
students, however, are much less likely to attempt courses in Year 4, given that they attempted
courses in Year 3, and the difference is statistically significant. Again, the measure of persistence
from Year 3 to Year 4 excludes all students who graduated at the end of Years 2 or 3.
The three and four year measures of persistence (reported in the last two rows of Table 1)
show the same basic results. Persistence from Year 1 to Year 3 is lower than non-transfer
students but not significantly different. Persistence from Year 1 to Year 4 is much lower than
non-transfer students and the difference is statistically significant at very low levels.
Probit regression analysis of persistence, with controls for students’ gender and major
field of study, show the very same results for college transfer students compared to non-transfer
students. Female students are estimated to have higher persistence but the difference is not
statistically significant. There are large and statistically significant differences in persistence
across majors. Not surprisingly, Undeclared and General Studies students have significantly
lower persistence than students in other major fields of study.

10
Table 1. Students’ persistence: Percentage of students attempting courses in the later Year given attempts in the earlier Year
Non-
Transfer College
Transfer University
Transfer
Year 1 to Year 2 85.4 82.1
(p=0.27) 91.2
(p=0.18)
Year 2 to Year 3 89.1 89.3 (p=0.96)
89.3 (p=0.96)
Year 3 to Year 4 92.3 84.4b
(p=0.013) 81.3b
(p=0.02)
Year 1 to Year 3 77.2 74.3 (p=0.42)
82.3 (p=0.35)
Years 1 to Year 4 71.1 56.5a
(p=0.001) 66.7
(p=0.53) Notes: a, b, or c signify a statistically significant difference between transfer and non-transfer students at the 1%, 5% or
10% significance levels, respectively. p values for the hypothesis test of no difference between transfer and non-transfer students are shown in parentheses. Chi squared tests on 2 x 2 contingency tables between the occurrences (i.e., whether they attempted courses or not),
are used to test for statistically significant differences for each case. Percentages, rather than frequencies, are shown because we believe that they convey more information in an easier to read manner.
University Transfer Students
Unlike college transfers, university transfer students are more likely than non-transfer
students to persist from Year 1 to Year 2. Like college transfers, university transfer students
have virtually the same persistence rates as non-transfer students from Year 2 to Year 3, but
significantly lower persistence rates from Year 3 to Year 4.
Year 1 to Year 3 persistence is higher than non-transfer students, but the difference is not
statistically significant. The very high attrition from third year to fourth year makes the Year 1 to
Year 4 persistence rate lower for university transfer students compared to non-transfer students,
but the difference is not large due to the higher persistence early in their programs and it is not
statistically significant.

11
The regression estimates yield essentially the same results after controlling for the effects
of gender and major field of study.
B. Number of Credits Earned
• College transfers students earn fewer credits in every year and the differences are statistically significant
• University transfer students earn significantly fewer credits in Years 3 and 4. They also
earn fewer credits in Year 1 but the difference is much smaller and not statistically significant.
Table 2 reports the average number of credits earned by transfer and non-transfer students
over various years and multi-year periods. The first four lines report the average number of
credits earned in each of the first four years. Students are included only if they attempted at least
one course in that year. The last three lines show the average sum of credits earned over the first
two, first three, and all four academic years, respectively. For the multi-year averages, students
had to have been enrolled continuously. This means that they had to have attempted at least one
course in every year covered by the time period.
A student would earn five credits over the fall and winter terms of an academic year if
they successfully completed a full course load.
College Transfer Students
On average, college transfers students earn fewer credits in every year than non-transfer
students and the differences are statistically significant. The differences in Years 1 and 2 are only
around a quarter of a credit. But college transfer students earn almost 0.7 fewer credits in Year 3,
on average, and the difference grows to over one full credit in Year 4.

12
Regression analysis shows essentially the same results after adjusting for gender and
major field of study, although the differences in credits earned are estimated to be smaller than
those shown in Table 2 after adjusting for major field of study and gender.
Table 2. Average number of credits earned
Non- Transfer
College Transfer
University Transfer
Year 1: Fall 2008 to Summer 2009 4.13 3.87c
(p=0.054) 3.95
(p=0.30)
Year 2: Fall 2009 to Summer 2010 4.26 4.03c (p=0.06)
4.23 (p=0.87)
Year 3: Fall 2010 to Summer 2011 4.40 3.72a (p=0.00)
4.02c (p=0.068)
Year 4: Fall 2011 to Winter 2012 4.16 3.08a (p=0.00)
3.50b (p=0.01)
Years 1 & 2: Fall 2008 to Summer 2010 8.70 8.29b
(p=0.046) 8.35
(p=0.28)
Years 1 to 3: Fall 2008 to Summer 2011 13.5 12.2a (p=0.00)
12.6c (p=0.057)
Years 1 to 4: Fall 2008 to Winter 2012 18.0 14.4a (p=0.00)
17.0b (p=0.048)
Notes: a, b, or c signify a statistically significant difference between transfer and non-transfer students at the 1%, 5% or
10% significance levels, respectively. p values for the hypothesis test of no difference between transfer and non-transfer students are shown in parentheses. t- tests for the differences between the means of two samples are used to test for statistically significant differences.
The variances of the two samples are not assumed to be equal. University Transfer Students
Table 2 shows that university transfer students also earn fewer credits than non-transfer
students in every year but the differences are smaller. In Year 1, for example, the differences in
average credits earned are less than 0.2 credits and it is not statistically significant. In Year 2
university transfers earn virtually the same number of credits as non-transfer students. Much
13
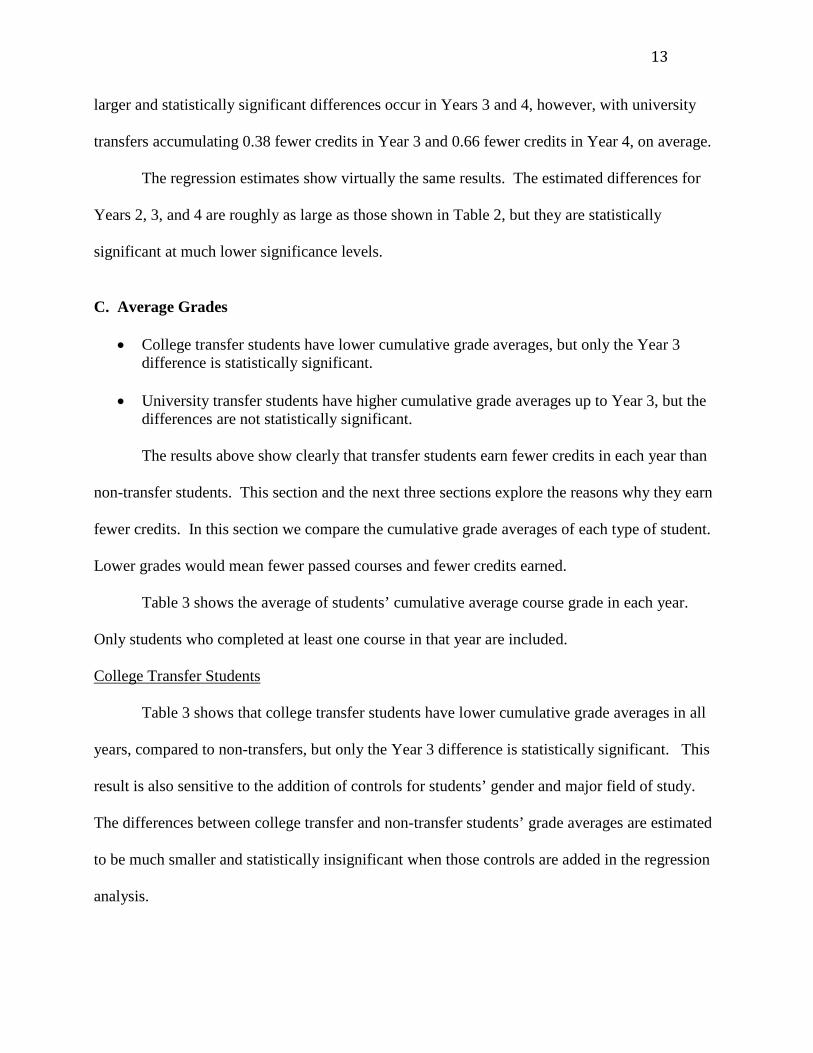
larger and statistically significant differences occur in Years 3 and 4, however, with university
transfers accumulating 0.38 fewer credits in Year 3 and 0.66 fewer credits in Year 4, on average.
The regression estimates show virtually the same results. The estimated differences for
Years 2, 3, and 4 are roughly as large as those shown in Table 2, but they are statistically
significant at much lower significance levels.
C. Average Grades
• College transfer students have lower cumulative grade averages, but only the Year 3 difference is statistically significant.
• University transfer students have higher cumulative grade averages up to Year 3, but the
differences are not statistically significant.
The results above show clearly that transfer students earn fewer credits in each year than
non-transfer students. This section and the next three sections explore the reasons why they earn
fewer credits. In this section we compare the cumulative grade averages of each type of student.
Lower grades would mean fewer passed courses and fewer credits earned.
Table 3 shows the average of students’ cumulative average course grade in each year.
Only students who completed at least one course in that year are included.
College Transfer Students
Table 3 shows that college transfer students have lower cumulative grade averages in all
years, compared to non-transfers, but only the Year 3 difference is statistically significant. This
result is also sensitive to the addition of controls for students’ gender and major field of study.
The differences between college transfer and non-transfer students’ grade averages are estimated
to be much smaller and statistically insignificant when those controls are added in the regression
analysis.

14
Table 3. Average of students’ cumulative grade average
Non- Transfer
College Transfer
University Transfer
Year 2: 2009-10 68.5
67.4 (p=0.19)
69.9 (p=0.16)
Year 3: 2010-11 70.7 68.9b (p=0.03)
72.1 (p=0.23)
Year 4: 2011-12 72.1 70.7 (p=0.15)
71.8 (p=0.84)
Notes: a, b, or c signify a statistically significant difference between transfer and non-transfer students at the 1%, 5% or
10% significance levels, respectively. p values for the hypothesis test of no difference between transfer and non-transfer students are shown in parentheses. t- tests for the differences between the means of two samples are used to test for statistically significant differences.
The variances of the two samples are not assumed to be equal. University Transfer Students
Compared to non-transfer students, university transfer students had higher cumulative
grade averages by the ends of Years 2 and Year 3 but neither of the differences are statistically
significant. The regression estimates, however, yield somewhat stronger results. After
controlling for gender and major, the grades advantages for university transfers are estimated to
be at least as large as those shown in Table 3 and they are statistically significant for Year 2.
By the end of Year 4, the grade average for university transfer students has fallen below
that of non-transfers but the difference is small and statistically insignificant. The regression
analysis shows a bigger decrease, but the estimate is also statistically insignificant.
D. Converting course attempts into academic credits
• College transfer students were less able to earn credits from their course attempts in Years 1, 3 and 4; and the Year 3 and 4 differences are large and statistically significant. Higher proportions of failed and repeated courses in Years 3 and 4, and more course withdrawals in Years 1 and 4 accounted for the lower conversion rates.

15
• University transfer students were more successful at converting course attempts into
credits than non-transfer students in most years but all of the differences were small and statistically insignificant.
Differences in average grades do not appear to be large enough to explain why transfer
students earn so many fewer credits in each year of their Brock programs. This section addresses
the question of why transfer students earn fewer credits more directly by examining the rates at
which students are able to earn academic credits from their course attempts. Table 4 reports a
credit attempt conversion rate that measures the percentage of attempts where the academic credit
is received. Specifically, the attempt conversion rate equals the number of credits earned divided
by the number of credit attempts over the time period (and multiplied by 100 to make it a
percentage). The rate is less than 100% (i.e., credits earned were less than the number of credit
attempts) if students withdrew from courses before completion, received failing grades in their
completed courses, or repeated courses that they had already passed. Only students who
attempted at least one course in that academic year, or in the last year of the period for multiyear
time spans, are included in the calculation of the credit attempt conversion rate.
College Transfer Students
Over Years 1 and 2, college transfer students were able to convert attempts (course
enrolments) into credits at roughly the same rates as non-transfer students. In Year 1, college
transfers were less successful, but the difference in the conversion rate is only 1.2 percentage
points. In Year 2, college transfer students actually earned more credits from their attempts, but
the difference is very small. In Year 3, and especially in Year 4, however, college transfer
students were much less successful at converting course attempts into credits and the differences

16
are statistically significant. The regression estimates show virtually the same results after
controlling for gender and students’ major field of study.
Further analysis investigated why college transfer students were less able to earn credits
from their course attempts, but the detailed results are not shown in order to save space. The
estimates show that college transfer students were more likely to withdraw from their course
attempts before completion in all years. In Year 1, for example, non-transfer students withdrew
from six percent of their course attempts while college transfers withdrew from 7.9 percent, and
the difference is statistically significant at the ten percent level. The difference is much larger in
Year 4, where non-transfer students withdrew from 4.2 percent of their course attempts while
college transfers withdrew from over 10 percent. In Years 2 and 3, college transfers also
withdrew from more of their courses but the differences were small (less than two-thirds of a
percentage point) and statistically insignificant. The higher withdrawal rates for college transfers
are statistically significant if multi-year periods (e.g. Years 1 and 2, Years 1 to 3, or Years 1 to 4)
are considered.
The hypothesis tests for no difference in withdrawal rates between transfer and non-
transfer students are adjusted for the fact that the majority of students do not withdraw from any
of their courses in a given year, leaving a large mass point at zero in the distribution of
withdrawal rates across students. Tobit regression analysis is used to make the adjustment for the
mass point and similar results were obtained with and without the controls for gender and major
field of study.
We also examined the differences in outcomes when students did not withdraw and
completed their courses. Specifically, we examined the rates at which students received failing
grades in their courses or repeated courses that they had already passed. In either case, the
17
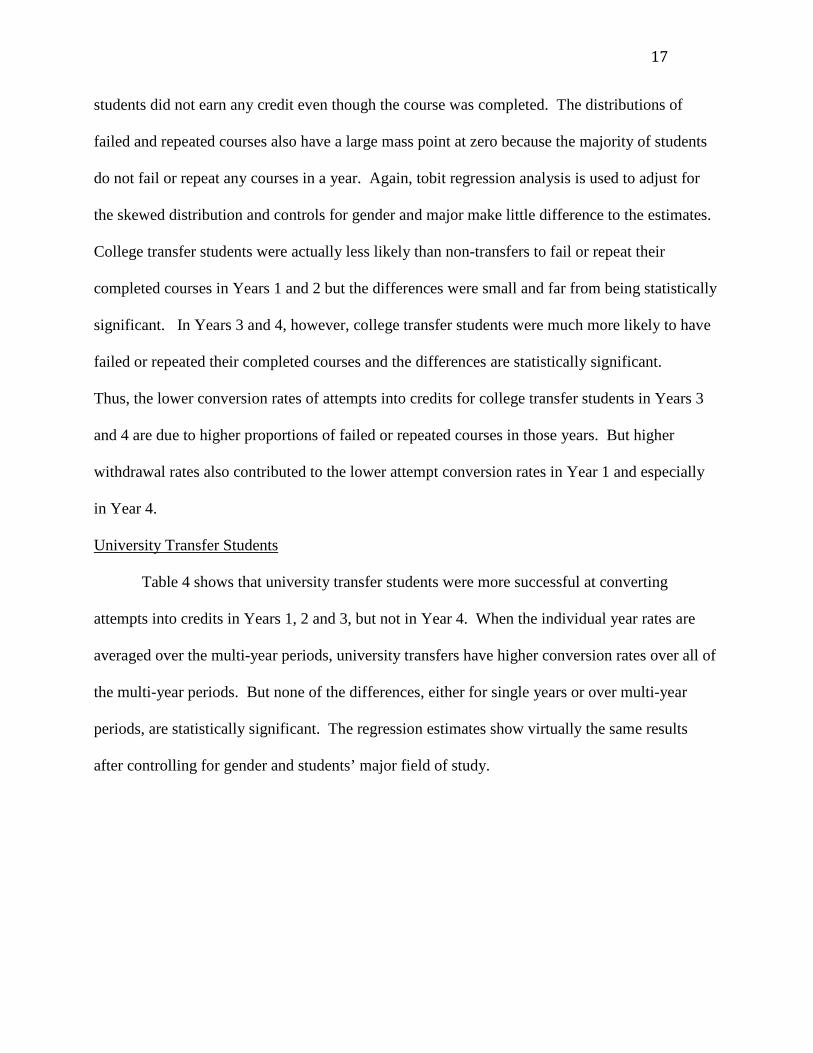
students did not earn any credit even though the course was completed. The distributions of
failed and repeated courses also have a large mass point at zero because the majority of students
do not fail or repeat any courses in a year. Again, tobit regression analysis is used to adjust for
the skewed distribution and controls for gender and major make little difference to the estimates.
College transfer students were actually less likely than non-transfers to fail or repeat their
completed courses in Years 1 and 2 but the differences were small and far from being statistically
significant. In Years 3 and 4, however, college transfer students were much more likely to have
failed or repeated their completed courses and the differences are statistically significant.
Thus, the lower conversion rates of attempts into credits for college transfer students in Years 3
and 4 are due to higher proportions of failed or repeated courses in those years. But higher
withdrawal rates also contributed to the lower attempt conversion rates in Year 1 and especially
in Year 4.
University Transfer Students
Table 4 shows that university transfer students were more successful at converting
attempts into credits in Years 1, 2 and 3, but not in Year 4. When the individual year rates are
averaged over the multi-year periods, university transfers have higher conversion rates over all of
the multi-year periods. But none of the differences, either for single years or over multi-year
periods, are statistically significant. The regression estimates show virtually the same results
after controlling for gender and students’ major field of study.
18
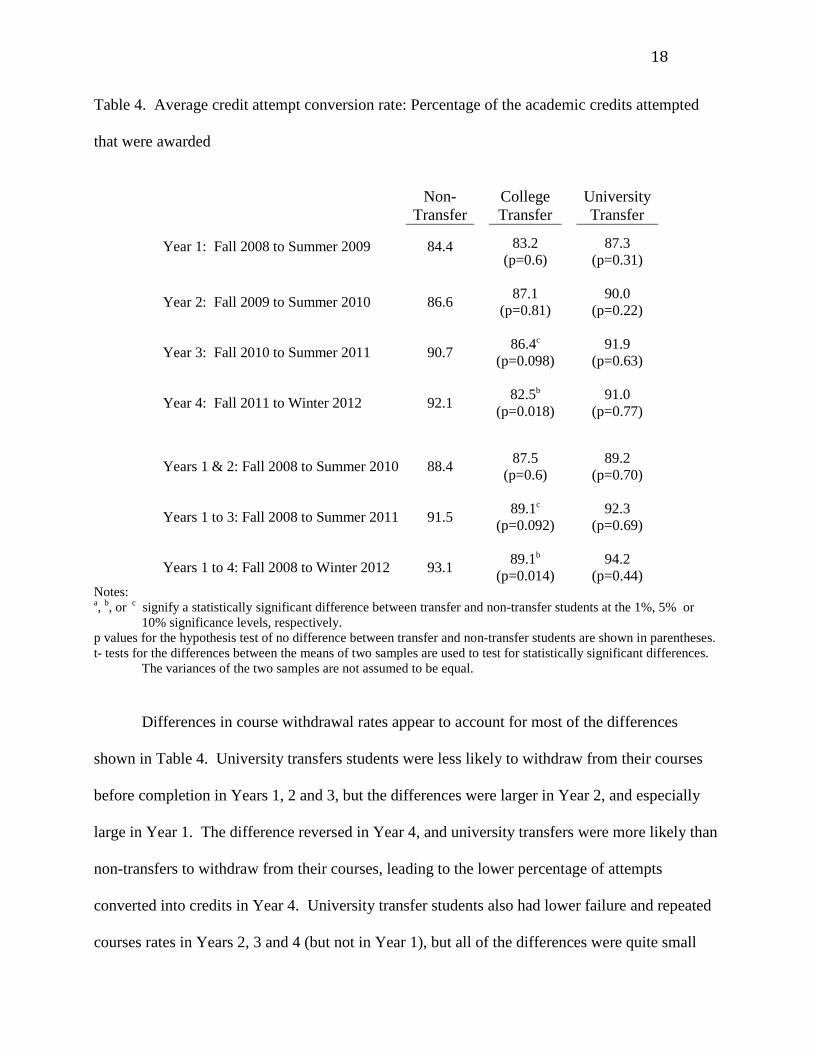
Table 4. Average credit attempt conversion rate: Percentage of the academic credits attempted
that were awarded
Non-
Transfer College
Transfer University
Transfer
Year 1: Fall 2008 to Summer 2009 84.4
83.2 (p=0.6)
87.3 (p=0.31)
Year 2: Fall 2009 to Summer 2010 86.6 87.1 (p=0.81)
90.0 (p=0.22)
Year 3: Fall 2010 to Summer 2011 90.7 86.4c (p=0.098)
91.9 (p=0.63)
Year 4: Fall 2011 to Winter 2012 92.1 82.5b (p=0.018)
91.0 (p=0.77)
Years 1 & 2: Fall 2008 to Summer 2010 88.4 87.5
(p=0.6) 89.2
(p=0.70)
Years 1 to 3: Fall 2008 to Summer 2011 91.5 89.1c (p=0.092)
92.3 (p=0.69)
Years 1 to 4: Fall 2008 to Winter 2012 93.1 89.1b (p=0.014)
94.2 (p=0.44)
Notes: a, b, or c signify a statistically significant difference between transfer and non-transfer students at the 1%, 5% or
10% significance levels, respectively. p values for the hypothesis test of no difference between transfer and non-transfer students are shown in parentheses. t- tests for the differences between the means of two samples are used to test for statistically significant differences.
The variances of the two samples are not assumed to be equal.
Differences in course withdrawal rates appear to account for most of the differences
shown in Table 4. University transfers students were less likely to withdraw from their courses
before completion in Years 1, 2 and 3, but the differences were larger in Year 2, and especially
large in Year 1. The difference reversed in Year 4, and university transfers were more likely than
non-transfers to withdraw from their courses, leading to the lower percentage of attempts
converted into credits in Year 4. University transfer students also had lower failure and repeated
courses rates in Years 2, 3 and 4 (but not in Year 1), but all of the differences were quite small

19
and not statistically significant so they only made small contributions to the differences shown in
Table 4.
E. Differences in number of attempts
• College transfer students attempt fewer credits than non-transfer students in every year. The differences are larger in later years and all of the differences are statistically significant.
• University transfer students attempt fewer credits than non-transfer students in every year
but the differences are not as large as with college transfers. The differences in Years 1, 3 and 4 are statistically significant.
It is clear that the differences in average grades and attempt success rates shown in the
two previous subsections cannot explain why transfer students accumulate so many fewer credits
in each year of their Brock programs. College transfer students were less successful at earning
credits from their attempts in Years 3 and 4, but the difference is not nearly large enough to
explain the differences in total credits completed. Compared to non-transfer students, university
transfers earned more credits from their attempts in most years so lower success or attempt
conversion rates do not account for the fewer credits earned in each year.
The main reason why both types of transfer students complete fewer credits is that they
attempt (enrol in) substantially fewer courses in each year. Table 5 shows the number of credit
attempts over the various years. Only students who attempted at least one course (i.e., were still
attending Brock) in that year are included.
College Transfer Students
Table 5 shows that college transfer students attempt fewer courses in each year, on
average, and the differences are statistically significant. The difference is particularly large in
Year 4 with college transfers attempting 0.83 fewer credits than non-transfer students. The

20
regression estimates show virtually the same results after controlling for gender and students’
major field of study.
It is important to consider whether the smaller number of attempts shown in Table 5 is
due solely to a larger proportion of part time students among college transfers. According to this
scenario, full-time college transfer students attempt the same number of credits as full time non-
transfer students, and part-time college transfer students attempt the same number of credits as
part time non-transfer students. But college transfer students are much more likely to be part-
time students, which makes the overall average number of attempts lower for college transfer
students. Figure 1 shows that.
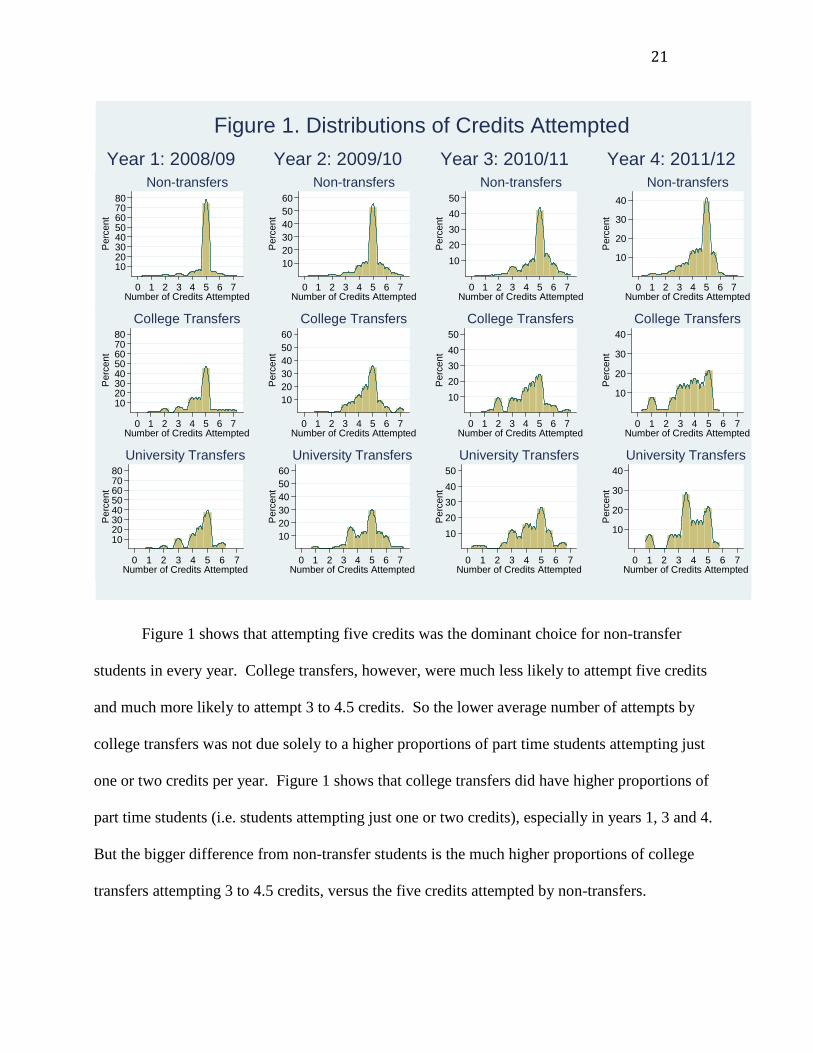
Figure 1 shows the distribution of attempts for each type of student in every year. Note
that the scales showing the percentage of students with each number of attempts (the “y axes”)
vary from year to year, but are the same for each type of student in a given year. Students who
attempted more than seven credits worth of courses are omitted from Figure 1 to keep more
manageable scales on the horizontal axis. It is not difficult to attempt more than seven credits
because the first three years include the spring and summer terms and withdrawals from courses
count as attempts. But only a few students attempt more than seven credits in any year so the
truncation does not affect the results.
21
Figure 1 shows that attempting five credits was the dominant choice for non-transfer
students in every year. College transfers, however, were much less likely to attempt five credits
and much more likely to attempt 3 to 4.5 credits. So the lower average number of attempts by
college transfers was not due solely to a higher proportions of part time students attempting just
one or two credits per year. Figure 1 shows that college transfers did have higher proportions of
part time students (i.e. students attempting just one or two credits), especially in years 1, 3 and 4.
But the bigger difference from non-transfer students is the much higher proportions of college
transfers attempting 3 to 4.5 credits, versus the five credits attempted by non-transfers.
1020304050607080
Per
cent
0 1 2 3 4 5 6 7Number of Credits Attempted
Non-transfers
1020304050607080
Per
cent
0 1 2 3 4 5 6 7Number of Credits Attempted
College Transfers
1020304050607080
Per
cent
0 1 2 3 4 5 6 7Number of Credits Attempted
University Transfers
Year 1: 2008/09
102030405060
Per
cent
0 1 2 3 4 5 6 7Number of Credits Attempted
Non-transfers
102030405060
Per
cent
0 1 2 3 4 5 6 7Number of Credits Attempted
College Transfers
102030405060
Per
cent
0 1 2 3 4 5 6 7Number of Credits Attempted
University Transfers
Year 2: 2009/10
1020304050
Per
cent
0 1 2 3 4 5 6 7Number of Credits Attempted
Non-transfers
1020304050
Per
cent
0 1 2 3 4 5 6 7Number of Credits Attempted
College Transfers
1020304050
Per
cent
0 1 2 3 4 5 6 7Number of Credits Attempted
University Transfers
Year 3: 2010/11
10
20
30
40
Per
cent
0 1 2 3 4 5 6 7Number of Credits Attempted
Non-transfers
10
20
30
40
Per
cent
0 1 2 3 4 5 6 7Number of Credits Attempted
College Transfers
10
20
30
40
Per
cent
0 1 2 3 4 5 6 7Number of Credits Attempted
University Transfers
Year 4: 2011/12
Figure 1. Distributions of Credits Attempted

22
Table 5. Average number of course attempts
Non- Transfer
College Transfer
University Transfer
Year 1: 2008-09 4.86 4.63b
(p=0.011) 4.48a
(p=0.00)
Year 2: 2009-10 4.84 4.63b (p=0.017)
4.65 (p=0.14)
Year 3: 2010-11 4.77 4.18a (p=0.00)
4.29a (p=0.007)
Year 4: 2011-12 4.46 3.63a (p=0.00)
3.81a (p=0.00)
Notes: a, b, or c signify a statistically significant difference between transfer and non-transfer students at the 1%, 5% or
10% significance levels, respectively. p values for the hypothesis test of no difference between transfer and non-transfer students are shown in parentheses. t- tests for the differences between the means of two samples are used to test for statistically significant differences.
The variances of the two samples are not assumed to be equal.
University Transfer Students
The analysis and discussion set out for college transfers, above, holds for university
transfer students as well. The only difference is that the lower number of courses attempted in
Year 2 is statistically significant at only the 15% level.
F. Total Number of Credits Earned, including transfer credits
• On average, college transfer students start their Brock programs with 2.7 transfer credits. • The difference between college transfer and non-transfer students in total numbers of
academic credits narrows each year and falls to zero by Year 4
• On average, university transfer students start their Brock programs with 3.8 transfer credits.
• The difference between university transfer and non-transfer students in total numbers of academic credits narrows slowly each year, but it remains large and statistically significant by Years 4.
Transfer students may choose to attempt and earn fewer credits in each year because they
know that they do not have to earn as many credits as non-transfer students; they already have

23
some transfer credits when they start their Brock programs. If transfer students plan to graduate
after three or four years, as non-transfer students typically plan to do (but usually do not -- see
below), then they do not have to complete as many Brock credits in each year as non-transfer
students.
Figure 2 shows the average total number of credits accumulated after each year, including
transfer credits, for students who attempted courses in each of the preceding years. The shaded
areas shows 95% confidence intervals for the average total number of credits.
College Transfer Students
On average, the college transfer students were awarded 2.7 transfer credits before the start
of the 2008-09 academic year. Thus the left hand graph in Figure 2 shows college transfer
students starting out with 2.7 more credits than non-transfer students. But the difference in the
total number of credits narrows each year as non-transfer students accumulate more credits in
each year. The gap narrows most quickly in Year 4. By the end of the winter term of Year 4,
college transfer students who attempted courses in Year 4 ended up with virtually the same total
number of credits (on average and including transfer credits) as non-transfer students.
University Transfer Students
University transfer students received an average of 3.8 transfer credits before the start of
the 2008-09 academic year. Thus the right hand graph in Figure 2 shows university transfer
students starting out with 3.8 more credits than non-transfer students. As with college transfers,
the gap in total credits narrows each year as non-transfers earn more credits in each year. But
university transfers complete more Brock credits than college transfers, on average, so the gap
narrows more slowly. The higher initial number of credits and the smaller difference in credit
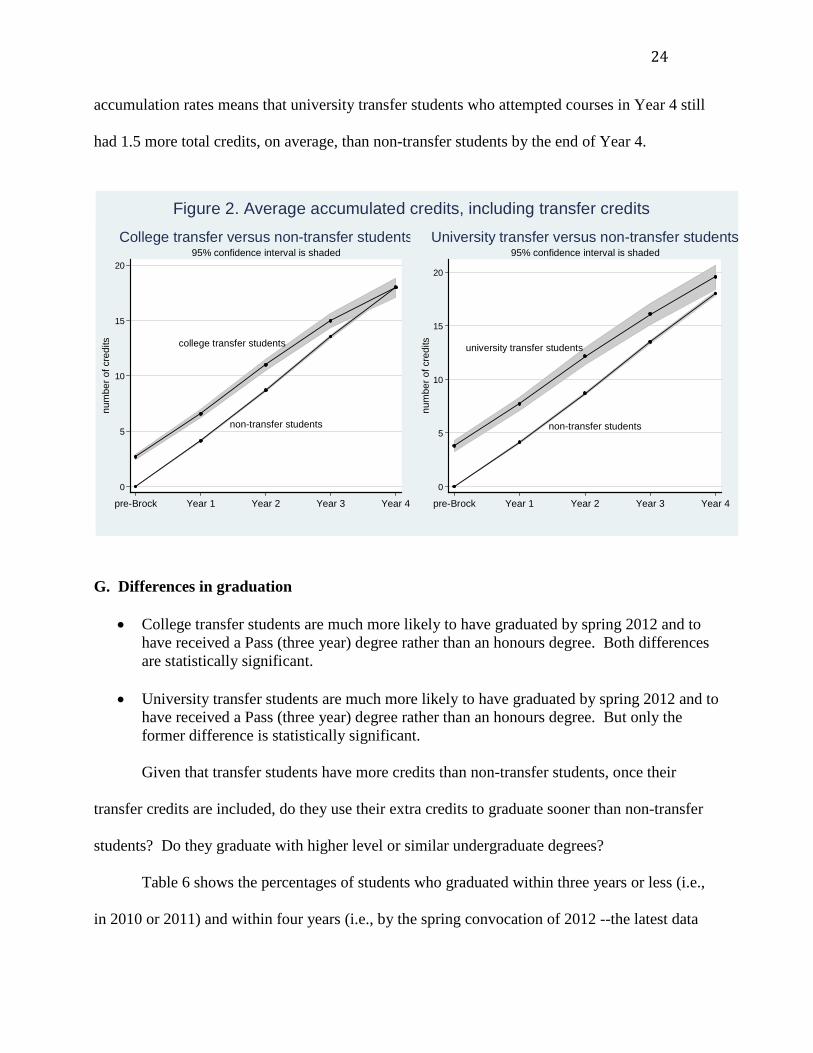
24
accumulation rates means that university transfer students who attempted courses in Year 4 still
had 1.5 more total credits, on average, than non-transfer students by the end of Year 4.
G. Differences in graduation
• College transfer students are much more likely to have graduated by spring 2012 and to have received a Pass (three year) degree rather than an honours degree. Both differences are statistically significant.
• University transfer students are much more likely to have graduated by spring 2012 and to
have received a Pass (three year) degree rather than an honours degree. But only the former difference is statistically significant.
Given that transfer students have more credits than non-transfer students, once their
transfer credits are included, do they use their extra credits to graduate sooner than non-transfer
students? Do they graduate with higher level or similar undergraduate degrees?
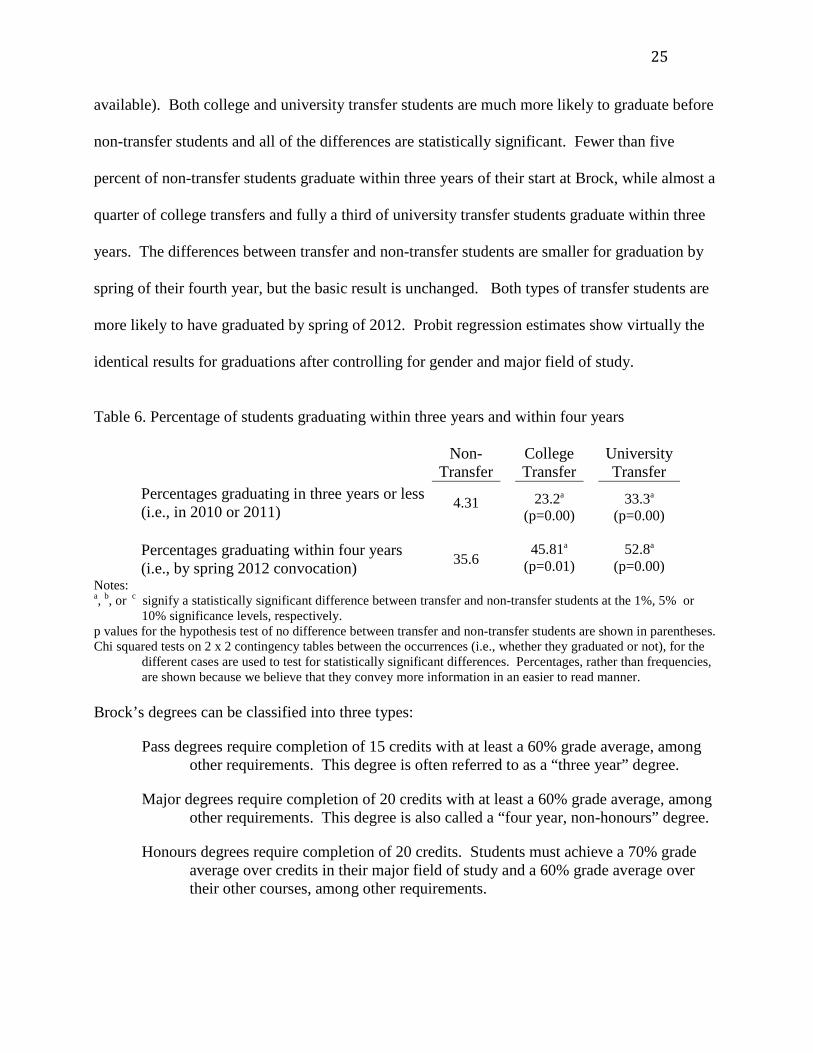
Table 6 shows the percentages of students who graduated within three years or less (i.e.,
in 2010 or 2011) and within four years (i.e., by the spring convocation of 2012 --the latest data
non-transfer students
college transfer students
0
5
10
15
20
pre-Brock Year 1 Year 2 Year 3 Year 4
num
ber o
f cre
dits
95% confidence interval is shadedCollege transfer versus non-transfer students
non-transfer students
university transfer students
0
5
10
15
20
pre-Brock Year 1 Year 2 Year 3 Year 4
num
ber o
f cre
dits
95% confidence interval is shadedUniversity transfer versus non-transfer students
Figure 2. Average accumulated credits, including transfer credits
25
available). Both college and university transfer students are much more likely to graduate before
non-transfer students and all of the differences are statistically significant. Fewer than five
percent of non-transfer students graduate within three years of their start at Brock, while almost a
quarter of college transfers and fully a third of university transfer students graduate within three
years. The differences between transfer and non-transfer students are smaller for graduation by
spring of their fourth year, but the basic result is unchanged. Both types of transfer students are
more likely to have graduated by spring of 2012. Probit regression estimates show virtually the
identical results for graduations after controlling for gender and major field of study.
Table 6. Percentage of students graduating within three years and within four years
Non- Transfer
College Transfer
University Transfer
Percentages graduating in three years or less (i.e., in 2010 or 2011) 4.31
23.2a (p=0.00)
33.3a (p=0.00)
Percentages graduating within four years (i.e., by spring 2012 convocation) 35.6
45.81a (p=0.01)
52.8a (p=0.00)
Notes: a, b, or c signify a statistically significant difference between transfer and non-transfer students at the 1%, 5% or
10% significance levels, respectively. p values for the hypothesis test of no difference between transfer and non-transfer students are shown in parentheses. Chi squared tests on 2 x 2 contingency tables between the occurrences (i.e., whether they graduated or not), for the
different cases are used to test for statistically significant differences. Percentages, rather than frequencies, are shown because we believe that they convey more information in an easier to read manner.
Brock’s degrees can be classified into three types:
Pass degrees require completion of 15 credits with at least a 60% grade average, among other requirements. This degree is often referred to as a “three year” degree.
Major degrees require completion of 20 credits with at least a 60% grade average, among other requirements. This degree is also called a “four year, non-honours” degree.
Honours degrees require completion of 20 credits. Students must achieve a 70% grade average over credits in their major field of study and a 60% grade average over their other courses, among other requirements.
26
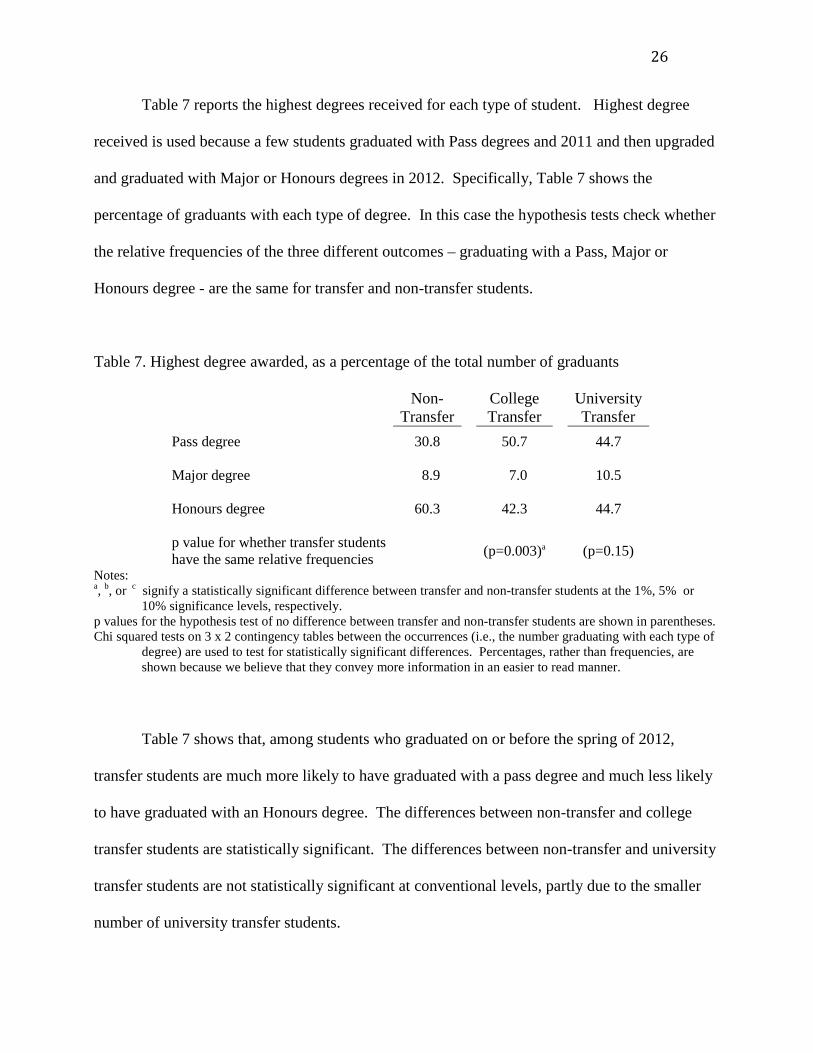
Table 7 reports the highest degrees received for each type of student. Highest degree
received is used because a few students graduated with Pass degrees and 2011 and then upgraded
and graduated with Major or Honours degrees in 2012. Specifically, Table 7 shows the
percentage of graduants with each type of degree. In this case the hypothesis tests check whether
the relative frequencies of the three different outcomes – graduating with a Pass, Major or
Honours degree - are the same for transfer and non-transfer students.
Table 7. Highest degree awarded, as a percentage of the total number of graduants
Non- Transfer
College Transfer
University Transfer
Pass degree 30.8 50.7 44.7 Major degree 8.9 7.0 10.5 Honours degree 60.3 42.3 44.7 p value for whether transfer students have the same relative frequencies
(p=0.003)a (p=0.15) Notes: a, b, or c signify a statistically significant difference between transfer and non-transfer students at the 1%, 5% or
10% significance levels, respectively. p values for the hypothesis test of no difference between transfer and non-transfer students are shown in parentheses. Chi squared tests on 3 x 2 contingency tables between the occurrences (i.e., the number graduating with each type of
degree) are used to test for statistically significant differences. Percentages, rather than frequencies, are shown because we believe that they convey more information in an easier to read manner.
Table 7 shows that, among students who graduated on or before the spring of 2012,
transfer students are much more likely to have graduated with a pass degree and much less likely
to have graduated with an Honours degree. The differences between non-transfer and college
transfer students are statistically significant. The differences between non-transfer and university
transfer students are not statistically significant at conventional levels, partly due to the smaller
number of university transfer students.
27
An important caveat is that only about a third of non-transfer students, and only around
half of transfer students have graduated by spring of 2012 (see Table 6), so the distributions of
highest degrees may change as higher proportions of each type of students graduates.
H. Academic Suspension and the BOOST Program
• College transfer students are not significantly different from non-transfer students in their eligibility for academic suspension, BOOST participation and success, or subsequent suspension.
• University transfer students are less likely to be eligible for academic suspension,
compared to non-transfer students, and the numbers involved are too small to report further statistics.
If students have poor academic results, they are put on probation. Poor academic results
generally means a grade average below 60%, but there are several other conditions and
contingencies. If students continue to perform poorly while on probation then they are put on
academic suspension. Suspended students cannot take courses for one year, but they can restart
their programs (on probation) after the one-year break. In recent years, suspended students have
had the option of enrolling in Brock’s BOOST program. A suspended student who enrols in the
BOOST program does not have to interrupt their studies. Their suspension is revoked and they
can enrol in a reduced load of regular classes in the next fall term as long as they successfully
complete a learning skills program. Students can only enrol in the BOOST program once. If they
continue to under achieve in their courses, after their initial suspension was revoked and after
completing the BOOST learning skills program, then they are suspended and cannot enrol in any
Brock courses for one academic year.
Table 8 shows various statistics related to academic suspension and the BOOST program
for transfer and non-transfer students.

28
Table 8. Academic suspension and the BOOST program
Non- Transfer
College Transfer
University Transfer
Percentage of students eligible for academic suspension and, therefore, eligible for the BOOST program
10.3
10.3 (p=0.98)
4.2c (p=0.09)
Percentage of students eligible for BOOST who enrolled in the program 57.2 56.3
(p=0.94)
Percentage of BOOST participants who successfully completed the learning skills program 90.5 100.0
(p=0.31)
Percentage of successful BOOST participants placed on academic suspension in the next year 32.1 40.0
(p=0.61)
Notes: a, b, or c signify a statistically significant difference between transfer and non-transfer students at the 1%, 5% or
10% significance levels, respectively. p values for the hypothesis test of no difference between transfer and non-transfer students are shown in parentheses. Chi squared tests on 2 x 2 contingency tables between the occurrences (e.g. being eligible for BOOST) are used to
test for statistically significant differences. Percentages, rather than frequencies, are shown because we believe that they convey more information in an easier to read manner.
Table 8 shows that virtually identical percentages of college transfer and non-transfer
students are eligible for academic suspension and the BOOST program. A much smaller
percentage of university transfer students are eligible for suspension and the BOOST program.
The number of eligible university transfers students is so small, in fact, that it is not prudent to
report the subsequent statistics on BOOST participation and success and subsequent suspensions
for that group.
Table 8 shows that BOOST participation rates are also almost identical for college
transfer and non-transfer students. College transfer student have higher completion rates in the
BOOST learning skills program, compared to non-transfer students, but the difference is far from
statistically significant. College transfer students are also more likely to be suspended for poor
academic results after having successfully completed the BOOST program, but again, the

29
observed difference is far from statistically significant. The number of students affected is
generally not large enough to generate statistically significant.
IV. Conclusion
A data set showing Brock students’ course attempts, withdrawal, academic credits, grades,
graduations and other outcomes from the fall term of 2008-09 to the winter term of 2011-12 was
collected. All of the students in the data set started their first year of study at Brock in the fall
term of 2008. The data were used to compare the progress of transfer students from other
universities and community colleges to the progress of non-transfer students in their Brock
programs.
The biggest difference between transfer and non-transfer students is that transfer students
enroll in (attempt) fewer courses in every year. The differences are especially large in the third
and fourth years of study. The smaller number of attempts is the most important reason why
transfer students earned fewer academic credits in each year. In the third and fourth years of their
studies at Brock, transfer students earned anywhere from 0.4 to more than 1.0 fewer academic
credits, on average, compared to non-transfer students.
Of course transfer students also have their transfer credits, in addition to the Brock credits
that they earned. The transfer credits more than offset the smaller number of Brock credits earned
with the one exception of college transfer students in Year 4. Transfer students use the additional
credits to graduate earlier than non-transfer students, on average. Transfer students also graduate
with lower level degrees, which also helps them to graduate earlier. Among students who
graduated in or before the spring of 2012, transfer students were much more likely to be awarded
pass (fifteen credit) degrees rather than honours degrees or degrees with major (20 credit degrees).

30
Aside from the differences noted above, the performance of college transfer students was
very similar to that of non-transfer students over the first two years of study at Brock. This
confirms the Stewart and Martinello (2012) finding that the grades and course withdrawal rates of
college transfer students were similar to non-transfer students in selected first year courses.
College transfer students were not significantly different from non-transfers in their persistence to
the start of Year 3, second year grades, and ability to earn academic credits from their course
attempts in Years 1 and 2, although college transfer students were slightly more likely to
withdraw from courses before completion.
In their third and fourth years, however, college transfer students showed significantly
poorer achievement in their programs than non-transfer students. They were much less likely to
persist to Year 4, even after adjusting for their earlier graduations, and they were much less able
to earn academic credits from their course attempts. Their lower success rates in course attempts
was due to both a greater propensity to withdraw from courses before completion (especially in
Year 4) and from many more failed and repeated courses.
In general, transfer students from other universities had outcomes that were more similar
to those of non-transfer students. Aside from the fewer credits attempted and earned and the
differences in graduations rates noted above, most of the differences between university transfer
and non-transfer students were not statistically significant. This is partly due to the smaller
sample size for university transfer students, but many of the differences were small as well.
University transfer students generally outperformed non-transfer students over the first
three years of their Brock programs. University transfers had higher persistence and average
grades, and they were better able to earn academic credits from their course attempts, mainly due
to fewer withdrawals from courses before completion. The performance advantage reversed in

31
year 4, however, in all of those measures. But again, most of the differences, both positive and
negative, were small and mostly statistically insignificant.
It seems clear that college students who transferred to university are different, on average,
from students who transferred from other universities, and non-transfer students. Although
students transferring to university programs from college were similar to other students during the
first half of their degree studies, they show significantly poorer performance over the final two
years of their studies. Although this variable was not measured in the current sample, it seems
apparent that students transferring to university from college will be older than non-transfer
students given that they have spend two or more years completing a work in a college program.
Other researchers have found that there are other key socio-economic differences between college
transfer and non-transfer students. These include higher proportions of students from lower-
income families, and more students with disabilities, Aboriginal students and first-generation
students in college transfer groups (Kerr, McCloy & Liu, 2010). These differences may account
for the poorer performance amongst college transfer students in their later years. Competing
demands as students move along in their degree programs may result in lower performance
because degree programs tend to become more challenging as students proceed. This may also
account for the fact that college transfer students were more likely than non-transfer students to
graduate with a three-year degree (as opposed to a four-year degree). They may not have had the
socio-economic resources to continue in what would be a fifth, sixth, or even seventh year of post
secondary studies for them.
The rates of academic suspension, participation and success in a remediation program,
and graduation rates with pass degrees all suggest that college transfer students are, in general,
capable of completing degrees in good time. This is important information to consider when
32
determining whether college students should be encouraged to transfer to university. The
evidence suggests that they can, in fact, be encouraged because those who have transferred have
been able to succeed in university courses and graduate. Their poorer performance in Years 3
and 4 and, by extension, their lower likelihood of going on to graduate studies does not detract
from this point.
An important caveat, however, is that the evidence suffers from a self-selection problem.
All of the transfer students in our sample voluntarily chose to transfer, so they may have
systematically different characteristics (possibly unobservable) from other college students whose
academic records also make them eligible for a transfer to university. Estimating the impact of
the self-selection of transfers on the results is an important topic for future work.
As for support for college transfer students, it is notable that academic support programs
in universities are mostly focused on first and second year students, the years when college
transfer students do not appear to require more help compared to non-transfer students. There are
fewer academic support programs targeted at third and fourth year students, which is when
college transfer students have poorer academic results and require more help. Further
investigation needs to be made into the specific types of supports that college transfer students
might need in order to effectively complete their upper-year courses. These could range from
socio-economic and family support for those from lower-income households, to intrusive
academic advising (transfer students had typical academic success in Years 1 and 2 so they may
delay too long before seeking academic advice), to learning skills programs with more emphasis
on higher level academic skills rather than high school remediation, to more support for students
with disabilities and first-generation students. The supports would provide the tools that transfer
students need in order to more efficiently earn degrees at a higher level than it seems they are

33
able to earn at the time of writing. Socio-economic and family support would provide financial
resources, while advising and learning skills support would provide them with the program
knowledge and academic skills base needed to efficiently complete more credits each year. If
college transfer students were to receive these supports, especially in their upper years, they may
find it easier to complete more courses each year and upper-level degrees (i.e., Honours and non-
Honours four-year degrees). In turn, this would allow more college transfer students to have
access to graduate and professional programs.
34
References
An analysis of undergraduate students admitted to York University from an Ontario college of applied arts and technology (CAAT) between 1996 and 2006. College University Consortium Council Website: www.cucc-ontario.ca/www/files_docs/content/pdf/en/oncat_research_reports/oncat_research_reports_16.pdf
Association of Colleges of Applied Arts and Technology of Ontario (2005). Student
mobility within Ontario’s postsecondary sector. Website: http://www.ocutg.on.ca/www/files_docs/content/pdf/en/oncat_research_reports/oncat_research_reports_13.pdf
Bell, S. (1998). College transfer students: A Canadian case. Community College Journal
of Research and Practice, 22(1). Website: http://web.ebscohost.com/ehost/detail?vid=3&hid=18&sid=789067c4-5e96-4ae6-ba2a-2fc85337eb5d%40sessionmgr14&bdata=JnNpdGU9ZWhvc3QtbGl2ZSZzY29wZT1zaXRl#db=aph&AN=493762
Brock Office of Institutional Analysis. Brock University. Website: http://brocku.ca/finance/faculty-and-staff/institutional-analysis Craney, G. (2012). College credit transfer & collaboration at York University. Student
Pathways in Higher Education Conference proceedings (www.cucc-ontario.ca/www/index_en.php?page=student_pathways_conference_recap)
Embelton, S. (2008). A decade of history: Comparing Ontario secondary and college (CAAT) transfer students at York University. Website: www.pccat.ca/storage/pccat2008/presentations/york.pdf
Kerr, A., McCloy, U., Liu, S. (2010). Forging pathways: students who transfer between
Ontario colleges and universities. Higher Education Quality Council of Ontario. Website: http://books2.scholarsportal.info/viewdoc.html?id=/ebooks/ebooks0/gibson_cppc/2011-03-23/1/10443684#
Measuring the Success of College Transfer Success at Nipissing University, 1994-2005.
(2007). College University Consortium Council Website: www.cucc-ontario.ca/www/files_docs/content/pdf/en/oncat_research_reports/oncat_research_reports_17.pdf
Menard, K., Liu, Y., Zhang, J., Kielar, M. (2012). A longitudinal analysis of the college
transfer pathway at McMaster. Student Pathways in Higher Education Conference proceedings (www.cucc-ontario.ca/www/index_en.php?page=student_pathways_conference_recap)
Policy statement for Ontario’s credit transfer system. Ontario Ministry of Training,

35
Colleges and Universities Website: www.tcu.gov.on.ca/eng/eopg/publications/CreditTransferE.pdf
Stewart, J. & Martinello, F. (2012). Are transfer students different? An examination of
first year grades and course withdrawals. Canadian Journal of Higher Education, 42(1). 1-24.