Embed Size (px)
Citation preview

DI
SC
US
SI
ON
P
AP
ER
S
ER
IE
S
Forschungsinstitut zur Zukunft der ArbeitInstitute for the Study of Labor
Still Not Allowed on the Bus:It Matters If You’re Black or White!
IZA DP No. 7300
March 2013
Redzo MujcicPaul Frijters
Still Not Allowed on the Bus:
It Matters If You’re Black or White!
Redzo Mujcic University of Queensland
Paul Frijters
University of Queensland and IZA
Discussion Paper No. 7300 March 2013
IZA
P.O. Box 7240 53072 Bonn
Germany
Phone: +49-228-3894-0 Fax: +49-228-3894-180
E-mail: [email protected]
Any opinions expressed here are those of the author(s) and not those of IZA. Research published in this series may include views on policy, but the institute itself takes no institutional policy positions. The IZA research network is committed to the IZA Guiding Principles of Research Integrity. The Institute for the Study of Labor (IZA) in Bonn is a local and virtual international research center and a place of communication between science, politics and business. IZA is an independent nonprofit organization supported by Deutsche Post Foundation. The center is associated with the University of Bonn and offers a stimulating research environment through its international network, workshops and conferences, data service, project support, research visits and doctoral program. IZA engages in (i) original and internationally competitive research in all fields of labor economics, (ii) development of policy concepts, and (iii) dissemination of research results and concepts to the interested public. IZA Discussion Papers often represent preliminary work and are circulated to encourage discussion. Citation of such a paper should account for its provisional character. A revised version may be available directly from the author.

IZA Discussion Paper No. 7300 March 2013
ABSTRACT
Still Not Allowed on the Bus: It Matters If You’re Black or White!*
We employ a natural field experiment to study the extent and nature of racial discrimination in Queensland, Australia. Mimicking the historical case of Rosa Parks who was denied seating in a bus because she was black, an important moment for the U.S. civil rights movement, we sent trained testers who differed in ethnic appearance to bus stops asking the driver for a free ride on the basis that their bus pass was faulty (which it was). In total, we obtained 1,552 observations of testers either allowed a free ride or not, in each case recording the characteristics of the bus driver, the tester, and the circumstances. We find strong evidence of discrimination against black-skinned individuals. In the baseline scenario, white testers were accepted during 72% of the interactions versus only 36% for black testers. Indian testers were let on 51% of the time and Asian testers (mainly Chinese) were let on 73% of the time. Favors were more likely to be granted when the bus driver and tester were of the same ethnicity, and when there were fewer people in the bus. Patriotic appearance matters in that testers wearing army uniforms were accepted at a rate of 97% if they were white and 77% if they were black. Status appearance also mattered in that black testers dressed in business attire were just as likely to be favored as casually dressed white testers. When bus drivers were confronted with hypothetical baseline scenarios using photos taken of the real testers, 86% responded they would let on the black individual, more than double the actual number accepted, indicating dishonest self-reporting on this topic. JEL Classification: C93, J15, J71, D03 Keywords: racial bias, discrimination, natural field experiment, prosocial behavior Corresponding author: Paul Frijters University of Queensland School of Economics Level 6, Colin Clark Building St Lucia, Brisbane, Qld 4072 Australia E-mail: [email protected]
* We thank Myra Yazbeck for helpful comments.

1 Introduction
In 1955, Rosa Parks defied the legal restriction that black people had to give bus seating pref-
erence to white people, an act of civil disobedience that became a rallying cry for the U.S.
civil rights movement. The choice of the white bus driver to enforce the rules of the company,
rather than let Rosa Parks sit, was interpreted as an act of racism.
Sixty years on, despite the Civil Rights Act of 1964 and the election of the first black pres-
ident of the United States in 2008, an active body of literature still investigates the presence
of a ‘taste for discrimination’ and analyzes the channels via which this discrimination may
affect individual choices and outcomes.1 Whilst most empirical studies find white males to
have better market outcomes than others, such differences themselves may not necessarily be
a consequence of any conscious dislike of one group by another, but rather the outcome of an
economic calculus based on real differences between groups in market-relevant characteristics.
This has lead to the use of natural field experiments in which the economic gains and losses
are held constant, but where subjects have the discretion on whether or not to grant favors to
people with different appearances.2
The present study recreates a facsimile of Rosa Parks’ experience. Our setting is Queens-
land, Australia, which has gone through very similar legal changes as the American south. In
1955, black Aboriginals were not entitled to vote in Australia, and were only granted the vote
in 1963. It still took 10 years after that for the ‘white Australia policy’ to end, under which
only white immigrants were let into the country. Within Australia, the state of Queensland was
the most vociferous opponent of this move towards legal equality and, similar to the U.S., the
health and job market situation of non-whites in Queensland is considerably worse, raising the
question whether there is still a remaining taste for discrimination in the public sector.3
The natural field experiment we exploit is that of a bus driver who has the opportunity to
provide a favor to an individual passenger that goes against company policy. In the baseline
1Altonji and Blank (1999) provide a general survey covering many decades of labor market research, withLang and Lehmann (2012) discussing the more recent evidence. Fryer (2011) presents an overview of the per-sistent black-white gap in a number of socioeconomic outcomes, while Fryer and Katz (2013) examine the use ofrandomized experiments in measuring the effectiveness of public policy interventions on racial inequality.
2List and Rasul (2011) summarize the growing number of studies using field experiments to examine racialbias, and Zitzewitz (2012) reviews the forensic economic literature on this topic.
3The state of Queensland was also home to the anti-immigrant One Nation party of Pauline Hanson, gar-nishing 22.7% of the votes in the state elections of 1998. On current disparities, see the Australian Social Indi-cators report: http://www.socialinclusion.gov.au/sites/www.socialinclusion.gov.au/files/publications/pdf/compendium-of-si-indicators.pdf.
1

scenario, we assign trained testers (from different ethnic, gender, and age groups) to board
public buses where they present an empty travel card and subsequently ask the bus driver if
they can have a free ride to a bus stop that is an average distance away. Whilst the public bus
company’s official rules are not to provide a service free of monetary charge, we find that more
than half of the monitored bus drivers do grant such a favor.
In a perfectly functioning market, we would not expect to observe any difference across
racial/ethnic groups in services since those groups that get a worse treatment on average
would turn to different providers. Becker (1957) defines racial discrimination in functioning
markets as a ‘taste for discrimination’ wherein employers or clients receive a negative utility
when employing or transacting with people from another race. Such a taste can predispose
employers to reward black employees less than white employees for the same work. It could
also influence customers as they might become less willing to pay a black supplier of a good or
service. Becker argues that, in a perfectly functioning market economy, the non-discriminatory
employers, including those of the same race, can undo the effects of the racist employers by
setting up all-black firms, whilst intermediaries may overcome any bias amongst customers
by minimizing contact between clients and black suppliers. Any remaining discrimination in
perfectly competitive markets would then have to be due to actual observed or unobserved
productivity differences rather than tastes.
The mechanisms via which productivity differences between whole groups can affect the
treatment of individuals in both perfect and imperfect markets have been heavily researched
since Becker (1957). For example, Knowles et al. (2001) point out that if blacks on average
are more likely to be involved in crime, then it is an efficient use of finite police resources to
put relatively more police monitoring on black individuals. Similarly, if black workers are on
average less productive either due to lower productivity or simply due to greater difficulty in
ascertaining their productive skills, then it becomes not just rational to prefer a non-black job
applicant over an otherwise equivalent black one (Arrow 1973), but even to discriminate job
applicants on black-sounding names.4 Such statistical discrimination, in turn, may influence
members of the targeted race in making prior life choices that reduce their later life produc-
tivity, making the discrimination self-fulfilling (see Fang and Moro (2011) for a survey of the
many different theoretical mechanisms proposed).
The non-racist intermediaries can only overcome discriminatory tastes if it is possible and
4See Fryer and Levitt (2004) for a study that examines the effect of distinctively Black sounding names onindividual economic and social outcomes.
2
relatively costless to avoid direct contact. Thus, a true taste for discrimination can still have
a real effect when there is some market failure that prevents non-discriminating intermedi-
aries to arise between the discriminated group and the discriminating population. Prominent
amongst the potential market imperfections that rule out intermediaries, are returns to scale
that lead to single natural monopolies in human services catering simultaneously for the ma-
jority group as well as minority groups. The public sector constitutes a prime example of the
aforementioned scenario. Since it is inefficient to duplicate basic public activities like policing
or taxation, a taste for discrimination in the midst of public sector employees is hard to avoid
for the individual members of a discriminated group as, by design, services are personal and
allow only a limited role for intermediaries. More generally, the racism of the monopolizing
group is hard to avoid in the presence of natural monopolies in important services, such as
health, education, and public transport, for which the substitutes are imperfect. Legal institu-
tions might prevent the racism from being overt, but cannot prevent racist tastes from having
repercussions in situations where the service worker has discretion.
The situation of a bus driver being in a position to provide a favor to a stranger of a par-
ticular race and appearance allows us to examine whether there is a taste for discrimination
without the confounding influence of many other factors. Primarily, there is no direct produc-
tive relation between the bus driver and potential passenger, meaning that any observed or
unobserved productive characteristics should have no role in individual decisions. This is an
advantage over other natural field experiments that involve either some work relation, such as
job applications (e.g., Bertrand and Mullainathan 2004), or some degree of possible payment
such as the interaction with taxi drivers (e.g., Balafoutas et al. 2012; Castillo et al. 2012).
Another advantage of our design is that the observed transaction is simple enough to en-
sure the repeated situations are comparable. Our testers were strictly instructed in what to say
and also to refrain from emotive non-verbals, with random checks implemented by the experi-
menters in order to ensure that these instructions were followed. With around 32,000 different
bus drivers employed in Queensland, 72.8 million individual bus trips recorded in 2012, and
63,000 weekly available bus services, it was possible to conduct a large number of repeated
interactions without running the risk of substantially altering the aggregate environment for
individual bus drivers or bus routes.5 This advantage is not present in other field studies that
5These figures are obtained from official reports on public transport services in Brisbane (Queensland). Thebus service and passenger turnover information can be found at: http://translink.com.au/resources/about-translink/reporting-and-publications/2011-12-annual-report.pdf. The bus driverdata is from: http://video.news.ninemsn.com.au: “Shocking bus driver figures revealed” (March 2012).
3

involve a noticeable proportion of the (local) population, or require a lot of time.
The results show that bus drivers grant favors in almost 65% of all observed interactions.
Our baseline treatment reveals that black and Indian testers are much less likely to be accepted
by bus drivers than white Caucasian or Asian testers, and that, in general, bus drivers are more
likely to provide favors to people of the same race or ethnicity as themselves. Given that the
baseline treatment suggests an importance of in-group favoritism based largely on skin color,
we then vary the circumstances of the situation in the direction of moving the members of
the ‘out-group’ to the ‘in-group’. One prominent hypothesis arising from the strong reciprocity
arguments of Fehr et al. (2002) and Fong et al. (2006) is that ’in-groups’ are partially based on
expectations of general reciprocity towards others and society, giving a role for the appearance
of wealth, trustworthiness, and group symbols. To this end, we implement two main experi-
mental treatments. First, to ascertain the role of wealth and hence material status, we dress
our testers in business suits and have them carry a briefcase, with the assumption that better
dressed help-seekers are more likely to receive the favor. To see whether our black and Indian
testers looked particularly threatening or untrustworthy, we additionally perform a random
survey of the population whereby we ask passers-by to rate actual photographs of the testers
by denoting a level of attractiveness, trustworthiness and aggressive appearance. Second, to
ascertain the importance of group symbols, we allow testers to wear the national army uniform
for a subset of interactions, where the army is very popular in Australia and soldiers are seen
as defenders of the country.
As a follow-up to the field study, we conducted a complementary survey of random bus
drivers at appropriate resting stations across the city. The survey depicted a hypothetical ver-
sion of the same help-seeking scenario as that in the main study, whereby each bus driver was
shown a color photograph of the real tester and asked if they would be willing to accept the
person onto the bus without any monetary payment. The stated responses uncover the op-
posite to the actual behavior observed in the field: more black and Indian testers were given
hypothetical free rides than white testers. When asked which reasons were most important
for their decision, the least mentioned motive was whether the bus driver could relate to the
help-seeker. Instead, official company rules were overly mentioned as the primary reason for
denying a favor.
This paper contributes to the current literature on racial discrimination and natural field
experiments by establishing the existence of a racial bias in face-to-face prosocial behavior
amongst a particular group of public service providers. To our knowledge, this is the first
4

such study on bus drivers’ racial preferences since the Rosa Parks incident took place some
sixty years ago, and the largest non-invasive natural field experiment involving public service
providers to date. By observing the social interaction in a natural environment, varying the
group characteristics, and performing follow-up surveys of the decision makers as well as the
general population on key aspects of the choice scenario, we add to the few recent studies that
combine field experimental data with survey evidence to uncover the individual psychology of
the decision makers (see Balafoutas et al. 2012; Gneezy et al. 2012; Zussman 2012).
The rest of the paper proceeds as follows. Section 2 provides a brief overview of related
studies. Section 3 describes the experimental design and participants in detail. In Section 4 we
present the main results on the outcomes of majority and minority ethnic groups, as well as the
overall level of in-group bias. The effects of our experimental treatments on any found racial
bias are then discussed, followed by the results from the complementary survey of decision
makers. Section 5 concludes.
2 Related Literature
Within economics, the group of studies that comes closest to identifying a taste for discrimi-
nation is that based on natural field experiments, where potential discriminators are observed
in their natural environment and importantly are not aware of their participation (Harrison
and List 2004). This experimental method can be divided into two leading forms: ‘audit’ and
‘correspondence’ studies.
In correspondence studies researchers create and send out fictional resumes to potential
employers that have recently posted a vacancy, and then compare the associated call-back rates
for particular demographic groups defined by gender, race, or ethnicity. Examples from both
North America (Bertrand and Mullainathan 2004; Oreopoulos 2011) and Australia (Booth et
al. 2012) confirm a strong employer preference for Caucasian names and profiles. An inherent
disadvantage of these studies, however, is that in many instances it becomes quite difficult to
rule out the presence of statistical discrimination.6 Also, without any face-to-face interaction
between the employer and job applicant, the cues triggering discriminatory behavior are by ne-
cessity impersonal in correspondence studies. The emotional causes and effects of one-on-one
discriminatory behavior observed by both the discriminator and recipient are then potentially
6See, for example, Bertrand and Mullainathan (2004) and List and Rasual (2011) for a more detailed discus-sion about this issue.
5

quite different. Audit studies, on the other hand, involve assigned actors or testers transacting
with targeted others in actual market and social settings; for example, by purchasing of a par-
ticular good or service (List 2004; Gneezy et al. 2012), or simply asking for some help (Gneezy
et al. 2012).
To better understand the nature of discrimination, researchers have recently combined
audit studies with specific field experimental treatments, taking any associated convergence in
group outcomes as evidence of statistical rather than taste-based discrimination (see, e.g., List
2004; Doleac and Stein 2010; Castillo et al. 2012; Gneezy et al. 2012). Such studies have
also minimized the potential for actor-induced bias (see Heckman 1998) by looking at very
standardized interactions, such as seemingly unobserved charitable giving in the presence of
different social cues (Andreoni et al. 2011; DellaVigna et al. 2012); bargaining and fraud in
credence goods markets (Currie et al. 2011; Balafoutas et al. 2012; Castillo et al. 2012); and
social discrimination in the marketplace (Gneezy et al. 2012).
Gneezy et al. (2012), for example, perform a series of natural field experiments to test
for discriminatory behavior (across age, gender, race, sexuality, disability) in various market
and social settings, including the car repair and sales markets as well as information markets.
In the latter scenario, the authors monitor helping behavior on the city streets of Chicago in
the form of strangers providing directions, picking up and returning misplaced pens or keys,
and giving change for a dollar bill to the assumed help-seekers. Such standardized and short
personal contacts allow the authors to minimize their reliance on the actors to behave the same
across repeated interactions. Overall, Gneezy et al. report evidence of a racial bias towards
black help-seekers as well as some indication of racial group loyalty, with the subjects being
more likely to assist help-seekers of the same race. Using external data on criminal activity, the
authors suggest the observed inferior treatment of black help-seekers to be potentially based
on statistical motivations operating through perceptions of fear.
In the context of public services, the main findings on racial bias do not come from field
experiments but rather naturally-occurring data, namely documented legal cases and police
searches. Glaeser and Sacerdote (2003), Alesina and La Ferrara (2010), Shayo and Zuss-
man (2011), and Anwar et al. (2012) look at the importance of the racial characteristics of
defendants and jury compositions in the likelihood of convictions as well as the severity of
punishments, with most of the studies finding a strong degree of in-group bias in the form of
favoritism towards the own racial group. Similarly, Knowles et al. (2001), Anwar and Fang
(2006), and Antonovics and Knight (2009) find evidence of same-race preferences elicited by
6

police officers during motor vehicle stops and searches, with officers being significantly more
likely to undertake a search if their own race and the motorist’s race differ. The latter group of
studies also shows mixed evidence of racial prejudice in the public sector.
Our implementation of a large-scale natural field experiment within the public sector adds
to the above literature by combining the most desirable elements of the experimental method
(randomization) and naturally occurring data (realism) to shed light on the existence and
underlying source of racial discrimination among public service employees.
3 Field Experiment
3.1 Experimental Design
Our experimental design involved a set of testers who boarded a public bus in the city of
Brisbane, Australia, in possession of a bus travel card with a preset balance of zero dollars.
This ‘Go’ card (see Appendix A) would be blue in color, indicating that the holder was over
18 years old. After scanning an empty card on entrance, the ticketing system automatically
displays a red flashing signal along with a loud sound that informs both the individual and the
bus driver that the card is empty, requiring the individual to either pay for the intended trip
in cash or otherwise exit the bus. At the time of the experiment, the price of the bus ticket
was $4.50 AUD for travel within a single zone of the city. The general social interaction is
illustrated in Figure 1.
In our design, the testers made a solitary statement to the bus driver after scanning their
travel card: “I do not have any money, but I need to get to the [XX] station”. The ‘XX’ station
would refer to a stop that was not within close walking distance for the individual, but around
two kilometers away. This medium-range distance was chosen to avoid bus drivers rejecting
testers due to the required traveling distance being either too short or too long. Following this
statement, the bus driver is then left with a ‘Let on / Do not let on’ decision. If the tester is let
on (accepted), he or she enters the bus and records this decision, along with a number of other
observable subject and field characteristics. Otherwise, the tester exits the bus and records the
same set of decision-related characteristics while waiting for the next bus to arrive.
Testers were given strict instructions to communicate the above statement using their
normal-sounding voice, maintain an even demeanor, and not to argue over an unkind re-
sponse or any other remarks made by the bus driver. To ensure consistency across testers, we
7

employed undercover research assistants to observe selected interactions between the testers
and bus drivers during their early and final interactions.
In terms of the legal situation, the employment agreement between bus drivers and their
employee, the state government, forbids drivers to offer bus trips free of monetary charge,
unless the individual is underage in which case the bus travel card has a different color than
for overage passengers; meaning that the subjects could tell from the specific travel card used
that our testers were not underage. A driver who allows a tester to board the bus without prior
payment is then breaching his or her employment contract and displaying prosocial behavior.
Bus stations in Brisbane usually see new buses arrive every 5 to 15 minutes, and have mul-
tiple platforms and routes which individuals can take, making the waiting time of a ‘rejected’
tester relatively short and enabling them to record between 6 and 8 observations per hour.
The testers were allowed to consider either a ‘sequential’ or ‘circular’ route when collecting
the data, where testers can either travel solely between two bus stations or make a long circle
departing and entering at many stations.
Testers were informed in smaller group meetings, during which they could only observe a
few of the other testers, that they would be participating in “an experimental study” carried out
by a group of economists, and were not made explicitly aware of our main objective of detect-
ing racial discrimination. This avoids the common problem of audit studies that testers could
go into the field and find what the researcher may have wanted them to find (see Heckman
1998).
Figures A2 and A3 of Appendix A present maps of the Brisbane city bus network, where
around 78.2 million annual bus trips are made by travelers on 63,859 available weekly ser-
vices, operated by the 32, 000 registered bus drivers across the state region. Employed bus
drivers are assigned a different bus route to follow on a daily basis as part of the internal roster
system, adding further to the randomization of tester-subject interactions. Our field experi-
ment was conducted within zones 1 to 4 (see Figure A3), with a majority of the interactions
taking place inside the first three greater city areas (bounded by the suburbs of Chermside
(North Brisbane), Sunnybank (South Brisbane), Carindale (East Brisbane), and Indooroopilly
(West Brisbane)). Testers were shown several examples of bus trips and distances between
particular stations that were acceptable for the study, after which they were assigned different
bus routes and times to follow, with enough variation to capture different regions of the city
and at the same time minimize the possibility of multiple testers encountering the same bus
driver during the same period of time. Moreover, each tester was told to avoid approaching
8

the same subject more than once.7
3.2 Participants
In total, 29 testers participated in the field experiment between May 2011 and June 2012,
consisting of students from various faculties at the University of Queensland in Brisbane as
well as non-student members of the outside community. These individuals were recruited via
announcements during lecture and tutorial classes, and by word-of-mouth from already partic-
ipating friends. The average tester was 23.6 years of age, with the youngest and oldest person
being 19 and 32 years old, respectively (see Table 1). In terms of racial/ethnic background, 6
of the testers were White (White- Australian, American, European); 12 were Asian (Chinese,
Malaysian, Japanese); 6 were Indian (Sub-continental); and 5 were identified as Black (In-
digenous Australian, African, African-American, Pacific Islander). There were 3 females and 3
males in the white group; 6 females and 6 males in the Asian group; 2 females and 4 males in
the Indian group; and 2 females and 3 males in the black group.
In addition to the main decision variable, the testers recorded a set of observable bus
driver and field characteristics. The former included the gender, perceived age, and race of
the bus driver. The field-specific variables noted were the time of day (day or night), weather
conditions (sunny, cloudy, raining), and an indicator of passenger numbers to proxy the degree
of social scrutiny experienced by the decision maker. Table 1 summarizes these variables in
more detail. As expected, the bus driving profession is male dominated, with only 16% of
the sampled drivers being female. There were also slightly more mature-aged drivers present
(59%) than young ones (41%). In regards to racial/ethnic background, the large majority of
observed drivers were white (79%); 10% were Asian; 6% were black; and 5% were Indian.
Table 1 also contains subjective measures of tester appearance, which has been found in
previous studies to have a marked effect on the behavior of agents in market transactions
(Hamermesh 2011); namely tester beauty, aggression and trustworthiness. In terms of beauty,
each tester was rated on a scale from 1 (very unattractive) to 7 (very attractive) by 40 random
raters looking at a photograph of the tester. Raters were recruited amongst students and staff
members on campus grounds at the University of Queensland. They were on average 24 years
of age, and included 19 whites, 10 Asians, 7 Indians, and 4 blacks. Raters were also told to
7After interviewing each of the 29 testers, only two individuals stated that they had encountered the samedriver on two separate occasions. These testers followed our instructions and did not board the given buses.
9

consider a rating of 4 as the average level of beauty within the population, so as to ensure that
they would vary their answers amongst the presented testers. To avoid any ordering effects on
rater choices, the initial order of tester photographs was reversed for approximately half of the
raters; where we subsequently find no statistical differences across mean ratings based on the
order of presentation.
As reported in Table A1 of Appendix A, women received higher beauty ratings than men,
and young testers were considered to be slightly better looking than older ones. At the same
time, we find average ratings to be more variable across females than males. These findings
are consistent with existing studies that make use of similar survey instruments and beauty
measures (see e.g., Belot et al. 2012). Overall, white testers were rated as the most attractive
(average rating of 4.39), while blacks were viewed to be the least attractive group (average rat-
ing of 3.54), a statistically significant difference at the 1% level. In terms of tester aggression,
raters perceived men to be more aggressive than women, while blacks were deemed the most
aggressive ethnic group. Similarly, white testers were judged to be slightly more trustworthy
than black testers (0.67 vs. 0.61). Our expectations about the importance of these traits for bus
driver decisions were that, given the usual fairly low degree of interaction between bus drivers
and passengers, as well as the low overall degree of violence in Brisbane, trustworthiness and
aggressive appearances should matter little.8
3.3 Treatments
We implemented two main treatments and realized an unanticipated price shock during the
field experiment. The main experimental treatments concerned clothing, following the recog-
nized effect of clothing on first impressions (Davis and Lennon 1988; Gilovich et al. 2010).
By altering the clothing of our testers we aimed to manipulate the perceived income and pa-
triotism levels of help-seekers. The resulting outcomes are then compared to the baseline
treatment during which the testers wore plain casual clothing (t-shirt and shorts or jeans).
To ensure comparability across different treatments, the same individual testers were used
throughout each variation.
8The city of Brisbane, located in the south-eastern part of the state (Queensland), is ranked amongst thesafer parts of the region as well as in comparison to other capital cities in Australia, with recorded offencesagainst individuals at around 585 per 100,000 persons. See http://www.police.qld.gov.au/services/reportsPublications/statisticalReview/1112/.
10

3.3.1 High Income
In the high-income treatment, we asked selected testers from each racial/ethnic group to wear
a business suit and carry a briefcase, indicating white-collar employment and higher socioe-
conomic status, which itself can also be seen as an informative signal of the productivity and
trustworthiness of potential recipients. While there is laboratory evidence suggesting that un-
selfish subjects tend to mainly help low-income individuals in situations where trust plays little
role (Fehr and Schmidt 1999; Bolton and Ockenfels 2000; Charness and Rabin 2002; Gantner
and Kerschbamer 2011), the bus drivers in our context might be more concerned with whether
or not they believe the testers and if they feel the tester belongs to the in-group, both of which
are likely positively correlated with higher status (Frijters 2013).
3.3.2 Patriotism
We manipulate perceptions of help-seeker patriotism by having testers assume the role of mem-
bers from the national defense force, i.e. wear a replica of the Australian army uniform. Such
an explicit signal of membership to the country’s defense institutions could motivate prosocial
behavior in a number of similar ways. Firstly, it can be seen as a symbol of accepting the cul-
ture of Australia to the point of being willing to defend it, triggering a reciprocal response from
the bus driver if the bus driver sees himself or herself as part of the protected group. Secondly,
being employed by the national army is an informative signal about a person in that the army
does not let in individuals with a major criminal history or mental imbalance.9 In terms of
how wearing an army uniform might affect the outcome gap between racial/ethnic groups,
the first mechanism mentioned above would lead to a strong reduction in this gap as an army
uniform would confer in-group status. The second would lead to a reduction in the racial gap
proportional to the importance of the signal: the outcome gap should reduce more for black
testers than for Indian and Asian testers who come from sub-populations with already very low
crime rates.9According to the Australian Bureau of Statistics (2012), criminal offenders born in Nigeria (Africa) have
the highest imprisonment rate (1,079 prisoners per 100,000 adult population born in Nigeria) across Australia.The rate of imprisonment for Aboriginal and Torres Strait Islander prisoners was 14 times higher than the rate fornon-Indigenous prisoners. Moreover, around one-third (32%) of all Aboriginal and Torres Strait Islander prisonerswere sentenced or charged for acts intended to cause injury. On the other hand, both the Indian and Asian groupshave relatively low criminal conviction rates, lower than the rates for whites: less than 3.5% of all prisoners inAustralia are of Asian or Indian origin, while more than 85% are white.
11

3.3.3 Increased Fares
The final experimental variation was exogenous to our design and constituted a 15% increase
in public transport prices as of January 1, 2012. In theory, the higher fares should translate
into lower acceptance rates by subjects due to the increased size of the implicit gift. To test for
this, we compare tester outcomes before and after the price change.
4 Results
4.1 Is there a racial bias in prosocial behavior?
We obtained data on a total of 1,552 social transactions between the bus drivers (subjects) and
our testers. Table 2 reports the mean acceptance rates for each tester and subject racial/ethnic
group. The overall observed rate of acceptance is 64%. This high level of generosity suggests
a notable presence of social preferences. The top panel in Table 2 shows average rates of
acceptance by tester group. White testers were let onto the bus in 77% of the cases, versus 43%
for black testers, a difference that is statistically significant at the 1% level; suggesting a strong
degree of discrimination against blacks. Indian testers were treated similarly to blacks with an
acceptance rate of 57%, also significantly less than white testers (p = 0.00). Asian testers were
accepted 74% of the time, an insignificant difference with that of whites (p = 0.24).
The middle panel of Table 2 presents average levels of acceptance by subject race. Black
bus drivers were on average the most generous group, accepting testers in 72% of the cases,
compared to 54% by Indian bus drivers, and 64% by Asian and white bus drivers. The reported
difference in generosity between black and white subjects is statistically significant at the 1%
level.
In terms of other tester characteristics, we find slight evidence of a gender bias, with males
being accepted 67% of the time compared to 59% for females, a difference that is significant at
the 1% level.10 Young testers were also favored over older testers (0.68 vs. 0.53, p = 0.00), but
this should be taken with caution given the limited age range of our hired testers. As expected,
testers who were rated as being somewhat aggressive received fewer acceptances on average
10There are no found differences in the level of generosity elicited by male and female bus drivers. In a post-experiment interview, however, many of our testers did note that female bus drivers were much more likely toexpress their anger and disappointment following a rejection; mainly reinforcing the fact that travelers mustpurchase a ticket before boarding the bus.
12

than less-aggressive ones (0.57 vs. 0.69, p = 0.00), though perceived beauty had little effect.
At the same time, more trustworthy help-seekers received a higher portion of acceptances than
untrustworthy ones (0.69 vs. 0.60, p = 0.00).
In regards to the field variables, Table 2 shows that the acceptance rate is much higher on
rainy occasions (87%) than on sunny occasions (62%). The acceptance rate is also around 10
percentage points higher at night time. Both when it rains and when it is dark, the value of the
favor to the tester is likely to be seen as higher, even though the cost to the subject is the same,
indicating the importance of prosocial considerations in these interactions. Interestingly, the
average rate of acceptance is 0.11 higher under low social scrutiny than high social scrutiny.11
In Table 3, we present levels of generosity by subject-tester racial/ethnic match. The di-
agonal entries capture interactions between testers and bus drivers of the same type. These
probabilities are suggestive of racial group loyalty, with subjects always favoring testers of
their own race/ethnicity over the others, except for bus drivers of black race who do not seem
to differentiate help-seekers on the basis of race/ethnicity. More precisely, white subjects are
found to discriminate against each of the three minority groups; Asian subjects mainly discrim-
inate against testers of Indian and black race; Indian subjects only discriminate against testers
of black race; while black subjects do not discriminate against any of the four racial/ethnic
groups.
While the above descriptive results provide suggestive evidence of discrimination against
blacks and Indians, as well as within-racial group loyalty, these summary statistics do not
use the other information available about the transactions. The econometric specifications
displayed in Table 4 and beyond are based on the following OLS regression:
Decisioni j = α+ βR j +δRi + γRi j +ηX i j +φZ j +λT j + θT j × R j +µ j + εi j (1)
where the dependent variable is an indicator for whether subject i accepted tester j onto the
bus without any monetary fee. The vectors Ri and R j contain indicators for subject and tester
race/ethnicity, where ‘white’ is the reference (omitted) group, making the point estimate for
β directly interpretable as the estimated probability difference in acceptance between white
11Each bus vehicle is equipped with approximately 40 passenger seats. Thus, a ‘low’ level of social scrutinycaptures the situation when the number of passengers is slightly below half of full seating capacity (<15). Onthe other hand, the ‘high’ social scrutiny situation is recorded when close to half or more of the available seatsare occupied (≥15). Our choice of variable coding is based on simplifying the interpretations made by both ourtesters and the monitored bus drivers regarding passenger numbers.
13
testers and the other groups, interpreted as racial bias. The indicator variable Ri j takes on
a value of one if the subject and tester are of the same race/ethnicity, and zero otherwise.
Evidence of within-group loyalty is then captured by the point estimate for γ. The vector X i j
captures other individual as well as shared subject and tester demographics, such as age, gen-
der, tester beauty, aggression, and trustworthiness. The vector Z j includes a set of field-specific
controls, namely the level of social scrutiny, time of day, and weather conditions. The vari-
ous treatment indicators are contained in vector T j, where the baseline (low income) treat-
ment is the omitted category. Interactions between our experimental treatments and tester
race/ethnicity are in the term T j × R j and are included in later results. Lastly, we allow for
random effects via the term µ j that may pick up elements idiosyncratic to the tester not already
controlled for by the observed characteristics, such as an appearance of health or a particular
facial expression.
Initial linear probability estimates are reported in Table 4, where the number of controls is
gradually increased across each column to provide insights into the robustness of our results.
The estimated probability of acceptance for black testers is approximately 47 percentage points
lower than for white testers (first column), statistically significant at the 1% level, suggesting
the presence of a large racial bias in observed generosity. Importantly, the estimated marginal
effects of the race/ethnicity indicators do not change notably as we include extra controls
for subject attributes and field characteristics. Contrary to the raw statistics, the econometric
estimates imply there to be no significant differential treatment of Indian testers, relative to
white testers (p = 0.30), indicating that the Indian testers had particularly bad draws on the
control characteristics like social scrutiny and weather conditions.
The regression estimates in columns (2) and (3) of Table 4 indicate black bus drivers to
be 14 percentage points more likely than white bus drivers to help testers, consistent with
the descriptive results above. Moreover, there is some evidence of within-racial group loy-
alty, with the predicted probability of acceptance being around 6 percentage points higher
for subject-tester pairs of the same race/ethnicity, compared to subject-tester pairs of differ-
ent race/ethnicity (third column). This result is however only significant at the 10% level,
but broadly in line with a number of related studies such as Antonovics and Knight (2009),
Fong and Luttmer (2009), Shayo and Zussman (2011), Anwar et al. (2012), and Gneezy et
al. (2012). The age of subjects also has a significant effect, with older bus drivers being on
average 6 percentage points less prosocial than younger drivers.
When considering the other attributes of testers, both gender and age are found to be unim-
14

portant for the predicted probability of acceptance shown in columns (1) and (2) of Table 4,
although more mature testers had a 1.2 percentage point higher probability of being accepted
based on the richer specification in column (3). Similarly, neither help-seeker attractiveness
or aggression emerges as statistically significant across the specifications, implying that the
initial differences in acceptance rates between higher and lower aggressive appearance (from
Table 2) were driven by the fact that particular racial/ethnic groups were rated as more ag-
gressive on average. But since the aggression variable attracts a large positive coefficient, we
further examine in Table A2 of the Appendix how this individual trait interacts with tester
race/ethnicity, revealing that the positive effect of aggression is mainly driven by the fact that
the acceptance probability for aggressive black testers is more than two times higher than that
of non-aggressive black testers (0.50 vs. 0.21, p = 0.00), underscoring that it is not perceived
aggressiveness that explains the difference in acceptance rates of blacks versus other groups.
On the other hand, tester trustworthiness has a positive impact on the probability of accep-
tance, with completely trustworthy help-seekers being as much as 57 percentage points more
likely to be favored, relative to completely untrustworthy help-seekers; however the variation
in this measured trait is rather low (standard deviation of 0.14). The estimated effect of trust
is significant at the 1% level only in the full specification presented in column (3) of Table 4.
Moreover, from the extended interaction results in Table A2, we see this effect to be particu-
larly driven by differences within blacks and whites: the difference in mean acceptance rates
between trustworthy and untrustworthy white testers is 0.36 (0.93 − 0.57, p = 0.00), while
the same difference for black testers is equal to 0.28 (0.54 − 0.26, p = 0.00). Asian testers
experienced a much smaller positive gap of 0.06 (0.77 − 0.71, p = 0.07), while untrustwor-
thy Indian testers were accepted at a much higher rate than trustworthy ones (0.66 vs. 0.37,
p = 0.00). Again, the latter raw statistic may well be due to Indian testers being exposed to
relatively unfavorable and varying field measures.
Turning to the field characteristics in column (3) of Table 4, we find positive effects of
worsening weather and daylight on the probability of acceptance. Each of these circumstances
is estimated to increase the acceptance rate on average by 5 percentage points, implying that
the probability of being given a favor is higher when the value of the favor to the person
receiving it would be higher. The effect of social scrutiny is found to be negative, in that
bus drivers act less prosocially by about 6 percentage points when many other passengers are
watching, relative to situations when not many others are around. We explore the latter result
in more detail below.
15

4.2 Does racial bias differ by treatment?
In Table 5 we show the mean acceptance rates by treatment (top panel) and the rates of accep-
tance for different groups by treatment (bottom panel). Both the high income and patriotism
treatments are found to significantly increase the level of acceptance. Testers involved in the
high-income treatment experienced a notable increase in generosity relative to the baseline
case: 0.81 versus 0.60. This difference in means is statistically significant at the 1% level.
Similarly, signaling a high degree of patriotism leads to testers receiving kindness in 89% of
the interactions. There is no found importance for the size of the bus fares.
Comparing the acceptance rates across the two main treatments, we find that the average
level amongst blacks increases from 36% to 67% while wearing a business suit and carrying
a briefcase, a difference that is significant at the 1% level. A similar increase is seen amongst
Indians, from 51% to 83%, whilst Asians experience a slight and insignificant drop from 73%
to 69%, and whites observe their acceptance rate to increase from 72% to 93%. These changes
could be consistent with statistical discrimination if blacks and Indians are considered to be
less trustworthy, a signal that is then overcome by better clothing. In this vein, studies by
Alesina and La Ferrara (2002) and Glaeser et al. (2000) find minority group membership and
low socioeconomic status in terms of income and education to be associated with overall lower
levels of trust. Also relevant is that Glaeser et al. report high-status individuals to elicit more
trustworthiness in others. Nevertheless, our results in Table 4 already control for trustworthi-
ness and reveal that the inclusion of trust (although important) does not significantly alter our
estimate of the extent of racial bias.
The patriotism treatment leads to even higher observed levels of cooperation. Black testers
report an acceptance rate of 77% when wearing the nation army uniform, while the remaining
racial and ethnic groups each entail an acceptance rate of 90% or more. Indian testers realize
a significant increase from 51% in the baseline treatment to 93% in the patriotism treatment.
Asians were accepted at a rate of 90% when displaying a strong devotion to the country, while
whites are found to be favored by subjects in almost every transaction at a rate of 97%. As
with the high-income treatment, these general increases could naively be thought to be com-
mensurate with evidence of statistical discrimination when race is a signal of ‘being a threat’.
However, the particularly strong increase observed for Indian individuals (who have very low
rates of crime) is not consistent with such a story. The pattern of changes in outcomes across
the different races is more compatible with the hypothesis that an army suit is interpreted as
16

an in-group signal by bus drivers. Nonetheless, there still remains a substantial gap between
recipients of black and white race (77% vs. 97%), signifying that even a strong patriotic signal
is not enough to overcome the racial bias.
Table 6 reports the parameter estimates for regressions that relate tester outcomes to the
income and patriotism treatments, as well as the natural variation in the level of social scrutiny.
In all cases, the specifications include added controls that correspond to the full-specification
given in the final column of Table 4. Column (1) of Table 6 presents the main effects, where
we find blacks to be 48 percentage points less likely to be favored than whites in the baseline
treatment (p = 0.00), very similar to the results in Table 4. The estimates also indicate high-
status testers to be on average 14 percentage points more likely to receive help, relative to
low-status testers (p = 0.00). Moreover, the acceptance rate of patriotic testers is predicted
to be 24 percentage points higher than for less patriotic ones (p = 0.00). We interpret these
average treatment effects as demonstrating positive adjustments in bus driver perceptions, and
that our outcome variable measures actual generosity and prosocial behavior, rather than some
other motive or random noise.
The results in column (2) of Table 6 imply that the initial black-white acceptance gap of
0.48 does not change when black testers are dressed in business attire, with the estimated co-
efficient on High Income*Black Tester being insignificant at conventional levels. However, this
point estimate does become statistically significant in the richer specification (final column),
suggesting the racial bias toward blacks to be reduced by 21 percentage points, a finding that is
consistent with the descriptive results. The manipulation of income is however still not enough
to make bus drivers favor blacks over low-status whites. Similarly, we find testers of Indian
ethnicity to realize a 17 percentage point increase in acceptances following the high-income
treatment.
The estimates in column (3) indicate that the observed level of discrimination against
blacks declines on average by 17 percentage points when black testers wear an army uni-
form, and by 13 percentage points for Indian testers. These estimated effects are significant at
the 10% level.
4.2.1 Effect of implicit monitoring on racial bias
An important behavioral dynamic also of interest is how the above found racial bias varies
with the level of implicit monitoring or social scrutiny. Previous studies, such as Parsons et
al. (2011), find the level of racial discrimination elicited by professional baseball umpires
17

to decrease in the number of implicit observers (namely, during well-attended and televised
games). In the present context, social exposure of decision makers is approximated by the
number of other passengers inside or waiting to board the same bus as our tester. From Table 2,
we find the latter measure to have some impact on subject decisions: on average, testers were
accepted during 67% of the low-scrutiny interactions (less than half-occupied bus), compared
to 56% during high-scrutiny interactions (more than half-occupied bus). This difference is
statistically significant at the 1% level.
Moreover, from the interaction results in column (4) of Table 6, we find that each non-white
group is significantly less likely to be accepted by bus drivers when many others are watching,
compared to situations when not many observers are present. The size of these (negative)
marginal effects is around 0.14 and 0.18 for Asian and black testers respectively, while the
effect is found to be strongest for Indian testers, who experience a 23 percentage point decline
in their likelihood of acceptance (p = 0.00). On the other hand, white testers (the omitted
group) have a 10 percentage point higher probability of being accepted when there are many
onlookers (p = 0.05). Social scrutiny then in our context leads to more discrimination. These
results also hold in column (5), where we estimate all treatment and race interaction effects
simultaneously and find only slight changes in the magnitude and statistical significance of
coefficients.
The above findings are suggestive of bus drivers altering their racial preferences further in
favor of the majority group during periods of high implicit monitoring. Such a contrary finding
to other decision-making environments (e.g., Price and Wolfers 2010; Parsons et al. 2011),
where racial biases have been found to diminish in the number of observers, indicates the con-
text under study to be of importance for understanding preferential behavior, and perhaps also
that the type of onlooker matters: according to our testers, the vast majority of bus passen-
gers are white across any of the bus routes used in our experiment.12 Thereby, the observed
tendency of bus drivers to increase their bias against minority ‘out-group’ members (especially,
Indians) when under greater scrutiny, whilst increasing their favoritism towards white testers,
could well reflect the preferences of the in-group observers.
12For privacy reasons and in order not to make bus drivers suspicious, our testers did not take photos of theinteraction environment, which made it difficult for them to systematically ascertain the racial/ethnic mix of otherpassengers.
18

4.3 Complementary survey evidence
To shed light on subject motives, we conducted a complementary survey of random bus drivers
at appropriate resting stations across the city. The survey (contained in Appendix B) was
implemented a few months after our main study and depicted a hypothetical version of the
same help-seeking scenario as that observed during the field experiment. Each bus driver
was shown a color photograph (identical to the one used for tester appearance ratings) of an
actual tester dressed in casual clothing, and asked if they would be willing to let the person
onto the bus without charging a monetary fee, again making it clear that the person’s travel
card was faulty. Following this choice, bus drivers were asked a set of sub-questions that
aimed to capture the psychology behind an acceptance or rejection decision. More specifically,
the respondents were asked to assign varying degrees of importance to specific statements
relating to their perceptions of (1) help-seeker honesty; (2) the impact of their decision on
other passengers; (3) the worthiness or merit of the help-seeker; (4) the propensity of the
help-seeker to cause trouble or harm; and (5) the bus driver’s ability to relate to the help-
seeker in any way. An additional statement (6) was evaluated by those respondents who
decided to reject the hypothetical help-seeker, which aimed to get at the significance that bus
drivers assign to bus company policy. To cover our main aim of studying racial attitudes, we
showed each participating bus driver only one hypothetical scenario involving a help-seeker
from a single racial/ethnic group.
4.3.1 Results
We were only able to collect 108 complete responses before the above survey was boycotted
by the bus company due to the type of (‘prosocial’) question being asked of their employees.13
The race distribution of surveyed bus drivers was similar to that during the field experiment,
with the vast majority of respondents being white (71%); 12% were black; 9% were Asian;
and 7% were of Indian origin. Similarly, most of the responding bus drivers were male (85%).
Overall, the average stated level of acceptance was equal to 69%, a result that is higher than
the 60% observed in our baseline experiment (p = 0.00). Table 7 shows pairwise comparisons
of acceptance rates (by group) across the two methodologies; ‘actual’ versus ‘stated’ generosity.
13Not long after our research assistants began conducting the survey, the bus drivers were strictly instructed bymanagement not to participate in the survey any longer and thus rejected all consequent approaches. Such anoutcome was consistent with bus drivers’ work agreements which stipulate a set monetary price to be charged toall boarding adult passengers.
19

The results suggest, in general, that the stated levels of generosity highly contradict the actual
levels witnessed in the field. Foremost, there is no found racial bias toward the minority groups,
with black and Indian individuals associated with the highest absolute rates of acceptance
(0.86 and 0.76). Moreover, blacks are hypothetically accepted at more than twice the rate
than in the main experiment: 86% versus 43%. Despite the relative low number of responses,
this difference is statistically significant at the 1% level, and highlights the role of subject
awareness in decision making (see Bertrand and Mullainathan 2001). That is, during the self-
reported artificial survey, bus drivers are well-aware that they are being studied by outsiders
and hence alter their choice behavior.
Similarly, the survey results reveal no favoritism on the basis of gender, with men and
women experiencing very similar rates of acceptance. This finding is also inconsistent with
results from the field study during which our female testers received a significantly lower
portion of positive responses than in the hypothetical situation (59% vs. 72%, p = 0.00).
Older help-seekers are found to be favored at a rate of 75% in the hypothetical cases, whereas
the same individuals are favored at a rate of 49% in the field (p = 0.01). Aggressive and
untrustworthy help-seekers were also accepted more frequently in the hypothetical scenario
than in the field.
Bus drivers of black race were still the most generous group, stating the highest relative
level of acceptance (74%), while white bus drivers are found to be much more generous during
the artificial survey than in reality (0.71 vs. 0.60, p = 0.02). Male survey respondents were
significantly more prosocial than female respondents (72% vs. 56%), a finding which also
contradicts the gender-neutrality result reported earlier. Similarly, mature bus drivers were
more giving in the artificial survey than in the field.
Consistent with bus drivers being both race and gender neutral in hypothetical situations,
we find stated generosity to be specifically aimed at help-seekers from different ethnic and
gender groups. Respondents are found to favor opposite ethnicities at a rate of 72% in the
hypothetical situations, compared to only 56% in the real situations (p = 0.00). A very similar
result and level of significance is found for opposite gender matches. Bus drivers’ willingness
to hide any in-group bias also emerges somewhat from the results, with same-race interac-
tions being rewarded notably less in the hypothetical than the actual context (0.62 vs. 0.72,
respectively). This difference is however not significant at conventional levels (p = 0.13).
With regards to the stated reasons for accepting or rejecting testers, 83% of all the sur-
veyed bus drivers indicated help-seeker honesty and ability to cause trouble as being at least
20

‘somewhat important’, while 73% of the respondents broadly judged the shown help-seeker on
the basis of their worthiness. Around 65% of the surveyed bus drivers seemed to care about
the impact of their decisions on other passengers, attaching some level of importance to the
corresponding statement. On the other hand, the ability to relate to the help-seeker was pro-
nounced not to have a major impact on bus driver choices, with 57% of respondents declaring
this variable as strictly ‘unimportant’.
Conditioning the above survey responses on the decision to accept a hypothetical help-
seeker, we again find the decision maker’s beliefs about individual honesty, worthiness, and
propensity to cause problems as the characteristics which attract the highest levels of impor-
tance. Exactly 50% of surveyed bus drivers labeled the perceived worthiness and propensity to
cause trouble as ‘very important’ attributes which they look out for, while an additional 37%
and 40% of respondents viewed these respective traits as also being ‘somewhat important’.
Similarly, around 48% of bus drivers indicated perceived help-seeker honesty as being ‘very
important’ for an acceptance. When eliciting stated generosity, around 17% of respondents
thought that it was ‘very important’ to consider how their decision would affect other passen-
gers, while only 11% stated the ability to relate to the help-seeker as being ‘very important’ for
acceptances.
If we further condition these hypothetical acceptances on recipient race, we find no sig-
nificant differences in the value that respondents assign to the perceived merits of black and
white help-seekers (p = 0.65), with the average levels of importance being equal to 2.45 and
2.59 (on a 1 to 3 scale) respectively. Similarly, bus drivers do not assign higher levels of im-
portance to assumed recipient ‘honesty’ or ‘ability to engage in trouble’ when the help-seeker
in question is of black race, compared to white race (2.00 vs. 2.40, p = 0.20; 2.50 vs. 2.53,
p = 0.91). On the other hand, the subjects do seem to attach slightly higher average levels of
importance to the approval of other passengers when accepting a white individual relative to
a black individual (1.82 vs. 1.36, p = 0.08).
Due to the relatively small sample size at hand, we are unable to perform a similar between-
group comparison exercise in regards to rejection decisions. However, the general findings on
factors stated to be important for rejections are as expected: approximately, 91% of surveyed
bus drivers identified their work agreement (of not allowing individuals to board a bus without
a proper fare) to be of ‘very high’ importance when rejecting a help-seeker. At the same time,
close to 50% of rejecting respondents felt that it was ‘very important’ for the help-seeker to be
perceived as honest. Other issues of average importance for rejection decisions included the
21
fear of upsetting or harming other passengers (73% of bus drivers assigning at least ‘somewhat
importance’). Yet, whether the tester was an undeserving recipient was labeled as ‘unim-
portant’ by 73% of respondents. This apparent large difference between the latter finding and
that for the same statement during hypothetical acceptances, where around 87% of bus drivers
labeled ‘perceived worthiness’ as being important, seems likely driven by strong social desir-
ability effects. That is, we believe the surveyed bus drivers were not willing to express their
true beliefs about the merits of those individuals they rejected due to such responses directly
revealing the type of person (defined by gender or race) that they would potentially discrim-
inate or have prejudice against. In a similar vein, approximately 68% of bus drivers declare
their ‘inability to relate’ to the given individual as being ‘unimportant’ for rejection decisions.
5 Conclusion
On December 1, 1955, in the south of the United States, Rosa Parks was denied a rule-defying
favor by the white bus driver and instead had to endure a refusal. In this paper, we find that in
present-day Queensland, Australia, black individuals are still more than 40 percentage points
less likely than whites or Asians to be favored with a rule-defying free bus ride in situations
when they do not posses a valid public travel card. With a business suit on and briefcase in
hand, both blacks and whites are more likely to receive the favor, with the observed effect on
black and Indian testers being particularly strong: an increase of around 30 percentage points
in acceptance rates, compared to an average of only 10 percentage points for whites and
Asians. The effects of wearing an army uniform are dramatic, with black and Indian testers
suddenly let on more frequently than white testers without army uniforms. Even with such
high signals of patriotism there still remains a significant black-white outcome gap; as almost
97% of white individuals in an army uniform are favored and only 77% of black individuals.
In terms of the nature of this observed racial bias, we failed to find a consistent statisti-
cal discrimination explanation for the findings, with the two most important contenders being
the possibility that bus drivers use race to approximate unobservable levels of criminality or
dishonesty of the different groups. The notion that bus drivers are really just discriminat-
ing against blacks on the basis of the perceived levels of tester aggression fails three specific
tests: (i) all found results are robust to including outsider-evaluated measures of aggressive
appearance, (ii) Indian testers who come from a population that has much lower levels of
criminal convictions than whites are almost equally discriminated in the baseline scenario as
22

black testers and experience an equal average treatment effect when wearing an army uniform
(where the national army selects against criminal convictions), and (iii) in the hypothetical
scenarios bus drivers do not discriminate at all against blacks or Indians, whereas they should
apply the same statistical discrimination to such hypothetical scenarios as in the field.
The notion that bus drivers are discriminating on whether or not they believe the tester to
be lying to them is harder to dismiss at first glance. It is consistent with the strong increase in
acceptance rates among Indian and black testers when wearing a business suit, as well as the
stated importance of honesty within the hypothetical scenarios. Yet it does not explain why
the treatment of groups differs over the type of bus driver, i.e. it would require for black bus
drivers to not suspect anyone of being dishonest; Indian bus drivers to only dismiss blacks as
dishonest; Asian bus drivers to view whites as the only honest group; and white bus drivers to
suspect dishonesty among each of the three other groups.
The story that best fits the observations from our natural field experiment is that existing
groups discriminate against members of racial/ethnic groups deemed less likely than them to
be in the in-group, where clothing is taken as a visual cue of the degree to which particular
individuals belong to this group. Discrimination of out-group members is then rationalized
on the basis of following the rules and distrusting the motivations when not granting a favor,
while believing in the honesty and general deservingness of the recipient when granting a
favor. This is consistent with recent field studies examining both the extent and nature of
racial discrimination in the United States and other countries (e.g., Shayo and Zussman 2011;
Gneezy et al. 2012; Zussman 2012).
In terms of policy-relevance, our most important findings are that local social scrutiny is not
found to lead to more racially equal prosocial behavior. On the contrary, a fuller bus is found
to trigger higher levels of discrimination against the minority groups and greater favoritism
towards the white group, most probably because the majority of on-looking passengers are
also white, thereby increasing the importance of in-group behavior; a finding opposite to that
of Parsons et al. (2011) who find increased levels of monitoring to reduce racial bias in umpire
decisions. Commensurate with this, we do find that when bus drivers are asked by research
assistants what they would do in hypothetical scenarios that they suddenly display gender and
race neutral behavior. Combined, our findings thus cast doubt on the ability of greater social
scrutiny by locals to reduce discriminatory behavior and, instead, leads to the thought that
discrimination by public servants can be reduced either by changing the attitudes of the local
groups or else by social scrutiny from outside.
23

References
Alesina, A. and La Ferrara, E. (2002) Who Trusts Others? Journal of Public Economics, 85,
207-234.
Alesina, A. and La Ferrara, E. (2010) A Test of Racial Bias in Capital Sentencing, working paper.
Altonji, J. and Blank, R. (1999) Race and Gender in the Labor Market, in Ashenfelter, O. and
Card, D. (Eds.), Handbook of Labor Economics, 3, 3144-3259, Amsterdam: Elsevier.
Andreoni, J., Rao, J., and Trachtman, H. (2011) Avoiding the Ask: A Field Experiment on
Altruism, Empathy, and Charitable Giving, working paper.
Antonovics, K. and Knight, B. (2009) A New Look at Racial Profiling: Evidence from the Boston
Police Department, Review of Economics and Statistics, 91, 163-177.
Anwar, S., Bayer, P., and Hjalmarsson, R. (2012) The Impact of Jury Race in Criminal Trials,
Quarterly Journal of Economics, 127, 1017-1055.
Anwar, S. and Fang, H. (2006) An Alternative Test of Racial Prejudice in Motor Vehicle
Searches: Theory and Evidence, American Economic Review, 96, 127-151.
Arrow, K. (1973) The Theory of Discrimination, in Ashenfelter, O. and Rees, A. (Eds), Discrim-
ination in Labor Markets, 3-33, Princeton: Princeton University Press.
Australian Bureau of Statistics (2012) Prisoners in Australia, 2012, ABS cat. no. 4517.0, Can-
berra: ABS.
Balafoutas, L., Beck, A., Kerschbamer, R., and Sutter, M. (2012) What Drives Taxi Drivers? A
Field Experiment on Fraud in a Market for Credence Goods, Review of Economic Studies,
forthcoming.
Becker, G. (1957) The Economics of Discrimination, Chicago: University of Chicago Press.
Belot, M., Bhaskar, V., and van de Ven, J. (2012) Beauty and the Sources of Discrimination.
Journal of Human Resources, 47, 851-872.
Bertrand, M. and Mullainathan, S. (2001) Do People Mean What They Say? Implications for
Subjective Survey Data, American Economic Review, Papers and Proceedings, 91, 67-72.
24

Bertrand, M. and Mullainathan, S. (2004) Are Emily and Greg More Employable than Lakisha
and Jamal? A Field Experiment on Labor Market Discrimination, American Economic Review,
94, 991-1013.
Bolton, G. and Ockenfels, A. (2000) ERC - A Theory of Equity, Reciprocity and Competition,
American Economic Review, 90, 166-193.
Booth, A., Leigh, A., and Varganova, E. (2012) Does Racial and Ethnic Discrimination Vary
Across Minority Groups? Evidence from a Field Experiment, Oxford Bulletin of Economics
and Statistics, 74, 547-573.
Castillo, M., R. Petrie, M. Torero, and Vesterlund, L. (2012) Gender Differences in Bargaining
Outcomes: A Field Experiment on Discrimination, Journal of Public Economics, forthcoming.
Charness, G. and Rabin, M. (2002) Understanding Social Preferences with Simple Tests, Quar-
terly Journal of Economics, 117, 817-869.
Currie, J., Lin, W., and Zhang, W. (2011) Patient Knowledge and Antibiotic Abuse: Evidence
from an Audit Study in China, Journal of Health Economics, 30, 933-949.
Davis, L. and Lennon, S. (1988) Social Cognition and the Study of Clothing and Human Be-
havior, Social Behavior and Personality, 16, 175-186.
DellaVigna, S., List, J., and Malmendier, U. (2012) Testing for Altruism and Social Pressure in
Charitable Giving, Quarterly Journal of Economics, 127, 1-56.
Doleac, J. and Stein, L. (2010) The Visible Hand: Race and Online Market Outcomes, SIEPR
Discussion Paper 10-025.
Fang, H. and Moro, A. (2011) Theories of Statistical Discrimination and Affirmative Action: A
Survey, in Benhabib, J., Bisin, A., and Jackson, M. (Eds), Handbook of Social Economics, 1A,
133-200, North-Holland.
Fehr, E., Fischbacher, U., and Gächter, S. (2002) Strong Reciprocity, Human Cooperation and
the Enforcement of Social Norms, Human Nature, 13, 1-25.
Fehr, E. and Schmidt, K. (1999) A Theory of Fairness, Competition, and Cooperation, Quarterly
Journal of Economics, 114, 817-868.
25

Fong, C., Bowles, S., and Gintis, H. (2006) Strong Reciprocity and the Welfare State, in Kolm,
S. and Ythier, J. (Eds), Handbook on the Economics of Giving, Altruism and Reciprocity, 2,
1440-1464, Amsterdam: Elsevier.
Fong, C. and Luttmer, E. (2009) What Determines Giving to Hurricane Katrina Victims? Exper-
imental Evidence on Racial Group Loyalty, American Economic Journal: Applied Economics,
1, 64-87.
Frijters, P. (2013) An Economic Theory of Greed, Love, Groups, and Networks, Cambridge Uni-
versity Press.
Fryer, R. (2011) Racial Inequality in the 21st Century: The Decline Significance of Discrimi-
nation, in Ashenfelter, O. and Card, D. (Eds), Handbook of Labor Economics, 4B, 855-971,
Amsterdam: North Holland.
Fryer, R. and Katz, L. (2013) Achieving Escape Velocity: Neighborhood and School Interven-
tions to Reduce Persistent Inequality, American Economic Review, Papers and Proceedings,
forthcoming.
Fryer, R. and Levitt, S. (2004) The Causes and Consequences of Distinctively Black Names,
Quarterly Journal of Economics, 119, 767-805.
Gantner, A. and Kerschbamer, R. (2011) Distributional Preferences, Risky Choices and Social
Interaction Effects: Theory and Experiment, working paper.
Gilovich, T., Keltner, D., and Nisbett, R. (2010) Social Psychology, 2nd ed., New York: W. W.
Norton.
Glaeser, E., Laibson, D., Scheinkman, J., and Soutter, C. (2000) Measuring Trust, Quarterly
Journal of Economics, 115, 811-846.
Glaeser, E. and Sacerdote, B. (2003) Sentencing in Homicide Cases: The Role of Vengeance,
Journal of Legal Studies, 32, 363-82.
Gneezy, U., List, J. and Price, M. (2012) Toward an Understanding of Why People Discriminate:
Evidence from a Series of Natural Field Experiments, National Bureau of Economic Research
Working Paper No.17855.
26
Hamermesh, D. (2011) Beauty Pays: Why Attractive People Are More Successful, Princeton:
Princeton University Press.
Harrison, G. and List, J. (2004) Field Experiments, Journal of Economic Literature, 42, 1009-
1055.
Heckman, J. (1998) Detecting Discrimination, Journal of Economic Perspectives, 12, 101-116.
Knowles, J., Persico, N., and Todd, P. (2001) Racial Bias in Motor Vehicle Searches: Theory and
Evidence, Journal of Political Economy, 109, 203-232.
Lang, K. and Lehmann, J. (2012) Racial Discrimination in the Labor Market: Theory and
Empirics, Journal of Economic Literature, 50, 959-1006.
List, J. (2004) The Nature and Extent of Discrimination in the Marketplace: Evidence from the
Field, Quarterly Journal of Economics, 119, 49-89.
List, J. and Rasul, I. (2011) Field Experiments in Labor Economics, Handbook of Labor Eco-
nomics, Elsevier.
Oreopoulos, P. (2011) Why Do Skilled Immigrants Struggle in the Labor Market? A Field
Experiment with Six Thousand Resumes, American Economic Journal: Economic Policy, 4,
148-178.
Parsons, C., Sulaeman, J., Yates, M., and Hamermesh, D. (2011) Strike Three: Discrimination,
Incentives, and Evaluation, American Economic Review, 101, 1410-1435.
Price, J. and Wolfers, J. (2010) Racial Discrimination among NBA Referees, Quarterly Journal
of Economics, 125, 1859-1887.
Shayo, M. and Zussman, A. (2011) Judicial Ingroup Bias in the Shadow of Terrorism, Quarterly
Journal of Economics, 126, 1447-1484.
Zitzewitz, E. (2012) Forensic Economics, Journal of Economic Literature, 50, 731-769.
Zussman, A. (2012) Ethnic Discrimination: Lessons from the Israeli Online Market for Used
Cars, Economic Journal, forthcoming.
27
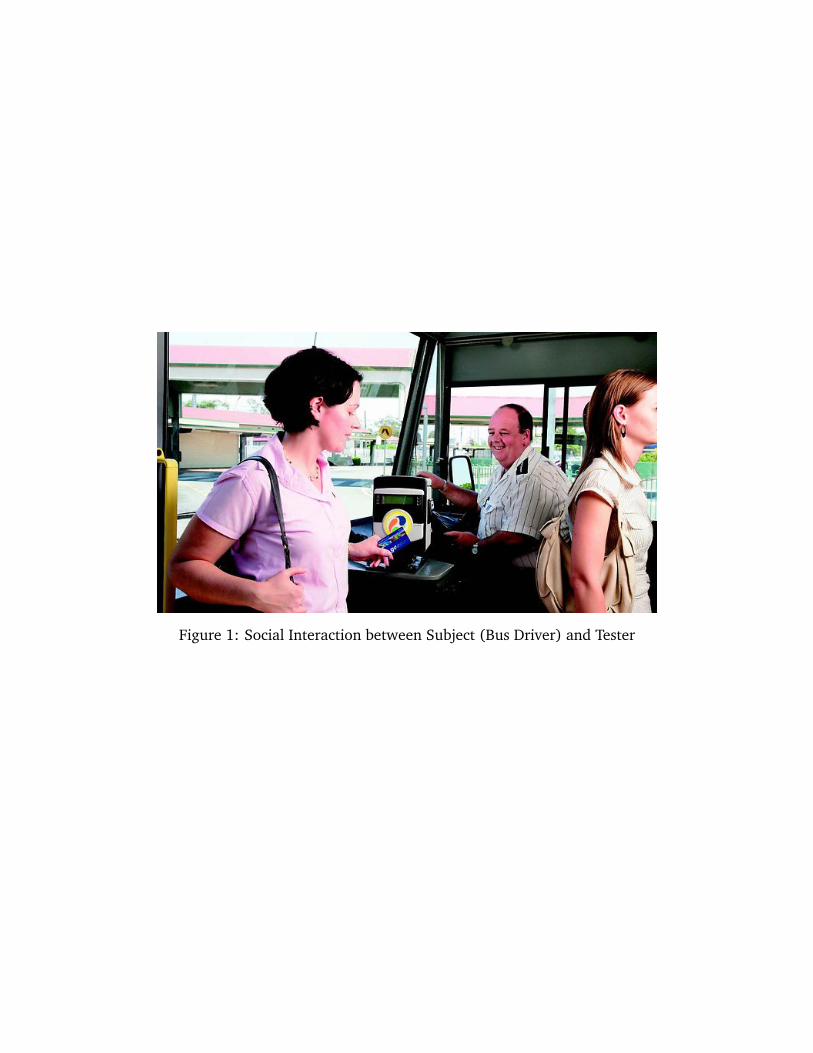
Figure 1: Social Interaction between Subject (Bus Driver) and Tester

Table 1: Sample Participant and Field Characteristics
Variable Description Mean Std Dev Min Max
Tester
Age Years of Age 23.73 3.95 19 32
Gender = 1 if Male 0.64 0.48 0 1
Race 2.42 1.06 1 4= 1 if White
2 if Asian3 if Indian4 if Black
Attractiveness 3.94 0.68 2.80 5.35= 1 if Very Unattractive
7 if Very Attractive
Aggression = 1 if Aggressive 0.12 0.09 0.03 0.48
Trustworthiness = 1 if Trustworthy 0.65 0.14 0.35 .0.95
Subject (Bus Driver)
Age = 1 if Mature 0.59 0.49 0 1
Gender = 1 if Male 0.84 0.37 0 1
Race 1.38 0.84 1 4= 1 if White
2 if Asian3 if Indian4 if Black
Field Variables
Social Scrutiny = 1 if High 0.26 0.44 0 1
Time of Day = 1 if Day 0.89 0.31 0 1
Weather Conditions 1.37 0.64 1 3= 1 if Sunny
2 if Cloudy3 if Raining
NOTES: Subjects (decision makers) are the bus drivers. Subject is defined as Young if perceived age < 45; Matureif perceived age ≥ 45. Social Scrutiny is a proxy for the level of implicit monitoring experienced by subjects: ‘High’if 15 or more other passengers were present (more than half-occupied bus). Racial/Ethnic groups are defined as:White (White- Australian, American, European); Asian (Chinese, Malaysian, Japanese); Indian (Subcontinental); Black(Indigenous Australian, African, African American, Pacific Islander). Each tester was rated on a scale from 1 (veryunattractive) to 7 (very attractive) by 40 raters (balanced by gender). Raters also stated whether the tester (in thepresented photograph) could be perceived as an ‘aggressive’ and ‘trustworthy’ individual. Attractiveness, Aggression andTrustworthiness of testers is averaged over raters.

Table 2: Average Level of Acceptance by Group
Acceptance Rate Test of Difference
Overall (N = 1, 552) 0.64 (0.48)
Tester
White (n= 366) 0.77 (0.42)Asian (n= 485) 0.74 (0.44) 0.24Indian (n= 385) 0.57 (0.50) 0.00Black (n= 316) 0.43 (0.49) 0.00
Male (n= 992) 0.67 (0.47)Female (n= 560) 0.59 (0.49) 0.00
Young (n= 1,155) 0.68 (0.47)Mature (n= 397) 0.53 (0.50) 0.00
Attractive (n= 679) 0.63 (0.48)Unattractive (n= 873) 0.65 (0.48) 0.40
Aggressive (n= 647) 0.57 (0.49)Unaggressive (n= 905) 0.69 (0.46) 0.00
Trustworthy (n= 759) 0.69 (0.46)Untrustworthy (n= 793) 0.60 (0.49) 0.00
Subject (Bus Driver)
White (n= 1,227) 0.64 (0.48)Asian (n= 150) 0.64 (0.48) 0.96Indian (n= 81) 0.54 (0.50) 0.04Black (n= 94) 0.72 (0.45) 0.06
Male (n= 1, 305) 0.64 (0.48)Female (n= 247) 0.64 (0.48) 0.94
Young (n= 634) 0.66 (0.47)Mature (n= 918) 0.63 (0.48) 0.06
Field Variables
High Scrutiny (n= 398) 0.56 (0.50)Low Scrutiny (n= 1, 154) 0.67 (0.47) 0.00
Day (n= 1,379) 0.63 (0.48)Night (n= 173) 0.73 (0.45) 0.01
Sunny (n= 1, 105) 0.62 (0.49)Cloudy (n= 313) 0.61 (0.49) 0.67Raining (n= 134) 0.87 (0.34) 0.00
NOTES: Acceptance Rate is the proportion of ‘Yes’ responses received (elicited) by testers (subjects). Testeris labelled as Young if age < 25, Mature if age ≥ 25; Unattractive if attractiveness < 3.94, Attractive ifattractiveness ≥ 3.94; Unaggressive if aggression < 0.12, Aggressive if aggression ≥ 0.12; Untrustworthyif trustworthiness < 0.65, Trustworthy if trustworthiness ≥ 0.65, where the measures are averaged overraters. Subject is labelled as Young if perceived age < 45, Mature if perceived age ≥ 45. The number ofobservations per group is given by n. Standard deviations are shown in parentheses of the second column.Test of difference between sample proportions is based on H0: p1 = p2, where p1 always corresponds tothe first listed subgroup (White; Male; Young etc). The resulting p-values are reported in the third column.

Table 3: Average Level of Acceptance by Racial/Ethnic Match
Subject (Bus Driver)
White Asian Indian Black
Test
er
White 0.76 (0.43) 0.93 (0.26) 0.68 (0.48) 0.83 (0.38)n= 301 n= 28 n= 19 n= 18
Asian 0.73 (0.45) 0.86 (0.35) 0.73 (0.46) 0.74 (0.45)n= 407 n= 36 n= 15 n= 27
Indian 0.59 (0.49) 0.39 (0.49) 0.67 (0.50) 0.67 (0.49)n= 320 n= 44 n= 9 n= 12
Black 0.38 (0.49) 0.52 (0.51) 0.37 (0.49) 0.68 (0.48)n= 199 n= 42 n= 38 n= 37
NOTES: Each entry represents the mean acceptance rate conditional on tester and subject race/ethnicity. Standard deviations are shown inparentheses. The corresponding number of interactions observed is given by n for each racial/ethnic pairing.

Table 4: Effect of Observable Characteristics on the Probability of Acceptance
Dependent Variable: LPM Marginal EffectsAccepted (Yes/No) (1)*** (2)*** (3)***
Tester characteristics
Age 0.015*** 0.015*** 0.015***[0.011]*** [0.013]*** [0.006]***
Male −.0.010***** −.0.020***** −.0.009*****[0.013]*** [0.116]*** [0.057]***
Asian 0.017*** 0.013*** 0.035***[0.108]*** [0.122]*** [0.062]***
Indian −.0.142***** −.0.148***** −.0.085*****[0.138]*** [0.155]*** [0.075]***
Black −.0.465***** −.0.471***** −.0.438*****[0.143]*** [0.159]*** [0.077]***
Attractiveness −.0.038***** −.0.045***** −.0.055*****[0.082]*** [0.091]*** [0.042]***
Aggression 0.446*** 0.444*** 0.501***[0.588]*** [0.654]*** .[0.312]***
Trustworthiness 0.497*** 0.492*** 0.567***[0.374]*** [0.423]*** .[0.194]***
Subject characteristics
Age −.0.063***** −.0.060*****[0.023]*** [0.023]***
Male 0.016*** 0.004***[0.031]*** [0.032]***
Asian 0.005*** 0.004***[0.037]*** [0.037]***
Indian −.0.047***** −.0.039*****[0.052]*** [0.053]***
Black 0.135*** 0.119***[0.050]*** [0.048]***
Same Race 0.060***[0.036]***
Same Gender 0.015***.[0.032]***
Field characteristics
High Scrutiny −.0.055*****[0.027]***
Time of Day −.0.064*****[0.038]***
Weather Conditions 0.052***.[0.018]***
Constant 0.156*** 0.221*** 0.180***[0.564]*** [0.632]*** .[0.300]***
Tester Random Effects 3*** 3*** 3***
Observations 1,552*** 1, 552 *** 1, 552***
R2 0.10*** 0.11 *** 0.13***NOTES: Linear probability model. Robust standard errors in parentheses. The dependent variable in all regressionsis Accepted, an indicator variable that takes on a value of one if the subject accepted a tester. Same Race and SameGender are indicator variables for subject and tester pairings that are of the same race and same gender, respectively.∗, ∗∗, and ∗∗∗ indicate statistical significance at the 10%, 5%, and 1% levels, respectively.

Table 5: Level of Acceptance by Treatment
Acceptance Rate **Test of Difference
Treatment
Baseline (n= 1, 281) 0.60 (0.49)High Income (n= 160) 0.81 (0.40) 0.00 bp (casual) < bp (high income)Patriotism (n= 111) 0.89 (0.31) 0.00 bp (casual) < bp (patriotism)
0.03 bp (high income) < bp (patriotism)Default Fares (n= 1, 004) 0.64 (0.48)Increased Fares (n= 548) 0.65 (0.48) 0.56 bp (low fares) 6= bp (high fares)
Treatment | Tester RaceWhite Asian Indian Black
Baseline 0.72 (0.45) 0.73 (0.44) 0.51 (0.50) 0.36 (0.48)n= 276 n= 429 n= 320 n= 256
High Income 0.93 (0.25) 0.69 (0.47) 0.83 (0.38) 0.67 (0.48)n= 60 n= 35 n= 35 n= 30
Patriotism 0.97 (0.18) 0.90 (0.30) 0.93 (0.25) 0.77 (0.43)n= 30 n= 21 n= 30 n= 30
NOTES: Each entry represents the mean acceptance rate. Standard deviations are shown in parentheses. The corresponding number of observations isgiven by n. Test of difference between sample proportions is based on H0: p1 = p2, with the respective alternative hypothesis presented in the fourthcolumn of the top panel. The resulting p-values are reported in the third column. The bottom panel shows the mean acceptance rates per treatmentconditional on tester race/ethnicity. High Income is a dummy variable for testers wearing a business suit and carrying a briefcase. Patriotism is a dummyvariable for testers wearing the national army uniform. In the baseline treatment testers were dressed in plain casual clothing (t-shirt and jeans/shorts).Increased Fares is a dummy variable that captures a 15 percent increase in the price of bus tickets.

Table 6: Effect of Treatments on the Probability of Acceptance
(1)*** (2)*** (3)*** (4)*** (5)***
Asian Tester −.0.003***** 0.003*** 0.007*** 0.043*** 0.047***[0.058]*** [0.093]*** [0.099]*** [0.070]*** [0.089]***
Indian Tester −.0.138***** −.0.155***** −.0.150***** −.0.061***** −.0.083*****[0.071]*** [0.117]*** [0.124]*** [0.088]*** [0.112]***
Black Tester −.0.478***** −.0.477***** −.0.479***** −.0.443***** −.0.442*****[0.075]*** [0.120]*** [0.127]*** [0.090]*** [0.114]***
High Income 0.139*** −.0.019***** 0.001***[0.042]*** [0.044]*** [0.048]***
High Income × Asian Tester 0.156*** 0.135***[0.127]*** [0.126]***
High Income × Indian Tester 0.165*** 0.265***[0.091]*** [0.102]***
High Income × Black Tester 0.152*** 0.207***[0.108]*** [0.113]***
Patriotism 0.241*** 0.087*** 0.118***[0.038]*** [0.041]*** [0.047]***
Patriotism × Asian Tester 0.061*** 0.063***[0.102]*** [0.103]***
Patriotism × Indian Tester 0.130*** 0.142***[0.079]*** [0.089]***
Patriotism × Black Tester 0.171*** 0.210***[0.099]*** [0.104]***
High Scrutiny −.0.052***** 0.096*** 0.109***[0.027]*** [0.048]*** [0.048]***
High Scrutiny × Asian Tester −.0.181***** −.0.184*****[0.073]*** [0.073]***
High Scrutiny × Indian Tester −.0.233***** −.0.236*****[0.071]*** [0.072]***
High Scrutiny × Black Tester −.0.141***** −.0.187*****[0.077]*** [0.076]***
Constant 0.354*** 0.271*** 0.245*** 0.161*** 0.239***[0.303]*** [0.483]*** [0.510]*** [0.355]*** .[0.353]***
Other Controls 3*** 3*** 3*** 3*** 3***
Tester Random Effects 3*** 3*** 3*** 3*** 3***
Observations 1,552*** 1, 552 *** 1, 552 *** 1,552*** 1, 552***
R2 0.16*** 0.13 *** 0.14 *** 0.14*** 0.17***
NOTES: Linear probability model. Robust standard errors in parentheses. The dependent variable in all regressions is Accepted, an indicator variable that takes on avalue of one if the subject accepted a tester. High Income is a dummy variable for testers wearing a business suit and carrying a briefcase. Patriotism is a dummy variablefor testers wearing the national army uniform. In the baseline treatment testers were dressed in plain casual clothing (t-shirt and jeans/shorts). High Scrutiny if 15 ormore other passengers were present (more than half-occupied bus); otherwise Low Scrutiny (less than half-occupied bus). Other Controls included in the regressionsare Tester Beauty, Aggression and Trustworthiness; Subject Race, Age, and Gender; Time of Day and Weather Conditions. ∗, ∗∗, and ∗∗∗ indicate statistical significance atthe 10%, 5%, and 1% levels, respectively.

Table 7: Actual versus Stated Generosity
Actual Stated Test of DifferenceGenerosity Generosity (bpactual − bpstated)
Overall 0.60 0.69 0.03
Tester
White 0.72 0.67 0.28Asian 0.73 0.62 0.06Indian 0.51 0.76 0.01Black 0.36 0.86 0.00
Male 0.60 0.67 0.15Female 0.59 0.72 0.04
Young 0.64 0.68 0.20Mature 0.49 0.75 0.01
Attractive 0.58 0.71 0.05Unattractive 0.62 0.69 0.13
Aggressive 0.56 0.73 0.01Unaggressive 0.63 0.67 0.30
Trustworthy 0.65 0.74 0.09Untrustworthy 0.56 0.66 0.07
Subject (Bus Driver)
White 0.60 0.71 0.02Asian 0.57 0.50 0.34Indian 0.50 0.63 0.25Black 0.74 0.77 0.81
Male 0.60 0.72 0.01Female 0.59 0.56 0.82
Young 0.63 0.66 0.63Mature 0.58 0.74 0.02
Same Race 0.72 0.62 0.13Different Race 0.56 0.72 0.00
Same Gender 0.61 0.67 0.21Different Gender 0.58 0.73 0.02
NOTES: Actual Generosity is the proportion of ‘Yes’ responses received (elicited) by testers (subjects) in thebaseline treatment of the actual field experiment. The values for each tester race/ethnicity are the same asthose presented in Table 5 under the baseline treatment. Stated Generosity is the proportion of ‘Yes’ responsesreceived (elicited) by testers (subjects) during the hypothetical survey. Tester is labelled as Young if age <25, Mature if age ≥ 25; Unattractive if attractiveness < 3.94, Attractive if attractiveness ≥ 3.94; Unaggressiveif aggression < 0.12, Aggressive if aggression ≥ 0.12; Untrustworthy if trustworthiness < 0.65, Trustworthy iftrustworthiness ≥ 0.65, where the measures are averaged over raters. Subject is labelled as Young if perceivedage < 45, and Mature if perceived age ≥ 45. Same Race and Same Gender are indicator variables for tester andsubject pairings that are of the same race and same gender, respectively. Test of difference between sampleproportions (across the two methodologies) is based on H0: p1 = p2, where p1 corresponds to the acceptancerate observed during the actual field experiment, and p2 corresponds to the acceptance rate stated during thehypothetical survey. The resulting p-values are reported in the third column.

A Additional Tables and Figures
Table A.1: Summary of Tester Appearance RatingsMean Std Dev Min Max
Attractiveness
All (N = 29) 3.94 0.66 2.80 5.35
Male (n= 16) 3.65 0.51 2.80 4.55Female (n= 13) 4.44 0.55 3.60 5.35
Age < 25 (n= 22) 4.02 0.61 2.85 4.98Age ≥ 25 (n= 7) 3.70 0.84 2.80 5.35
White (n= 6) 4.39 0.64 3.50 4.98Asian (n= 12) 3.91 0.54 3.05 4.73Indian (n= 6) 3.86 0.58 2.85 4.58Black (n= 5) 3.54 0.98 2.80 5.35
Aggression
All (N = 29) 0.12 0.10 0.03 0.48
Male (n= 16) 0.13 0.12 0.03 0.48Female (n= 13) 0.09 0.07 0.03 0.20
Age < 25 (n= 22) 0.10 0.09 0.03 0.35Age ≥ 25 (n= 7) 0.17 0.15 0.05 0.48
White (n= 6) 0.12 0.12 0.03 0.35Asian (n= 12) 0.10 0.08 0.03 0.25Indian (n= 6) 0.08 0.06 0.03 0.18Black (n= 5) 0.20 0.16 0.08 0.48
Trustworthiness
All (N = 29) 0.65 0.14 0.35 0.95
Male (n= 16) 0.64 0.15 0.35 0.95Female (n= 13) 0.66 0.12 0.40 0.78
Age < 25 (n= 22) 0.65 0.15 0.35 0.95Age ≥ 25 (n= 7) 0.62 0.11 0.40 0.75
White (n= 6) 0.67 0.19 0.35 0.85Asian (n= 12) 0.67 0.15 0.48 0.95Indian (n= 6) 0.61 0.08 0.53 0.75Black (n= 5) 0.61 0.11 0.40 .0.73
NOTES: Each tester was rated on a scale from 1 (very unattractive) to 7 (very attractive) by40 raters (balanced by gender). Raters also stated whether or not (1/0) the tester (in thepresented photograph) could be perceived as an ‘aggressive’ and ‘trustworthy’ individual.Attractiveness, Aggression and Trustworthiness of testers is averaged over raters. The numberof individuals in each tester group is given by n.

Table A.2: Average Level of Acceptance by Race/Ethnicity
Acceptance RateWhite Asian Indian Black
Tester
Male 0.85 (0.35) 0.65 (0.48) 0.68 (0.47) 0.49 (0.50)n= 259 n= 268 n= 225 n= 240
Female 0.58 (0.50) 0.85 (0.36) 0.42 (0.49) 0.25 (0.44)n= 107 n= 217 n= 160 n= 76
Attractive 0.79 (0.40) 0.73 (0.45) 0.37 (0.49) 0.35 (0.48)n= 277 n= 171 n= 115 n= 80
Unattractive 0.71 (0.46) 0.76 (0.44) 0.65 (0.48) 0.46 (0.50)n= 89 n= 314 n= 270 n= 236
Aggressive 0.59 (0.49) 0.66 (0.47) 0.58 (0.50) 0.50 (0.50)n= 138 n= 163 n= 106 n= 240
Unaggressive 0.88 (0.32) 0.78 (0.42) 0.56 (0.50) 0.21 (0.41)n= 228 n= 322 n= 279 n= 76
Trustworthy 0.93 (0.25) 0.77 (0.42) 0.37 (0.49) 0.54 (0.50)n= 204 n= 241 n= 118 n= 196
Untrustworthy 0.57 (0.50) 0.71 (0.46) 0.66 (0.48) 0.26 (0.44)n= 162 n= 244 n= 267 n= 120
Subject (Bus Driver)
Male 0.65 (0.48) 0.64 (0.48) 0.53 (0.50) 0.72 (0.45)n= 1, 029 n= 122 n= 78 n= 76
Female 0.63 (0.49) 0.64 (0.40) 1.00 (0.00) 0.72 (0.46)n= 198 n= 28 n= 3 n= 18
Young 0.67 (0.47) 0.65 (0.48) 0.59 (0.50) 0.75 (0.47)n= 453 n= 86 n= 51 n= 44
Mature 0.63 (0.48) 0.63 (0.49) 0.47 (0.51) 0.70 (0.46)n= 774 n= 64 n= 30 n= 50
Field Variables | Tester Race
High Scrutiny 0.79 (0.41) 0.62 (0.49) 0.47 (0.50) 0.40 (0.49)n= 85 n= 98 n= 137 n= 78
Low Scrutiny 0.77 (0.42) 0.77 (0.42) 0.63 (0.49) 0.44 (0.50)n= 281 n= 387 n= 248 n= 238
NOTES: Each entry represents the mean acceptance rate conditional on tester or subject race/ethnicity. Standard deviationsare shown in parentheses. The corresponding number of observations is given by n below each cell entry. Tester is labelled asUnattractive if attractiveness< 3.94, Attractive if attractiveness≥ 3.94; Unaggressive if aggression< 0.12, Aggressive if aggression≥ 0.12; Untrustworthy if trustworthiness < 0.65, Trustworthy if trustworthiness ≥ 0.65, where the measures are averaged overraters. Subject is labelled as Young if perceived age < 45, and Mature if perceived age ≥ 45. High Scrutiny if 15 or more otherpassengers were present (more than half-occupied bus); otherwise Low Scrutiny (less than half-occupied bus).

Figure A.1: Public Bus Travel ‘Go’ Card

Source: www.translink.com.au
Figure A.2: Map of Brisbane City Bus Network

Source: www.translink.com.au
Figure A.3: Map of Data Collection Regions/Bus Zones

Figure A.4: Levels of Acceptance by Racial/Ethnic Match
Figure A.5: Levels of Acceptance by Treatment

Figure A.6: Levels of Acceptance by Scrutiny

B Survey of Bus Drivers
Introduction
Hello, my name is [ ], and I am a student/research assistant from the University of Queensland.
I am doing some research on helping behavior in Brisbane, and was wondering if you could
spare a few minutes to help me out with a few very simple questions? I will present to you
a simple hypothetical scenario and would like to know your thoughts about it. The survey is
totally anonymous and your responses will be used for research purposes only.
Hypothetical Scenario
• The following (adult) individual enters your bus.
• After scanning their Go Card, you find out that they have no travel balance.
• The person states that he/she does not have any money, but needs to get to the next
station (which is not within close walking distance- around 2km away).
WOULD YOU BE WILLING TO LET THIS PERSON ONTO THE BUS?
YES / NO

If ‘YES’:
I would let this person on because:
1. I would believe this person has made an honest mistake.
For me this is: [very important / somewhat important / unimportant]48% 34% 18%
2. Other passengers would be OK with this.
For me this is: [very important / somewhat important / unimportant]17% 46% 37%
3. This kind of person deserves some help.
For me this is: [very important / somewhat important / unimportant]50% 37% 13%
4. This person would be harmless if let on.
For me this is: [very important / somewhat important / unimportant]50% 40% 10%
5. I can relate to this person.
For me this is: [very important / somewhat important / unimportant]11% 36% 53%

If ‘NO’:
I would not let this person on because:
1. I would suspect this person is trying to get on for free and did not accidentally carry an
empty Go Card.
For me this is: [very important / somewhat important / unimportant]50% 38% 12%
2. It would upset other passengers if this person is let on.
For me this is: [very important / somewhat important / unimportant]23% 50% 27%
3. This kind of person does not deserve help.
For me this is: [very important / somewhat important / unimportant]0% 27% 73%
4. This person might create trouble if let on.
For me this is: [very important / somewhat important / unimportant]27% 32% 41%
5. I cannot relate to this person.
For me this is: [very important / somewhat important / unimportant]20% 12% 68%
6. My work agreement/contract does not allow me to give away free bus rides.
For me this is: [very important / somewhat important / unimportant]91% 9% 0%