Embed Size (px)
Citation preview

Stimulating Agricultural and Rural
Transformation (StART)
in the Low-Income TropicsChris Barrett
February 20, 2009

The promise
10
20
30
40
50
60
70
80
90
1980 1985 1990 1995 2000 2005
% o
f Pop
ulati
on
Extreme and Ultra Poverty, 1981-2004
East Asia Sub-Saharan Africa South Asia
Bubble sizes reflect number of people l iving in extreme poverty (2005US$1.25/day-person) and ultra poverty ($0.54/day-person)
East Asia: 1.1 bn (79%) in 1981, 0.3 bn (18%) in 2005
Worldwide: 1.9 bn (52%) in 1981, down to 1.4 bn (26%) in 2005
SSA: 0.2 bn (51%) in 1981, 0.4 bn (50%) in 2005
South Asia: 0.5 bn (59%) in 1981, 0.6 bn (40%) in 2005
Source: Chen and Ravallion (2008)
Extreme poverty has fallen rapidly in east Asia and worldwide, but only proportional gains in South Asia and none in Sub-Saharan Africa, where >50% still live on less than $1.25/day.

0
20
40
60
80
100
120
140
160
180
200
1990 1993 1996 1999 2002 2004
Middle East & North Africa
Europe & Central Asia
Latin America & the Caribbean
East Asia & Pacific
South Asia
Sub-Saharan Africa
48% African in 1990, 75% in 2004
Source: IFPRI (2007)
Ultra-poverty is especially persistent and prevalent in sub-Saharan Africa
Ultra-poor (income per capita< 2005US$0.54/day)
The challenge

Source: World Bank (2007)
Persistent poverty is closely tied to agricultural stagnation
A key driver
500
1000
1500
2000
2500
3000
3500
4000
1984 1987 1990 1993 1996 1999 2002
Cer
eal y
ield
s (K
g/H
a)
0
10
20
30
40
50
60
Pov
erty
inci
denc
e (%
)Poverty (right axis)
Yields (left axis)
500
1000
1500
2000
2500
3000
3500
4000
1984 1987 1990 1993 1996 1999 2002
Cer
eal y
ield
s (K
g/H
a)
0
10
20
30
40
50
60
Pov
erty
inci
denc
e (%
)
Poverty (right axis)
Yields (left axis)
Cereal yields and extreme poverty move inversely.South Asian progress Sub-Saharan African stasis

Agricultural stagnation is a key driver of poverty and undernutrition
The consequence
20
40
60
80
100
120
140
1000 2000 3000 4000
Pro
tein
/day
(g
ram
s)
Calories/day
Per Capita Nutrient Availability (shaded areas below minima)
10.3%
2.9%16.6%
70.3%
Source: Barrett & Maxwell (2005), data: FAO food balance sheets
The WHO identifies undernutrition as the biggest risk factor for disease and death worldwide … and 30/47 SSA countries have macronutrient availability shortfalls .

Reinforcing feedback:Low productivity causes poverty.
Poverty causes hunger and natural resource degradation.
But hunger and degraded natural resources also cause poverty and low productivity.
Hence the vicious cycle of poverty traps, hunger and natural resources degradation.
Poverty traps

Why such persistence?
Two key features of poverty traps:
1)Initial conditions matter- “It takes money to make money” …
investment is the engine of growth and exit from poverty.
- In SSA, ultra-poor are heavily rural and depend on meager (and degrading) natural resource base and have little access to key infrastructure.
2)Risk matters- Direct loss of productive assets to disease,
conflict, climate variability, etc.- Responses: ex post coping (e.g., school
drop-outs, distress asset sale) and ex ante risk management (e.g., low-risk, low-return livelihoods).
The challenge: Poverty traps

Need agricultural and rural transformation to break out of ultra-poverty/hunger trap:
Reason 1: location, livelihood and asset holdings
- Most ultra-poor live in rural areas (rural-urban poverty gap increases in poverty depth)
- Most ultra-poor work in agriculture, at least part-time.
- Increasing the productivity of the assets controlled by the poor (and the stock of assets they control) is fundamental to any strategy to break out of the poverty/hunger trap. So must increase the productivity of the rural poor’s labor, land, livestock and other assets.
Need to StART

Reason 2: Budget dependence
Food is 65-80% of ultra-poor’s budgets.
Most SSA farmers are not net sellers of basic commodities … most are net buyers.
So food price effects of agricultural productivity growth reinforce gains to the rural poor by reducing cost of living.
Hence the seriousness of the recent global food price crisis for the poor, including most small farmers!
Need to StART

An example from Madagascar:
A doubling of rice yields:- reduces the share of food insecure households by 38%- shortens the average hungry period by 1.7 months (1/3)- increases real unskilled wages in lean season by 89 % (due to both price and labor demand effects)- All the poor benefit: unskilled workers, consumers, and net seller producers … the poorest gain most.
(Minten and Barrett, World Development, 2008).
Need to StART

Result:
- World Bank estimates that real GDP growth from agriculture is 2.7 times more effective in reducing extreme poverty headcount in poorest countries, vs. non-ag sectors.
- Historically, advances in food system productivity have been the foundation of poverty reduction and modern economic growth throughout history.
- Agricultural growth has strong multiplier effects on the rural non-farm economy … generating both local demand and investible resources, as well as ensuring the food security of those who leave the farm.
Need to StART

No one size fits all approach is viable. Need to contextualize. But there exist several key principles for targeting StART interventions:
Principle 1: Build and protect productive assets.Multiple assets matter: Human capital, land (incl. soil fertility), water, livestock, investible funds (savings, credit)
Interventions include direct provision (e.g., free education) or subsidies for asset accumulation or insurance of existing assets
For privately held assets (land, livestock, equipment, education, businesses, etc.), mainly need to improve investment incentives.
Also need to conserve common pool assets (rangelands, water, forest, etc.) through better governance and incentives.
Key StART principles
Principle 1: Build and protect productive assets.
How to improve incentives?1)More secure property rights (tenure, police)2)Resolve financial market failures3)“Crowding-in” investment in complementary inputs (e.g., physical and
institutional infrastructure)4)Provision of safety nets5)Clear conservation rules, authority w/o burdening the poor.
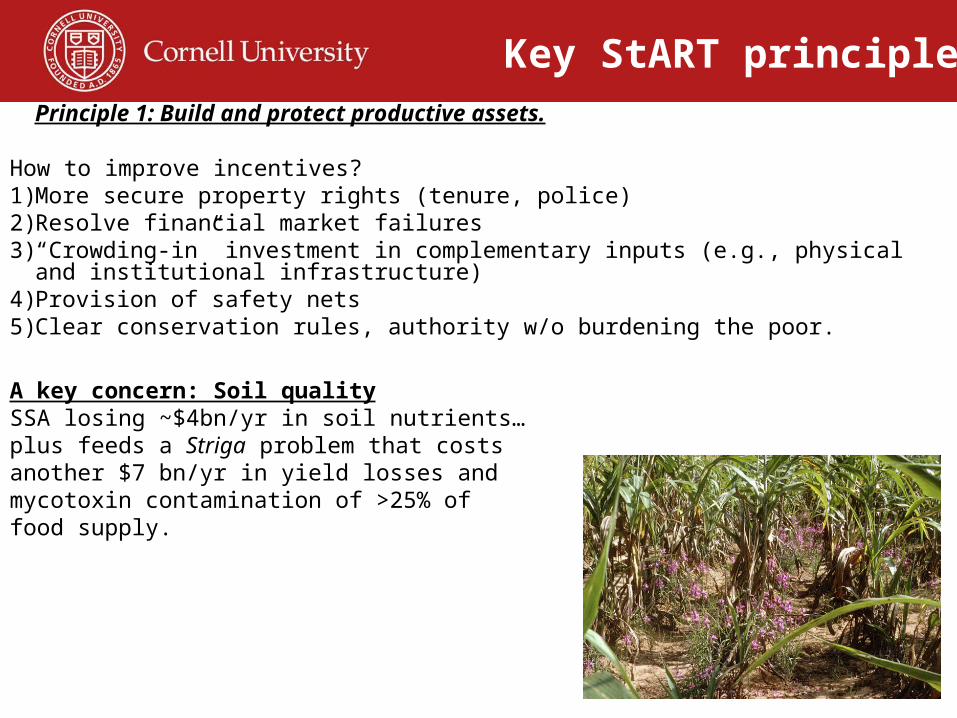
A key concern: Soil qualitySSA losing ~$4bn/yr in soil nutrients… plus feeds a Striga problem that costs another $7 bn/yr in yield losses andmycotoxin contamination of >25% of food supply.
Key StART principles

Principle 2: Improve the productivity of the poor’s current asset holdings.
1)Improved production/processing technologies2)More efficient/remunerative marketing channels
Uptake/participation turns on assets, so don’t forget #1!
Key concern 1: Agricultural research in SSAAvg RoR ~35%, and ~80% of ultra-poor in agricultureBut only 4% of public expenditures are on ag and a small fraction of
that goes into research.
Key concern 2: Changing agrifood supply chainsWho is participating, on what terms, w/ what effects?
Key StART principles

Principle 3: Improve risk management options for the ultra-poor.
Regressivity, multidimensionality and context-specificity of uninsured risk exposure make this a serious challenge.
Risk reduction: Improved crops and livestock, betterwater control, diversification, peace,disease control
Risk transfer:Improved markets, index-based risk finance, global humanitarian response
Key StART principles

Global + local (“Glocal”) Solutions
Principle 4: Facilitate favorable transitions out of agriculture.
Must equip the next generationto transition into remunerative non-farm employment.
Keys are (i) supporting physical and institutional infrastructure; (ii) early childhood health, nutrition and education, especiallyfor disadvantaged children. Closely tied to improvements to parents’ productivity, risk management and asset holdings.
Key StART principles

Global + local (“Glocal”) Solutions
Conclusions
There is real reason for hope:- Real ag output growth is accelerating in South Asia and SSA at long last … back to positive per capita rates of food output growth
- Renewed and innovative initiatives (e.g., AGRA) and attention (e.g., WDR 2008), and turn-around in both public aid and private investment in low-income countries.
- Exciting new innovations in technologies (e.g., micronutrient-rich staple crops, drought-resistant cultivars), advances in finance (e.g., index insurance to pre-finance emergency response and provide a productive safety net), and improvements in policies (e.g., rule of law, tenurial security, global food aid).

Global + local (“Glocal”) Solutions
But recognizing the need to intervene is the easy part.
We need to emphasize and focus on four key StART principles:- Build and protect productive assets.- Improve the productivity of the poor’s current asset holdings.- Improve risk management options for the ultra-poor.- Facilitate favorable transitions out of agriculture.
And remember that appropriate policy design and implementation are highly context specific. So need to continuously and rigorously research the settings in which we work and the policies we design and introduce …
… beware repeating the errors of the 1980s-90s!
Conclusions

Thank you for your time, interest and comments!
Thank you