Embed Size (px)
Citation preview

University of St. Gallen
Master’s Thesis
Master of Arts in Banking and Finance
Stochastic dependencies of spot prices
in the European electricity markets
Author:
Iva Mihaylova
Supervisor:
Prof. Dr. Karl Frauendorfer
St. Gallen, November 2009

Stochastic dependencies of spot prices in the European electricity markets
1
Abstract
This thesis consists of two parts. First, it provides a theoretical overview of the electricity market
design in Europe. Second, it studies the stochastic dependencies between electricity hourly spot
prices, on basis of five power exchange-quoted historical datasets: for Austria, Germany, Nord Pool,
Spain and Switzerland. Dependencies between the spot prices of the selected power exchanges are
analysed with two types of rank correlation coefficients (Kendall’s tau and Spearman’s rho) and with
copulas. The results of the analysis indicate strongest dependency between the spot electricity prices
of Austria and Germany and weakest: between Nord Pool and Spain. In addition, the copula analysis
shows that the spot electricity prices on the selected power exchanges tend to experience low values
together. Finally, a conclusion is made that the reviewed power exchanges exhibit a different degree
of integration and have a higher level of dependency rather on a regional level.
Key words: correlation, copulas, concordance, dependency, European electricity markets
liberalisation, European Union, spot electricity prices.

Stochastic dependencies of spot prices in the European electricity markets
2
Table of contents
Abstract 1 List of figures 3 List of tables 3 Introduction 4 Chapter 1 Deregulated electricity markets in Europe 5 1. Overview of the major legislative steps, aiming liberalization of the European electricity markets 5 2. Introduction to the deregulated electricity markets’ design 10 3. The Power exchange spot market organisation 11 4. Differences between power pools and power exchanges 18 5. Auction trading classification 20 6. Connecting interdependent European electricity markets 26 7. The European Electricity Markets - A Country Overview 33 Chapter 2 Dominant properties of electricity prices 49 Chapter 3 Copulas as a function of dependence of random variables 54 3.1. Motivation to use copulas for exploring the dependency of spot electricity prices 54 3.2. Sklar’s Theorem and its interpretation 54 3.3. Invariance of copulas 56 3.4. Fréchet-Hoeffding bounds. Fundamental copulas. Concordance ordering. 57 3.5. Copula graph and contour plot 59 3.6. Popular copula families in finance 59 3.7. Tail dependence as a dependence notion 64 Chapter 4 The limitations of linear correlation. Copula-based measures of concordance and dependence 66 Chapter 5 Analysis of the stochastic dependencies of spot electricity prices with copulas and copula-based concordance measures
73
5.1. Descriptive statistics 73 5.2. Motivation for data choice 74 5.3. The Goodness-of-a-fit test for copulas, applied in this study 75 5.4. Results of the application of Clayton copula and copula-based concordance measures to analyse the stochastic dependencies of spot electricity prices
78
Summary and conclusions 85 Abbreviations 87 Appendix 1. Internet sites of the reviewed power exchanges 87 Appendix 2. Bivariate Clayton copula applied to ten hourly spot electricity prices dataset pairs 88 References 98 Declaration of authorship
103
Stochastic dependencies of spot prices in the European electricity markets
3
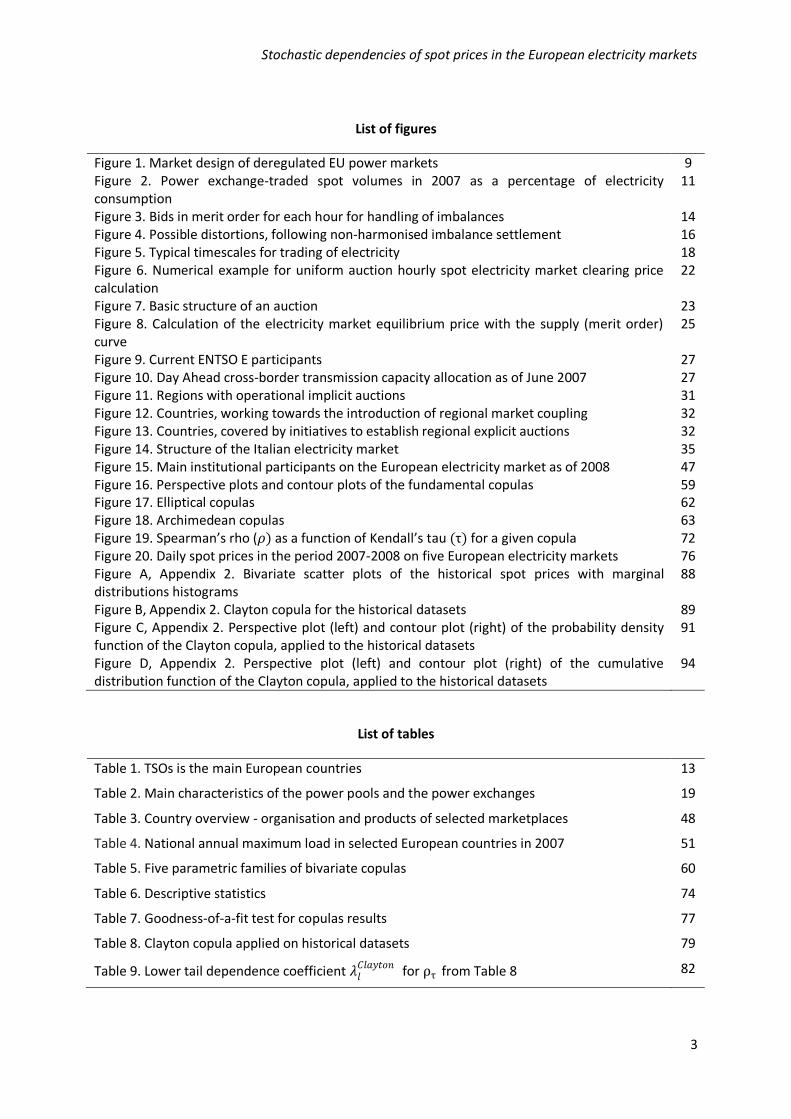
List of figures
Figure 1. Market design of deregulated EU power markets 9 Figure 2. Power exchange-traded spot volumes in 2007 as a percentage of electricity consumption
11
Figure 3. Bids in merit order for each hour for handling of imbalances 14 Figure 4. Possible distortions, following non-harmonised imbalance settlement 16 Figure 5. Typical timescales for trading of electricity 18 Figure 6. Numerical example for uniform auction hourly spot electricity market clearing price calculation
22
Figure 7. Basic structure of an auction 23 Figure 8. Calculation of the electricity market equilibrium price with the supply (merit order) curve
25
Figure 9. Current ENTSO E participants 27 Figure 10. Day Ahead cross-border transmission capacity allocation as of June 2007 27 Figure 11. Regions with operational implicit auctions 31 Figure 12. Countries, working towards the introduction of regional market coupling 32 Figure 13. Countries, covered by initiatives to establish regional explicit auctions 32 Figure 14. Structure of the Italian electricity market 35 Figure 15. Main institutional participants on the European electricity market as of 2008 47 Figure 16. Perspective plots and contour plots of the fundamental copulas 59 Figure 17. Elliptical copulas 62 Figure 18. Archimedean copulas 63 Figure 19. Spearman’s rho (𝜌) as a function of Kendall’s tau (τ) for a given copula 72 Figure 20. Daily spot prices in the period 2007-2008 on five European electricity markets 76 Figure A, Appendix 2. Bivariate scatter plots of the historical spot prices with marginal distributions histograms
88
Figure B, Appendix 2. Clayton copula for the historical datasets 89 Figure C, Appendix 2. Perspective plot (left) and contour plot (right) of the probability density function of the Clayton copula, applied to the historical datasets
91
Figure D, Appendix 2. Perspective plot (left) and contour plot (right) of the cumulative distribution function of the Clayton copula, applied to the historical datasets
94
List of tables
Table 1. TSOs is the main European countries 13
Table 2. Main characteristics of the power pools and the power exchanges 19
Table 3. Country overview - organisation and products of selected marketplaces 48
Table 4. National annual maximum load in selected European countries in 2007 51
Table 5. Five parametric families of bivariate copulas 60
Table 6. Descriptive statistics 74
Table 7. Goodness-of-a-fit test for copulas results 77
Table 8. Clayton copula applied on historical datasets 79
Table 9. Lower tail dependence coefficient 𝜆𝑙𝐶𝑙𝑎𝑦𝑡𝑜𝑛 for ρτ from Table 8 82

Stochastic dependencies of spot prices in the European electricity markets
4
INTRODUCTION
In the last decade the European electricity market has undergone a structural transformation. The
former vertically-integrated state-owned monopolies have been opened gradually and to a different
extent to competition, mainly as an influence of the European Union’s electricity directives. An
important element of the new, deregulated electricity market design is the introduction of power
exchanges that enable market participants to trade with electricity spot, forward and futures
contracts. Starting from the UK, many European countries founded power exchanges, the
cooperation of which until the moment has a rather regional character.
The present study is divided into a theoretical and a practical part. In the theoretical part is provided
an overview of the electricity market design in Europe, the main deregulation legislative steps of the
European Union in the electricity sector, a comparison of the organisation and the products of
selected European power exchanges, as well as the main regional electricity sector cooperation
initiatives.
The practical part1 of this study analyses the dependency of the power exchange – quoted hourly
spot electricity prices in the period 01.01.2007 – 31.12.2008 for: EXAA (Austria), EEX (Germany),
Nord Pool, OMEL (Spain) and SWISSIX (Switzerland). Dependencies between the spot prices of the
selected power exchanges are analysed with two types of rank correlation coefficients and with
copulas.
The results of the study indicate a positive dependency with Kendall’s tau in the range (0,5121-
0,8377) between the grouped in ten possible pairs hourly spot electricity prices.
The strongest dependency is found to be between the spot electricity prices of EXAA and EEX. High
positive dependency is detected also for the spot electricity prices of Switzerland with the
neighbouring Austria and Germany. Nord Pool exhibits stronger dependence with SWISSIX than with
the other analysed spot electricity prices datasets. The lowest dependency is registered between the
spot electricity prices of OMEL and Nord Pool.
In addition, the copula analysis shows that the spot electricity prices on the selected power
exchanges tend to experience low values together. The goodness-of-a-fit test for copulas indicates
that the most suitable copula to model this type of price dynamics is the Clayton one. Finally, a
conclusion is made that the reviewed power exchanges exhibit a different degree of integration and
have a higher level of dependency rather on a regional level.
1 All calculations are provided on a CD-ROM.

Stochastic dependencies of spot prices in the European electricity markets
5
CHAPTER I DEREGULATED ELECTRICITY MARKETS IN EUROPE
1. Overview of the major legislative steps, aiming liberalization of the European electricity markets
The deregulation of the European electricity markets to a large extent has been initiated and
influenced by the legislation of the European Community2 (EC) and European Union (EU). Initially,
there was no explicit legal mention of the treatment of the energy sector in the general principles for
free movement of goods, services, persons and capital in the Treaty of the European Economic
Community, signed in 1957. The Single European Act from 1987 changed the unanimity rule for
voting of energy sector legislation to majority voting, which facilitated closer cooperation between
the Member States. With the Maastricht Treaty, which entered into force in November 1993, the
European Community was explicitly empowered to take energy sector measures. As a next step, the
EU introduced energy sector-specific directives, targeting its gradual liberalisation.
The First Electricity Directive 96/92/EC established a system of minimum harmonisation rules and, as
a consequence, the electricity sector development of the fifteen at that time national markets was
progressing with different speed. The directive targeted gradual and partial opening of Member
States’ electricity markets. It introduced a threshold of minimum required opening to all consumers:
40 GWh by 1999, 20 GWh by 2000 and 9 GWh by 2003 (Roggenkamp and Boisseleau, 2005). Only a
limited group of customers, referred to in the directive as “eligible customers”, had the freedom to
buy electricity from any supplier. As a part of the domestic market opening requirement, referred to
in the directive as “third party access” (TPA), a choice between three procedures was offered: the
negotiated third party access (nTPA), the regulated third party access (rTPA) and the single buyer
model. In the nTPA model producers and consumers were able to negotiate grid access with the
system operator. The rTPA required all eligible consumers to purchase electricity at pre-approved by
the regulator tariffs; price-fixing by means of negotiations was not allowed. The single buyer model
gave monopoly rights to a single legal entity to be the only electricity purchaser and its
implementation was not a common practice.
The Second Electricity Directive 2003/54/EC introduced full electricity market opening requirement
for all Member States’ national markets. All non-household customers were eligible to purchase
electricity from any supplier from 1 July 2004; 3 years later all household customers were eligible too
(art. 21, Directive 2003/54/EC). As the choice between the three TPA models, provided in the First
2 The term “European Communities”, more frequently referred to as “European Community” (EC), emerged
with the Merger Treaty of 1957, which founded a single set of institutions of three co-existing at that time
communities (European Coal and Steal Community, European Economic Community and European Atomic
Energy Community). The Maastricht Treaty, signed in 1992, had created the European Union and has officially
changed the name of the European Economic Community to “Economic Community”.

Stochastic dependencies of spot prices in the European electricity markets
6
Electricity Directive, did not enable convergence of the national markets towards the targeted,
harmonised EU-wide internal energy market, as a major change the Second Electricity Directive
introduced a single regime: the rTPA.
The first two electricity directives introduced for the first time at EU level the issue of separating
electricity production from supply, a provision, referred to as “unbundling”. Taking into account the
unbundling initiative, the liberalised European market design is summarised on Figure 1.
As a part of the unbundling initiative the first electricity package required vertically-integrated
companies (including generation, transmission and distribution activities) to represent a separate
balance sheet for each activity. The aim of this measure was to avoid cross-financing between
different activities in the same company. As a next step, the second electricity package required legal
unbundling of electricity transmission, operated by a Transmission System Operator (TSO), and of
electricity distribution, operated by a Distribution System Operator (DSO), in separate, independent
of supply, companies. There were set deadlines for introduction of the legal unbundling for both
system operators groups: 1 July 2004 for the TSOs and 1 July 2007 for the DSOs. Although the TSOs
have an important role on the electricity market, because they determine how will be used the
interconnection capacity in the electricity system, the setting of minimum requirements for their
activity remained within Member States’ authority and consequently convergence towards a
synchronously functioning EU-wide TSO model as a part of the targeted internal electricity European
market was dependent on the success of regional initiatives between Member States. (Roggenkamp
and Boisseleau, 2005).
Member States that opted for full ownership unbundling for their electricity TSOs are: the Czech
Republic, Denmark, Finland, Italy, Lithuania, the Netherlands, Portugal, Romania, Slovakia, Slovenia,
Spain, Sweden and the UK (SEC/2007/1179). Often TSOs ownership unbundling is done through
privatisation. In contrast, in Norway a law was passed in 2000, stipulating nationalisation of
electricity network. In Spain and Italy was preferred TSOs ownership unbundling again through
state’s intervention: by gradual limitation of shareholding of the integrated companies in the
network operators (SEC/2007/1179).
Under the Second Electricity directive, DSOs with more than 100,000 customers are subject to the
same unbundling regime as the TSO. If DSOs have fewer than the threshold level of 100,000
customers, they may be excluded at Member State’s discretion from the basic unbundling regime of
the electricity directive (art. 15, Directive 2003/54/EC). This larger scale threshold limit raises the
question whether all potential customers get fair network access. The setting of broader rules on
DSO level, compared to the TSO case, stems from the fact that the issue of network access
discrimination on DSO level seems to be less relevant for the EU. The arguments in favour of this
statement are: lack of congestions on DSO level and therefore existence of equal-basis network

Stochastic dependencies of spot prices in the European electricity markets
7
access; DSOs are not involved in balancing3, therefore market malfunctioning is also impossible;
customers determine DSO investments, not suppliers, importers or generators as it is the case of
transmission; essentially DSOs have local flows, therefore the cross-border regulation for the case of
TSOs is not so relevant; finally, full ownership unbundling, as in the case of TSOs, may be difficult to
implement, as on EU level there are several hundred DSOs (SEC/2007/1179).
The recentest Third Electricity Directive has been tabled after an assessment report in 2007 of the
European Commission found out that the electricity market still exhibits characteristics, which are
not consistent with market liberalisation. As an example of market malfunctioning is indicated the
market concentration: vertically-integrated national and regional monopolies4 control the wholesale
electricity market and impose barriers to entry on new market entrants (EurActiv, 04/10/05,
updated: 07/07/2009). Other problematic areas on the European electricity market are: lack of
market integration and transparency; vertically-integrated companies are not motivated to invest in
network capacity, because their “congestion5 revenues” are higher than the potential profits if they
expand the existing capacity; insufficient co-ordination between national energy networks; electricity
price caps on some Member States’ markets, set to counteract market power of companies with
dominant position, cause market malfunctioning and suppress price signals that new capacity is
needed, thus exacerbating the grid underinvestment problem (SEC/2007/1179).
As in many countries unbundling lags behind scheduled deadlines (SEC/2007/1179), the third
electricity package provides suppliers in Member States with three concrete options for separating
electricity production from supply (EurActiv, 04/10/05, updated: 07/07/2009):
- Ownership unbundling
Ownership unbundling, preferred by the European Commission, obliges companies that control both
electricity generation and transmission to sell part of their assets. Investors are allowed to keep their
participation in the ex-vertically-integrated groups by means of a share-splitting scheme, whereby
two new shares are offered for each existing one. The individual investor can own both electricity
generation and transmission assets, as long as they constitute a non-controlling minority interest.
- Independent System Operator (ISO)
The Independent System Operator (ISO) is a compromise proposal, accepted by the European
Commission, whereby companies, involved in energy production and supply, are allowed to keep
their share in their related transmission companies. However, the management of the network
3 For definition of “balancing” see section 3 of Chapter 1. 4 The latest “Report on progress in creating the internal gas and electricity market” of the European Commission from 2009 again emphasizes on the high wholesale electricity market concentration: the three biggest generators control more than 70% of generation in 15 Member States. 5 For definition of “congestion” see section 6.1 of Chapter 1.

Stochastic dependencies of spot prices in the European electricity markets
8
assets is left to an independent company (ISO), to be chosen by national authorities after the
approval by the European Commission.
The assessment report SEC/2007/1179 of the European Commission indicates as the best known
example of ISO model in EU the implemented one in Scotland. Contrary to the third electricity
package proposal for enforcing the ISO role, the asset owners of the Scottish grid (vertically-
integrated companies) have considerable influence on both investment and operational grid
maintenance, while the ISO performs only day-to-day operational tasks and can comment on the
investment plan (SEC/2007/1179). The assessment report of the European Commission indicates
arguments that question the efficiency of the ISO model in Scotland. First, the Scottish electricity
market is relatively small and isolated from the rest of the UK, therefore its operation is not
problematic. Second, the Scottish electricity market is monitored by the UK electricity regulator
Ofgem. Third, the TSO of England and Wales is experienced and prevents problems with the
neighbouring Scottish border.
Switzerland opted temporary for the implementation of an ISO model with the setting of an
independent common TSO Swissgrid by seven vertically-integrated companies, to be transformed in
a TSO with its own network assets (SEC/2007/1179).
In conclusion, the current implementation of the ISO model in the EU is not a common practice. A
complex-structure ISO in the USA, with about 550 members is the PJM6 (PJM, 2008). In its
assessment report form 2007 the European Commission indicates as a major problem of the several
ISO models available in the USA the underinvestment in transmission and generation.
- Independent Transmission Operator (ITO)
The Independent Transmission Operator (ITO) option, or the “third way” as emerged during the
negotiations for the Third Electricity Directive, was introduced on proposal by France and Germany,
which were against full unbundling and have strong former state-owned vertically-integrated
generation and supply monopolies. Similarly to the ISO option, the ITO model allows electricity
generation and supply companies to retain their ownership of the electricity grid. The “third way”
opts for an independent transmission operator to perform the daily management of the electricity
grids.
During the negotiations about the Third Electricity Directive it became apparent that most Member
States opt for the ownership unbundling or the “third way” for electricity sector unbundling, as the
ISO option appeared unattractive7 to them.
However, currently only France and Germany have won European Council’s approval to apply the ITO
model (EurActiv, 25/03/2009), although initially it was proposed in a joint letter by eight countries:
6 Abbreviation from the original network areas: Pennsylvania, New Jersey, Michigan.
7 For more details see: Eight EU states oppose unbundling, table 'third way', EurActiv, 1 February 2008.

Stochastic dependencies of spot prices in the European electricity markets
9
Austria, Bulgaria, France, Germany, Greece, Luxembourg, Latvia and the Slovak Republic. (EurActiv,
01/02/2008).
The Third Electricity Directive, compared to the second one, emphasises on the details of the roles of
the national electricity regulators and the to-be-established at EC-level European Agency for the
Cooperation of Energy Regulators (ACER). The new agency controls the implementation of the
network development plans, submitted by the national regulators, monitors whether market players
act fairly at both national and EU level and issues recommendations about possible electricity sector
improvements (EurActiv, 13/03/2008 and EurActiv, 25/03/2009). However, as the recommendations
have a non-binding character, the current contribution of ACER in the process of creation of an
internal European electricity market can be qualified as limited. This view is also supported by the
EU's two main energy regulatory bodies, the Council of European Energy Regulators (CEER) and the
European Regulators Group for Electricity and Gas (ERGEG) 8.
The third energy package foresees closer cooperation between national TSOs, which till that moment
was organized only on the basis of voluntary regional initiatives. As a consequence is created the
European Network of Transmission System Operators for Electricity (ENTSO E). Its main task is to
prevent market power abuse, to implement common security standards and to create equal
operating conditions in the EU Member States for cross-border trade (EurActiv, 25/03/2009).
Figure 1. Market design of deregulated EU power markets
Source: EFET, 2005
8 For more information see EurActiv, 25/01/2008.

Stochastic dependencies of spot prices in the European electricity markets
10
2. Introduction to the deregulated electricity markets’ design
Reforms in the traditionally vertically-integrated electricity sector have been initiated in Chile (1982),
UK (1989), followed by Norway (1990) and since then were led by Anglo-American, Latin American
and Scandinavian countries (Pollitt, 2009).
In Europe the EU electricity directives influenced to a large extent the current design of the
liberalised electricity markets. As a part of EU’s effort, on the one hand, for more deregulated
national electricity marketplaces and, on the other hand, for a single Europe-wide electricity market,
the unbundling initiative introduces a distinction between electricity as a good or commodity and as
a transportation service. Although since 1 July 2007 within the EU area all consumers are free to
choose their supplier, more active development of electricity trade is to be found on the wholesale
market. Therefore, the present market design description concentrates on the wholesale market
design and not on the retail market development.
Before liberalisation electricity trade was traditionally organised on the basis of bilateral OTC
contracts for physical delivery. Typically the OTC market operates from several years before real time
physical delivery up to 24 hours before it. Such a long contractual period can be explained with the
need to reduce uncertainty about the considerably more volatile than in other markets electricity
prices, as electricity is a non-storable commodity. Spot reference rates can be used in short term OTC
contracts, days or hours ahead of physical delivery; forward reference rates or forecasts can be used
in more long-term OTC contracts. OTC bilateral trade can be arranged either directly, between a
buyer and seller, or with a broker as an intermediary.
Since liberalisation, in addition to the traditional OTC trade, some European countries have
introduced power exchanges trade. The motivation for introducing power exchanges is that they
offer anonymous trade with much lower transaction costs. There spot electricity trade9 tends to be
concentrated in the last 24 hours before real time physical delivery. As demand and supply become
less uncertain with the approaching of real time physical delivery, market participants use the power
exchange to fine-tune their orders. In other words, electricity exchanges add liquidity to power trade.
Furthermore, market participants are not subject to counterparty risk, as it is transferred to the
power exchange, which selects its client under a set of trade and operational rules.
The EU-monitored indicator of power exchange-traded volumes as a percentage of electricity
consumption (Figure 2) can be interpreted as an indicator of the market participants’ perception of
the power exchange’s importance. Figure 2 shows that in the Nord Pool EU Member States, Spain,
Portugal, Italy, the Netherlands and Germany power exchanges are a popular marketplace for spot
9 Throughout this thesis I refer only to spot electricity trade of power exchanges in Europe. Forward electricity
trade remains outside the scope of the study.

Stochastic dependencies of spot prices in the European electricity markets
11
electricity trade. It should be also noted that not on all indicated European markets the high
participation is a result of the trust in the effectiveness of the power exchange market mechanism
but of additional stimulating measures. For example on the Spanish and Italian marketplaces
participants receive side payments as an incentive to take part on them (Roggenkamp and
Boisseleau, 2005) and this is a reason for the high spot electricity volumes traded there. The high
participation on Nord Pool is explained by the fact that exchange trade is mandatory for international
trade (Meeus, 2006).
Figure 2. Power exchange-traded spot volumes in 2007 as a percentage of electricity consumption
Source: COM/2009/115
3. The Power exchange spot market organisation
- Day-ahead market
As a minimum, spot trade on the European power exchanges is organised on the Day-Ahead Market
(DAM). Usually deals are for electricity delivery for any of the 24 hours of the next day. In addition,
combined bids, referred to as “block bid” for several hours of the next day can be submitted. Block
bids, as a rule, have to comply with a fill-or-kill constraint, meaning that partial fulfilment is not
possible. The overview of the spot products of selected power exchanges in Europe in section 7 of
Chapter 1 shows that there is rather a concentration of trade in a relatively small amount of
products. The explanation of this product design is that the power exchange spot price is used as a
reference price for different forward and financial contracts and as such must give a non-dubious
market signal, understandable for all market participants. Therefore, if the products are too
complicate, price signals may lead to inadequate decisions.
020406080
10099,16 85,32 80,06
65,1145,85 43,63
21,48 18,489,2 8,43 4,71 3,73 1,6 0,01

Stochastic dependencies of spot prices in the European electricity markets
12
- Intraday market (Hour ahead market)
There exists a time interval between the gate closure10 of the DAM market and real time delivery,
which varies among countries. Market participants may receive new, unexpected information (for
example power plant failures, temperature forecasts changes, updates of wind forecasts) which may
require a change of their trading position. Therefore, in the interval between DAM closure and real
time delivery in some European power markets is located the intraday market, also referred to as
“Hour Ahead market”, which enables market participants to balance further their trading positions.
In addition to reducing pricing uncertainty, intraday markets are a second chance to find a feasible
equilibrium price, if the DAM market has failed to establish it.
An explanation why the DAM market may fail to find a market clearing price, is the difference in the
pricing design between the power exchanges, which are the preferred marketplace design is Europe
and the power pools (Australia, New Zealand, Russia, Canada, the US region PJM). Power pools are
centralised, with mandatory supply-side participation, which enables coordination of electricity
generation and transmission. Bid formats in power pools, in contrast to power exchanges, take into
account network constraints and non-convexities (Meeus, 2006), and reflect better the cost structure
of generators. Furthermore, power pools bids combine information from the DAM and balancing
markets, which under the power exchange model usually are asynchronous (Ockenfels et al., 2008).
In conclusion, comparing power exchange’s and power pool’s bid formats, the first appears to be
considerably more simplified, and sometimes unable to deliver a market clearing price. For this
reason, some European power exchanges have opted for the introduction of an intraday market
segment. Typically, on the hour-ahead market are traded both hourly and block contracts.
According to González, (2008) electricity trade will benefit if the intraday liquidity, available
nationally, is extended to cover areas with cross-border available capacity. The author states that in
this way smaller national markets may take advantage of the available liquidity on neighbouring,
bigger markets. González, (2008) indicates as a success condition for intra-day cross-border trade the
available capacity to be traded on an irrevocable, firm basis by implicit11 allocation mechanism.
The idea of extending the intraday’s market role in cross-border trade is in line with European
Commission’s objective to create a single EU-wide Internal electricity market (ETSO, EuroPEX, 2009
and Meeus, 2006).
- Balancing services market
After the spot market’s gate closure market participants cannot adjust their contractual positions,
compared to what they are expected to deliver or consume in real time. However, market
10
Gate closure means that the submitted DAM bids and orders cannot be further modified. 11 Implicit allocation mechanisms are explained in section 6.1 of Chapter 1.

Stochastic dependencies of spot prices in the European electricity markets
13
participants may need to accommodate for some unexpected schedule change and therefore, in
order not to threaten the security of the electricity system operation, a balancing services market is
organised. A central counterparty in balancing is the TSO and its functions, as far as regulated on EU
level, are:
"… operating, ensuring the maintenance of and, if necessary, developing the transmission system in a
given area and, where applicable, its interconnections with other systems, and for ensuring the long-
term ability of the system to meet reasonable demands for the transmission of electricity” (art. 2,
para. 4, Third Electricity Directive of the EU).
In general as typical tasks, performed by the TSO, although with different way of organisation, can be
outlined (Sioshansi, 2008):
- Network capacity investment in order to guarantee that sufficient capacity is made available
in the electricity grid and technical security standards are complied with;
- Network access authorisation – each grid user can gain access to the grid only from the
respective TSO;
- Levying of transmission charges – each TSO recovers incurred costs of electricity transmission
by means of charges;
- Congestion management, balance and ancillary services procurement;
- Emergency planning and, as a final resort, system restart;
- Day-to-day grid maintenance and operation.
Furthermore, each TSO is responsible for maintaining on continuous basis the equilibrium between
supply and demand in the electricity grid. As a part of this task, the TSO keeps an energy account for
every user of the electricity system, where it registers all user’s grid feedings and withdrawals in
points in time with a high frequency. The TSO is responsible for establishing deviations from the
schedule in the energy balance of every grid user. Based on a signed balancing contract with every
grid user, the TSO operates a balance area (TSO zone) for the grid user, which is a pre-condition for
physical settlement of DAM spot contracts, as well as futures contracts with physical delivery. In
table 1 are represented the TSOs is the main European countries. As a rule each TSO is responsible
for the whole national territory.
Table 1. TSOs is the main European countries
Country TSO Grid operator/ owner Imbalance settlement
Power exchange
Britain NGET NGET (England and Wales), SSE (North Scotland),SP (South Scotland)
Elexon APX (UK)
Ireland EirGrid ESBNG EirGrid

Stochastic dependencies of spot prices in the European electricity markets
14
Northern Ireland SONI
France RTE Powernext
Denmark Energinet.dk Nord Pool
Finland Fingrid
Norway Statnett
Sweden Svenska Kraftnat
Austria (APG) VERBUND APG APCS EXAA
Austria (Tirol) TIRAG A&B
Austria (Vorarlberg) VKW Netz
Belgium Elia Belpex
Germany EnBW Transportnetze AG, E.ON Netz GmbH, RWE Transportnetz Strom GmbHNET, Vattenfall Europe Transmission GmbH
EEX
Greece HTSO HTSO / PPC HTSO
Hungary MAVIR Rt. (ISO) MVM Rt. MAVIR Rt.
Italy GRTN 13 owners with TERNA >95%
GME/GRTN
Luxembourg Cegedel
Netherlands TenneT APX NL
Poland Polskie Sieci Elektroenergetyczne SA Towarowa Gielda Energii SA
Portugal REN
Romania C.N. Transelectrica S.A.
Slovak Republic Slovenska elektrizacna prenosova sustava, a.s.
Slovenia ELES BORZEN (controlled subsidary of ELES)
BORZEN
Spain Red Electrica de España (REE) CompañÍa Operadora del Mercado de Electricidad (OMEL)
Source: with updates from Sioshansi, (2008)
Unbalanced grid users submit electricity withdrawal and injection orders to the relevant TSO, which
is responsible for settling them. Bids for balancing are selected by merit order for each hour (Figure
3).
Figure 3. Bids in merit order for each hour for handling of imbalances
Source: Jan Vidar Thoresen (2005)

Stochastic dependencies of spot prices in the European electricity markets
15
In Jan Vidar Thoresen (2005) are mentioned some general imbalance settlement rules: the
responsible TSO selects the cheapest bids if electricity generation for the specific hour has to be
increased, and the most expensive, if generation must be decreased; the last called upon unit in each
hour defines the real time price for the specific hour; the procedures for pricing of imbalances are
different in the TSO areas; transmission costs, incurred by the TSO are transferred to the grid users
by means of tariffs.
According to Meeus (2006), balancing markets range from mandatory to purely commercial, they
may cover the day-ahead market, or extend to a longer period, but as a rule payments for balancing
are based on availability and grid utilisation. He stresses that open electricity position imbalance of a
market participant may also be deliberate, as the unbalance settlement price is the final, real time
electricity price. In principle the responsible TSO discourages by charges12 market participants’
deviations from their pre-announced individual consumption and production schedules and relying
on real time imbalances settlement (Meeus, 2006). As a part of the EU unbundling initiative, TSOs are
not supposed to own generation resources. Consequently, they procure their balancing obligations
to market participants or nominated representatives, referred to as Balance Responsible Parties
(BRP) (Vandezande et al., 2008).
On European level, balancing markets have a potential to add liquidity to the wholesale electricity
trade, while at the same time they do not require additional technical investments (Madlener and
Kaufmann, 2002). To be able to expand their cross-border potential, European national balancing
markets have to find a successful solution to some current market design imperfections.
First, there are differences13 in the procurement and remuneration of balancing services across
Europe, impeding the targeted on EU level electricity market integration and creation of a single
internal EU market. As an example Tractabel Engineering (2009) indicates the difference between
imbalance settlement: with penalties (Germany, the Netherlands) and without penalties (Belgium
and France). According to their report, illustrated on Figure 4, if country B uses imbalance settlement
without penalties, this may lead to “fuite de réserves” (engl. “reserves flight”) to country A, which
applies imbalance settlement with penalties. The intensity of the market distorting effect, as
represented on Figure 4, depends on the level of integration between the Day-Ahead and Intraday
markets of country A and B.
12
Art. 15 “Dispatching and balancing”, para. 7, EU Third Electricity Directive: “Rules adopted by transmission system
operators for balancing the electricity system shall be objective, transparent and non-discriminatory, including rules for
charging system users of their networks for energy imbalance. The terms and conditions, including the rules and tariffs, for
the provision of such services by transmission system operators shall be established pursuant to a methodology compatible
with Article 37(6) in a non-discriminatory and cost-reflective way and shall be published.” 13
See for more details the report of Tractabel Engineering (2009): http://ec.europa.eu/energy/gas_electricity/studies/doc/electricity/2009_balancing_markets.pdf

Stochastic dependencies of spot prices in the European electricity markets
16
Figure 4. Possible distortions, following non-harmonised imbalance settlement
Country A
Country B
Source: Tractebel Engineering (2009)
Abbreviations, used in Figure 4:
Country A: imbalance settlement with penalties, Country B: imbalance settlement without penalties
(1) BRP in country A will be more inclined not to resort to real-time imbalance settlement, as they
have to pay penalties. Consequently, they are more active on the Day-Ahead and Intraday market
and the uplift of demand causes an increase in electricity wholesale prices, while the balancing
services supply is expected to fall. (2) The wholesale electricity markets of country A and B are
integrated. Consequently, the change in prices from country A is spread to country B. (3) If cross-
border balancing implementation exists, may occur reserves flight from country B to country A; it
other words country A may spread its imbalances to country B.
The report of Tractebel Engineering (2009) concludes that the need for increased harmonisation of
cross-border balancing market design grows with the integration of spot Day-Ahead and Intraday
markets.
As a second major obstacle to benefit from Europe-wide balancing markets, Belmans and Meeus
(2007) and the European Commission (COM/2009/115) point out the weak interconnection between
the otherwise well-developed national grids. In other words, cross border electricity trade has to
allocate frequently scarce capacity using different methods to account for transmission constraints
and possible cuts in the transmission grid. This process is referred in the practice as “congestion
management”.
In contrast to electricity cross-border trade, most European power exchanges match supply and
demand bids to find the market clearing price free of any national transmission constraints or
technical limits (Roggenkamp and Boisseleau, 2005). An exception to this rule is the Spanish
Day-Ahead and Intraday
market
(1) Demand↑→Price↑
And Supply ↓
(2) Demand ↓→Price↓
Day-Ahead and Intraday
market
(2) Demand↑→Price↑
Real-time
Settlement with
penalty
Real time
Settlement
without penalty
2 2
3
1
3

Stochastic dependencies of spot prices in the European electricity markets
17
marketplace Omel. There the single intra-zonal price, calculated by OMEL, is increased to account for
national network constraints, which are dealt with by redispatching of available capacity (Meeus,
2006). Socialising costs, arising from insufficient national network capacity, by an uplift of the single
wholesale price, distorts competition incentives on the Spanish marketplace; a better alternative
would be to use transmission tariffs (Meeus, 2006).
- Ancillary services market
The TSO also is a central counter party in the system services (also referred to as “ancillary services
trade”). There are included services like voltage control and black-start14 capacities, to be also
delivered in real time. In contrast to balancing services, for which each participant is individually
charged, for the ancillary services is applied a solidarity principle: costs are paid by all grid users by
means of transmission tariffs (Meeus, 2006). Balancing and ancillary services markets are
chronologically followed by real time electricity physical delivery and trade account settlement. All
mentioned phases of wholesale electricity trade are illustrated on Figure 5.
14 A black start involves restoring a power generator to operation independently from external energy sources. For more information see: http://www.nationalgrid.com/NR/rdonlyres/99A34EB4-76F4-4042-AA12-35D6DD843FA7/3073/black_start.pdf

Stochastic dependencies of spot prices in the European electricity markets
18
Figure 5. Typical timescales for trading of electricity
Year(s) ahead
Month/Week ahead
Day ahead Intra day Balancing period Settlement
Source: with modifications from Sioshansi, (2008); RED, (2007); ETSO, EuroPEX, (2009); Belmans and
Meeus, (2007).
4. Differences between power pools and power exchanges
Electricity markets can be categorised in power pools and power exchanges, although most often
European marketplaces have characteristics, inherent for both market types.
Gate
Closure
Real time
delivery Bilateral Over the Counter (OTC) Trading:
Hedging, speculative trade
Anonymous Power Exchange (PX):
Trading: Hedging/Refining Position,
Balancing Trade
PX / Bilateral
Trading:
Refining Position
Balancing Trade
Balancing mechanisms
and balancing markets
TSO buys balancing
energy and system
services and calls off
services under longer
term contracts
System Operator (TSO) Trading:
System Operator strikes long term contracts for the provision of system
services (to ensure available capacity to provide services). The method of
procurement may extend to organized, complementary markets for the
procurement of specific products
Cross-border interconnection
allocation, based on auctions (annual,
quarterly, monthly)
Future
potential:
increase of
cross-border
allocation
Future
potential:
development of
cross-border
allocation
Future potential:
development of cross-
border allocation

Stochastic dependencies of spot prices in the European electricity markets
19
Roggenkamp and Boisseleau (2005) provide a definition of the main characteristics of the power
exchanges and power pools, represented in Table 2.
Table 2. Main characteristics of the power pools and the power exchanges
Source: Roggenkamp and Boisseleau (2005), McGoldrick (2008) and Powernext’s site
15 Whenever bilateral contracts are permitted, the marketplace is classified as non-mandatory.
Roggenkamp, Boisseleau
(2005) definition
Marketplace Initiative Participation Participants Demand participation
Type of bid Bilateral market
Side payments
Power pool Public Mandatory Only generators No Price/quantity/ capacity /unit commitment…
Bids include many technical aspects
and are very complex.
No Yes
Power exchange
Private Voluntary15
Generators, traders,
distributors, large consumers
Yes Price/ quantity Yes No
Name of the marketplace
Participating countries
Initiative Participation Participants Demand participation
Type of bid Bilateral market
Side payments
Nord Pool Norway, Finland, Sweden, Denmark
Semi Private
Voluntary, except for
international trade
Generators, traders,
distributors, large consumers
Yes Price/ quantity Yes No
Omel Spain Public (but now publicly owned)
Voluntary (but encouraged)
Only generators Yes Price/quantity/ capacity /unit
commitment, etc.
Yes Yes
APX NL The Netherlands
Private Voluntary (except for
interconnector capacity
Generators, traders,
distributors, large consumers
Yes Price/ quantity Yes No
EEX Germany Private Voluntary Generators, traders,
distributors, large consumers
Yes Price/ quantity Yes No
EXAA Austria Private Voluntary Generators, traders,
distributors, large consumers
Yes Price/ quantity Yes No
Powernext France Private Voluntary Generators, traders,
distributors, large consumers
Yes Price/ quantity Yes No
APX UK (former UKPX)
UK Private Voluntary Generators, traders,
distributors, large consumers
Yes Price/ quantity Yes No
GME Italy Public Mandatory Only generators No Price/quantity/ capacity /unit
commitment, etc.
No, but contracts for differences
Yes
SEMO the Republic of Ireland
and Northern Ireland
Public Mandatory Only generators No Price/quantity/ capacity /unit
commitment, etc.
No, but contracts for differences
Yes

Stochastic dependencies of spot prices in the European electricity markets
20
A conclusion can be made that: EXAA, EEX, Nord Pool, APX UK, APX NL and Powernext comply with
the provided definition for a power exchange, OMEL, is in-between of a power pool and a power
exchange, while SEMO and GME converge to a power pool.
Both power pools and power exchanges suffer from trade inefficiencies. Power exchanges use
simplified supply and demand matching rules and linear pricing16, which do not always result in
successful finding of market clearing price. In addition, block bids do not allow generators express
directly and fully their cost structure (Meeus, 2006). Both mentioned power exchange design’s
inefficiencies may lead to the exclusion of block bids that can be fulfilled under the market clearing
price. This situation is referred to in Ockenfels et al. (2008) as “Paradoxically Rejected Blocks”. If
linear pricing under power exchanges leads to market inefficiencies, non-linear pricing under power
pools also has its implementation disadvantages. Under the latter market mechanism, there exists a
reference price for each hour of the day. However, not all bids and offers are settled at this price.
Some market participants may receive side-payments, which can be viewed as discriminatory price-
formation. According to Ockenfels et al. (2008) power pools’ use of a guaranteed side payment for
start-up and shut-down costs of generators distorts investment decisions. As an additional pool
market design impairment factor the author indicates the lack of demand participation.
Under power pools supply participation is mandatory and if some generator does not receive a side
payment, it cannot quit the market, but, supposed it can exert market power, it can change its
participation strategy and behaviour. Power exchanges, on the other hand, are voluntary. In this
relation, market participants are aware of power exchange inefficiencies, but are ready to make a
compromise with them. As a rule, traders can always resort to bilateral electricity contracts as a
substitute or a complement for power exchange trade.
5. Auction trading classification
In general auctions are a form of trading, designed to find a price, for which buy and sell orders meet
and a transaction can be formed at a specific point in time. Most European electricity exchanges (APX
NL, EEX, EXAA, Powernext, Borzen, Nord Pool), as well as OMEL and GME use auction-based trade.
Usually equilibrium price is fixed in such a way as to maximise the quantity of contracts bought and /
or sold. In the literature there are additionally proposed criteria for auction equilibrium price fixing:
targeting transaction cost minimisation (Wang and Yin, 2004) or social welfare maximisation (Zou,
2009). Nicolaisen et al. (2001) propose a price matching rule in which first buy orders are sorted in
descending orders, separately from the ascendingly sorted sell orders. As a next step, the highest bid
16
“Linear pricing” means that for each hour of the day a unique (single) market clearing price, valid for all market participants, is established.

Stochastic dependencies of spot prices in the European electricity markets
21
price is matched with the lowest ask price. Finally, the buyer is matched with the seller for an
amount of electricity, calculated as the minimum of: the available transmission capacity; the capacity
of the buyer; and the capacity of the seller.
- One-sided and double-sided auctions
A possible criterion for auction classification is according to the number of bidding parties. For
example on GME only the supply side’s bids are taken in price formation (Roggenkamp and
Boisseleau, 2005), and this is an instance of one-sided auction. A double-sided auction (Nord Pool,
EEX, EXAA, APX NL and OMEL) takes bids from market participants from both the supply and demand
side for price formation.
- Sealed and open auctions
Auctions may be sealed, also referred to in the literature as “anonymous” or “blind”. This means that
each participant does not have information about the submitted by the other market participants
bids. As a rule sealed auctions use only one round of bidding. However, if on the first round
aggregate supply and demand do not cross, the power exchange authority may intervene as a central
counterparty and propose a compromise price fixing solution. In this situation for example EEX
management board17 can cancel orders, which have adverse impact on the establishment of an
intersection between supply and demand. If after the renewed pricing the equilibrium price still
cannot be determined, then EEX may specify proportionate allocation solution.
The opposite variant of a sealed auction is the open auction. According to Denton et al. (2001) sealed
auctions, compared to open auctions, make attempts to exert market power more costly. Ockenfels
et al. (2008) state as a further disadvantage of open auction the requirement bidders to submit
orders synchronously at a given point in time, which involves additional transaction costs. In
conclusion, European power exchanges adhere to the double-sided sealed auction market design,
due to the potential market distortions that open auctions may stimulate.
If the auction classification criterion is the pricing rule, in the electricity markets design literature are
discussed uniform pricing, pay-as-you bid and Vickrey auctions.
- Uniform pricing auctions
The uniform auctions are the prevailing pricing form, used in the spot trade of electricity on the
European power exchanges. As a first step, bids are collected until closure of the call phrase (Gate
closure), then sorted by price and aggregated in a single supply and demand curve for every hour of
the next day. The intersection of the aggregate demand, obtained by adding orders in a decreasing
17
See for details “Introduction to Exchange Trading at EEX on Xetra and Eurex”, 2008, p 27-28.

Stochastic dependencies of spot prices in the European electricity markets
22
order of prices, and the aggregate supply, obtained by adding orders with increasing order of prices,
defines the market clearing price and the market clearing quantity for each hour of the day (Figure
6).
The equilibrium price fixing rule is according to the price limit of the last accepted bid. In other words
all electricity providers, irrelevant of their production costs, receive a uniform price – that of the
“most expensive” power plant (Ockenfels et al., 2008). The uniform price auction does not set a
requirement as in open auctions market participants to bid synchronously. It is enough at least one
supplier and one customer to submit valid bids, for which the equilibrium uniform price can be
successfully determined. Consequently, it may be argued that the uniform price sealed auctions have
lower transaction costs than open auctions, as far as participation expenditures are concerned.
Ockenfels et al. (2008) indicate that uniform auctions are also not immune to market power
incidences: if the electricity market is not competitive enough, uniform pricing may stimulate
capacity withholding, forcing consumers to pay higher prices.
2
Member A, MW
Memer B, MW
Member C, MW
SUM, Purchase
Price
20 020 0
0 900 50 100 101 150 151 200 20151
40 -400 -12020 0 -120
120 100 80 80 60 60 40 40 2020
SUM, Sale
6060 2040 40 20
Aggregate
supplyAggregate
demand
40 80 120
100
200
300
Price
MWh
0 0 -40 -120-120
Source: Jan Vidar Thoresen (2005)
Figure 6: Numerical example for uniform auction hourly spot electricity market clearing price calculation
Note: Sale bids are indicated as negative numbers.
Market Clearing
Price for hour X
Market
Clearing
Quantity for
hour X

Stochastic dependencies of spot prices in the European electricity markets
23
A generalized uniform auction solution algorithm is represented on Figure 7. The calculation of the
market clearing price, formed on the basis of simple bids, without checking any grid capacity
availability, represents the initial solution. In contrast to other power exchanges, Nord Pool takes
into account network constraints in the equilibrium price finding algorithm (Meeus, 2006). By
subsequent adding of bid conditions, specified by the market participants, is established the valid
solution. If the solution is not viable, the impossible to be fulfilled conditions are ignored and the
search-for-solution algorithm is repeated. Block bids are also taken into consideration: for each
included hours’ set in them is calculated an average market clearing price and compared if it is equal
or better than the price limit, set by the market participant (Roggenkamp and Boisseleau, 2005). The
approach block orders to participate in the aggregation process in the form of price-independent bids
is used for example by APX NL, EEX, Nord Pool (Madlener and Kaufmann, 2002).
Figure 7. Basic structure of an auction
Source: Madlener and Kaufmann, 2002
- Pay-as-bid (PAB) auction
In the Pay-as-bid (PAB) auction the total traded electricity quantity is established in the same way as
in the case of the uniform price auction: by finding the crossing point of the aggregate supply and the
aggregate demand for each hour. However, the rule of establishing the equilibrium price for each
hour is different. Participating suppliers receive an individual price, equal to the price they asked for
the respective traded electricity unit. As an advantage of PAB bidding can be indicated the
improvement of the pricing design it brings in the sense that no market participant can receive

Stochastic dependencies of spot prices in the European electricity markets
24
higher price than the previously asked for. On the other hand, a disadvantage of PAB is that it is
beneficial for market participants that can forecast better the market clearing price. In other words,
PAB pricing stimulates gains, generated on the basis of use of asymmetrical information.
Furthermore, PAB bidding requires each trader to incur forecasting costs, as well as additional costs
in case of forecasting errors. This assumption leads to the conclusion that small traders are worse-off
as they have to invest to have at least the same information as bigger traders (Cramton and Stoft,
2002; Kahn et al., 2001). Forecasting costs under the PAB auction can be viewed as an
anticompetitive factor, because they stimulate the survival of bigger companies with market power
on the market (Cramton and Stoft, 2002) and create market entry barriers (Vázquez et al., 2001). PAB
auctions, due to the smaller bidding transparency, stimulate collusive behaviour (Kahn et al., 2001).
Vázquez et al. (2001) extend the abuse-with-dominant-position idea to a longer time perspective.
They state that PAB auction design may exacerbate market power problems in the long run.
Furthermore, PAB auction market design leads to market inefficiency as it destroys one of the main
functions of power exchanges – the clear reference price, to be used for a variety of forward
contracts (Ockenfels et al., 2008). In Europe PAB bidding is only applied in the UK, where historically
electricity is predominantly traded bilaterally. Cramton and Stoft, (2002) explore the inefficiencies of
the UK spot power exchange trading, compared to the uniform pricing auction’s case. According to
them, uniform pricing auctions are efficient, because the price paid by the demand side exactly
equals the price, received by the supply side. In contrast, under the PAB auction there is a difference
between the winning demand side bids and the winning supply side offers. This price spread
constitutes an extra payment for the demand side. Cramton and Stoft, (2002) interpret it as an
artificial, additional transaction costs, discouraging the use of the UK power exchange.
- Vickrey auctions
Vickrey auctions, proposed in 1961 by Willian Vickrey, are a theoretical auction design model, which
although discussed in the electricity market design literature, due to their complexity and market
distorting effects, are not implemented on any of the existing European electricity market so far. This
type of auctions is applicable, at least in theory, for auctioning of a single item and of multiple
identical items. The bidding process is based on a double- sided sealed auction: traders submit
simultaneously bids for a given item. As a next step, in the Vickrey auction the buyer with the highest
bid wins the item but, unlike the standard sealed bid tender, obtains the good at the price of the
second-highest bid (Madlener and Kaufmann, 2002). Ausubel and Milgrom, (2006) indicate as a main
advantage of Vickrey auctions that they provide a mechanism for bidders to report their values
truthfully and consequently increase market efficiency. Madlener and Kaufmann, (2002) reinforce
further this argument. They believe that Vickrey auctions increase social welfare and motivate

Stochastic dependencies of spot prices in the European electricity markets
25
honest bidding even in case that market participants are in a position to exert market power.
Ausubel and Milgrom, (2006) state as another benefit of Vickrey auctions the fact that, compared for
example with PAB auctions, they do not require investments to learn competitors’ strategies.
A strong argument against the use of Vickrey auctions in practice is that they provoke market
inefficiencies due to the different cost-structure of each generator (Figure 8). Even if a generator bids
with its true cost function, it will receive the price for the second highest bid of a generator, which
may have a totally different cost structure. Consequently, under this type of auction, a generator
may frequently run a deficit, as revenues and payments typically do not balance (Fabra et al., 2002).
As a further argument against the use of Vickrey auctions Ausubel and Milgrom, (2006) state
“vulnerability to collusion by a coalition of losing bidders” and “vulnerability to the use of multiple
bidding identities by a single bidder”.
Figure 8. Calculation of the electricity market equilibrium price with the supply (merit order) curve
Source: with modifications from Schindlmayr et al. (2007)
Finally, Hobbs et al. (2000) indicate as an inefficiency of Vickrey auctions that, as in the case of PAB
auction, no clear market clearing price is defined to serve as a reference price for forward and
futures contracts.
In conclusion, although a variety of electricity auction types exists, the auctions for determination of
spot electricity prices in Europe have some common characteristics: double-sided, sealed, uniformly
priced (with the exception of UK), multi unit MW per hour auctions (again with the exception of the
UK, which does not apply auction pricing).

Stochastic dependencies of spot prices in the European electricity markets
26
6. Connecting interdependent European electricity markets
Since initiation of the liberalisation of the European electricity markets, there is a tendency for
increased cross-border trade between the previously isolated centrally-organised national electrical
markets. Regulation 1228/2003 of the EU sets a legal requirement for all Member States to organise
separate markets for transfer capacity on their borders. Consequently, dependency of the European
electricity markets increases, although prices vary across markets (ECORYS Nederland BV, 2008).
Belmans and Meeus (2007) indicate several reasons for the price discrepancies across Europe: cross-
border network capacity is scarce due to underinvestment; it is allocated uncoordinatedly in separate
markets; at most borders cross-border trade stops at the day-ahead stage, leaving intra-day and real
time markets available only for domestic trade.
Until mid-2009 electric power cross-border trade in Europe has been organized by several TSO
unions: Union for the Coordination of the Transmission of Electricity (UCTE)18, Nordel19, Association
of the Transmission System Operators of Ireland (ATSOI) 20, Baltic Transmission System Operators21
(Baltso) and UK Transmission System Operators Association (UKTSOA)22.
As a part of the EU policy to create a single internal electricity market by increasing harmonization of
grid access and network usage, ATSOI, UKTSOA, Nordel and UCTE set up in 1999 a joint organisation:
European Transmission System Operators (ETSO).
18 “The Union for the Co-ordination of Transmission of Electricity was originally set up in 1951 with seven members, Austria, Belgium, France, Federal Republic of Germany, Italy, Luxembourg, and the Netherlands followed by the connection of Denmark. In 1987 Portugal, Spain, Yugoslavia, Greece, and Albania were connected to the system, although the south-eastern European states were disconnected during the Balkan wars of the 1990s. In 1995 the CENTREL system countries of Poland, Czech Republic, Slovak Republic, and Hungary were synchronized. In 1996, Romania and Bulgaria were connected. In 1997 the Maghreb countries Morocco, Algeria, and Tunisia were connected via the Gibraltar interconnector, and the Western Ukraine was connected in 2003.” (Sioshansi, 2008) 19 „ Nordel is a body for cooperation between the TSOs in Denmark, Finland, Iceland, Norway, and Sweden, whose primary objective is to create the conditions for, and to develop further, an efficient and harmonized Nordic electricity market. Iceland is also a member of Nordel but there is no interconnection to the other countries, the closest of which is Norway at 970 km. Denmark also has a foot in the UCTE camp and the western part of the country is therefore synchronized with UCTE.” (Sioshansi, 2008) 20
“The Island of Ireland collaboration is a relatively recent exercise. ESB was until recently responsible for all aspects of generation, supply, and infrastructure in the Republic of Ireland. In 2000 the market began to be opened up. On 1 July, 2006, a ring-fenced subsidiary EirGrid plc took over the TSO responsibilities from ESB, which still owns the infrastructure. SONI, the System Operator for Northern Ireland, is a wholly owned subsidiary of Northern Ireland Electricity and is the TSO for Northern Ireland. Discussions are progressing between EirGrid, SONI, and various regulators on the creation of an “All Island Electricity Market.” The new TSO for the whole island market will be called AIME.” (Sioshansi, 2008) 21 Created in 2006 by the TSOs of Estonia, Latvia and Lithuania. 22 “Until 2005, the transmission systems in England and Wales and Scotland operated separately though there was a high-level technical protocol between the system operators on either side of the Scottish border. From April 2005 a single trading and transmission arrangement across Britain was implemented, termed Betta, which essentially reflected the rollout of the England and Wales Neta style market and a single GB system operator from England and Wales into Scotland. As part of these changes, a number of key changes were introduced that impacted on system operation, including uniform transmission access and pricing rules and appointment of a single TSO independent of market players, with the two Scottish utilities divesting themselves of system operation functions.” (Sioshansi, 2008)

Stochastic dependencies of spot prices in the European electricity markets
27
As of 1 July 2009 the work of ATSOI, BALTSO, ETSO, NORDEL, UCTE and UKTSOA has been fully
transferred and integrated into a new joint TSO association: European Network of Transmission
System Operators for Electricity (ENTSO-E). The establishment of ENTSO E is part of the third EU
energy package legislation. Currently it comprises 42 TSOs from 34 countries (Figure 9). Both regional
and EU-wide TSO cooperation is targeted.
6.1. Capacity allocation methods
Cross border trade, facilitated by the described TSO unions in section 6 of Chapter 1, implements
allocation methods that account for scarce cross-border transmission capacities (Figure 10), and the
possibility of congestion. The term “congestion” is used to describe a situation, in which demand
exceeds the capacity of the electricity transmission grid.
Figure 9. Current ENTSO E participants
RG – abbreviation for “Regional group”
Figure 10. Day Ahead cross-border transmission capacity
allocation as of June 2007
Source ENTSO E Internet site Source: ERI Convergence and Coherence Report, 18 July 2007,
republished in Zimmermann (2007 a)
- Explicit auction capacity allocation

Stochastic dependencies of spot prices in the European electricity markets
28
The most widely used cross border free capacity allocation method is the explicit auction23 (Figure
10). It is used for auctioning of cross-border transmission capacity separately and independently
from the marketplaces, where electricity is auctioned. As a rule transmission capacity is auctioned on
daily, monthly and annual basis.
According to Frontier Economics et al. (2004) the main explicit auction’s characteristics are: the
participating TSOs declare the free transmission capacity to be allocated by the auction; traders have
to indicate the requested capacity amount, as well as the price they are ready to pay for it; bids are
sorted in descending order by their price and capacity is allocated until fully used up; traders (grid
users) incur costs for obtaining transmission capacity, usually set to the price of the lowest allocated
bid. Adamec et al. (2008) clarify that the successfully allocated bid can be equal to the bid in the
auction (“Pay-as-bid”), or it can be equal to the lowest accepted bid (“Marginal Bid Auction”). Explicit
auction participants can gain arbitrage profit due to the different prices, set by different cross-border
explicit auctions (Meeus, 2006). A central counterparty is the relevant TSO, which receives revenue
from the explicit auction management (Adamec et al., 2008).
- Implicit auction capacity allocation
This implicit capacity allocation method is the second widest used in Europe (Figure 10). Implicit
auction is a common term for two power marketplaces’ cross-border trade and congestion
management mechanisms, available in Europe: market coupling and market splitting, both explained
in the present chapter. The main benefit of implicit auctions is that the available transmission
capacity between bid (price, control) areas is included in the spot electricity prices of the
participating power exchanges. Consequently, the resulting prices reflect both the cost of
transmission congestion and the domestic electricity cost. Under implicit auctions it is the
responsibility of the market operator to perform a feasibility check whether the transmission
capacity exceeds the maximum available capacity, to set transmission prices, to include them directly
in the final spot electricity price, for which it receives implicit auction revenue (Adamec et al., 2008).
In a study of Frontier Economics24 et al. (2004) is argued that explicit auctions may yield an inefficient
result, compared to implicit auction allocation, due to the time lag between explicit auction market
clearing and physical delivery.
23 The definitions “explicit auction”, “implicit auction”, “market splitting” are based on Nord Pool’s glossary,
available at: http://www.Nord Poolspot.com/PowerMaket/The-Nordic-model-for-a-liberalised-power-
market/Implicit-auction/Market-coupling/ 24
This view is also reflected in the Energy sector inquiry of January 2007 of the DG for Competition of the
European Commission: “Although explicit auctioning is *…] compatible with Regulation 1228/2003, it has
efficiency deficits compared to implicit auctioning especially where intraday and balancing markets are illiquid.
With implicit auctions results of trade are less likely to have economically irrational use of the interconnector
capacity” (GME, 2008).

Stochastic dependencies of spot prices in the European electricity markets
29
As a further characteristic of implicit auction capacity allocation, Meeus (2006) indicates that cross-
border capacities are not assigned to individual auction participants. He states that the market
arbitrage, which market participants can exploit under explicit auctions, is internalised in the implicit
auction mechanism by coordination of electricity market price clearing on different power
exchanges. This implicit market allocation mechanism gains popularity in Europe and is referred to as
“market coupling”.
Market coupling
Meeus (2006) describes the term “market coupling” as “market clearing in international context with
network constraints”, which “…is about replacing the explicit allocation of transfer capacities in
separate interconnector capacity markets by a system where exchanges can use the capacities to
optimize the clearing of orders introduced to their auctions.” Several conclusions can be made on
basis of this definition. First, a key difference between on the one hand cross-border implicit auction,
market-coupling referred to as its sub-form, and on the other hand nationally-organised power
exchange trade is that under the latter, where the domestic territory may be optionally divided into
separate price zones, network constraints are not taken into consideration. Second, market coupling
involves cooperation between at least two power exchanges. Third, as a rule, market coupling tends
to decrease electricity markets transaction costs, as although electricity exchanges operate their own
settlement and clearing arrangements, they share an operational system to determine the market
clearing price. However, a crucial factor for the success of any market coupling initiative is the
number of participants and their profile.
Merlin, (2007) compares explicit auctions and market coupling allocation. He reaches the conclusion
that explicit auctions as cross-border allocation method, implemented before the market clearing
price fixing, render sub-optimal results, as cross-border capacity may often be underutilised;
transportation may be performed in the wrong direction and national markets can never reach full
integration, even in the case of enough transmission capacity. As a benefit of the market coupling
allocation the author mentions the fact that imports and exports of electricity, as well as market
clearing price-fixing take place simultaneously. Consequently, risks of adverse scheduling of
transmission capacity, as well as of separate trading of electricity and transmission capacity are
removed. Therefore, liquidity on electricity spot markets is expected to increase and, if there is no
congestion, there is a guaranteed convergence of coupled electricity market areas. In conclusion,
market coupling, implemented on the DAM electricity exchanges, increases spot prices
dependencies.
EuroPEX, ETSO, 2009 describe the following two models of market coupling, implemented by power
exchanges in Europe:

Stochastic dependencies of spot prices in the European electricity markets
30
- Price-based coupling (close coupling), under which a common auction office (“coupler”)
determines both electricity flows and prices, which are used as a settlement price by all local power
exchanges.
- Volume-based coupling, under which only the flows are determined on the first stage, while
on the second one the participating local power exchanges calculates the electricity prices. Under
this mechanism the degree of price discrepancies between the participating local power exchanges
depends on the level of precision of incorporation of power exchanges differences in the electricity
flow calculation. As a consequence, volume coupling can vary from “loose” to “tight”. The first
implementation in Europe of tight volume coupling is the started in September 2008 between
Denmark and Germany (EuroPEX, ETSO, 2009).
Market splitting
Under the market splitting mechanism only one power exchange manages the available aggregated
trading capacity on all interconnections (TSO zones) and ensures the correct cross border power
flow. The bids and offers from all bidding areas, for which the power exchange is responsible, and
the allocation of available capacity between the involved bidding areas, define the equilibrium
between supply and demand per bidding area. Pricing under the market splitting follows the general
rule of implicit auctions – transmission capacity price to be reflected in the final spot electricity price.
Currently market splitting is implemented by Italy, Norway, as well as by the Spanish-Portuguese
Iberian Electricity Market (Mercado Ibérico de Electricidad – MIBEL) initiative, and is described in
section 7 of Chapter 1. However, all marketplaces, implementing market splitting, obey a common
set of rules. First, if the auction-requested capacity does not exceed the available for the
interconnected bidding areas, then all biding areas receive the same price. Second, if available
capacity is surpassed, then the responsible for market splitting power exchange splits the bidding
territory into low-price production surplus areas and high price production deficit areas. As a next
step, all available capacity, until full capacity utilisation, is transmitted from the lower price surplus
area to the higher price deficit areas.
6.2. European regional implicit and explicit auctions initiatives
Currently four regional implicit auction initiatives are operational in Europe (Figure 11):
- The Spanish-Portuguese MIBEL initiative, based on market splitting. From 1 July 2007 as a part of
this initiative the Spanish marketplace also calculates the daily spot electricity prices for Portugal,
which are the same as for Spain, if there is no congestion.
- The Trilateral Market Coupling, involving the power exchanges of the Netherlands, Belgium and
France.

Stochastic dependencies of spot prices in the European electricity markets
31
- The Nordic market (Nord Pool Spot) initiative, between Norway, Sweden, Finland, Denmark and the
Kontek region of Germany.
- The market splitting, applied within Italy.
EuroPEX, ETSO, (2009) describe the existing implicit auctions initiatives in Europe as progressing
independently in each region, with unique technical and governance approaches, as well as with little
coordination. These facts lead to the conclusion that the EU target for the creation of a single
internal electricity market is still far from being implemented into practice.
Apart from the already existing implicit auction initiatives, the study of EuroPEX, ETSO, (2009)
identifies eleven initiatives in Europe, working towards the introduction of DAM market coupling
(Figure 12). The study concludes that the horizontal extension of the existing initiatives by adding
new markets (for example in the Central West Region and in the Nordic-Baltic) is progressing well. As
initiatives with less advanced progress they indicate: the Southern and Eastern Europe (Italy
excluded), the Nordic-Central West Europe, BritNed, South West Europe, NorNed. As reasons for the
less satisfactory progress of these initiatives they state: dependency and / or interaction with other
initiatives; technical, organisational and governance arrangements; not clearly defined market
coupling solution; the existence of more than one solution.
EuroPEX, ETSO, (2009) identify four explicit DAM cross-border regional initiatives (Figure 13), which
as a rule are driven by the state or the regulator.
Figure 11 Regions with operational implicit auctions
Mibel
Trilateral Market Coupling
Nord Pool Spot
Italian internal market splitting
Source: EuroPEX, ETSO, (2009)

Stochastic dependencies of spot prices in the European electricity markets
32
Figure 12 Countries, working towards the introduction of regional market coupling
Source: EuroPEX, ETSO, (2009)
Figure 13 Countries, covered by initiatives to establish regional explicit auctions
Source: EuroPEX, ETSO, (2009)

Stochastic dependencies of spot prices in the European electricity markets
33
7. The European Electricity Markets - A Country Overview25
Austria
Energy liberalisation in Austria has been oriented towards deregulation of generation and supply,
while distribution and electricity transmission remained under state’s control (Hofbauer, 2006). The
company Verbundgesellschaft (51 % ownership of the Republic of Austria) preserves its key role of
the largest national energy producer and transporter.
The regulation of the Austrian energy market is implemented through two public bodies26. The first
one is the Energie-Control Kommission (E-Control Commission) with legislative and dispute-settling
power. The second one, Energie-Control GmbH (E-Control), acts as a competition regulator and
monitors energy prices.
Austria started a gradual market opening in 1999, which was fully completed in February 2003.
(Hofbauer, 2006). As a part of the energy sector liberalization policy the Austrian power exchange
EXAA started operation in 2002.
According to Section 1, para. 1 of the Participation rules of EXAA, (EXAA, 2007) the traded spot
product is “spot market electric power – day ahead”. Each of the next 24 single hours27 can be
traded. Block trade in 13 standardized different blocks is also possible. Orders can be submitted from
8:00 to 10:12 on each working day. Both spot hourly and block products are traded in a double-sided,
anonymous, sealed auction during the working days. Contrary to the 7 day trading cycle of EEX, EXAA
adheres to the 5 days trading concept, because on weekends trading shifts are required, leading to
disproportional costs for many small and medium market participants (EXAA, 2009). The central
clearing auction is held at 10:15 a.m. At this moment for each hour of the next day are calculated the
market clearing price (MCP) and the market clearing volume. The MCP of a block is determined as a
mean value of the participating single hours in it.
Post-trading for the available surplus volumes takes place until 10:45 at the latest at the previously
determined MCP. Subsequently, a final schedule for electricity supply the next day is determined.
EXAA is a central counterparty in the clearing of the transactions. The real time physical delivery
takes place in Austria and in the German control areas of RWE and E.ON. However, a single MCP is
applied for both cases as congestions are uncommon (Figure 10).
25
For the country overview in section 7 of this chapter are used the Internet sites, provided in Appendix 1. 27 For the copula estimation in Chapter 5 is used the quoted by EXAA price for each hour of the day hEXA1- hEXA24 in EUR/MWh; in Chapter 5 and on Figures A, B, C, D of Appendix 2 it is abbreviated to “EXAA”.

Stochastic dependencies of spot prices in the European electricity markets
34
Italy
Before liberalization the Italian electricity market was traditionally dominated by the monopoly
company Ente Nazionale per l’Energia Elettrica (ENEL). The implementation of the EU First Electricity
Directive, transposed in the Italian legislation by the implementation of the Bersani decree of 1999,
initiated the opening of the Italian electricity market for competition, which has been achieved
through privatization of ENEL. A new state body, l'Autorità per l'energia elettrica e il gas (AEEG), with
the main tasks to regulate, control and monitor the electricity and gas sector in Italy, was founded in
1995.
It has been decided to preserve state exclusive ownership on the electricity supply. The State also
retained its sole ownership over the electricity transmission and dispatching until 2005. This was
achieved with state-driven initiative in 1999, which created the Italian Transmission System Operator
(GRTN, Gestore della Rete di Trasmissione Nazionale S.p.A.), controlled by the Ministry of Finance
and Economics. In 2005 this activity was transferred28 to Terna S.p.A. (a former subsidiary of Enel,
which became stock exchange-quoted via an initial public offering in 2004). Currently, apart from
being responsible for the usual TSO activities: electricity transmission, dispatching, safe electricity
supply, relief of intra-zonal congestions, creation of energy reserve, grid-maintenance and balancing
services throughout Italy, Terna S.p.A. owns almost the whole Italian high-voltage electricity
transmission grid.
The 1999 Bersani degree defined the creation of two markets. The first one, as required by the EU
First Electricity Directive 96/92, an open market for eligible customers29 with the thresholds for
eligibility to fall till full opening to all consumers, residential included, in 2007. The second market,
designed for transactions with restricted access (including the so-called “captive customers”), is
operated since January 2004 by a Single Buyer, with a parent company the former GRTN (renamed to
GSE S.p.A).
In Italy the Single buyer is designed to ”buy electricity at more favourable conditions on the market
and sell it to distributors or retail sales companies which in turn supply electricity to small consumers
that do not buy on the free market” (AEEG, 2008). According to AEEG (2008) as of the end of 2007 in
Italy the captive market, operated by the Single Buyer, amounts to approximately 40 per cent or
119,388 GWh. A conclusion can be made that although since 1 July 2007 the electricity market was
28 See for details: http://www.terna.it/LinkClick.aspx?FileTicket=dLew%2bLP%2b3iA%3d
29 Eligible customers may choose their supplier. They can purchase electricity directly on the
Electricity Market or through their supplier. Captive customers are those, who are required to sign a
contract with their local distributor, and can purchase electricity in the Electricity Market only
through the mediation of the Single Buyer (GME, 2004).

Stochastic dependencies of spot prices in the European electricity markets
35
completely opened, as required by the EU, and the Italian consumers received the right to choose
their electricity supplier, the Italian government has preferred not to withdraw its protection from
some more vulnerable consumer groups, which in case of complete liberalization could face market
power from electricity generators. The European Commission Report COM/2009/115 places the Italian
wholesale electricity market in the highly concentrated group with a share of 61,2 % of the top three
generators.
Ferraria et al., (2005) state that the Single Buyer concept implies a substantial degree of integration
on the electricity market, because it introduces competition only among generators and retail
distributors. At the same time these two groups of market agents are not able to trade directly; all
electricity flows between them are controlled by a monopoly, the Single Buyer and, as a
consequence, the final consumer is burdened with extra costs. An argument against this statement is
that the electricity consumers’ group is not a homogeneous one and a complete liberalization will
not have the same consequences for all participants.
The Electricity Market Operator, GME, founded by the Legislative Decree 79/1999, transposing into
national legislation the EU First Electricity Directive 96/92, started operation on 31 March 2004. It is
responsible for the organisation and management of transactions on the electricity market and
provides an alternative market for eligible consumers to the existing till the moment bilateral
contracts system.
Figure 14: Structure of the Italian electricity market30
30 Source: with a modification from GME, 2004. Note to Figure 14: On 1 November 2005 GRTN (now
GSE S.p.A.) transferred its electricity dispatching, transmission and grid development assets to Terna
S.p.A. in accordance with Prime Minister’s Decree of 11 May 2004. This change is taken into
consideration into the above representation of the Italian electricity market.
Ancillary services
Supply contracts
Bilateral electricity
contracts
Electricity market Terna
S.p.A
Single Buyer Wholesale customers
Electricity Producers
Eligible customers Captive customers
Ancillary services

Stochastic dependencies of spot prices in the European electricity markets
36
GME organises both the spot and the forward electricity markets. The spot electricity market
comprises the Day-Ahead Market (MGP, Mercato del giorno prima), the adjustment market (MA,
Mercato di aggiustamento) and the ancillary services market (MSD, Mercato del servizio di
dispacciamento).
The MGP is auction-based and provides no continuous trading. The traded product are hourly energy
blocks for the next day, starting from 9 days before the day, preceding the day to which offers and
bids refer (real time market). After the closing of the MGP session every day at 9 a.m. offers and bids
are accepted by GME by merit order, following the common rule of increasing price for supply and of
decreasing price for demand bids. The market participants submit supply and demand offers where
they specify both quantity of electricity as well as minimum and maximum price, at which they are
willing to sell or purchase it. GME aggregates all valid bids and offers into cumulative supply and
demand curves, the intersection of which determines the MCP and the overall tradable quantity for
each of the 24 hours of the next day.
After applying the aggregation principle for determination of the MCP, GME implements a second
rule: a zonal market splitting model, like Nord Pool, based on maximization of the value of the
electricity transactions algorithm, and subject to the transmission limits between zones. For this
purpose GME uses a division of the grid into zones31, consisting of Italian geographical zones,
neighbouring countries’ zones and multiple constrained areas, where interconnection capacity is
smaller than the installed (GME, 2004).
During the search of an acceptable MCP for each hour of the day, the standard market splitting
procedure is implemented with some modifications:
When the electricity flow on the grid does not violate any transmission capacity limit, then
the MCP for all zones is the same.
In case of congestion or violation of capacity limits the available market is split into two
zones: with surplus (the supply zone with lower zonal clearing price) and with deficit (the demand
zone with higher zonal clearing price). Then follows a process of aggregating the supply curve for
each market zone (also including all available import quantities) and demand curve (also including all
available exported quantities). The crossing of both aggregated supply and demand provides the
zonal clearing price, which in this case is different for each zone. The key point is that all supply offers
31 As of 1st January 2009 the national zonal configuration in Italy is as follows: Central Nord (Toscana,
Umbria, Marche), Central South (Lazio, Abruzzo, Campania), Nord (Val D’Aosta, Piemonte, Liguria,
Lombardia, Trentino, Veneto, Friuli Venezia Giulia, Emilia Romagna), South (Molise, Puglia, Basilicata,
Calabria), Sicily and Sardinia. The virtual foreign zones are: Austria, Corsica, Corsica AC, France,
Greece, Slovenia, and Switzerland.
The multiple constrained areas are Brindisi, Foggia, Monfalcone, Priolo G., Rossano
(Source: http://www.mercatoelettrico.org/en/Mercati/MercatoElettrico/Zone.aspx).

Stochastic dependencies of spot prices in the European electricity markets
37
pertaining to a particular zone are valued at the zonal clearing price for that zone. The demand side
participation on the Italian electricity market is calculated in a different way. It is valued as an
average of the zonal prices, weighted to take account of the zonal consumption and results in a
National Single Price (PUN, Prezzo Unico Nazionale).
Bilateral contracts are also included in the Day-Ahead Market algorithm because they affect the
amount of available electricity transmission capacity. Bilateral contracts also participate in calculating
the weighting quantities of the National Single Price. The supply offers are included as zero-priced,
while the demand bids are price-independent.
The following types of offers and bids are accepted on the GME’s MGP:
Simple offer or bid: it consists of a price-quantity pair, where the quantity is the maximal
amount the market participant is willing to buy or sell; the price is the minimum selling or maximum
buying price. The demand side is allowed to submit price independent bids (at zero price).
Multiple offer or bid: consisting of up to four simple offers or bids, but they must be jointly
consistent with the maximum volume that can be sold or purchased at the offer (supply) point, valid
for the particular transaction.
The Adjustment Market allows fine-tuning of trade orders via submission of additional supply and
demand offers, as well as modification of electricity schedules, obtained as a result of the MGP
market. The MA operates between 10:30 a.m. and 2:00 p.m. Accepted offers and bids for each hour
of the next day are valued by GME by merit order at the zonal clearing price, taking into account the
available transmission capacity limits after the closure of the MGP.
The Ancillary Services Market, organized by Terna S.p.A., operates after the notification of the results
of the adjustment market in the time frame between 2:30 p.m. till 4:00 p.m. The accepted bids and
offers on the ancillary services market are valued at the offered (Pay as bid) price (GME, 2004).
As between the invoicing and the final settlement period exists a time span, GME is exposed to a
settlement risk, for the hedging of which it requires collateral. Compared to other European Power
exchanges (Powernext, EEX, Nord Pool Spot, EXAA, Borzen, Omel), GME has the longest guarantee
payment frequency, amounting to one month (GME, 2008 a).
The Nord Pool Spot market
Electricity liberalization in the Nordic area can be classified as a regional initiative which, in contrast
to other European countries, chronologically precedes the First Electricity Directive and has not been
motivated by it. Historically32 the first power exchange in the Nord Pool initiative was founded in
Norway in 1993 and was managed by a related entity to the national TSO company Statnett. In 1996
32
This historical overview is based on: http://www.statnett.no/en/About-Statnett/History-in-brief/

Stochastic dependencies of spot prices in the European electricity markets
38
Sweden liberalized its power market and made a joint exchange, Nord Pool, with Norway. Later in
1996 Finland and in 1999-2000 Denmark also joined the initiative.
In 2002 the financial and the spot markets of Nord Pool were split. As a consequence a new
company, Nord Pool Spot AS, has been established to manage the joint spot market of Norway,
Denmark, Finland, Sweden and more recently the Kontek region in Germany. The ownership of the
new company is divided among the TSOs of Norway, Denmark, Finland and Sweden.
The Norwegian Water Resources and Energy Directorate supervises and regulates the activity of the
Nord Pool spot market. The Banking, Insurance and Securities Commission monitors the financial
market and clearing of Nord Pool.
The Nord Pool Spot is organized as a power exchange, allowing both auction-based trade for each of
the 24 hours of the next day on its Elspot market segment, and intraday continuous trading before
real-time physical delivery on its Elbas market segment. After the end of the trade on both spot
market segments and before real time delivery, in order to achieve equilibrium between input and
off-take of electricity in the grid at any point in time, the TSOs manage a supplementing balance
services market.
The Elspot market implements market splitting in two cases, both nationally and internationally:
First, within Norway, in order to find the intersection point between aggregate supply and
demand for each of the 24 hours of the next day, based on bids and offers, submitted by all market
participants.
Second, for grid congestion management of cross-border interconnections within the Nordic
area. In contrast, domestically Sweden, Denmark and Finland resolve congestions by counter-trade
(re-dispatching), based on submitted offers for electricity supply by generators. For congestions
within its territory Norway combines market splitting and re-dispatching (Roggenkamp and
Boisseleau, 2005).
Price setting by means of market splitting and aggregation of participating electricity supply and
demand can result in two types of prices: system price33 and area price. The system price is an
unconstrained34 market clearing or equilibrium price, which is also used as a standard reference price
in the financial contracts on the Nord Pool forward market. In case of trading capacity constraints,
the total geographic territory of Nord Pool is divided into separate bidding areas and different area
prices by means of market splitting are calculated. Area prices are constrained settlement prices for
33 Following the approach of Tankov and Meyer-Brandis, (2008) for the copula estimation in Chapter 5 is used
the quoted by Nord Pool Spot AS system price for each hour of the day in EUR/MWh; in Chapter 5 and on
Figures A, B, C, D of Appendix 2 it is abbreviated to “NORDPOOL”.
34At this stage interconnection trading capacity between national borders is set to infinity.

Stochastic dependencies of spot prices in the European electricity markets
39
physical delivery of electricity for each hour of the following day in Norway, Denmark, Finland,
Sweden and the Kontek region in Germany.
On the Elspot platform are traded hourly bids with up to 62 non-negative price steps with upper limit
2,000 EUR. Block bids are also allowed. Setting of all-or-nothing condition for bid acceptance is a
standard rule. In addition, a conditional block bid product is allowed, in which the next block is
accepted on condition that the previous is accepted. Such bids are useful for production unit’s cost
optimisation within a time frame and depending on the primary resources for production (Figure 8).
A third block format is the flexible hourly sales bid. The hour for supply is not specified and the bid is
accepted in the hour with a maximum price. This bid option can be used when a scheduled stop of
production is planned, consequently no electricity is needed and it is sold back on the spot market.
The intraday continuous trading platform Elbas follows chronologically the Elspot central auction of
12:00 a.m. and allows for adjustments of electricity production and consumption. Elbas covers as
bidding areas Denmark, Finland, Sweden, since 2007 the whole German territory and, more recently
since 2009, Norway. The traded products are hourly electricity contracts, covering a time span of 36
hours up to one hour before real time delivery.
Spain
Before liberalization all electricity-related activities (generation, transmission and distribution) were
managed by the same vertically-integrated utility, responsible for a specific geographical area
(González and Basagoiti, 1999). In 1985 was founded Red Eléctrica de España S.A., specialized only in
electricity transmission, which acquired the transportation assets from the locally-active electricity
utilities. Then, in line with the EU requirements, was introduced an Electricity act (54/27.11.1997). It
set up provisions for gradual opening of the electricity market, for access of third parties to
transportation and distribution networks, for freedom to establish new generation capacity and to
negotiate the supply of resources for electricity production, for the creation of a wholesale electricity
spot market (Roggenkamp and Boisseleau, 2005). The management of the new market has been
entrusted to two key entities: market operator in charge of the economic management of the market
(Operador del Mercado Ibérico de Energía-Polo Español S.A., OMEL) and TSO (Red Eléctrica de
España S.A.) in charge of the electricity transmission management.
In Spain the spot electricity wholesale market comprises the standard four interrelated sub-markets:
the Day Ahead market (mercado diario), the Intraday market (mercado intradiario), the ancillary
services market (mercado de servicios complementarios y el procedimiento de gestión de desvíos)
and real time imbalances correction market (solución de las restricciones técnicas).

Stochastic dependencies of spot prices in the European electricity markets
40
The Day Ahead market, which handles electricity transactions for the following day and is a central
price reference market, is managed by OMEL. This spot market segment also allows bilateral
contracts. They are included in the calculation of the MCP and of the available transmission capacity.
Sale offers and purchase bids can be submitted, using between 1 and 25 energy blocks for each hour.
Simple sale bids indicate only a price-quantity combination of power to be supplied. Complex sale
bids must comply with the simple bid requirements, as well as with at least one of the following
production-related conditions:
- Indivisibility, which requires a minimum operating value to be set for the first block of each hour.
- Load gradients, designed to prevent unexpected changes in production by setting a maximum
difference between the starting and final block of hourly power.
- Minimum income, designed to ensure a bid to be presented in all hours, provided that the
production unit exceeds a pre-established income level.
- Scheduled stop for a maximum of three hours, applicable only for companies, which have failed to
comply with the minimum income condition and, consequently have been withdrawn from the
matching process on the DAM.
The timetable of the spot electricity trade on DAM is as follows (OMEL, 2008):
- The price for each hour of the following day is calculated on the basis of the received sale offers and
demand bids until 10 a.m. of the current day. The marginal price for each hour of the next day is
obtained by matching the price of the last block of the sale bid of the last accepted electricity
producer, who meets the corresponding demand. At this stage international interconnections for
import and export are not taken into consideration.
- As a next step is considered the interconnection capacity with France, Andorra and Morocco. A
calculation is performed whether there is a surplus of net energy balance in the Iberian electricity
system, comprising Spain and Portugal on basis of the MIBEL35 initiative. Points of congestions are
identified, and if possible, removed.
- As a next step are calculated the transactions between Spain and Portugal. As part of the MIBEL
initiative, since 1 July 2007 the Spanish marketplace36 also calculates the daily spot clearing price for
Portugal. Similarly to GME and Nord Pool, Spain uses a market splitting method. Both the Spanish
35 The aim of the Spanish-Portuguese initiative Iberian Electricity Market (Mercado Ibérico de
Electricidad - MIBEL) is the creation of a single Iberian electricity market, in which all participants
have equal rights and obligations (art. 1, International Agreement of Santiago de Compostela, 2004).
36For the copula estimation in Chapter 5 is used the quoted by OMEL price for each hour of the day
(Precio horario del Mercado diario) in EUR/MWh; in Chapter 5 and on Figures A, B, C, D of Appendix
2 it is abbreviated to “OMEL”.

Stochastic dependencies of spot prices in the European electricity markets
41
and Portuguese prices are identical if the available transmission capacity is enough and if there is no
congestion.
- After incorporating the cross-border bilateral contracts into the DAM schedule, must be calculated
until 2:00 p.m. the daily viable schedule (Programa viable diario), which meets all safety and
technical requirements.
In the time frame between DAM and the real time delivery is located the intraday market, consisting
of 6 consecutive clearing auction sessions: 28, 24, 20, 17, 13 and 9 hours before real time physical
delivery. From the reviewed power marketplaces OMEL is the only one, whose intraday trade is
auction-based. Ockenfels et al. (2008) state that intraday trading, closing far before real time delivery
(135 minutes), and based on clearing auctions, is exposed to higher risk of forecasting error, than if
organized on continuous basis. On the intraday market all production units can submit offers, while
only consumers, who have previously taken part on DAM, can participate (Furió and Lucia, 2008). In
this way the previously undertaken commitments on DAM are adjusted. There is a possibility for the
sellers (buyers) to choose between a simple price-quantity offer (bid) and a complex one. The market
clearing results, obtained on the intraday market, are checked for compliance with the transmission
constrains by the Spanish TSO. The adjustment procedure affects only the participants on the
intraday market, which is a main difference with the technical viability check on the Day Ahead
market (Furió and Lucia, 2008).
OMEL is in charge of the settlement on both DAM and intraday electricity markets. The ancillary
services market, as well as the correction of load and generation imbalances in real time, is managed
by the Spanish TSO (OMEL, 2008).
According to the EU report COM/2009/115, there is a high participation on OMEL (Figure 2): in 2007
it accounted for 80,06 % of total consumption. Roggenkamp and Boisseleau, (2005) explain the high
activity on the Spanish marketplace with the receipt of capacity payments for participation (pagos de
capacidad). In contrast, bilateral trade is not stimulated by such side-payment measures.
Carbajo Josa (2007) describes the capacity payments as a mechanism, which allows the production
units to recover their fixed costs, both for investment purposes and for operational maintenance. He
outlines the main characteristics of the capacity payments:
- Two types of incentive payments are possible: in the short run (up to one year), to enhance the
production capacity to participate in peak demand hours; in the long run are stimulated new capacity
installation investments.
- If a production unit is unable to provide electricity service for the period, for which it has received a
short run capacity payment, it is penalized to return 110 per cent of the sum and is not eligible to
participate in the next short run capacity payment application period.
Stochastic dependencies of spot prices in the European electricity markets
42
- Eligible to receive a long run capacity payments are production units with installed capacity not less
than 50 MW.
Another specific feature of the Spanish electricity market is the considerable share of the regulated
electricity consumption. According to CNE, (2008) in 2007 about 27 % of the electricity was sold in
the liberalised market, while 73% of the volume was traded by regulated suppliers. “In practice, the
regulated consumer price is occasionally interpreted as a price cap on the exchange price. However,
the question of what happens when procurement prices on the exchange increase to above the
consumer price has not been resolved” (Ockenfels et al., 2008). The supply on both regulated and
liberalized electricity markets is dominated by Endesa, Iberdrola and Unión Fenosa (CNE, 2008).
At least until 2010 the Spanish government will implement another intervention measure, a
payment, received by electricity suppliers, which is referred to as “competition transition costs”
(Fabra, 2005). It is calculated as the difference between the consumer price and the exchange price,
net of transaction costs.
France
In its report for 2008 to the European Commission the French energy regulator, Commission de
Regulation de l’Energie, releases the following facts, which characterize the general situation in the
French electricity market37:
The production unit generation capacity in France is mainly managed by EDF (83 %), followed
by Electrabel-Suez (4 %) and SNET (2 %).
Since 1 July 2007 in line with obligatory deregulation requirement of the EU, all French
consumers, residential included, are free to choose their electricity supplier. Three types of contracts
for free choice are possible: a regulated-tariff contract with a predominant share, offered by one of
the more than 160 long-standing suppliers (EDF has a dominant share of 95 %); contracts at market
price (offered by both long-standing and alternative suppliers with market share of 1,3 %) or
contracts at a transitional regulated tariff for a maximum period of two years, available to
consumers, who have already taken out a market price contract.
There are no specific rules to prevent situations where a generating company in a position to
exert market power abuses its dominant position.
Most energy is traded on the OTC market (262 TWh), followed by the forward trade market
(79,4 TWh). The volume, traded on the DAM French power exchange segment Powernext, (both
hourly products and blocks) is considerably smaller: 44,2 TWh.
37 All mentioned numbers are for 2007.

Stochastic dependencies of spot prices in the European electricity markets
43
However, the importance of Powernext since its founding in 2001 is increasing. In 2003 the
Powernext traded volume was 2,04 % (COM/2004/863), while in 2007 it rose to 9,2 %
(COM/2009/115).
The spot market on Powernext is organized on every week day on the DAM and on the intraday
market. The main characteristics of the Powernext spot trade are (EEX, 2009):
Participants on the spot DAM segment may participate in double-sided auction trade with up
to 256 price/quantity combinations for each hour for the next day, with 11 standardised or with user-
defined blocks.
A central DAM clearing auction is held at 11:00 hour. Blocks are executed on all-or-nothing
basis.
The same products, but with more flexibility to define limit orders, for delivery on the current
or on the following day are traded on the intraday market from 11:30 of the current till one hour
before delivery.
In the period 7:30-11:00 DAM continuous trade with delivery for the next day is possible, but
only with the standardised blocks or hourly products.
Great Britain38
In order to create competition on the UK electricity market, an experiment with two different market
systems has been implemented. First, in the period 1990-2001, a centralized pool was created.
Afterwards were established the New Electricity Trading Arrangements (NETA), based on OTC private
contracts between buyers and sellers. In 2005 NETA has been extended to Wales. Under NETA and
BETTA39, the power exchange, as a market place with voluntary participation, was left to evolve
naturally, but up to now it has a rather secondary, complementary role. OTC trade accounts for more
than 98 % (928 TW) of the total traded annual August 06 - July 07 volume (Ofgem, 2008).
As a part this integration process in the electricity industry was applied the model of a single British
system operator, independent from generation and supply. The Utilities Act 2000 prohibited a supply
license holder to hold a distribution or transmission license in a single legal entity (Ofgem, 2008).
The wholesale market organization is divided into the following typical for the liberalised European
electricity sector processes: parallel existence of OTC and power exchange trade, followed by a
balancing stage and electricity system imbalances settlement. Under the OTC arrangements, power
38 Comprises England, Scotland and Wales.
39 BETTA (British Electricity Trading and transmission Arrangements) extends NETA to Scotland. See
Prandini, (2006) for further discussion.

Stochastic dependencies of spot prices in the European electricity markets
44
generators are required to self-despatch electricity, rather than have it centrally dispatched as for
example in the case of the Irish electricity pool (McGoldrick, 2008).
Trading on the operated by the Anglo-Dutch APX Group power exchange APX Power UK is possible in
half-hour contracts or four-hour blocks up to one hour before the real time physical delivery (Table
16). APX Commodities is a central clearing and settlement counterparty.
According to Ockenfels et al. (2008) the lack of a central spot DAM clearing auction and the
application of PAB mechanism for exchange trade reduce transparency, impede the determination of
a clear trade price and contribute for the low liquidity of the APX Power UK trade.
The Power pool of the Republic of Ireland and Northern Ireland
In 2007 was established the Single Electricity Market (SEM) for the Republic of Ireland and Northern
Ireland on the basis of a power pool with mandatory participation. Key players on the power
generation market are ESB (95 % state-owned) and the Spanish Endesa (CER, 2008).
Currently there is one transmission system operator (EirGrid) and one distribution system operator
(ESB Networks), who is also the owner of the transmission system’s assets (Table 1). As part of the
unbundling requirement of EU, in 2006 EirGrid was legally separated from ESB. As a further step, the
various ESB divisions were separated with ring-fencing arrangements (CER, 2008).
The SEM Trading and Settlement Code (TSC) from 2007 stipulates that all market participants in the
mandatory pool have to trade on the basis of the MCP, for which calculation transmission capacity is
assumed to be infinite (unconstrained clearing price application). As in the case of Spain, generators
receive capacity payments, based on the measure of their availability. The Single Electricity Market
Operator (SEMO) is in charge of organizing the pool trade, the resulting from it electricity supply
schedules and payments settlement.
On SEMO’s pool platform the standardized product is a 48-trading period of 30 minutes per DAM
trading day; trade in separate contracts for physical delivery of energy is forbidden (McGoldrick,
2008 and Table 2).
The SEM time frame can be summarised as follows: bids can be submitted 29 days before the DAM
gate closure at 10:00 a.m.; an indicative market schedule is obtained at 12:00 a. m. on the day ahead
(before real time delivery); settlement period starts at 4:00 p.m. on the day after real-time central
dispatch (EirGrid and SONI, 2007).
A specific feature of SEM is that no central notification of bilateral contracts exists, because the Irish
pool participation is mandatory, while in the British system bilateral contracts for each half hour are
notified up to the DAM gate closure, one hour before real time delivery (McGoldrick, 2008).

Stochastic dependencies of spot prices in the European electricity markets
45
Germany
Initially in 2000 in Germany operated two power exchanges: the Leipzig-based LPX (owned by Nord
Pool and the State Bank of Saxony) and the Frankfurt-based EEX, owned by Eurex AG. Both
exchanges merged in 2001 into a single company, EEX, based in Leipzig.
In 2008 EEX and Powernext started a cooperation initiative with the following main aspects:
establishment of a Common Power Spot Exchange in Paris (Epex Spot SE), common Power
Derivatives Exchange in Leipzig and clearing of both energy markets through European Commodity
Clearing AG (ECC) in Leipzig (EEX, Powernext, 2008). Currently on Epex Spot SE are traded the spot
products of Powernext with delivery in France and of EEX: with delivery in Switzerland and, as a
second option, in Austria or Germany.
The spot trade on EEX is organised in three segments: auction-based DAM40, continuous DAM,
intraday continuous trade (Table 3).
The spot market trade of EEX is first held on the organised double-sided anonymous DAM auction,
where both hourly and block products are possible. Hourly bids may be price-dependent, price-
independent or for physical fulfilment of futures contracts. Blocks must fulfil the usual “all-or-
nothing”41 condition, can be price - dependent or price - independent and must follow the general
rule of all reviewed power exchanges: that block bids are executed with lower priority, compared to
hourly bids. Block bids for delivery in the Swiss and in the German or Austrian power grid zones are
identical. However, for delivery in Switzerland the maximum volume per block bid is much more
limited (maximum 50 MW per hour and 30 block bids per participant42), compared to hourly bids
with place for delivery Germany or Austria, where the volume’s cap is set to 300 MW and a
participant33 can submit up to 45 blocks. If the place of electricity delivery is Switzerland, the daily
auction is held at 10:30 a.m.; for delivery in the German or Austrian power grid the daily auction is
held at 12:00 a.m.
For electricity delivery in Germany or Austria, DAM or intraday prices can also be negative numbers43
(Table 3). From an economic perspective, negative prices allow a power generator with high start-up
40 For the copula estimation in Chapter 5 are used the quoted by EEX spot hourly auction prices
(PHELIX and SWISSIX) in EUR/MWh; in Chapter 5 and on Figures A, B, C, D of Appendix 2 they are
abbreviated to “EEX” and “SWISSIX” respectively.
41 An equivalent to “fill-or-kill order”. No partial order fulfillment is allowed.
42 The participant’s group is identified by his trade account.
43 Participation on the spot market with negative prices, as practiced by EEX, is not a common
practice in Europe. On the contrary, it is a standard practice on the balancing energy market, which
chronologically follows the spot energy market. There, excess generators receive a low or even

Stochastic dependencies of spot prices in the European electricity markets
46
or shut-down costs to send a signal to the market when its marginal production cost for a certain
hour has become negative (De Jorg et al., 2003). In this particular situation, the opportunity cost of
shutting down the power generation plant is higher or technologically impossible44 than leaving it to
operate. In other words, for a certain short time period, the market participants agree on the
creation of market inefficiency and waste of product value. Ockenfels et al. (2008) motivate the use
of negative prices on the German power exchange by the fact that they help the supplier to express
his cost structure (Figure 8) more effectively, given the fact that placing offers must comply with
certain restrictions. In conclusion, as unrestricted flexibility in placing order is not possible, negative
prices allow a second-best optimisation solution to be found.
On DAM the MCP is determined for each hour by aggregation of individual supply and demand
orders for delivery in the German or Austrian market area. In case of congestion, it is accorded that a
market splitting procedure will be applied between Germany and Austria. The implementation of this
mechanism may happen on an exceptional basis, because as illustrated on Figure 10, there is no
congestion between Germany and Austria.
The DAM market on EEX allows also continuous block trade in the time interval from 8:00 a.m. to
10:00 a.m.
The EEX continuous intraday market is with place of delivery only the German power grid on the
current or the following day. As on the DAM market, negative bids are possible. Intraday trading
orders can be placed up to 75 minutes before real time delivery. The intraday supply and demand
offers, can be of market or of limit 45 type.
If EEX is compared with other European power exchanges, the same trade organisation is to be found
on Borsen (Slovenia), on Belpex (Belgium) and on Powernext (France). There is no practice to
organise a continuous DAM trade for example on the APX NL (the Netherlands) and Nord Pool Spot
power exchanges.
A country summary of the organisation and products of selected marketplaces is provided in Table 3.
An overview of the main institutional participants on the European electricity market as of 2008 is
provided on Figure 15.
negative price for the excess electricity quantity, they have provided as a penalty for the deviation
from the predetermined contract. In contrast, deficit generators pay a high price for the electricity,
they contracted but were unable to supply. (Source: De Jorg et al., 2003 and Whitney Colella, 2002).
44 De Jorg et al., (2003) explain it with the must-run character of non-flexible generators.
45 “Market orders are buy or sell orders without a price limit and are executed at the next price
determined by the trading system of EEX. Limit orders are buy or sell orders with a price limit which
are executed at the specified price or better.” (EEX, 2008, art. 2.1, § 14 Types of Orders)

Stochastic dependencies of spot prices in the European electricity markets
47
Figure 15 Main institutional participants on the European electricity market as of 2008
Source: von Rintelen, 2008.

Stochastic dependencies of spot prices in the European electricity markets
48
Table 3. Country overview - organisation and products of selected marketplaces
Power exchange EEX EXAA Nord Pool APX NL Powernext APX UK OMEL Belpex
Delivery zone Germany, Austria, Switzerland
Austria Norway, Sweden, Finland, Denmark part of Germany (Kontek region)
The Netherlands
France Great Britain Spain, Portugal
Belgium
Bid floor -3000 €/MWh for Germany, Austria; 0 €/MWh for Switzerland -9 999 €/MWh for continuous trade for Germany only
0,01 €/MWh
0 €/MWh 0,01 €/MWh 0,01 €/MWh - n.a. 0,01 €/MWh
Bid cap 3000€/MWh for auction trade for all delivery zones; 9 999 €/MWh for continuous trade for Germany only
- 2000 €/MWh
3000€/MWh 3000€/MWh - n.a. -
Trading days per week 5 5 7 7 7 7 n.a. 7
Trading participants (Spot)
153 53 124 50 66 57 670 34
Day-ahead trading
Continuous trading
Hours - - - - Yes (1/2 h) - -
blocks Yes - - - Yes Yes - Yes
from - to
8-12 - - - 7:30-11:30 rolling 2 Days
- 7:00 -17:30
Auction hours Yes Yes Yes Yes Yes - Yes Yes
multi-part
blocks blocks blocks blocks blocks - Yes Blocks
gate closure
12 10:12 12 11 11 - 10 11
Intraday trading
Hours Yes Yes Yes (1/4 h) Yes Yes (1/2 h) Yes Yes
Multi-part blocks blocks blocks blocks blocks Yes Yes
Trading model continuous continuous continuous continuous continuous auction continuous
Trading hours 24/7, DAM as of 3:00pm
24/7, DAM as of 2:00pm
7:30am-6:00pm, DAM as of 12:00pm
7:30am-11:00pm, DAM as of 11:30am
24/7, as of 2 days before delivery
6 sessions, Interval of 105 minutes
24/7, DAM as of 7:00 a.m two days before delivery until 11:00 a.m. of the trading day before delivery.
Before physical delivery 75 min n/a 60 min 120 min 60 min 60 min 135 min 5 min
Congestion management
within market area Redispatch Redispatch Splitting/ Redispatch
Redispatch Redispatch Redispatch Redispatch Redispatch
between market areas only explicit only explicit only explicit; No congestion between Austria and Germany
coupling: Belgium, the Netherlands, France
coupling: Belgium, the Netherlands, France
only explicit splitting with Portugal as of 2008, coupling with France
coupling: Belgium, the Netherlands, France
Source: EXAA, EEX and Belpex Internet sites and with modifications from Ockenfels et al. (2008)

Stochastic dependencies of spot prices in the European electricity markets
49
CHAPTER II DOMINANT PROPERTIES OF ELECTRICITY PRICES
Electricity as a commodity has to comply with a number of technical constraints. First, at any
moment injections into the power grid and withdrawal from the power grid must be balanced.
Second, for security reasons the voltage of electricity transmission must be kept within some pre-
defined range. For example the European TSO body, the European Network of Transmission System
Operators for Electricity (ENTSO-E), adheres to the 50 Hertz standard46 for the entire European grid.
In case of deviations from this standard, power system failure and at the end even blackouts may
occur. In other words, the electricity grid is a system of communicating and interdependent vessels
and a local imbalance, if not promptly addressed, may cause electricity frequency and voltage
variation within the whole, Europe-wide, electricity system.
Finally, electricity flows must not exceed the maximum grid transmission capacity. However, the
fulfilment of these standards is complicated by the following electricity-specific characteristics: non-
storability, implying that electricity supply and demand must be instantaneously balanced47 ;
inelasticity of demand in the short run (on hourly basis) and medium run (seasonal and weekly
effects); grid externalities. The latter characteristic of the power system is explained by the Kirchhoff
laws in physics. Basically, if an electricity system consists of three interconnected nodes A, B and C
with available transmission capacity between them and if the task is to supply electricity from node A
to C directly, this is possible, but inevitably a portion of electricity will follow the trajectory ABC,
which is an uncontrollable flow and can be viewed as a grid externality.
The above-mentioned facts play a major role in explaining the behaviour of electricity prices:
seasonality, mean-reversion, jumps and spikes.
Seasonality
46 According to Leonardo Energy, an initiative of the European Copper Institute, the EU standards of power
quality do not correspond to the current state of technology. (EurActiv, 13/03/2008). Updating the current EU
power or voltage quality standard EN50160 of the European Committee for Electrotechnical Standardisation
(CENELEC), is a sensitive issue, because it requires “costly upgrades at virtually all points of the electricity supply
chain. The standard is currently under review, but *…+ with no clear timeline available”. (EurActiv, 13/03/2008).
47 With the exception of hydropower and coal plant generation. According to the European Commission’s
Statistical pocketbook 2009, as of 2006 electricity in the EU 27 zone is mainly generated by nuclear plants
(30 %), coal (28 %) and gas (21%). Hydro generation plays a secondary role. However, in some countries, for
example in the Nord Pool region, as well as in Austria, where nuclear generation is forbidden by the
constitution law, (Hofbauer, 2006), hydro generation plays a vital role.

Stochastic dependencies of spot prices in the European electricity markets
50
Pilipovic (2007), Weron et al. (2004), Schwarz et al. (2001), Blöchlinger (2008) explain the significant
seasonality patterns that electricity exhibits with both weather and human factors. There is a “day-
of-the-week” effect. It can explain the double-peak Nord Pool daily pattern of electricity
consumption: one in the morning (7:00 a.m - 9:00 a.m), when people usually go to work and one in
the evening (5:00 p.m. - 8:00 p.m.), when people usually return from work (Weron et al., 2004).
Blöchlinger, (2008) has explored the seasonality effects of the EEX spot market and has found out a
different pattern from Nord Pool: there is only one peak at noon in summer during work days, while
in winter during work days there is one at noon and one around 7:00 p.m. The weekend pattern on
the EEX spot market differs considerably from the work days pattern (Blöchlinger, 2008). Usually
electricity consumption in Nord Pool is lower during the weekend, especially on Sunday (Weron et
al., 2004).
On basis of the findings of Blöchlinger (2008) and Weron et al. (2004) a conclusion can be made that
when explaining the weekly pattern on the electricity markets, apart from the weather influence,
must be considered also the human behaviour, which is culturally-dependent.
On a more general, annual scale, there is again an interplay between the weather and the human
factor. For example a cold winter usually provokes increased power consumption. If normal capacity
is exceeded and more expensive electricity generation sources (Figure 8) are put into operation,
electricity price is expected to rise, because the increased demand is inelastic. Applying the same
argument about the inelasticity of demand, the increased air conditioners use in a hot summer that
exceeds the normal capacity, may provoke a price increase.
In conclusion, apart from the culturally-dependent human factor and the weather influence,
seasonality of electricity prices is a consequence of the almost inelastic in the short run demand for
electricity, combined with the lack of storing technology, which prevents intertemporal demand
balancing. Kahn et al. (2001) emphasise that a critical factor for the California market failure, has
been the unresponsiveness (inelasticity) of demand. According to Kahn et al. (2001), the demand-
side price responsiveness should be promoted, as in the short run it provides more flexibility to
respond to price peaks, while the long run it increases electricity market efficiency.
In addition to the provided theoretical overview what factors mainly influence electricity seasonality,
in Table 4 is provided an illustrative example48, based on the annual maximum load in 2007 in the
majority of the European countries. An interesting finding is that the maximum load, as a rule,
48 This example is not intended to provide an extensive coverage of the seasonality effects for every selected
country, following the approach of Blöchlinger, (2008) and Weron et al., (2004). It targets the presentation of
major similarities and differences among the selected countries, illustrated with a degree of generalisation with
the indicator “Annual maximum load”.

Stochastic dependencies of spot prices in the European electricity markets
51
happens in December, which can be explained by the weather factor. In the majority of the selected
European countries the annual maximum peak happens not far before Christmas. In all European
countries, Greece excluded, is present the work day evening annual peak winter pattern (5:00 p.m.-
7:45 p.m.), which Weron et al. (2004) explain with the return of people from work. However, the
annual peak, occurring during working days should be interpreted with care. In Bulgaria and Serbia,
for example, it happens on Monday, but during The New Year’s Eve, on the 31 December 2007.
Therefore it has to be attributed not to work cycle, but to the human behaviour, provoking annual
peak in consumption during the holiday.
Table 4. National annual maximum load in selected European countries in 2007
Source: UCTE, 2007
Mean reversion
Commodity prices exhibit the quality mean-reversion. On average they neither grow, nor decline
over time and can be described as tending to return to their mean value, a non - typical property for
stock prices, which grow on average (Mavrou, 2006). Geman (2005) explains the mean reversion
pattern with the fairly inelastic aggregate demand: “if demand is constant or slightly increasing over
time *…+ and if supply adjusts to this pattern, prices should stay roughly the same on average”.
In addition, Knittel and Roberts (2001), Blöchlinger (2008) and Geman (2005) explain the mean-
reversion of commodity prices with the weather evolution (over/underproduction, good/bad
Country Date Day Time MW A ustria 17 December Monday 05:30 p.m. 9438 B elgium 17 December Monday 06:00 p.m. 14205 B ulgaria 31 December Monday 06:00 p.m. 6888 Switzerland 19 December Wednesday 06:15 p.m. 9953 Czech Republic 29 November Thursday 05:00 p.m. 10174 Germany 03 December Monday 06:00 p.m. 78500 Denmark 17 December Monday 06:00 p.m. 3767 Spain 17 December Monday 08:00 p.m. 44876 Franc e 17 December Monday 06:58 p.m. 88960 Greece 23 July Monday 01:00 p.m. 10414 Croatia 17 December Monday 06:00 p.m. 3098 Hungary 29 November Thursday 05:00 p.m. 6180 Italy 18 December Tuesday 05:00 p.m. 56822 L uxembourg 10 December Monday 06:00 p.m. 1061 The Netherlands 20 December Thursday 05:00 p.m. 15863 P oland 18 December Tuesday 05:00 p.m. 22729 P ortugal 18 December Tuesday 07:45 p.m. 9099 R omania 19 December Wednesday 05:00 p.m. 8681 Serbia 31 December Monday 06:00 p.m. 7305 Slovenia 19 December Wednesday 07:00 p.m. 2087 Slovakia 19 December Wednesday 06:00 p.m. 4418

Stochastic dependencies of spot prices in the European electricity markets
52
harvests), which is a cyclical process and influences equilibrium prices by means of the aggregate
demand.
Blöchlinger (2008) explains the weather influence in electricity markets over time as follows: “… in
the short run (temperature, sunshine duration) as well as in the medium run (amount of rain- or
snowfall). In the long run, possible shifts in demand can push prices up because the additional
demand can only be covered by running more expensive electricity production facilities. But higher
prices also influence the demand side by making consumers switch to alternative energy sources,
which has a balancing effect.“
Spikes
Spikes represent a considerable price change within a brief period of time. Three main factors can
explain this pattern. The first one is the fairly inelastic demand. The second one is the different
generation cost of the various electricity generation primary materials (Figure 8), as well as the
generation source-specific activation method and response speed. The third factor is that generation
has its capacity limits, to be accounted for.
Weron et al. (2004) explain the concrete spike pattern-generation mechanism: spikes are a result of
the introduction of more expensive power generation sources to fill demand for a particular period
of time. As a consequence the supply offer price rises and, given the weak elasticity of demand in the
short run, equilibrium prices also increase, creating a positive spike pattern. Analogously, a negative
spike appears when the expensive power generation sources are removed from electricity
production. Another reason for a supply-side change, provoking spikes, may be a plant outrage,
weather events, congestion or failure in the transmission grid. It should be also accounted for that
under the current state of technology electricity is unstorable. The lack of enough reserve capacities
with buffering effect in the event of these supply-shocks is responsible for the observed spikes on the
electricity market. A further explanation for the presence of spikes can be a planned maintenance of
a power plant and/or power grid or exercise of market power by market player (Weron et al., 2004).
Market power could be exercised by not offering the entire available production for a given period of
the day, thus creating an electricity supply deficit.
Some additional factors, encouraging spikes can be generalised from the French electricity regulator,
Commission de Regulation de l’Energie, investigation of the price peaks on 29 October (1,236
EUR/MWh), 12 November (2500 EUR/MWh) and 15 November (1762 EUR /MWh.) 2007, while for
the same 2007 time period the average delivery price has been in the 36-118 EUR/MWh interval
(Commission de Regulation de l’Energie, 2008). Some of the peak-encouraging factors, encountered
by the French regulator can be summarised as: working practices of some traders reduce their
responsiveness, especially during the weekend; the forecast production data does not enable a
Stochastic dependencies of spot prices in the European electricity markets
53
proper planning of unscheduled availability risks; insufficiently precise power exchange procedures,
inefficient interconnection management.
Jumps
Huisman and Mahieu, (2003) make a distinction between spikes and jumps of electricity prices.
Spikes are temporary price level shifts: a sudden upward price movement, followed shortly by a
downward movement (or vice versa), that do not lead to sustainable higher price levels. This pattern
may be provoked for example by a sudden electricity system failure. In contrast, jumps are a
sustainable price increase over time.
High volatility49
Compared to other markets with volatility up to 0,03 % for interest rates, 1-1,5% for stock indices, up
to 4 % for individual stocks, up to 0,5% for bonds, 2-3% for crude oil and 3-5 % for natural gas (Weron
et al., 2004), electricity markets exhibit considerably higher volatility.
As factors for the higher volatility on electricity markets can be indicated the physical storage and
transmission capacity limitations. However, even in case of grid congestion, lack of available
transmission capacity or unexpectedly increased consumption, the supply and demand must be
balanced. In these situations, as electricity is a necessity good with almost inelastic demand in the
short run, the market cannot be suspended. As a consequence, the available electricity is re-sold and
re-bought at higher prices or, if possible, new power plants with higher production marginal costs are
put into operation in addition to the cheaper base load plants, which creates electricity prices’ spikes
and increased volatility.
Volatility is further aggravated by the specific fact that supply must comply with production
constraints, meaning that not every generator is able to supply at peak hours. In this situation, in
addition to the very steep or vertical aggregate demand, the aggregate supply curve becomes very
steep because only a few suppliers (oligopoly) or even only one (monopoly) can supply the requested
electricity quantity by consumers.
Spot electricity prices volatility is influenced by the DAM design. On a daily basis the market
participants have to make price forecasts. In case that their expectations turn to be wrong, spot price
volatility increases. Forward electricity prices are less volatile, as they are not determined on the
basis of a daily auction.
In conclusion, high volatility on electricity markets is mainly due to production and transmission
limitations, forecast errors, supply and demand shocks and the electricity market design.
49 As a rule “volatility” means the standard deviation of the daily returns.

Stochastic dependencies of spot prices in the European electricity markets
54
CHAPTER 3 COPULAS AS A FUNCTION OF DEPENDENCE OF RANDOM VARIABLES
3.1. Motivation to use copulas for exploring the dependency of spot electricity prices
Copulas are referred to as “dependence functions” by Galambos (1978) and Deheuvels (1978). They
are a flexible tool for modelling in finance, in cases when the multivariate assumption for normality is
not valid and when non-linear dependence between random variables must be captured.
Some of the advantages of using copulas as a dependence function can be summarised as follows:
Copulas capture the dependence structure of the multivariate distribution of random variables.
Therefore the majority of the study of the dependence structure of multivariate distribution
functions can be reduced to the study of copulas.
The decision which marginal distribution to apply is separated from the decision which copula
structure to implement.
Copulas provide a possibility to update and adapt the traditional financial models, which start
with an assumption of joint normal distribution, to more general situations, including the case
when the assumption for normal distribution refers only to the marginal distributions of the
random variables.
Copulas are an adequate tool to model the dependence of extreme events in insurance and
finance.
Copulas are invariant under strictly increasing transformations (linear and non-linear) of the
marginals.
Uritskaya and Serletis (2008) have demonstrated that electricity prices have a complex, multiscale-
correlated behavior. Alvárez-Ramírez et al. (2009) have shown that electricity prices exhibit
correlation with complex, time-dependent non-linear pattern. Given the non-linear dependence
between spot electricity prices, the property of copulas to remain invariant under strictly increasing
transformations of the marginals motivates the use of copulas in the present study.
Chapter 3 and Chapter 4 provide a brief theoretical overview of copulas and copula-based measures
of association, and have the aim to introduce mainly concepts, which are implemented in Chapter 5
for the analysis of the dependencies of five European spot electricity datasets.
3.2. Sklar’s Theorem and its interpretation
A starting point of the presentation of the application of copulas in finance is the interpretation of
the relationship between copulas and distribution functions of random variables, summarized in
Sklar’s Theorem.

Stochastic dependencies of spot prices in the European electricity markets
55
Theorem 3.1. (Sklar, 1959): If with M is denoted a n-dimensional joint distribution with marginals F1,
,…, Fn, then there exists a n-dimensional copula C, which is a mapping of the unit hypercube into the
unit one-dimensional interval: [0,1]n →*0,1+, such that for x1, …, xn in R ∈ [−∞,∞],
𝐌(x1, …, xn) = 𝑪(F1(x1),… ,𝐹n(xn)), (3.1)
C is unique for continuous marginals, otherwise C is uniquely determined on Ran F1 x Ran F2 x … x Ran
Fn.
Conversely, if C is n-dimensional copula and F1,,…, Fn are univariate distribution functions, then the
previously determined function M is a n-dimensional joint distribution with marginals F1, ,…, Fn.
(A proof is provided in Nelsen, 2006).
Definition 3.1: If F is a function with univariate distribution 𝑢, then the generalised inverse of F is
defined as:
F-1(𝒖) inf {x Є R: F(x) ≥ u} for ∀ u Є *0,1+
Corollary 3.1.
If with M is denoted a n-dimensional joint distribution with marginals F1, …, Fn and copula C, then for
any u Є *0,1]
𝑪(u1, …, un) = 𝐌(𝐹1−1(u1),… ,𝐹𝑛
−1(un)) (3.2)
Equations (3.1) and (3.2) are a starting point for a copula analysis. The first equation provides an
answer to the question how to build a joint distribution M by coupling marginal distributions with
copula C. The flexibility of the proposed by Sklar approach is due to the fact that the decision what
marginals to use is completely separated from the copula choice. For example, in the two
dimensional case one may decide to use a Gaussian copula with one marginal, belonging to the
Student t distribution, and the other - to Poisson distribution. The second equation shows how
copulas are extracted from multivariate distribution functions with continuous marginals.
Definition 3.2 (Embrechts et al., 2001): If standard uniform marginal distributions ui are chosen, the
n-dimensional multivariate distribution function (a copula) is denoted with C(u) = C(u1, …, un) ensures
the mapping of Sklar’s theorem [0,1]n → *0,1+, the following three properties hold:
(1) C(u1, …, un) is increasing in each component of ui , which is a general requirement for any
multivariate distribution.

Stochastic dependencies of spot prices in the European electricity markets
56
(2) C(1, …, 1, ui , 1, …, 1) = ui for i ∈ {1,… , n}, ui ∈ 0,1 , which is a requirement for uniform
marginal distributions.
(3) For (a1, …, an), (b1,…,bn) ∈ 0,1 n with ai ≤ bi, must be valid
…2i1=1
−1 i1+⋯+in2in=1
C (u1i1 ,…, u1in ) ≥ 0,
which ensures, that if a random vector (U1, …Un) has a distribution function C, then P (a1 ≤ U1 ≤ b1, …,
an ≤Un ≤bn) ≥ 0.
If a function C fulfils conditions (1), (2) and (3), then it obligatory is a copula.
3.3. Invariance of copulas
An important quality of copulas is their invariance, as commented by Schweizer and Wolff (1981):
“... under almost surely increasing transformations of (the random variables), the copula is invariant
while the margins may be changed at will, it follows that it is precisely the copula which captures
those properties of the joint distribution which are invariant under almost surely strictly increasing
transformations. Hence the study of rank statistics—insofar as it is the study of properties invariant
under such transformations—may be characterized as the study of copulas and copula-invariant
properties.”
Mathematically, the invariance of copulas under strictly increasing transformations of the marginals50
can be formulated as follows:
Proposition 3.1. Let 𝑋1,… ,𝑋𝑛 be a random vector with continuous margins with copula C and if 𝛿1,
…, 𝛿𝑛 are strictly increasing function, then (𝛿1 𝑋1 ,… , 𝛿𝑛 𝑋𝑛 ) also has copula C.
Proof:
With 𝐹𝑖 is denoted the distribution function of 𝑋𝑖 , 𝑖 = 1,… ,𝑛 and with 𝛿𝑖−1 is denoted the inverse of
𝛿𝑖 .
First will be shown that the transformed variable 𝛿𝑖 𝑋𝑖 has a continuous distribution function
𝐹𝑖 (𝑦) = 𝐹𝑖° 𝛿𝑖−1(𝑦).
𝐹𝑖 𝑦 = 𝑃 𝑋𝑖 ≤ 𝛿𝑖−1 𝑦 = 𝑃 𝛿𝑖
−1°𝛿𝑖 𝑋𝑖 ≤ 𝛿𝑖−1 𝑦
(Here is used that if 𝛿𝑖 is strictly increasing then: 𝛿𝑖−1°𝛿𝑖 𝑥 = 𝑥).
50
As indicated in the citation, Schweizer and Wolff (1981) define the invariance of copulas in terms of “almost
surely increasing transformations of (the random variables)”. Throughout this study is used the term of
Embrechts et al. (2001, p. 188) for the same property of copulas defined as: “strictly increasing transformations
of the marginals” Under “marginals” is meant “marginal distributions”.

Stochastic dependencies of spot prices in the European electricity markets
57
Then:
𝐹𝑖 𝑦 =𝑃(𝛿𝑖 𝑋𝑖 ≤ 𝑦) + 𝑃 𝑋𝑖 = 𝛿𝑖−1 𝑦 / 𝛿𝑖 𝑋𝑖 > 𝑦 = 𝑃 𝛿𝑖 𝑋𝑖 ≤ 𝑦 , (*)
(Initially (*) consists of two addends, because 𝛿𝑖−1 is not defined as strictly increasing. Next,
𝑃 𝑋𝑖 = 𝛿𝑖−1 𝑦 / 𝛿𝑖 𝑋𝑖 > 𝑦 =0, because 𝐹𝑖 is continuous.)
Then:
𝑪(𝑢1,… ,𝑢𝑛 ) = 𝑃 [𝐹1(𝑋1) ≤ 𝑢1 ,… ,𝐹𝑛 (𝑋𝑛) ≤ 𝑢𝑛 ]=
= 𝑃 [ F1 (δ1 X1 )≤u1, …, Fn
(δn Xn )≤un ]
(Here is used that 𝐹𝑖 °𝛿𝑖(𝑥) = 𝐹𝑖° 𝛿𝑖−1°𝛿𝑖(𝑥)= 𝐹𝑖(𝑥), because 𝛿𝑖 is strictly increasing)
It follows that C is also a copula of (𝛿1 𝑋1 ,… , 𝛿𝑛 𝑋𝑛 ).
□
This result has an important theoretical and practical meaning, as it ensures that any property of the
joint distribution function, which remains invariant under strictly increasing transformations of the
marginals, remains a property of the copula, independently of the choice of the marginal distribution
functions.
The copula-based measures of concordance, reviewed in Chapter 4, are motivated by the result of
proposition 3.1. Like copulas, they remain invariant under strictly increasing transformations of the
marginals.
3.4. Fréchet-Hoeffding bounds. Fundamental copulas. Concordance ordering.
Any copula evolves between a lower and upper bound, referred to as “Fréchet - Hoeffding bounds”.
Theorem 3.2. Fréchet-Hoeffding bounds: For every copula 𝐶(u1,…, un) exist the bounds:
𝐶 – = 𝑚𝑎𝑥 { 𝑢𝑖 + 1 − 𝑛, 0𝑛𝑖=1 } ≤ 𝐶(𝒖) ≤ 𝑚𝑖𝑛{𝑢1,… .𝑢𝑛 } = 𝐶 +
(Proof provided in Embrechts et al., 2001).
The upper Fréchet-Hoeffding bound C+ is the comonotonicity copula, which belongs to the group of
fundamental copulas. The comonotonicity copula represents perfect dependence between two
variables u1 and u2:
Definition 3.3: The random variables X1,…, Xn are defined as comonotonic if they admit as copula the
upper Fréchet-Hoeffding bound C+ = 𝑚𝑖𝑛{𝑢1,… .𝑢𝑛}.

Stochastic dependencies of spot prices in the European electricity markets
58
The lower Fréchet-Hoeffding bound C– is the countermonotonicity copula, which is also a
fundamental copula. It represents the perfect negative dependence between two variables u1 and u2.
It is not a copula for a higher dimension than two (Embrechts et al., 2001).
The existence of upper and lower Fréchet-Hoeffding bounds gives the possibility to establish order
among copulas. This order is referred to as “concordance ordering”. In this relation Nelsen (2006)
provides the following definition:
Definition 3.4. If 𝐶1and 𝐶2 are copulas, then we say that 𝐶1 is smaller than 𝐶2 , (or 𝐶2 is bigger than
𝐶1) and we denote it as:
𝐶1 ≺ 𝐶2 (or 𝐶2≻𝐶1)
if
𝐶1(𝑢, 𝑣) ≤ 𝐶2(𝑢, 𝑣) (or 𝐶2(𝑢, 𝑣) ≥ 𝐶1(𝑢, 𝑣)) ∀ (u,v) Є [0,1]2
A parametric family of copulas {𝐶𝜃 , θ Є Θ} is said to be positively ordered with respect to its
dependence parameter θ51, if:
θ1 ≤ θ2→ 𝐶θ1≺ 𝐶θ2
∀ θ1, θ2 Є Θ
Alternatively, a parametric family of copulas {𝐶𝜃 , θ Є Θ} is said to be negatively ordered with respect
to its parameter θ, if:
θ1 ≤ θ2→ 𝐶θ1 ≻ 𝐶θ2
∀ θ1, θ2 Є Θ.
In terms of Fréchet - Hoeffding bounds, Bouyé et al (2000) formulates the concordance ordering,
valid for any copula C as follows:
𝐶 – ≺ 𝐶 ≺ 𝐶+
Random variables with continuous distributions are independent iff their dependence structure is
given by the third fundamental copula – the independence one, defined as follows:
∏ 𝑢1 ,… ,𝑢𝑛 = ∏ 𝑢𝑖𝑛𝑖=1 ,
then equation 3.1. of Sklar’s theorem assumes the form:
𝐶⊥ = 𝐶(𝐹1(𝑥1),… ,𝐹𝑛(𝑥𝑛)) = 𝐹1(𝑥1) … 𝐹𝑛(𝑥𝑛 )
The perspective plots and the contour plots of the distribution functions of the three fundamental
copulas are illustrated on Figure 16. They have an important application in practice for interpretation
of the dependence structure of any copula, and are implemented in Chapter 5. Following (Devroye,
1986) if a copula family encompasses the countermonotonicity 𝐶 –, the independence 𝐶 ⊥and the
comonotonicity 𝐶 + copula, it is referred to throughout this study as “comprehensive”.
51
In section 3.7 of the present chapter is explained that, for the elliptical copulas in Table 5, θ is the linear correlation coefficient 𝜌𝑥𝑦 , while for the Archimedean copulas in Table 5, θ is the dependence parameter α,
determined on basis of Kendall’s tau (table with exact formulas available in Embrechts et al. (2001), p.222).
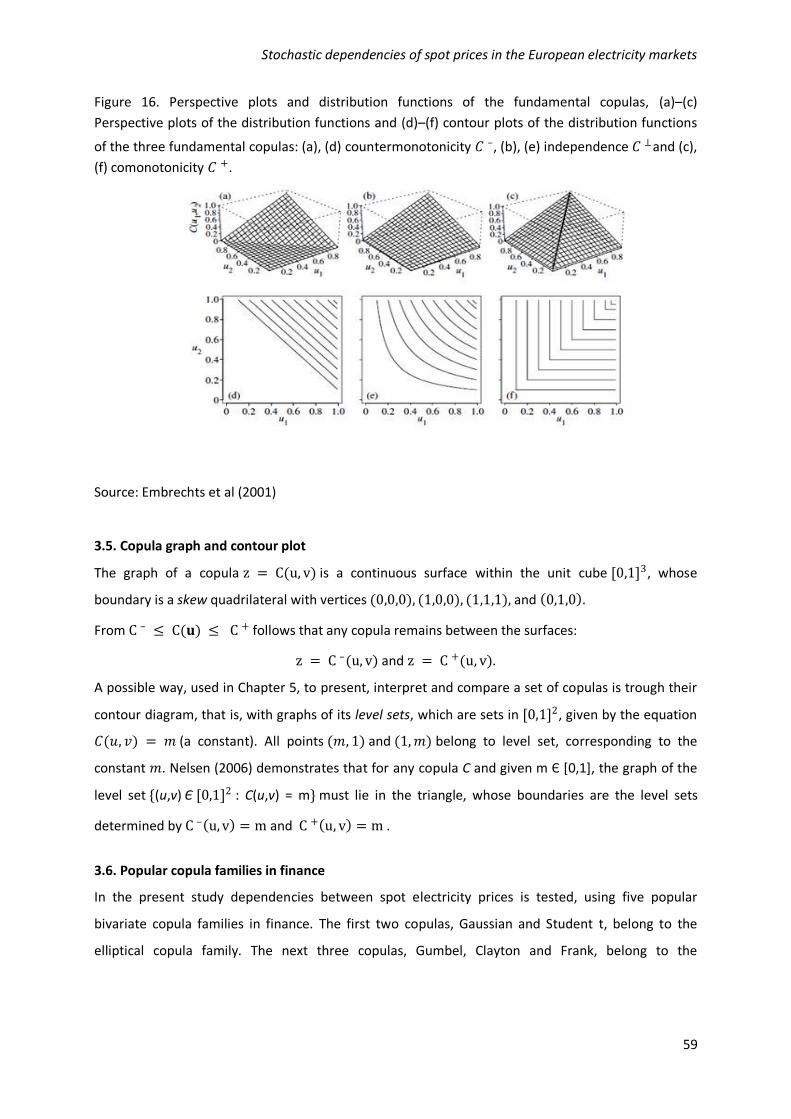
Stochastic dependencies of spot prices in the European electricity markets
59
Figure 16. Perspective plots and distribution functions of the fundamental copulas, (a)–(c)
Perspective plots of the distribution functions and (d)–(f) contour plots of the distribution functions
of the three fundamental copulas: (a), (d) countermonotonicity 𝐶 –, (b), (e) independence 𝐶 ⊥and (c),
(f) comonotonicity 𝐶 +.
Source: Embrechts et al (2001)
3.5. Copula graph and contour plot
The graph of a copula z = C(u, v) is a continuous surface within the unit cube [0,1]3, whose
boundary is a skew quadrilateral with vertices (0,0,0), (1,0,0), (1,1,1), and 0,1,0 .
From C – ≤ C(𝐮) ≤ C + follows that any copula remains between the surfaces:
z = C –(u, v) and z = C +(u, v).
A possible way, used in Chapter 5, to present, interpret and compare a set of copulas is trough their
contour diagram, that is, with graphs of its level sets, which are sets in [0,1]2, given by the equation
𝐶(𝑢, 𝑣) = 𝑚 (a constant). All points (𝑚, 1) and (1,𝑚) belong to level set, corresponding to the
constant 𝑚. Nelsen (2006) demonstrates that for any copula C and given m Є *0,1+, the graph of the
level set {(u,v) Є [0,1]2 : C(u,v) = m} must lie in the triangle, whose boundaries are the level sets
determined by C – u, v = m and C + u, v = m .
3.6. Popular copula families in finance
In the present study dependencies between spot electricity prices is tested, using five popular
bivariate copula families in finance. The first two copulas, Gaussian and Student t, belong to the
elliptical copula family. The next three copulas, Gumbel, Clayton and Frank, belong to the

Stochastic dependencies of spot prices in the European electricity markets
60
Archimedean copulas family. Therefore, in this section is provided an overview52 of these selected
copulas starting with Table 5, where are presented their general functions, as well as the admissible
range for their correspondent dependence parameter.
Table 5: Five parametric families of bivariate copulas
Copula type Copula function C(u,v) Dependence parameter range
Elliptical copulas
Gaussian 𝐶𝜌𝑥𝑦𝐺𝐴 (u,v)=
𝜌𝑥𝑦{ -1(u), -1(v)}
with correlation matrix Ρ,
linear correlation coefficient rho ρxy
and cumulative distribution function
𝜌𝑥𝑦 Є [−1,1]
𝐶𝜌𝑥𝑦𝐺𝐴 (u,v) = 𝑢𝑣 = 𝐶 ⊥ for 𝑃 = 𝐼d= 1 0
0 1
𝐶𝜌𝑥𝑦𝐺𝐴 (u,v)=C+ for 𝑃 = 𝐽d=
1 11 1
𝐶𝜌𝑥𝑦𝐺𝐴 (u,v) = C
– for 𝑃 = 𝐽d=
−1 −1−1 −1
and d=2
Student t 𝐶𝜌𝑥𝑦 ,ϒ 𝑡 (𝑢,𝑣) = 𝑇𝜌𝑥𝑦 ,ϒ{Tϒ
-1(u), Tϒ-1(v)}
with cumulative distribution function 𝑇,
ϒ degrees of freedom,
correlation matrix Ρ,
and linear correlation coefficient rho ρxy .
𝜌𝑥𝑦 Є *-1,1]
𝐶𝜌𝑥𝑦 ,ϒ 𝑡 𝑢,𝑣 ≠ 𝑢𝑣 = 𝐶 ⊥ for P=Id=
1 00 1
and ϒ< ∞
𝐶𝜌𝑥𝑦 ,ϒ 𝑡 (u,v)=C+ for P=Jd=
1 11 1
and ϒ< ∞
𝐶𝜌𝑥𝑦 ,ϒ 𝑡 (𝑢,𝑣) = C – for 𝑃 = 𝐽d= −1 −1
−1 −1 , d=2 and
ϒ< ∞
Archimedean copulas
Gumbel
(1960)
𝐶(𝑢,𝑣) = exp,−[(−ln u)α + (−ln v)α]1/α}
α Є *1, +∞+
𝐶(𝑢,𝑣) = C + for α→+∞
𝐶(𝑢,𝑣) = 𝑢𝑣 = 𝐶 ⊥ for α=1
Clayton
(1978)
𝐶(𝑢,𝑣) = max[(u−α + v−α − 1)−1/α, 0]
α Є *-1, 0) (0, +∞+
𝐶(𝑢,𝑣) = C + for α→+∞
𝐶(𝑢,𝑣) = 𝑢𝑣 = 𝐶 ⊥ for α=0
𝐶(𝑢,𝑣) = C - for α=-1
Frank
(1979)
𝐶(𝑢,𝑣) = - 1
𝛼ln(1+
(𝑒𝑥𝑝 −𝛼𝑢 −1)(𝑒𝑥𝑝 −𝛼𝑣 −1)
𝑒𝑥𝑝 −𝛼 −1)
α Є [-∞, 0) (0, +∞+
𝐶(𝑢,𝑣) = C +
for α→+∞
𝐶(𝑢,𝑣) = 𝑢𝑣 = 𝐶 ⊥ for α=0
𝐶(𝑢,𝑣) = C -for α→-∞
Source: Vecchiato et al. (2004), Embrechts et al. (2001)
52 The overview is introduced only to highlight the copula estimation procedures in Chapter 5 and does not
have the aim to provide a detailed statistical analysis.

Stochastic dependencies of spot prices in the European electricity markets
61
Elliptical copulas
Gaussian copula
Proposition 3.2.
By application of Sklar’s Theorem, the Gaussian copula generates the joint standard normal
distribution function if and only if the used marginals are standard normal.
(Proof provided in Vecchiato, 2004).
A model in which a joint distribution is built, using the Gaussian copula, but with arbitrary marginals,
is known as meta-Gaussian distribution. This concept is valid also for the other copula types and
provides flexibility for modeling in finance.
From Table 5 can be made the conclusion that the Gaussian copula is comprehensive, because as a
dependence structure it encompasses the countermonotonicity 𝐶 –, the independence 𝐶 ⊥and the
comonotonicity 𝐶 + copulas. The strength of the dependence structure of the Gaussian copula is
given by its linear correlation coefficient ρxy. The Gaussian copula is positively ordered with respect to
the concordance ordering, determined by 𝜌𝑥𝑦 :
Cρxy =−1GA ≺Cρxy <0
GA ≺Cρxy =0GA ≺Cρxy >0
GA ≺Cρxy =1GA
Student t copula
Analogously, if Student t marginal distributions are combined with Student t copula, the joint
distribution function is Student t. The strength of the dependence structure of the Student t copula is
also given by its linear correlation coefficient ρxy. When the number of degrees of freedom ϒ
diverges, the Student t copula converges to the Gaussian one. For a limited degrees of freedom ϒ,
the behaviour of the Student t copula is quite different from the Gaussian case. In order to capture
this fact, on Figure 17 the Student t copula is illustrated with ϒ=4 and equal 𝜌𝑥𝑦 to the Gaussian
copula, so that a comparison between the two copulas can be made.
The Student t copula allows for joint fat tails and therefore captures better than the Gaussian copula
the probability of joint extreme events. This is visible on Figure 17 (d) where there is a concentration
of the level lines of the probability density function of the Student t copula in the upper-right [1,1]
and lower-left [0,0] region. In contrast, the illustrated on Figure 17 (c) probability density function of
the Gaussian copula with the same 𝜌𝑥𝑦 as the Student t copula, although quite similar to the Student
t copula in the center of the contour plot, has different behavior in the region [1,1] and [0,0]: it does
not capture well extreme events.

Stochastic dependencies of spot prices in the European electricity markets
62
Another major difference between the Gaussian and Student t copula is that the latter is not reduced
to the independence copula for Ρ=Id (Table 5). Therefore the Student t copula is not comprehensive.
For given degrees of freedom ϒ the Student t copula is positively ordered with respect to its
parameter 𝜌𝑥𝑦 .
Figure 17: Elliptical copulas. Three thousand simulated points, ρxy = 0.77665, of: (a) Gaussian, (b)
Student-t4 copulas. Contour plots, 𝜌𝑥𝑦 = 0.77665, of the probability density function of: (c) Gaussian,
(d) Student-t4 copulas. Perspective plot, 𝜌𝑥𝑦 = 0.77665, of the probability density function of: (e)
Gaussian, (f) Student-t4 copulas.
(a)
(b)
(c)
(d)
(e)
(f)

Stochastic dependencies of spot prices in the European electricity markets
63
Archimedean copulas
In contrast to the copulas, derived from multivariate distributions, there is a number of copulas,
which are directly stated in explicit form. Such class of copulas is the Archimedean family. In this
section is given a brief overview of the three most popular of them in the bivariate case. Further
examples are available in Nelsen (2006).
The difference between the three Archimedean copulas (Clayton, Gumbel and Frank) is illustrated on
Figure 18. It is noticeable that these copulas have different behavior at the lower-left and the upper
right corner, which refer to the points (0,0) and (1,1) respectively, of the contour plots and
perspective plots of their density functions.
The Gumbel copula shows a pronounced uprising peak at the upper-right corner of the perspective
plot of its probability density function (Figure 18, g). On the Gumbel copula probability density
function contour diagram (Figure 18, d), the higher-valued level sets belong to the upper-right
corner. The Gumbel copula models the tendency one random variable X1 to grow to extreme (tail)
values when another random variable, X2, grows to extreme (tail) values, and vice versa (Figure 18,
a).
The Clayton copula is suitable for situations, in which both outcomes tend to experience low values
together. The Frank and Clayton copulas are comprehensive, while the Gumbel copula can only
represent positive dependence and independence (Table 5). The Frank copula is symmetric, like the
elliptical copula family, while Clayton and Gumbel copulas exhibit asymmetric dependence, which is
related to the concept “Tail dependence”, reviewed in section 3.7.
Figure 18: Archimedean copulas. Three thousand simulated points, Kendall’s τ =0.5651, of: (a)
Gumbel, α = 2.2995, (b) Clayton, α = 2.5990, (c) Frank, α = 7.0657 copulas. Contour plots, Kendall’s τ
=0.5651, of: (d) Gumbel, α = 2.2995, (e) Clayton, α = 2.5990, (f) Frank, α = 7.0657 copulas.
Perspective plot of the probability density function, Kendall’s τ =0.5651, of: (g) Gumbel, α = 2.2995,
(h) Clayton, α = 2.5990, (i) Frank, α = 7.0657 copulas.
(a)
(b)
(c)

Stochastic dependencies of spot prices in the European electricity markets
64
(d)
(e)
(f)
(g)
(h)
(i)
3.7. Tail dependence as a dependence notion
Copulas as dependence function are closely related to the concept of tail dependence, which
measures the degree of dependence between risk variables, arising from extreme (tail) observations.
Geometrically, tail dependence can be described as concentration on the lower and upper quadrant
tail of the joint distribution function of two random variables.
The strength of the dependence in the tails of a bivariate distribution is measured by the coefficient
of tail dependence, which depends only on the copula of a pair of two random variables X1 and X2
with continuous marginal distribution functions.
Embrechts et. al (2001) provide the following formal definition of tail dependence and its copula-
based equivalent:

Stochastic dependencies of spot prices in the European electricity markets
65
Definition 3.5. (Upper and lower tail dependence) If X1 an X2 are random variables with marginal
distributions F1 and F2 respectively, the upper tail dependence coefficient λ𝑢 and the lower tail
dependence coefficient λ𝑙 are defined in terms of the probability operator 𝑃 and the generalised
inverse of F from Definition 3.1. as follows:
λ𝑢 = lim𝑢→1 𝑃[𝑋2 > 𝐹2−1 (𝒖)/ X1 > 𝐹1
−1 (𝒖)], provided that a limit λ𝑢𝜖 [0,1] exists.
λ𝑙 = lim𝑢→0 𝑃[𝑋2 ≤ 𝐹2−1 (𝒖)/ X1 ≤ 𝐹1
−1 (𝒖)] , provided that a limit λ𝑙𝜖 [0,1] exists.
If λ𝑢 (respectively λ𝑙) 𝜖 (0,1], then the two random variables X1 an X2 are defined as asymptotically
dependent in the upper (respectively lower tail). Alternatively, if λ𝑢 (respectively λ𝑙) = 0, the two
random variables X1 an X2 are defined as asymptotically independent in the upper (respectively lower
tail).
In copula terms, if with C(u,u) is defined a copula for u 𝜖 [0,1], Definition 3.5. can be written
equivalently as:
λ𝑢 = lim𝑢→1
1 − 2𝑢 + 𝐶(𝑢,𝑢)
1 − 𝑢
λ𝑙 = lim𝑢→0
𝐶(𝑢,𝑢)
𝑢
A useful result, implemented in the analysis of the dependencies of the spot prices in Chapter 5, is
the stated by Vecchiato et al. (2004): λ𝑙 = 0 for the independence copula 𝐶 ⊥ and λ𝑙 = 1 for the
comonotonicity copula 𝐶 +.
Embrechts et al. (2001) prove that the bivariate Gaussian copula is asymptotically independent in
both tails, provided that 𝜌𝑥𝑦 < 1, while the bivariate Student t copula is asymptotically dependent
for 𝜌𝑥𝑦 > −1 in both the upper and lower tails; for the Archimedean copulas it follows:
The Frank copula is asymptotically independent in both the upper and lower tail;
The Gumbel copula exhibits asymptotically upper tail dependence;
The Clayton copula is asymptotically independent in both tails, provided that α≤0, and
exhibits asymptotically lower tail dependence λ𝑙 = 2−1 α for 𝛼>0, which result has been used
in the analysis of the dependence of the spot electricity prices in Chapter 5.

Stochastic dependencies of spot prices in the European electricity markets
66
CHAPTER 4
THE LIMITATIONS OF LINEAR CORRELATION. COPULA-BASED MEASURES OF CONCORDANCE AND
DEPENDENCE.
As an introductory step is clarified the meaning of the concept “independence” via a theorem. First,
by means of random variables and second - in copula terms.
Theorem 4.1. The random variables 𝑋1, …, 𝑋𝑛 with a joint distribution function 𝐹 𝑋1,… ,𝑋𝑛 and
marginal distribution functions 𝐹1 𝑋1 ,… ,𝐹𝑛( 𝑋𝑛) are independent iff:
𝐹(𝑋1,… ,𝑋𝑛) = 𝐹1( 𝑋1)…𝐹𝑛( 𝑋𝑛).
Applying Sklar’s theorem leads to the following result:
Corollary from Theorem 3.1. The random variables 𝑥1,… , 𝑥𝑛 are independent iff they have the
product copula C.
𝑪(𝐹1(𝑥1),… ,𝐹𝑛(𝑥𝑛)) = 𝐹(𝑥1) … 𝐹𝑛(𝑥𝑛)
This result has an important meaning and is implemented into practice for constructing of measures
of dependence, assessing the distance between a copula, which has been constructed, and the
product copula. This procedure is used for example in the goodness-of-a-fit test of Genest et al.
(2008 b, 2009), which I implement in Chapter 5.
Given the importance of constructing an adequate measure of dependence, it should be explored
what desirable properties it must have. Nelsen (2006, Definition 5.3.1.) provides an answer to this
question.
Definition 4.1. (Nelsen, 2006). In the two dimensional case a numerical measure of association53
δ(𝑋1,𝑋2) = δ𝐶 between two continuous random variables 𝑋1 and 𝑋2, whose copula is C, is a measure
of dependence if it satisfies the following conditions:
[1.] δ is defined for every pair of continuous random variables 𝑋1 and 𝑋2;
[2.] δ(𝑋1,𝑋2) = δ(𝑋2,𝑋1);
[3.] δ𝐶⊥ = 0 ≤δ(𝑋1,𝑋2) ≤1= δ𝐶+
53 Two random variates X and Y are said to be associated when they are not independent according to theorem
4.1. Measures of dependence and measures of concordance are two classes within the measures of association
group.
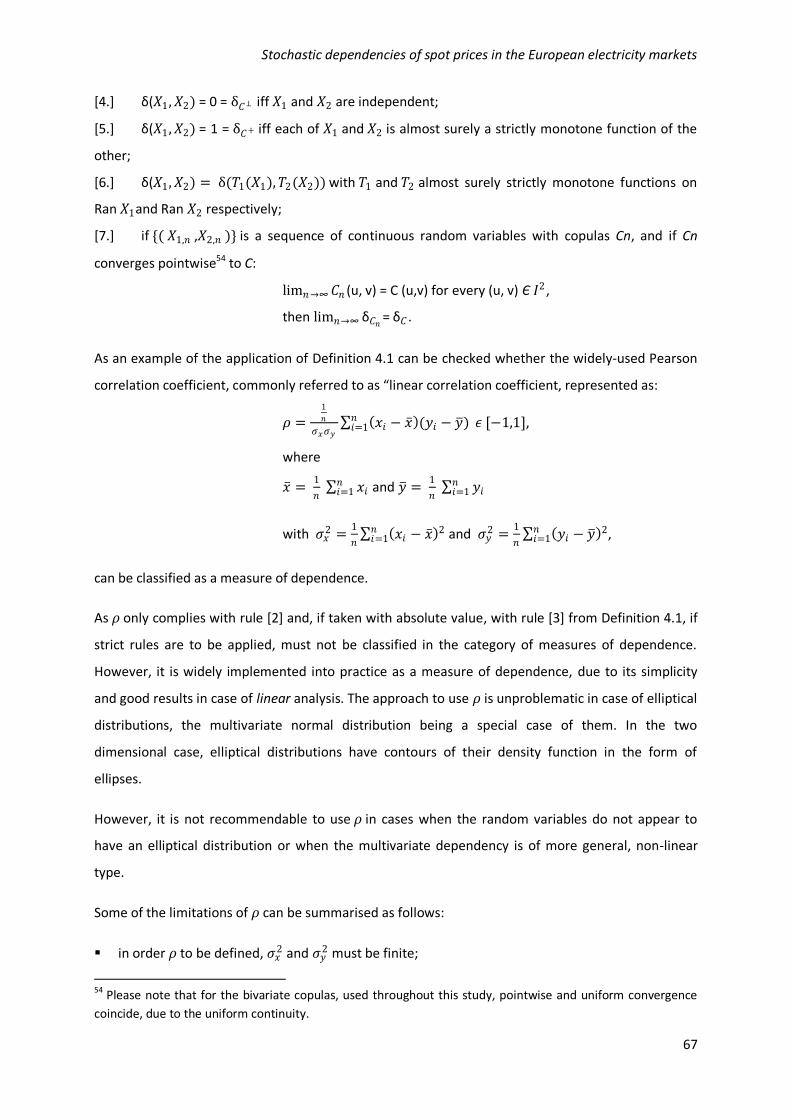
Stochastic dependencies of spot prices in the European electricity markets
67
[4.] δ(𝑋1,𝑋2) = 0 = δ𝐶⊥ iff 𝑋1 and 𝑋2 are independent;
[5.] δ(𝑋1,𝑋2) = 1 = δ𝐶+ iff each of 𝑋1 and 𝑋2 is almost surely a strictly monotone function of the
other;
[6.] δ(𝑋1,𝑋2) = δ(𝑇1(𝑋1),𝑇2(𝑋2)) with 𝑇1 and 𝑇2 almost surely strictly monotone functions on
Ran 𝑋1and Ran 𝑋2 respectively;
[7.] if {( 𝑋1,𝑛 ,𝑋2,𝑛 )} is a sequence of continuous random variables with copulas Cn, and if Cn
converges pointwise54 to C:
lim𝑛→∞ 𝐶𝑛 (u, v) = C (u,v) for every (u, v) Є 𝐼2 ,
then lim𝑛→∞ δ𝐶𝑛 = δ𝐶 .
As an example of the application of Definition 4.1 can be checked whether the widely-used Pearson
correlation coefficient, commonly referred to as “linear correlation coefficient, represented as:
𝜌 =1
𝑛
𝜎𝑥𝜎𝑦 𝑥𝑖 − 𝑥 (𝑦𝑖 − 𝑦 )𝑛
𝑖=1 𝜖 [−1,1],
where
𝑥 = 1
𝑛 𝑥𝑖
𝑛𝑖=1 and 𝑦 =
1
𝑛 𝑦𝑖
𝑛𝑖=1
with 𝜎𝑥2 =
1
𝑛 𝑥𝑖 − 𝑥 2𝑛
𝑖=1 and 𝜎𝑦2 =
1
𝑛 𝑦𝑖 − 𝑦 2𝑛
𝑖=1 ,
can be classified as a measure of dependence.
As 𝜌 only complies with rule [2] and, if taken with absolute value, with rule [3] from Definition 4.1, if
strict rules are to be applied, must not be classified in the category of measures of dependence.
However, it is widely implemented into practice as a measure of dependence, due to its simplicity
and good results in case of linear analysis. The approach to use 𝜌 is unproblematic in case of elliptical
distributions, the multivariate normal distribution being a special case of them. In the two
dimensional case, elliptical distributions have contours of their density function in the form of
ellipses.
However, it is not recommendable to use 𝜌 in cases when the random variables do not appear to
have an elliptical distribution or when the multivariate dependency is of more general, non-linear
type.
Some of the limitations of 𝜌 can be summarised as follows:
in order 𝜌 to be defined, 𝜎𝑥2 and 𝜎𝑦
2 must be finite;
54 Please note that for the bivariate copulas, used throughout this study, pointwise and uniform convergence
coincide, due to the uniform continuity.
Stochastic dependencies of spot prices in the European electricity markets
68
weak correlation does not necessarily imply weak dependence, therefore if this fact is ignored,
may be made wrong conclusions;
in case of independence 𝜌 is equal to zero, but the opposite is true only in the case of normal
distribution;
it is a scalar measure of dependence, therefore it cannot represent the whole existing
dependence structure between two random variables;
𝜌 depends on both the marginal distributions of the random variables and the copula of the joint
distribution, therefore not all of the values in the interval [−1, 1] are attainable;
as a result of the fact that not all values in the interval −1, 1 are attainable, perfect positive
dependence is not necessary achieved when 𝜌 = 1; alternatively, perfect negative dependence
is not obligatory reached when 𝜌 = − 1;
unlike copulas, 𝜌 is not invariant under non-linear strictly increasing transformations T: → ,
for which 𝜌 𝑇 𝑋 ,𝑇 𝑌 ≠ 𝜌 𝑋,𝑌 , where X, Y are real-valued random variables.
As the lack of invariance of 𝜌 is a strong limitation for its implementation into practice, it is necessary
to find other type of measures of dependence, which solve this problem. Copulas are invariant under
strictly increasing transformations of the marginals, therefore it is logical to search for measures of
dependence, which are expressed with copulas and remain invariant under the same condition as
they do. The question of finding an adequate invariant measure of dependence is particularly
important when exploring electricity prices. As indicated in Table 6, they exhibit Kurtosis, Skewness,
and Jarque Bera test results, which categorically lead their distribution out of the elliptical class and,
the Pearson correlation coefficient turns to be a completely inadequate measure of dependence to
apply in this case.
Such invariant under strictly increasing transformations copula-based measures, which can be
applied in the case of electricity prices, are the measures of concordance. They are useful because
they depend only on the copula of the joint distribution, and not on the marginal distribution.
Therefore, in practice it is possible for any continuous marginal distribution to specify a joint
distribution that has a desired rank correlation in the interval [−1, 1].
Without a strict mathematical definition, concordance between two random variables can be
described as capturing the fact that the probability of occurrence of large (small) values of both X and
Y is high. Alternatively, the probability of occurrence of high values of X, together with small values of
Y is low.
A definition of concordance in mathematical terms is provided in Nelsen (2006): if with (𝑥𝑖,𝑦𝑖) and
(𝑥𝑗 ,𝑦𝑗 ) are denoted two observations from a vector (𝑋,𝑌) of continuous random variables, then:

Stochastic dependencies of spot prices in the European electricity markets
69
(𝑥𝑖,𝑦𝑖) and (𝑥𝑗,𝑦𝑗) are concordant if 𝑥𝑖 < 𝑥𝑗 and 𝑦𝑖 < 𝑦𝑗, or if 𝑥𝑖 > 𝑥 𝑗 and 𝑦𝑖 > 𝑦𝑗.
(𝑥𝑖,𝑦𝑖) 𝑎𝑛𝑑 (𝑥𝑗,𝑦𝑗) are discordant if 𝑥𝑖 < 𝑥 𝑗 and 𝑦𝑖 > 𝑦𝑗 or if 𝑥𝑖 > 𝑥 𝑗 and 𝑦𝑖 < 𝑦𝑗.
An alternate mathematical formulation of concordance is provided in Embrechts et al. (2001) and
Nelsen (2006):
the observations (𝑥𝑖,𝑦𝑖) and (𝑥𝑗,𝑦𝑗) are concordant if (𝑥𝑖 − 𝑥𝑗)(𝑦𝑖 – 𝑦𝑗) > 0 and
discordant if (𝑥𝑖 − 𝑥𝑗)(𝑦𝑖 − 𝑦𝑗) < 0.
Nelsen (2006, Definition 5.1.7.) provides a formal set of axiomatic properties about a measure of
concordance:
Definition 4.2: A numeric measure of association 𝑀𝑋 ,𝑌 = 𝑀𝐶 between two continuous random
variables 𝑋1 and 𝑋2, whose copula is C, is a measure of concordance if it satisfies the following
conditions:
[1.] it is defined for every pair of the continuous variables 𝑋1 and 𝑋2;
[2.] it is a normalised measure: 𝑀𝑋1 ,𝑋2 Є [−1, 1];
[3.] it is symmetric: 𝑀𝑋1 ,𝑋2= 𝑀𝑋2 ,𝑋1
;
[4.] if X and Y are independent, then 𝑀𝑋1 ,𝑋2= M𝐶⊥ = 0
[5.] 𝑀−𝑋1 ,𝑋2=𝑀𝑋1 ,−𝑋2
= - 𝑀𝑋1 ,𝑋2
[6.] It converges when the copula pointwise55 does: if {(𝑋1,𝑛 ,𝑋2,𝑛)} is a sequence of continuous
random variables with copula 𝐶𝑛 , and
lim𝑛→∞ 𝐶𝑛 (u, v) = C (u,v) for every (u, v) Є 𝐼2, then
lim𝑛→∞ 𝑀𝑋1,𝑛 ,𝑋2,𝑛=𝑀𝑋1 ,𝑋2
[7.] It respects the concordance order: if C1 ≺ C2, then 𝑀𝐶1≤ 𝑀𝐶2
.
The fact that concordance measures comply with condition [7.] of Definition 4.2 is a reason to use
the concordance ordering operator “≺ ".
Nelsen (2006, Theorem 5.1.9.) demonstrates that if X1 and X2 are continuous random variables
whose copula is C, then the two popular copula-based concordance measures: the rank correlations
Kendall’s tau and Spearman’s rho satisfy the properties for a measure of concordance in Definition
4.2.
55 Please note that for the bivariate copulas, used throughout this study, pointwise and uniform convergence coincide, due to the uniform continuity.

Stochastic dependencies of spot prices in the European electricity markets
70
The Pearson correlation coefficient is not a measure of concordance as it does not comply with
condition [6.] of Definition 4.2. (Proof provided in Vecchiato et. al., 2004).
Vecchiato et al. (2004) link the concept of comonotonicity and countermonotonicity with the copula-
based measure of concordance via the following theorem. In the case when 𝑀𝑋 ,𝑌= 1, there exists a
direct parallel with the copula upper Fréchet-Hoeffding bound. Alternatively, when 𝑀𝑋1 ,𝑋2= - 1, there
exists a direct parallel with the copula lower Fréchet-Hoeffding bound.
Theorem 4.2. (Vecchiato et al., 2004): If X and Y are comonotone, their concordance measure
𝑀𝑋1 ,𝑋2= M𝐶+ = 1; if they are countermonotone, 𝑀𝑋1 ,𝑋2
= M𝐶− = −1.
A question arises what are the most important differences between the measures of concordance
and the measures of dependence. Scarsini (1984) distinguishes “dependence” from “concordance” as
follows:
“Dependence is a matter of association of X and Y along any (measurable) function, i.e., the more X
and Y tend to cluster around the graph of a function, either y = f(x), or x = g(y), the more they are
dependent. *…+ The minimum dependence, as well as the minimum of monotone dependence,
corresponds to independence. Concordance, on the other hand, takes into account the kind of
monotonicity (whether increasing or decreasing), so that the maximum of concordance is attained
when a strictly monotone increasing relation exists between the variables, and the minimum of
concordance (viz. perfect discordance) is attained when a relationship exists that is strictly monotone
decreasing.”
Lancaster (1982), adds that “a measure of dependence indicates in some defined way, how closely X
and Y are related, with extremes at mutual independence and (monotone) dependence.”
On basis of Scarsini (1984), Lancaster (1982), Theorem 4.2, definitions 4.1 and 4.2, can be outlined
two key differences between “dependence” and “concordance”:
Opposed to dependence measures, which reach their minimum, as mentioned by Scarsini (1984)
when X, Y (random variables) are independent, concordance measures reach it when X and Y are
countermonotone.
Independence is a sufficient, but not necessary condition for a concordance measure to be equal
to zero.

Stochastic dependencies of spot prices in the European electricity markets
71
Two of the most popular measures of concordance, the rank correlations Kendall’s tau and
Spearman’s rho, are presented both in their traditional and copula-based form.
Kendall’s tau
In the bivariate case the population version of Kendall’s tau rank correlation is defined as the
probability of concordance minus the probability of discordance:
ρτ = 𝑃 [(𝑋1−𝑋2)(𝑌1−𝑌2) > 0] − 𝑃 [(𝑋1−𝑋2)(𝑌1−𝑌2) < 0] 𝜖 [−1,1], (4.1)
of a random vector (X1,Y1 ) and a second, independent from it (copy) vector (X2,Y2 ) with the same
distribution. If there is a tendency for 𝑋1 to increase in line with 𝑌1, then it is expected the
concordance part𝑃 [(𝑋1−𝑋2)(𝑌1−𝑌2) > 0] of equation (4.1) to outweigh its discordance part
𝑃 [(𝑋1−𝑋2)(𝑌1−𝑌2) < 0].
Nelsen (2006) demonstrates that ρτ can be re-expressed equivalently in terms of copulas:
𝜌𝜏 = 4 2𝐼𝐶 𝑢, 𝑣 𝑑𝐶 𝑢, 𝑣 − 1, (4.2)
Spearman’s rho
Bouyé and Salmon (2008) define the population version of Spearman’s rho as:
𝜌𝑠 = 𝑅𝑖−𝑅 (𝑆𝑖−𝑆 )𝑛𝑖=1
𝑅𝑖−𝑅 𝑛𝑖=1 (𝑆𝑖−𝑆 )2𝑛
𝑖=12
, (4.3)
where 𝑅𝑖 denotes the rank of 𝑥𝑖 among all 𝑥 values, and 𝑆𝑖 denotes the rank of 𝑦𝑖 among all
𝑦 values.
Nelsen (2006) expresses 𝜌𝑠 again in terms of copula C as:
12 2𝐼
(𝐶(𝑢, 𝑣) − 𝑢𝑣)𝑑𝑢𝑑𝑣 ϵ [−1,1] (4.4)
The rank correlation coefficient ρs measures the distance between the joint distribution of 𝑈 and 𝑉
(represented by 𝐶(𝑢, 𝑣)) and the independence copula, represented by 𝑢𝑣 . According to (4.4)
Spearman’s rho is proportional to the surface, formed between the joint distribution C(u,v) and the
independence copula.
Spearman’s rho and Kendall’s tau measure the degree of monotonic dependence, while Pearson’s
correlation coefficient indicates only linear dependence. As both Spearman’s rho and Kendall’s tau
are measures of concordance according to Definition 4.2, they reach 1 for the upper Fréchet-

Stochastic dependencies of spot prices in the European electricity markets
72
Hoeffding bound, and -1 for the lower Fréchet-Hoeffding bound. In general this is not true for the
Pearson’s correlation coefficient.
The main practical implementation of Spearman’s rho and Kendall’s tau is that they can be used to
calibrate copulas to empirical data56.
Next, there exists a functional relationship between Spearman’s rho and Kendall’a tau, as shown by
Durbin and Stuart (1951) for a given association between X and Y (Figure 19):
3
2 ρτ –
1
2 ≤ 𝜌𝑠 ≤
1
2 + ρτ – –
1
2ρτ
2 , for ρτ ≥ 0 (4.5)
–1
2 + ρτ +
1
2ρτ
2 ≤ 𝜌𝑠 ≤3
2 ρτ +
1
2 , for ρτ < 0 (4.6)
It should be noted that the concordance measures Spearman’s rho 𝜌𝑠 and Kendall’a tau ρτ for some
copulas do not cover the entire range [-1, 1]. For example the Gumbel copula does not cover
negative dependence.
Figure 19 Spearman’s rho (𝜌) as a function of Kendall’s tau (τ) for a given copula
Source: Nelsen (2006)
Finally, Genest and MacKay (1986) present another useful property of 𝜌𝑠 and ρτ valid for
Archimedean copulas, which I use in Chapter 5. The authors demonstrate that if Ci is an Archimedean
copula, then:
C1 ≺ C2 ↔ ρτ𝑐1 < ρτ𝑐2
(4.7)
C1 ≺ C2 ↔ 𝜌𝑠𝑐1 < 𝜌𝑠𝑐2
(4.8)
56 More information on this matter is provided in Vecchiato et al. (2004), Chapter 5.

Stochastic dependencies of spot prices in the European electricity markets
73
CHAPTER 5 ANALYSIS OF THE STOCHASTIC DEPENDENCIES OF SPOT ELECTRICITY PRICES WITH
COPULAS AND COPULA-BASED CONCORDANCE MEASURES
This chapter provides an analysis of the dependencies of five spot hourly electricity prices datasets:
EXAA, EEX, OMEL, Nord Pool and SWISSIX, using copulas and the concordance measures Kendall’s tau
and Spearmans rho. The explored time period is fixed from 1 January 2007 to 31 December 2008.
Where hourly spot electricity prices’ quotations are missing is used the interpolation57 method.
5.1. Descriptive statistics
Table 6 provides a summary of the descriptive statistics of the five spot hourly electricity prices
datasets. In the upper panel of Table 6 (historical datasets) the sample mean value of EEX, EXAA and
OMEL are similar. SWISSIX has the highest mean value and exhibits the highest volatility. Nord Pool
has the lowest average electricity spot price, but the minimum belongs to EEX.
The upper panel of Table 6 with historical data of all power exchanges exhibits positive Skewness,
which means that the historical data histograms have longer tail to the right. The explanation is that
some extremely high spot hourly prices have pulled the graph to the right, so that the sample mode
is smaller than the sample median, which in turn is smaller than the sample mean. From the five spot
prices datasets, OMEL has the closest Skewness to the normal distribution, which is zero. The
Skewness for the transformed to logarithmic scale historical data in the lower panel of Table 6 is
negative for all datasets. This pattern results in a longer tail to the left, with the sample mean below
the sample median and mode. In this case, although most observations are above the sample mean,
it has been pulled down by a few very small empirical observations.
Both the upper panel with historical data and the transformed logarithmic lower panel of Table 6
show the presence of positive excess kurtosis. It means that there is more weight in both tails of the
distribution, characterising the electricity spot prices, compared to the normal distribution. In other
words, the probability of extreme empirical observations of the electricity spot prices is higher than
the probability of extreme empirical observations under the normal distribution. A popular term for
distributions with positive excess kurtosis is “fat-tailed” distributions, also referred to as
“leptokurtic”. All reviewed datasets, lower and upper panel included, are far from 3, the Kurtosis for
the normal distribution.
57 This approach is proposed for solving a HSG Homework assignment for the course Quantitative
Methods, HS 2008, with input EEX, EXXA hourly electricity prices: for the “ electricity time series
(daily data from 01. Jun. 2002 - 31. Mai. 2008) *…+ - in case single data entries should be missing,
please interpolate linearly between available dates…”.

Stochastic dependencies of spot prices in the European electricity markets
74
The null hypothesis under the Jarque Bera test that the data in Table 6 is normally distributed (with
unspecified mean and standard deviation) is categorically rejected for all of the reviewed power
exchanges, both when treated as historical datasets and when transformed to logarithmic scale.
Table 6. Descriptive statistics in EUR/MWh for the spot hourly wholesale electricity price series
(upper panel) and their natural logarithm (lower panel).
Observations that were not strictly positive were excluded from the logarithmic data, but these
observations only constituted a very small proportion of the EEX set.
EEX EXXA SWISSIX OMEL NORD POOL
Mean 51.89 52.60 60.20 52.01 36.34
Maximum 821.90 519.93 553.88 130 124.88
Minimum -101.52 0.01 0.09 5.00 2.04
Standard deviation 32.62 32.05 32.95 18.02 14.87
Skewness 3.10 2.14 1.94 0.20 0.38
Kurtosis 43.62 17.99 18.36 2.25 2.60
Jarque-Bera test* 1.2344E+006 1.7761E+005 1.8346E+005 534.53 536.59
Mean 3.75 3.78 3.95 3.89 3.50
Maximum 6.71 6.25 6.32 4.87 4.83
Minimum -3.91 -4.61 -2.41 1.61 0.71
Standard deviation 0.71 0.68 0.58 0.38 0.47
Skewness -1.77 -2.05 -0.70 -0.51 -0.95
Kurtosis 12.07 20.74 4.89 2.84 5.11
Jarque-Bera test* 6.9296E+004 2.4232E+005 4.0139E+003 785.85 5.9089E+003
* For rejection of normality the 1 % critical value of the Jarque-Bera test, which asymptotically is 2 (2)
distributed with two degrees of freedom, is 9.21 and its respective 5% critical value is 5.99. (Alexander,
2001).
Figure 20 represents the 2007-2008 dynamics of the five sets of daily spot prices and indicates that
the price pattern of EXAA, SWISSIX and EEX is very similar, while that of Nord Pool and OMEL
diverges.
5.2. Motivation for data choice
This study will not follow the approach of Wang and Cuddington (2006), recommending the use of
logarithmic transformation for data estimation. Although this transformation reduces the skewness
and excess kurtosis of the series (see also Lutkepohl and Kratzig, 2004), it the concrete case it does
not lead to improvement of these descriptive statistics in all datasets.
A further argument to work with real, not transformed, data is the invariance of copulas under
strictly increasing transformations of the random variables, in this case: the spot electricity prices.
The logarithmic function is a strictly increasing one, provided that from the dataset is excluded the
tiny portion of EEX negative spot prices. However, the application of logarithmic transformation is

Stochastic dependencies of spot prices in the European electricity markets
75
useless in the case of copulas, as it renders the same results58 as the non-transformed real dataset.
Therefore, for the copula estimation throughout this study are used spot hourly prices historical59
datasets.
Next, a question arises whether to work in the copula analysis with the day ahead continuous, day
ahead auction or intraday prices, as all of them belong to the spot segment. Day ahead auction prices
are the only spot prices datasets that have the same characteristics for EEX, EXAA, SWISSIX, OMEL,
NORDPOOL: double-sided, blind, anonymous auctions (although with daily auctions located at
different point of the DAM), producing the spot prices for all 24 hours of the next day. Table 3 from
Chapter 1 is indicative about the fact that intraday prices exhibit discrepancies in their trade
organization, and therefore reflect different, non-comparable market information. Day ahead
continuous trading is not available in all countries. In conclusion, the spot prices that ensure the
highest comparability among the five datasets are the spot day ahead hourly auction-based prices,
and therefore they are preferred in the present study.
5.3. The Goodness-of-a-fit test for copulas, applied in this study
Copula and rank correlation analysis is again applied to the 01.01.2007-31.12.2008 dataset for the
five electricity spot prices sets: EEX, EXAA, OMEL, Nord Pool and SWISSIX. Five copula families are
tested in order to find the best fit to the historical datasets: Frank, Gumbel, Clayton, Gaussian and
Student 𝑡 copulas. A suitable copula is such that if from it are drawn n pairs (u1, v1), … ,(un, vn), where
(ui, vi) Є [0,1] for i=1,…, n, the resulting copula graph should look on average like the historical
dataset.
For the selection of a suitable copula is applied the goodness-of-a-fit test, proposed by Genest et al.
(2008 b, 2009). It is favoured because it is a ‘blanket’ test, meaning that it is applicable for all copula
families and requires no strategic choice of statistics, such as kernels, weight functions, bandwidth,
smoothing parameters, ad hoc data categorization, etc.
58 As an illustration of the invariance of copulas and rank correlations and the fact that the results on Figure B,
C, D of Appendix 2 are the same with the application of real data and its logarithmic transformation, in the CD
ROM in folder “Clayton_copula” are provided two .m files, which calculate the presented results on Figure A-D
of Appendix 2 on basis of both real data and their logarithmic transformation. It can be seen that for both the
real data and its logarithmic transformation the rank correlation coefficients Kendall’s tau and Spearman’s rho
are the same (the invariance property of rank correlation), as well as they have the same dependency
parameter alpha for the Clayton copula (see equation 5.3 in Chapter 5 for the relationship between Kendall’s
tau and alpha for the Clayton copula). 59
My idea to use for copula estimation in the study spot, hourly electricity prices, and not a logarithmic
transformation of them, has been confirmed by Christian Genest, Ph.D., P.Stat. Département de
mathématiques et de statistique, Faculté des sciences et de génie (FSG), Université Laval,

Stochastic dependencies of spot prices in the European electricity markets
76
Figure 20. Daily spot prices in the period 2007-2008 on five European electricity markets
0,00
20,00
40,00
60,00
80,00
100,00
120,00
140,00
160,00
1.1
.20
07
1.2
.20
07
1.3
.20
07
1.4
.20
07
1.5
.20
07
1.6
.20
07
1.7
.20
07
1.8
.20
07
1.9
.20
07
1.1
0.2
00
71
.11
.20
07
1.1
2.2
00
71
.1.2
00
81
.2.2
00
81
.3.2
00
81
.4.2
00
81
.5.2
00
81
.6.2
00
81
.7.2
00
81
.8.2
00
81
.9.2
00
81
.10
.20
08
1.1
1.2
00
81
.12
.20
08
EXXA, Austria, EUR/MWh
0,0010,0020,0030,0040,0050,0060,0070,0080,0090,00
1.1
.20
07
1.2
.20
07
1.3
.20
07
1.4
.20
07
1.5
.20
07
1.6
.20
07
1.7
.20
07
1.8
.20
07
1.9
.20
07
1.1
0.2
00
71
.11
.20
07
1.1
2.2
00
71
.1.2
00
81
.2.2
00
81
.3.2
00
81
.4.2
00
81
.5.2
00
81
.6.2
00
81
.7.2
00
81
.8.2
00
81
.9.2
00
81
.10
.20
08
1.1
1.2
00
81
.12
.20
08
OMEL, Spain, EUR/MWh
0,00
20,00
40,00
60,00
80,00
100,00
120,00
140,00
160,00
180,00
1.1
.20
07
1.2
.20
07
1.3
.20
07
1.4
.20
07
1.5
.20
07
1.6
.20
07
1.7
.20
07
1.8
.20
07
1.9
.20
07
1.1
0.2
00
71
.11
.20
07
1.1
2.2
00
71
.1.2
00
81
.2.2
00
81
.3.2
00
81
.4.2
00
81
.5.2
00
81
.6.2
00
81
.7.2
00
81
.8.2
00
81
.9.2
00
81
.10
.20
08
1.1
1.2
00
81
.12
.20
08
EEX, Germany, EUR/MWh
0,00
10,00
20,00
30,00
40,00
50,00
60,00
70,00
80,00
1.1
.20
07
1.2
.20
07
1.3
.20
07
1.4
.20
07
1.5
.20
07
1.6
.20
07
1.7
.20
07
1.8
.20
07
1.9
.20
07
1.1
0.2
00
71
.11
.20
07
1.1
2.2
00
71
.1.2
00
81
.2.2
00
81
.3.2
00
81
.4.2
00
81
.5.2
00
81
.6.2
00
81
.7.2
00
81
.8.2
00
81
.9.2
00
81
.10
.20
08
1.1
1.2
00
81
.12
.20
08
NORD POOL, EUR/MWh
0,0020,0040,0060,0080,00
100,00120,00140,00160,00180,00200,00
1.1
.20
07
1.2
.20
07
1.3
.20
07
1.4
.20
07
1.5
.20
07
1.6
.20
07
1.7
.20
07
1.8
.20
07
1.9
.20
07
1.1
0.2
00
71
.11
.20
07
1.1
2.2
00
71
.1.2
00
81
.2.2
00
81
.3.2
00
81
.4.2
00
81
.5.2
00
81
.6.2
00
81
.7.2
00
81
.8.2
00
81
.9.2
00
81
.10
.20
08
1.1
1.2
00
81
.12
.20
08
SWISSIX, Switzerland, EUR/MWh

Stochastic dependencies of spot prices in the European electricity markets
77
The Genest et al. (2008 b, 2009) ‘blanket’ test involves comparing the Cramér-von Mises statistic
measure for the five tested copula families:
𝑆𝑛 = 𝑛 {𝐶𝛼𝑛 𝑢𝑡 ,𝑣𝑡 − 𝑛=1 𝐶𝑛 𝑢𝑡 , 𝑣𝑡 }
2, where (5.1)
𝐶𝛼𝑛 𝑢𝑡 , 𝑣𝑡 is the fitted to the historical dataset copula with dependence parameter α, as described
in Table 5 and number of observations 𝑛,
𝐶𝑛 𝑢𝑡 , 𝑣𝑡 = 𝑢𝑣 for ∀ 𝑢, 𝑣 ∈ [0,1] is the independence copula, for which each pair (ui, vi) is defined
as:
𝑢𝑖 =
1
𝑛+1
× Rank of 𝑋𝑖 among𝑋1,…, 𝑋𝑛 ,
𝑣𝑖 =
1
𝑛+1
× Rank of 𝑌𝑖 among𝑌1,…, 𝑌𝑛 .
In summary, the 𝑆𝑛 term measures the distance between the independence copula and the fitted to
the historical dataset copula. If the (𝑋, 𝑌) dependence is small, the 𝑆𝑛 term will be converging to
zero, meaning that the fitted to the historical dataset copula is approaching the independence
copula. Figure A of Appendix 2 shows that the spot electricity prices fall into the other possible case:
when 𝑋,𝑌 are dependent, positively in the present case. Therefore, after applying the Genest et al.
(2008 b, 2009) ‘blanket’ test, must be chosen the copula with the maximum 𝑆𝑛 value. Given
dependence between 𝑋,𝑌 , the biggest 𝑆𝑛 answers the question which copula maps the data
closest the real dataset i.e. is farthest from the independence copula.
The results of the application of the goodness-of-a-fit test, as proposed by Genest et al. (2008 b,
2009), are summarized in Table 7. They indicate that the Clayton copula is the best to capture the
dependency between the spot electricity prices of the selected five European spot prices datasets.
As stated above, for a suitable copula the pairs (ui, vi) Є [0,1] for i=1,…, n, should look on average like
the historical data set. The comparison the historical data in Appendix 2, Figure A, and Clayton copula
data in Appendix 2, Figure B respectively proves this statement.
Table 7. Goodness-of-a-fit test for copulas results.
Sn test values Spot prices Data pairs
Frank copula
Gumbel copula
Clayton copula
Gaussian copula
Student t-copula,
generated with Kendall’s
τ
Student t copula,
generated with Spearman’s ρ
1. OMEL-EEX 4.30 4.1035 26.8487 8.1823 10.0881 7.3542
2. SWISSIX-EEX 30.2887 29.9636 77.2432 43.4064 47.3505 28.7494
3. SWISSIX-OMEL 0.1754 0.1525 2.1872 0.3660 0.8959 0.7372
4. SWISSIX-EXAA 82.7291 92.9981 128.6121 108.3786 111.2107 86.1106

Stochastic dependencies of spot prices in the European electricity markets
78
Note: All results in Table 7 are divided by 1000.
5.4. Results of the application of Clayton copula and copula-based concordance measures to
analyse the stochastic dependencies of spot electricity prices
The goodness-of-a-fit test of Genest et al. (2008 b, 2009) in section 5.3. has shown that the best
copula to describe the dependence between the five historical datasets60, is the Clayton one. A
question arises which of the dominant properties of the electricity prices, described in Chapter 2, can
explain this result.
First, starting from the fact that the Clayton copula is suitable for situations, in which both outcomes
tend to experience low values together, leads to the conclusion that the mean-reversion property of
the electricity prices can be an explanation of the goodness-of-a-fit test result. None of the other
four copulas (Gaussian, Gumbel, Frank, Student-t) are able to capture well the mean-reversion
property of the electricity prices i.e. a tendency of the prices to return (fall) to their mean value. In
summary, the Clayton copula is the best one from the five copula families tested to describe the
dependency of the historical datasets, because only it exhibits asymmetric, lower-tail dependence, as
required by the mean-reversion property of the electricity prices.
Second, the result of the goodness-of-a-fit test Genest et al. (2008 b, 2009) in section 5.3. can be
explained by the specific market design of the European spot markets, as well as by human
behaviour. On the reviewed power exchanges in Chapter 1, the spot prices for all 24 hours for a given
day are fixed the day before by the DAM central auction. This means than if a trader has confirmed a
commitment to buy electricity for a particular set of hours at a high price, this deal is binding only for
the relevant day. The trader is expected to exit the commitment at the first opportune moment (the
next day) and search for a possibility to enter into another deal at more favourable trade conditions.
Therefore, in case of absence of severe supply and demand shocks, spot prices are expected to fall
consistently from a spike value to a mean value with time.
In Table 8 are summarized the rank correlation coefficients Spearman’s rho, Kendall’s tau and the
dependence parameter alpha of the Clayton copula, calculated on their basis, for the ten possible
pair combinations between the five spot electricity prices datasets. The rank correlation results in
60 Whenever “historical dataset” is used, is meant historical, spot, hourly, auction-based price in
EUR/MWh of OMEL, Nord Pool Spot, EEX, EXAA and SWISSIX.
5. OMEL-EXAA 0.1364 0.1192 1.7638 0.2883 1.0660 0.9320
6. EEX-EXAA 48.1084 52.8316 90.3089 66.6383 70.0225 50.9496
7. EEX-NORDPOOL 2.1548 2.1039 19.5205 4.6120 10.3483 8.8098
8. NORDPOOL-OMEL 9.4908 17.7484 101.1278 36.1591 36.2022 33.3239
9. NORDPOOL-SWISSIX 8.1100 10.2014 64.1594 20.5257 23.0588 18.0057
10. NORDPOOL - EXAA 7.6305 9.6850 64.2905 19.8144 22.0915 17.9301

Stochastic dependencies of spot prices in the European electricity markets
79
Table 8 follow the finding of Genest et al. (1993) that for a positively related random variables
Spearman’s rho is larger than Kendall’s tau (also visible on Figure 19).
Table 8: Clayton copula applied on historical datasets
Results reported in ascending order by Kendall’s tau value
Clayton copula ρτ – Kendall’s tau,
α – Clayton copula dependence parameter ρs – Spearman’s rho
Historical dataset pair
ρτ α(ρτ ) ρs α(ρs )
NORDPOOL-OMEL 0,5121 2,0993 0,7153 2,2558
EEX-NORDPOOL 0,5341 2,2923 0,7279 2,3656
NORDPOOL - EXAA 0,5428 2,3747 0,7387 2,4657
OMEL-EEX 0,5542 2,4862 0,7501 2,5793
OMEL-EXAA 0,5590 2,5354 0,7552 2,6323
SWISSIX-OMEL 0,5661 2,5990 0,7658 2,7481
NORDPOOL-SWISSIX 0,5950 2,9378 0,7899 3,0429
SWISSIX-EEX 0,7049 4,7781 0,8732 4,6451
SWISSIX-EXAA 0,7448 5,8361 0.8952 5,3621
EEX-EXAA 0,8377 10,3212 0,9621 10,5781
On basis of Kendall’s tau and Spearman’s rho can be made the conclusion that the dependency
between the historical datasets of EEX and EXXA is the highest, and the minimal dependency results
in the pair OMEL and NORDPOOL. A key explanation why the maximum dependence is detected
between EEX and EXXA are the illustrated on Figure 10 Day Ahead cross-border transmission capacity
allocation methods. Among the reviewed historical datasets only between EEX and EXAA there is no
congestion in the cross-border transmission. In other words, it is the unlimited transmission capacity,
compared to the other methods on Figure 10 that ensures the maximal dependence of the spot
electricity prices of EEX and EXAA. In between the minimum and maximum rank correlation are
located in ascending order the pairs: EEX-NORDPOOL, NORDPOOL – EXAA, OMEL-EEX, OMEL-EXAA,
SWISSIX-OMEL, NORDPOOL-SWISSIX, SWISSIX-EEX and SWISSIX-EXAA.

Stochastic dependencies of spot prices in the European electricity markets
80
Following Genest and MacKay (1986) and applying equation (4.7), using Kendall’s tau61 from Table 8,
yields the following concordance ordering, where with C is denoted the respective bivariate copula:
𝐶(𝑁𝑂𝑅𝐷𝑃𝑂𝑂𝐿,𝑂𝑀𝐸𝐿) ≺ 𝐶(𝐸𝐸𝑋,𝑁𝑂𝑅𝐷𝑃𝑂𝑂𝐿) ≺ 𝐶(𝑁𝑂𝑅𝐷𝑃𝑂𝑂𝐿,𝐸𝑋𝐴𝐴)
≺ 𝐶(𝑂𝑀𝐸𝐿,𝐸𝐸𝑋) ≺ 𝐶(𝑂𝑀𝐸𝐿,𝐸𝑋𝐴𝐴) ≺ 𝐶(𝑆𝑊𝐼𝑆𝑆𝐼𝑋,𝑂𝑀𝐸𝐿)
≺ 𝐶(𝑁𝑂𝑅𝐷𝑃𝑂𝑂𝐿,𝑆𝑊𝐼𝑆𝑆𝐼𝑋) ≺ 𝐶(𝑆𝑊𝐼𝑆𝑆𝐼𝑋,𝐸𝐸𝑋) ≺ 𝐶(𝑆𝑊𝐼𝑆𝑆𝐼𝑋,𝐸𝑋𝐴𝐴)
≺ 𝐶(𝐸𝐸𝑋,𝐸𝑋𝐴𝐴). (5.2)
The copula-based concordance ordering (5.2) leads to the conclusion that the biggest copula is
𝐶 𝐸𝐸𝑋,𝐸𝑋𝐴𝐴 and the smallest copula is 𝐶 𝑁𝑂𝑅𝐷𝑃𝑂𝑂𝐿,𝑂𝑀𝐸𝐿 .
As the Clayton copula is the best fit copula for the historical datasets in this study, in Appendix 2,
apart from the bivariate scatter plots of the historical spot prices in EUR/MWh with marginal
distributions histograms on Figure A, are presented:
the Clayton copula for the historical datasets (Appendix 2, Figure B);
perspective plot and contour plot of the probability density function of the Clayton copula,
applied to the historical datasets (Appendix 2, Figure C);
perspective plot and contour plot of the cumulative distribution function of the Clayton copula,
applied to the historical datasets (Appendix 2, Figure D),
on which basis are made the conclusions, presented next in this section. Following Kaishev et al.
(2007) the criterion for the order of all graphs on Figure A, B, C, D in Appendix 2 has been the
Kendall’s tau value in ascending order, as summarized in Table 8.
The marginal distributions of the historical datasets on Figure A of Appendix 2 confirm the results of
the descriptive statistics from Table 6 that the historical datasets are not described by the normal
distribution. Based on Figure A and Figure D62 from Appendix 2 can be made the conclusion from the
joint (bivariate) distribution of the historical datasets that the compared spot prices pairs tend to
experience low values together. However, with the increase of Kendall’s tau, the compared historical
datasets also tend to experience average values together. This patter is most obvious for the EEX-
EXAA historical set, which has the highest rank correlation Kendall’s tau.
Although 1 MWh has the same meaning and content on every power exchange, implying that
electricity is a homogeneous good, Figure A of Appendix 2 is indicative about its price differential
across Europe.
61 Using Spearman’s rho is an option, which leads to the same concordance ordering on basis of (4.8) from Chapter 4. 62
See the copula_Clayton_contour6.m file in folder “Clayton_copula” on the submitted CD ROM for the link by construction between Figure A and Figure D of Appendix 2.

Stochastic dependencies of spot prices in the European electricity markets
81
A straightforward way to gain understanding of the three dimensional visualisation of the copula
probability density function on Figure C of Appendix 2 is by analysing the intensity and location in the
[0,1]2 plane of the level sets of its contour plots (as defined in section 3.5 of Chapter 3).
Without exception the level sets of the contour plots on Figure C of Appendix 2 increase in
concentration and in value as they approach the [0,0] corner of the respective contour plot diagram:
(a) For the historical datasets NORDPOOL-OMEL, NORDPOOL-EEX, NORDPOOL-EXAA, OMEL-EEX,
OMEL-EXAA, SWISSIX-OMEL with lower Kendall’s tau in the range *0,5121 - 0,5661] the intensity of
the level sets of the contour plots of the respective copula probability density function reaches up to
4.
(b) For historical datasets with higher Kendall’s tau in the range [0,5950-0,7448] the level sets of
the contour plots of the respective copula probability density function increase in intensity to 4,5 (for
NORDPOOL-EEX), 5,5 (for SWISSIX-EEX), 6 (for SWISSIX-EXAA).
(c) For EXAA-EEX, the historical dataset with highest Kendall’s tau, equal to 0,8377, the level
sets of the contour plots of the copula probability density function increase in intensity to a
maximum of 8.
Figure A from Appendix 2 can be analysed jointly with the respective copula probability density
function on Figure C of Appendix 2. The highest level sets of the contour plot of the copula
probability density function on Figure C of Appendix 2 (right panel), corresponding to a maximum on
the z63 axis (same figure, left panel), are detected for the smallest values on the x and y axes on the
same figure, where are presented the uniform marginal distributions of the historical datasets. On
their turn, smallest values of the uniform marginal distributions of the historical datasets on Figure C
of Appendix 2 correspond64 to the lowest electricity spot prices in EUR/MWh on Figure A of Appendix
2.
As mentioned in section 3.7 of Chapter 3, the Clayton copula exhibits asymptotically lower tail
dependence, which is proven by the increasing intensity of the level sets of the contour plot of the
copula probability density function, as they approach the [0,0] zone of the contour plot diagram on
Figure C, Appendix 2. Therefore, it is also opportune to analyse the values of the coefficient of lower
tail dependence, represented in Table 9.
63 On the z axis of Figure C, Appendix 2 (left panel) is visualized the copula probability density function. 64
See the copula_Clayton_contour6.m file in folder “Clayton_copula” on the submitted CD ROM for the link by
construction between Figure A and Figure C of Appendix 2.

Stochastic dependencies of spot prices in the European electricity markets
82
Table 9. Lower tail dependence coefficient 𝜆𝑙𝐶𝑙𝑎𝑦𝑡𝑜𝑛
for ρτ from Table 8.
Historical dataset pair
Kendall’s tau ρτ
𝛼(𝜌𝜏 ) λ𝑙 𝐶𝑙𝑎𝑦𝑡𝑜𝑛
(𝛼)
NORDPOOL-OMEL 0,5121 2,0993 0,7188
EEX-NORDPOOL 0,5341 2,2923 0,7391
NORDPOOL - EXAA 0,5428 2,3747 0,7469
OMEL-EEX 0,5542 2,4862 0,7567
OMEL-EXAA 0,5590 2,5354 0,7608
SWISSIX-OMEL 0,5661 2,5990 0,7659
NORDPOOL-SWISSIX
0,5950 2,9378 0,7898
SWISSIX-EEX 0,7049 4,7781 0,8650
SWISSIX-EXAA 0,7448 5,8361 0,8880
EEX-EXAA 0,8377 10,3212 0,9350
Hereafter is used the link, as defined by Embrechts et al., (2001), between Kendall’s tau ρτ and the
Clayton copula dependence parameter alpha α(ρτ ):
ρτ = α
(α+2) , from which follows that: α(ρτ ) =
2ρτ
1−ρτ
(5.3.)
Conclusion from (5.3.)
The dependence parameter of the Clayton copula α(ρτ ) is an increasing function of Kendall’s tau ρτ .
From Table 5: α(ρτ ) Є [−1, 0) (0, +∞].
The lower tail dependence coefficient 𝜆𝑙𝐶𝑙𝑎𝑦𝑡𝑜𝑛 = 2
−1
α (ρτ ) is an increasing function of the dependence
parameter α(ρτ ), which on its turn is an increasing function of Kendall’s tau ρτ as per equation (5.3).
This fact explains the following relationship in Table 9: by means of the lower tail dependence
coefficient 𝜆𝑙𝐶𝑙𝑎𝑦𝑡𝑜𝑛 = 2
−1
α (𝛒𝛕 ) , the Clayton copula exhibits asymptotically increasing lower tail
dependence for increasing 𝛼(ρτ ) and increasing Kendall’s tau ρτ .
As the behavior of 𝜆𝑙𝐶𝑙𝑎𝑦𝑡𝑜𝑛 and the concordance ordering (5.2), calculated on basis of (4.7), following
Genest and MacKay (1986), is determined by the same Kendall’s tau ρτ , a natural result is that the
data pairs ordering as per 𝜆𝑙𝐶𝑙𝑎𝑦𝑡𝑜𝑛 exactly mirrors the concordance ordering of equation (5.2).
The results from Table 8, Table 9 and Figure C of Appendix 2 can be also interpreted on basis of
Kendall’s tau ρτ values. In this relation can be made the conclusion that EEX-EXAA, the historical
dataset pair with highest Kendall’s tau ρτ = 0,8377 , has highest value of the level sets of the
contour plots of the copula probability density function, reaching 8 and strongest tail dependence
λ𝑙 𝐶𝑙𝑎𝑦𝑡𝑜𝑛
= 0,9350. A clearly visible pattern about the level lines of the contour plots of the copula

Stochastic dependencies of spot prices in the European electricity markets
83
probability density function on Figure C of Appendix 2 is that they concentrate to the right diagonal
with the increase of the dependence coefficient alpha 𝛼(ρτ ), determined by Kendall’s tau, as
described in (5.3).
The perspective plot of the Clayton copula cumulative distribution function on Figure D of Appendix 2
can be straightforwardly analyzed in terms of the level sets of its contour plot, defined as a concept
in section 3.5 of Chapter 3. For all contour plots of the copula cumulative distribution function is
noticeable the same pattern: their lower level sets resemble that of the comonotonicity copula 𝐶 +
with {(u,v) Є [0,1]2 : C(u,v) = 0,1} being most indicative of the mentioned pattern.
The following conclusions can be made, when parallel is drawn between the shape of the of level line
{(u,v) Є [0,1]2 : C(u,v) = m} and Kendall’s tau value ρτ of the historical datasets:
(a) The ordered by Kendall’s tau contour plots of the historical datasets NORDPOOL-OMEL,
NORDPOOL-EEX, NORDPOOL-EXAA, EEX-OMEL, OMEL-EXAA, OMEL-SWISSIX, NORDPOLL-SWISSIX on
Figure D of Appendix 2 have level lines {(u,v) Є [0,1]2 : C(u,v) = 0,1} that resemble that of the
comonotonicity copula 𝐶 +. This pattern corresponds to Kendall’s tau ρτ in Table 8 in the range
[0,5121-0,5950].
(b) For historical datasets pairs (SWISSIX-EEX, SWISSIX-EXAA) with higher Kendall’s tau ρτ in
the range [0,7049-0,7448] on Figure D of Appendix 2 the level lines of the contour plots of their
respective copula cumulative distribution functions that resemble that of the comonotonicity
copula 𝐶 + extend from {(u,v) Є [0,1]2 : C(u,v) = 0,1} to cover also {(u,v) Є [0,1]2 : C(u,v) = 0,2}
and {(u,v) Є [0,1]2: C(u,v) = 0,3}.
(c) The historical dataset EEX-EXAA is with the highest Kendall’s tau ρ𝛕 =0,8377, which leads to
𝜆𝑙𝐶𝑙𝑎𝑦𝑡𝑜𝑛 close to the maximum level of 1 in Table 9. As noted by Vecchiato et al. (2004) λ𝑙 = 1 for the
comonotonicity copula 𝐶 +. Therefore, it should be checked if the level lines of the contour plot of
the EEX-EXAA cumulative distribution function on Figure D of Appendix 2 approach the
comonotonicity copula 𝐶 +. It can be spotted that only in the EEX-EXAA case the resemblance of the
level lines of 𝐶 +, visible in case (a) only for {(u,v) Є [0,1]2: C(u,v) = 0,1}, then extending in (b) to
{(u,v) Є [0,1]2: C(u,v) = 0,2} and {(u,v) Є [0,1]2 : C(u,v) = 0,3}, now also covers {(u,v) Є [0,1]2 : C(u,v) =
0,4} and {(u,v) Є [0,1]2: C(u,v) = 0,5}.
A conclusion can be made on basis of the results of the present copula analysis of the spot electricity
prices, that although they do not comply with Definition 3.3. about comonotonicity, as they do not
reach the upper Fréchet-Hoeffding bound C+ = min u1,… . un and 𝜆𝑙𝐶𝑙𝑎𝑦𝑡𝑜𝑛 = 1, as defined by
Vecchiato et al. (2004), they are closely related to the comonotonicity concept for lower values of the
level sets of the contour plots of the copula cumulative distribution functions.
Stochastic dependencies of spot prices in the European electricity markets
84
Finally, on basis of Figure A, B, C, D from Appendix 2 and Table 8, can be made the broader
conclusion that the reviewed power exchanges exhibit a different degree of integration and have a
higher level of dependency rather on regional level, most pronounced for the spot electricity prices
of the neighbouring countries Germany, Austria and Switzerland.
However, this result may change after the Florence Regulatory Forum (“the Forum”) of 4-5 June
2009. The Forum65 targets price coupling on the day-ahead market, through which spot electricity
price fixing will be coordinated in the area covering Portugal, Spain, France, Germany, Austria,
Switzerland, Denmark, Norway, Sweden and Finland, amounting to approximately 1900 TWh of the
annual power consumption, and more than 2/3 of the European power market, out of which more
than 700 TWh are traded on the day-ahead organized markets.
65
Source: http://www.epexspot.com/en/press-media/press-
releases/details/press/Cooperation_of_Power_Exchanges_on_European_Price_Coupling_Concept

Stochastic dependencies of spot prices in the European electricity markets
85
SUMMARY AND CONCLUSIONS
Power exchanges are an important element of the deregulated European electricity markets because
they enhance the trade flexibility and give a price reference for the market participants. This study
presents some main features of the European electricity market design and provides a quantitative
analysis of the dependency of the spot electricity prices of selected power exchanges.
The quantitative analysis in Chapter 5 explores the dependencies of the spot prices in the period
2007-2008 of selected popular power exchanges in Europe and finds evidence for positive
dependency between them. The strongest dependency is found to be between the spot electricity
prices of EEX and EXAA. This is due to the lack of congestion between Germany and Austria. Stronger
positive dependency is detected also for the spot electricity prices pairs SWISSIX of Switzerland with
the neighbouring Germany and Austria. The spot electricity price of Nord Pool has stronger
dependency with SWISSIX than with the other analysed spot electricity prices datasets. OMEL is
found to be less correlated with the other four spot electricity prices datasets. These results lead to
the conclusion in Chapter 5 that the country spot electricity marketplaces are at different level of
integration. This finding is in line with the presented opinions in Chapter 1 that currently the
European electricity market is rather regionalised and with higher integration-targeting initiatives at
different level of development and coordination.
As power exchanges’ role in electricity trade in Europe is growing with time, there are ample
opportunities for further empirical research by analysing the spot electricity prices dependencies on
a broader scale, by including for example the power marketplaces of Romania, the Czech Republic,
Poland, Portugal, Italy, Belgium, France, the Netherlands, UK and Slovenia. A further example is to
implement the quantitative approach from Chapter 5 to test for compliance the price-coupling target
of the Florence Regulatory Forum of 4-5 June 2009. Another extension of the study can be to explore
the electricity prices dependency in the upcoming years, taking into account the existing market
coupling mechanisms in Europe, described in Chapter 1, when they will most probably have entered
into a more widespread and mature stage.
Copulas are a flexible tool to study dependency in finance. The application of bivariate copulas to the
historical spot electricity prices datasets has showed that the most suitable copula to reflect their
dependency is the Clayton copula. It most adequately captures the tendency of the reviewed spot
electricity prices to experience low values together.
The analysis of spot electricity prices dependency with bivariate copulas may also be extended to a
study of grouped spot electricity prices data, using copulas of higher dimension. In addition, the
copula analysis may be extended to different time periods and can be used to explore the seasonality

Stochastic dependencies of spot prices in the European electricity markets
86
of electricity prices. In this relation, it will be of interest to analyse the range of variation of the
copula’s dependency parameter as a consequence of seasonality.
In the present study has been analysed a biannual period of historical data, for which each copula
has been characterized by a time-invariant dependency parameter alpha. However, dependency
between the electricity prices is not time-invariant. Therefore, it will of interest to use copulas for
forecasting, assuming different patterns (a regime-switching approach) of the variation of the
copula’s dependency parameter.

Stochastic dependencies of spot prices in the European electricity markets
87
ABBREVIATIONS
ATSOI Association of the Transmission System Operators of Ireland
BALTSO Baltic Transmission System Operators
BRP Balance Responsible Party
DAM Day Ahead Market
DSO Distribution System Operator
EC European Community
ENTSO-E European Network of Transmission System Operators for Electricity
EU European Union
MCP Marginal Clearing Price
nTPA - negotiated third party access
OTC Over the Counter
PAB Pay as Bid
PX Power Exchange
rTPA - regulated third party access
SO System Operator
TSO Transmission System Operator
UCTE Union for the Coordination of the Transmission of Electricity
UKTSOA UK Transmission System Operators Association
APPENDIX 1: INTERNET SITES OF THE REVIEWED POWER EXCHANGES
http://www.exaa.at
http://www.eex.com
http://www.omel.com
http://www.Nord Poolspot.com
http://www.mercatoelettrico.org
http://www.belpex.be
http://www.powernext.fr

Stochastic dependencies of spot prices in the European electricity markets
88
APPENDIX 2 BIVARIATE CLAYTON COPULA APPLIED TO TEN HOURLY SPOT ELECTRICITY PRICES
DATASET PAIRS
Figure A: Bivariate scatter plots of the historical spot prices [EUR/MWh] with marginal distributions
histograms

Stochastic dependencies of spot prices in the European electricity markets
89
Figure B: Clayton copula for the historical datasets

Stochastic dependencies of spot prices in the European electricity markets
90

Stochastic dependencies of spot prices in the European electricity markets
91
Figure C: Perspective plot (left) and contour plot (right) of the probability density function of the
Clayton copula, applied to the historical datasets

Stochastic dependencies of spot prices in the European electricity markets
92

Stochastic dependencies of spot prices in the European electricity markets
93

Stochastic dependencies of spot prices in the European electricity markets
94
Figure D: Perspective plot (left) and contour plot (right) of the cumulative distribution function of the
Clayton copula, applied to the historical datasets

Stochastic dependencies of spot prices in the European electricity markets
95

Stochastic dependencies of spot prices in the European electricity markets
96

Stochastic dependencies of spot prices in the European electricity markets
97

Stochastic dependencies of spot prices in the European electricity markets
98
REFERENCES
Adamec, M., M. Indráková, and M. Karajica, 2008. The European Electricity Market and Cross-
Border Transmission, Acta Polytechnica, Volume 48, Number. 3. Alexander, Carol, 2001. Market Models: A Guide to Financial Data Analysis. New Jersey, John
Wiley & Sons. Alvárez-Ramírez, J., R. Escarela-Pérez, G. Espinosa-Pérez and R. Urrea,,2009 ,Dynamics of
electricity market correlations, Physica A: Statistical Mechanics and its Applications Volume 388, Issue 11, , pp 2173-2188.
Ausubel, L. M. and P. Milgrom, 2006. The Lovely but Lonely Vickrey Auction, Chapter 1 of Combinatorial Auctions, P. Cramton, Y. Shoham, and R. Steinberg, eds., Cambridge: MIT Press., pp. 17-40.
AEEG, 2008. Report to the European Commission on regulatory activities and the state of services in the electricity and gas sectors, available at: http://www.energy- regulators.eu.
Belmans, R. and L. Meeus, 2007. Is the prevailing wholesale market design in Europe and North America comparable?, IEEE Power Engineering Society General Meeting, Tampa, Florida USA, 24-28 June, 2007.
Blöchlinger, L., 2008. Power Prices – A Regime-Switching Spot/Forward Price Model with Kim Filter Estimation, dissertation 3442 of St. Gallen University.
Bouyé, E., V. Durrleman, A. Nikeghbali, G. Riboulet, and T. Roncalli, 2000. Copulas for Finance - A Reading Guide and Some Applications, available at SSRN: http://ssrn.com/abstract=1032533.
Bouyé, E. and M. Salmon, 2008. Measuring the Dependence between Non-Gaussian Financial Assets Using Copulae: Risk Management, Option Pricing and Default Risk, available at SSRN: http://ssrn.com/abstract=1272345.
Carbajo Josa, D. A., REE, 19 Septiembre 2007, Gestión interconexión Portugal-España, Hacia un Mercado Ibérico de Energía, Madrid, Comisión Nacional de Energía.
CER, 2008. Regulators’ Annual Report To The European Commission For Energy Regulation, available at: http://www.energy- regulators.eu.
CNE, 2008. Spanish regulator’s annual report to the European commission, available at: http://www.energy- regulators.eu.
Colella, W., 2002. Implications of electricity liberalization for combined heat and power (CHP) fuel cell systems (FCSs): a case study of the United Kingdom, Journal of Power Sources 106, pp. 397–404.
COM/2004/863, Technical Annexes to the Report from the Commission on the Implementation of the Gas and Electricity Internal Market, available at: http://ec.europa.eu/energy/gas_electricity.
COM/2009/115, Report on Progress in Creating the Internal Gas and Electricity Market Technical Annex to the Communication from the Commission to the Council and the European Parliament, available at: http://ec.europa.eu/energy/gas_electricity/benchmarking_reports_en.htm.
Commission de Regulation de l’Energie, 2008. Report sent to the DG TREN, available at: http://www.energy- regulators.eu.
Cramton, P. and S. Stoft, 2006. Why We Need to Stick with Uniform-Price Auctions in Electricity Markets, The Electricity Journal, Volume 20, Issue 1, pp. 26-37.
Decreto del Presidente del Consiglio dei Ministri 11 maggio 2004, Criteri, modalita' e condizioni per l'unificazione della proprieta' e della gestione della rete elettrica nazionale di trasmissione, Gazzetta Ufficiale N. 115 del 18 Maggio 2004.
Denton, M. J., S. J. Rassenti, and V. L. Smith, 2001. Spot market mechanism design and competitivity issues in electric power, Journal of Economic Behavior & Organization, 44(4): pp. 435-453.
Deheuvels, P., 1978. Caracterisation complete des lois extremes multivariees et de la convergence des types extremes, Publ Inst Statist Univ Paris 23, pp. 1-37.
Devroye, L.,1986. Non-Uniform Random Variate Generation, Springer.

Stochastic dependencies of spot prices in the European electricity markets
99
Directive 96/92/EC of the European Parliament and of the Council of 19 december 1996 concerning common rules for the internal market in electricity.
Directive 2003/54/EC of the European Parliament and of the Council of 26 June 2003 concerning common rules for the internal market in electricity and repealing Directive 96/92/EC.
Directive 3648/09, concerning common rules for the internal market in electricity and repealing Directive 2003/54/EC.
Durbin, J. and A. Stuart, 1951. Inversions and rank correlations, J. Roy. Statist. Soc., Series B, 2, pp. 303–309.
ECORYS Nederland BV, 2008. Review and analysis of EU wholesale energy Markets, Historical and current data analysis of EU wholesale electricity, gas and CO2 markets, available at: http://ec.europa.eu/energy/gas_electricity/studies/electricity_en.htm.
EEX, Powernext, 2008 Kooperation EEX-Powernext: Zukunftsweisender Schritt auf dem Weg zum europäischen Strommarkt, available at: http://www.eex.com.
EEX, Trading conditions, 2008, available at: http://www.eex.com. EEX, Introduction to exchange trading at EEX, 2008 (a), available at: http://www.eex.com. EEX, 2009. The products of EEX Group, available at: http://www.eex.com. EFET, 2005. The Past and Future of European Energy Trading, available at:
http://www.efet.org/Download.asp?file=17. EirGrid and SONI, 2007. All Island Market for Electricity – Training Session Physical Market
Processes. Embrechts, P., A. J. McNeil, and D. Straumann, 1999. Correlation: Pitfalls and Alternatives.
Departement Mathematik, ETH Zentrum. Embrechts, P., A. J. McNeil, and R. Frey, 2001. Quantitative Risk Management: Concepts,
Techniques and Tools, Princeton University Press. ETSO, EuroPEX, 2009. Development and Implementation of a Coordinated Model for Regional and
Inter-Regional Congestion Management, available at: http://www.entsoe.eu/_library/publications/ etso/ETSO-EuroPEX%20report-25-02-09.pdf. European Commission, Directorate-General for Energy and Transport, 2009. EU energy and
transport in figures, Statistical pocketbook 2009. EurActiv, 04/10/2005, updated: 07/07/2009. Liberalising the EU energy sector. EurActiv, 25/01/2008. Regulators doubtful over EU energy agency. EurActiv, 01/02/2008. Eight EU states oppose unbundling, table 'third way'. EurActiv, 13/03/2008. EU Electricity Market Liberalisation. EurActiv, 25/03/2009. EU strikes deal on energy market liberalization. EXAA, 2007. Rules for the trading in spot market products for electric power on Wiener börse in
its function as a general commodity exchange - trading rules spot market products electric power, available at: http://www.exaa.at.
EXAA, 2009. Energy Exchange Austria, available at: http://www.exaa.at. Fabra, N., C. Crampes, 2004. The Spanish Electricity Industry: Plus ça chang..., available at:
http://www.hks.harvard.edu/hepg/Papers/Crampes.and.Fabra.spanish.elec.industry.1104.pdf. Fabra, N., N.-H. von der Fehr, and D. Harbord, 2002. Modeling electricity auctions, The Electricity
Journal, Volume 15, Issue 7, pp. 72-81. Ferraria, A., Monica Giulietti, 2005. Competition in electricity markets: international experience
and the case of Italy, Utilities Policy, Volume 13, Issue 3, pp. 247-255. Frontier Economics Ltd., Consentec (Consulting für Energiewirtschaft und technik GmbH),
Institute of Power Systems and Power Economics (IAEW) of Aachen University of Technology (RWTH Aachen), 2004. Analysis of Cross-Border Congestion Management Methods for the EU Electricity Market, available at: http://ec.europa.eu/energy/electricity/publications.
Furió, D., J. J. Lucia, Congestion management rules and trading strategies in the Spanish electricity market, 2008, Energy Economics, Volume 31, Issue 1, pp. 48-60.
Geman, H. 2005. Commodities and Commodity Derivatives. Modeling and Pricing for Agriculturals, Metals and Energy. John Wiley & Sons Ltd.

Stochastic dependencies of spot prices in the European electricity markets
100
Galambos, J., 1978. The Asymptotic Theory of Extreme Order Statistics, Wiley, New York. Genest, C. and MacKay, J., 1986. The joy of copulas: bivariate distributions with uniform
marginals, Amer. Statist., 40, pp. 280–283. Genest, C. and P. Capéraà, 1993. Spearman's rho is larger than Kendall's tau for positively
dependent random variables. Journal of Nonparametric Statistics, Issue 2, pp. 183-194. Genest, C. and B. Rémillard, 2008 (a), Validity of the parametric bootstrap for goodness-of-fit
testing in semiparametric models, Annales de l'Institut Henri Poincaré: Probabilités et statistiques, 44, pp. 1096-1127.
Genest, C., V.Grégoire, and Michel Gendron, 2008 (b). Using copulas to model price dependence in energy markets. Energy risk, Volume 5, pp. 58-64.
Genest, C., B. Rémillard, and D. Beaudoin, 2009. Goodness-of-fit tests for copulas: A review and a power study. Insurance: Mathematics and Economics, Issue 44, pp. 199-213.
GME, 2004. GME’s Electricity Market: Purposes, Organisation and Operation, available at: http://www.mercatoelettrico.org/En/MenuBiblioteca/Documenti/20041027ElectricityMarketManual.pdf.
GME, 2008. Why introducing implicit auctions in the Central South region? Potential gains from improving allocation methods of day-ahead cross border capacity, available at: http://www2.e-control.at/portal/page/portal/EER_HOME/EER_INITIATIVES/ERI
GME, 2008 a. Relazione annuale, available at: http://www.mercatoelettrico.org González, J. J., 2008. Importance of intraday and adjustment markets, APEX Conference Sydney,
13 October, 2008, available at: http://www.theapex.org/World_markets_situation_08.htm. Lucia, J. J. and E. Schwartz, 2000. Electricity prices and power derivatives: Evidence from the
Nordic Power Exchange. Finance, available at: http://repositories.cdlib.org/anderson/fin/16_00. Hobbs, B., M. Rothkopf, L. Hyde, and R. O’Neall, 2000. Evaluation of a truthful revelation auction
in the context of energy markets with nonconcave benefits, Journal of Regulatory Economics; Volume 18, Number 1.
Hofbauer, I., 2006, Liberalisation, privatisation and regulation in the Austrian electricity sector, FORBA Research Report 16.
Huidobro y Arreba. M. L., Presentación sobre el mercado ibérico, 19 Septiembre 2007, Hacia un mercado ibérico de energía, Madrid, Comisión Nacional de Energía.
Huisman, R., and R. Mahieu, 2003. Regime jumps in electricity prices, Energy Economics, Volume 25, Issue 5, pp. 425-434.
Kahn, A. E., P. C. Cramton, R. H. Porter, and R. D. Tabors, 2001. Uniform Pricing or Pay-as-Bid Pricing: A Dilemma for California and Beyond, The Electricity Journal, Volume 14, Issue 6, pp. 70-79.
Kaishev, V., D. Dimitrova, and S. Haberman, 2007. Modelling the joint distribution of competing risks survival times using copula functions. Insurance: Mathematics and Economics, issue 41, pp. 339–361.
Knittel, C.R. and M. R. Roberts, 2001 An empirical explanation of deregulated electricity prices., University of California Energy Institute.
Lancaster, H.O., 1982. Dependence, measures and indices of. In Encyclopedia of Statistical Sciences, 2, S.Kotz and N.L. Johnson, editors, John Wiley & Sons, New York, pp. 334-339.
Lutkepohl, Helmut and Markus Kratzig, eds. Applied Time Series Econometrics. Cambridge: Cambridge University Press, 2004.
McGoldrick, S., 2008. SEM experience to date and the impacts for the future. , APEX Conference Sydney, 13 October, 2008, available at: http://www.theapex.org/World_markets_situation_08.htm.
Madlener, R. and M. Kaufmann, 2002. Power exchange spot market trading in Europe: theoretical considerations and empirical evidence, OSCOGEN, paper 5.1b.
Mavrou, V., 2006, Modeling the dynamics of electricity prices, Master of Advanced Studies In Finance, ETH Zurich and University of Zurich.
Meeus, L., K. Purchala, R.Belmans, 2005. Development of the internal electricity market in Europe, Invited paper at the Conference of Regulation, Firenze, Italy, June 12-13, 2005.
Meeus, L.,2006. Power exchange auction trading platform design, PhD. Dissertation.

Stochastic dependencies of spot prices in the European electricity markets
101
Merlin, A., 2007, Trilateral Market Coupling France, Belgium and the Netherlands: a successful cooperation, Technical Press Briefing - Résidence Palace, Brussels - 14 February 2007.
Natalia Fabra, 2005. An Overview of the Spanish Electricity Industry, available at: http://www.eco.uc3m.es/nfabra/Docencia/Seminarios/Spain_Electricity.pdf.
Nelsen, R.B., 1991. Copulas and association. Advances in Probability Distributions with Given Marginals. Kluwer Academic Publishers, Dordrecht, pp. 51–74.
Nelsen, R. B., 2006, An introduction to copulas, Springer. Nicolaisen, J., V. Petrov, and L. Tesfatsion, 2001. Market power and efficiency in a computational
electricity market with discriminatory double-auction pricing. IEEE Transactions on, Volume 5, Number 5, pp. 504-523.
Nord Pool , 2008. Nord Pool – the Nordic power exchange, Group Market Report, available at: http://www.NordPoolspot.com.
Ockenfels, A., V. Grimm, G. Zoettl, English translation of the report: Preisbildungsmechanismus im Auktionsverfahren für Stromstundenkontrakte an der EEX, 2008, available at: http://www.eex.com/en/document/38615/gutachten_eex_ockenfels_e.pdf.
Ofgem, 2008. National Report to the European Commission, available at: http://www.energy- regulators.eu.
Omel, 2008. Electricity market, available at: http://www.omel.com. Orden ITC/843/2007, de 28 de marzo, por la que se modifica la Orden ITC/4112/2005, de 30 de
diciembre, por la que se establece el régimen aplicable para la realización de intercambios intracomunitarios e internacionales de energía eléctrica.
Pilipovic, D., 2007. Energy risk. Valuing and Managing Energy Derivatives, McGraw-Hill. Pollitt, M., 2009, Evaluating the evidence on electricity reform: Lessons for the South East Europe
(SEE) market, Utilities Policy, Volume 17, Issue 1, pp. 13-23. Prandini, A., 2007. Good, BETTA, best? The role of industry structure in electricity reform in
Scotland, Energy Policy, Issue 35, pp. 1628–1642. Rachev, S. T., M. Bierbrauer, C. Menn, and S.Trück, 2007. Journal of Banking and Finance, Volume
31, Issue 11, pp. 3462-3485. Regulation 1228/2003 of the European Parliament and of the Council of 26 June 2003 on
conditions for access to the network for cross-border exchanges in electricity. RED, Gestión interconexión Portugal-España, 2007, available at:
http://www.cne.es/cne/doc/mibel/01%20REE%20Jornadas%20MIBEL-Interconexiones.ppt. PJM, 2008, Annual Report 2008, available at: http://www.pjm.com Roggenkamp, M., Boisseleau F. H.A.R., 2005. The Regulation of Power Exchanges in Europe,
Intersentia Publishing. Scarsini, M., 1984. On measures of concordance, Stochastica, Number 8, pp. 201–218. Schindlmayr, G., M. Burger and B. Graeber, 2007. Managing energy risk, John Wiley & Sons Ltd. Schweizer, B., E.F. Wolff, 1981. On nonparametric measures of dependence for random variables,
Annals of Statistics, Volume 9, Number 4, pp. 879-885. SEC/2007/1179. EC Document. Commission Staff Working Document, accompanying the
legislative package on the internal market for electricity and gas. Impact Assessment. SEM, 2007. Trading and Settlement Code, available at:
http://www.allislandproject.org/GetAttachment.aspx?id=8a1bed9e-1b63-4280-b754-b6c1726ce373. Sewalt, M. and C. de Jong, 2003. Negative Prices in Electricity Markets. Commodities Now. Sioshansi, F. P., 2008. Competitive Electricity Markets: Design, Implementation, Performance.
Elsevier. Tankov, P. and T. Meyer-Brandis, 2008. Multi-Factor Jump-Diffusion Models Of Electricity Prices,
International Journal of Theoretical and Applied Finance (IJTAF), World Scientific Publishing Co. Pte. Ltd., volume 11(05), pp. 503-528.
Thoresen, J. V., 2005, The Nordic power market zonal pricing, available at: http://www.theapex.org/Apex05_3.htm.

Stochastic dependencies of spot prices in the European electricity markets
102
Tractebel Engineering, 2009. Study of the interactions and dependencies of Balancing Markets, Intraday Trade and Automatically Activated Reserves, available at: http://ec.europa.eu/energy/gas_electricity/studies/electricity_en.htm.
Trivedi, P. K. and D. M. Zimmer, 2005. Copula Modeling: An Introduction for Practitioners. Foundations and Trends in Econometrics, Vol. 1, Number 1, pp. 1–111.
UCTE, 2007. Statistical Yearbook. Uritskaya, O. and A. Serletis, 2008. Quantifying multiscale inefficiency in electricity markets,
Energy Econ. 30, pp. 3109–3117. Vandezande L., M. Saguan, L. Meeus, J. M. Glachant, R. Belmans, 2008. Assessment of the
implementation of cross-border balancing trade between Belgium and the Netherlands, 6th International Conference on The European Electricity Market EEM09, Leuven.
von Rintelen, W., 2008, Presentation “Harmonisation within a merger of two spot power exchanges - Experiences by EEX and Powernext”, APEX conference, 13 October 2008.
Vázquez, C., M. Rivier, and I. Pérez-Arriaga, 2001. If Pay-as-Bid Auctions Are Not a Solution for California, then Why Not a Reliability Market? The Electricity Journal Volume 14, Issue 4, pp. 41-48.
Vecchiato, W., U. Cherubini and E. Luciano, 2004. Copula Methods in Finance, John Wiley & Sons Ltd.
Zimmermann, C., 2007. Expanded Use of Implicit Auctioning for Congestion Management in Europe. Oil, Gas, Energy Law Intelligence, Issue 4.
Zimmermann, C., 2007 a. Presentation “Expanded Use of Implicit Auctioning for Congestion Management in Europe”, available at: http://www.elrf.org/Charles_Zimmermann.ppt.
Wang, X.J., and H. Yin, 2004. An incentive compatible double auction mechanism in electricity market. Automation of Power Systems Volume 28, Issue 18, pp. 7–15.
Wang, Z., and J. T. Cuddington, 2006. Assessing the degree of spot market integration for U.S. natural gas: evidence from daily price data. Journal of Regulatory Economics, pp. 195–210.
Weron, R., I. Simonsen, and M. Birger, 2004. Structure and stylized facts of a deregulated power market, available at: http://mpra.ub.uni-muenchen.de/1443/.
Zou, X., 2009. Double-sided auction mechanism design in electricity based on maximizing social welfare, Energy Policy (in press).

Stochastic dependencies of spot prices in the European electricity markets
103
Declaration of authorship
" I hereby declare
- that I have written this thesis without any help from others and without the use of documents and
aids other than those stated above,
- that I have mentioned all used sources and that I have cited them correctly according to established
academic citation rules."
St. Gallen, November 2009 Iva Mihaylova