Embed Size (px)
Citation preview

Jim Dai School of ORIE, Cornell University
(on leave from Georgia Institute of Technology)
Stochastic Network Models for Hospital Inpatient Flow Management
1

2

Team members
3
� Georgia Tech � Pengyi Shi
� University of International Business & Economics, Beijing � Ding Ding
� National University of Singapore (NUS) � Jame Ang, Mabel Chou
� National University Hospital (NUH) � Jin Xin, Joe Sim

Outline
4
� Part 1: Empirical observations � Part 2: Stochastic network models � Part 3: Two-time-scale framework � Part 4: Managerial insights & future research

Empirical observation at NUH � Average queue length curve over 547 days
� # of patients who are waiting for inpatient beds from the emergency department (ED)
� Can we build a model and find methods to predict the curve?
5 0 1 2 3 4 5 6 7 8 9 10 11 12 13 14 15 16 17 18 19 20 21 22 23 240
2
4
6
8
10
12
14
16
18
Time
Avera
ge qu
eue l
ength

Waiting time statistics: Period 1 Average waiting time
0 1 2 3 4 5 6 7 8 9 10 11 12 13 14 15 16 17 18 19 20 21 22 23 241
1.5
2
2.5
3
3.5
4
4.5
5
5.5
6
Bed request time
Aver
age
waitin
g (h
our)
0 1 2 3 4 5 6 7 8 9 10 11 12 13 14 15 16 17 18 19 20 21 22 23 240
5
10
15
20
25
30
35
40
Bed request time
6−ho
ur s
ervic
e le
vel (
%)
6
Fraction of patients who wait at least 6 hours
Can we flatten the curve?

Part 2: Stochastic network models
7
� Time-varying queues � Massey (1981), non-stationary queues � Whitt (1991) � Green-Kolesar (1991, 1997) � Massey, Mandelbaum and Reiman (1998) � Feldman-Mandelbaum-Massey-Whitt (2008), “Staffing of Time-
Varying Queues to Achieve Time-Stable Performance.” � Liu-Whitt (2011,2012) � framework Mt/GI/N

A new stochastic network model � Multi-server pools serving multi-class customers
8
EL
ED-GW ICU-GW
Neuro Renal Gastro Surg Card Ortho
Onco Gen-Med
Respi
Gen-Med
Neuro
Surg
Ortho
Surg
Card
Respi
Surg
Overflow I Overflow II Overflow III
…
9 buīers …
9 buīers
…
9 buīers
SDA
…
9 buīers

New features � Endogenous service times � Allocation delays � Overflow trigger times � Missing any one of these features makes the model less relevant
9

0 2 4 6 8 10 12 14 16 18 20 0%
5%
10%
15%
20%
25%
LOS distributionlog−normal
Endogenous service times Service time = Discharge time – Admission time = LOS + Dis hour – Adm hour
Length-of-stay (LOS) = number of nights in hospital � LOS distribution � Average is ~ 5 days; admission source and medical specialty dependent
10
6 7 8 9 10 11 12 13 14 15 16 17 18 19 20 21 22 23 240
0.05
0.1
0.15
0.2
0.25
0.3
Discharge Time
Rel
ativ
e Fr
eque
ncy
Period 1Period 2

Checking the service time model
(a) Empirical (b) Simulation output
11
0 1 2 3 4 5 6 7 8 9 10 11 12 13 14 15 16 17 18 19 200
0.005
0.01
0.015
0.02
0.025
Days
Rel
ativ
e fre
quen
cy
0 1 2 3 4 5 6 7 8 9 10 11 12 13 14 15 16 17 18 19 200
0.005
0.01
0.015
0.02
0.025
Days
Rel
ativ
e fre
quen
cy

Allocation delays � Getting a bed is a process
� Pre-allocation delay � Bed management unit searches/negotiates for beds
� Post-allocation delay � Delays in ED discharge � Delays in transportation � Delays in ward admission
� In our model: each patient experiences a random delay T after a bed is allocated to her
12

Overflow trigger times � Wards usually accept patients from primary specialties
EL
ED-GW ICU-GW
Neuro Renal Gastro Surg Card Ortho
Onco Gen-Med
Respi
Gen-Med
Neuro
Surg
Ortho
Surg
Card
Respi
Surg
Overflow I Overflow II Overflow III
…
9 buīers …
9 buīers
…
9 buīers
SDA
…
9 buīers
13

Entire hospital runs in the QED regime � Quality- and Efficiency-Driven (QED) regime
� Waiting time is a small fraction of service time � Average waiting time = 2.8 hours = 1/43 average LOS
� Typical bed occupancy rate is 86% ~ 93%
� Multi-server pools with certain flexibility
� 30 ~ 60 servers in each pool � 15 server pools (500-600 servers)
� Trade-off between waiting time and overflow fraction
14

Part 3: Two-time-scale framework
15
� Discrete-time queues � The LOS and daily arrival rate determine , the midnight
customer count, and thus determine the daily performance
� Time-varying performance � The arrival rate pattern and discharge timing determine the time-
of-day behavior
{Xk}

A simplified single-pool model
16
� A single-pool model with N servers � Arrival is periodic Poisson with rate function and period of 1 day � LOS follow a geometric distribution with mean � Discharge times follow a discrete distribution � Allocation delay
� Service times follow the non-iid model � Performance measure: steady-state, mean queue length curve for
m�(t)
E[Q(t)] 0 t < 1

Step 1: daily customer count � denotes the number of customers at midnight of day
� Discrete time queue
� Number of discharges only depends on and independent coin tosses since � LOS is geometric � LOS starts from 1 (no same-day discharge)
� Number of arrivals is a Poisson random variable � Independent of number of discharges
� is a discrete time Markov chain (DTMC) � Stationary distribution can be solved numerically
17
Xk
Xk+1 = Xk �Dk +Ak
Ak
{Xk}⇡
Dk Xk
k
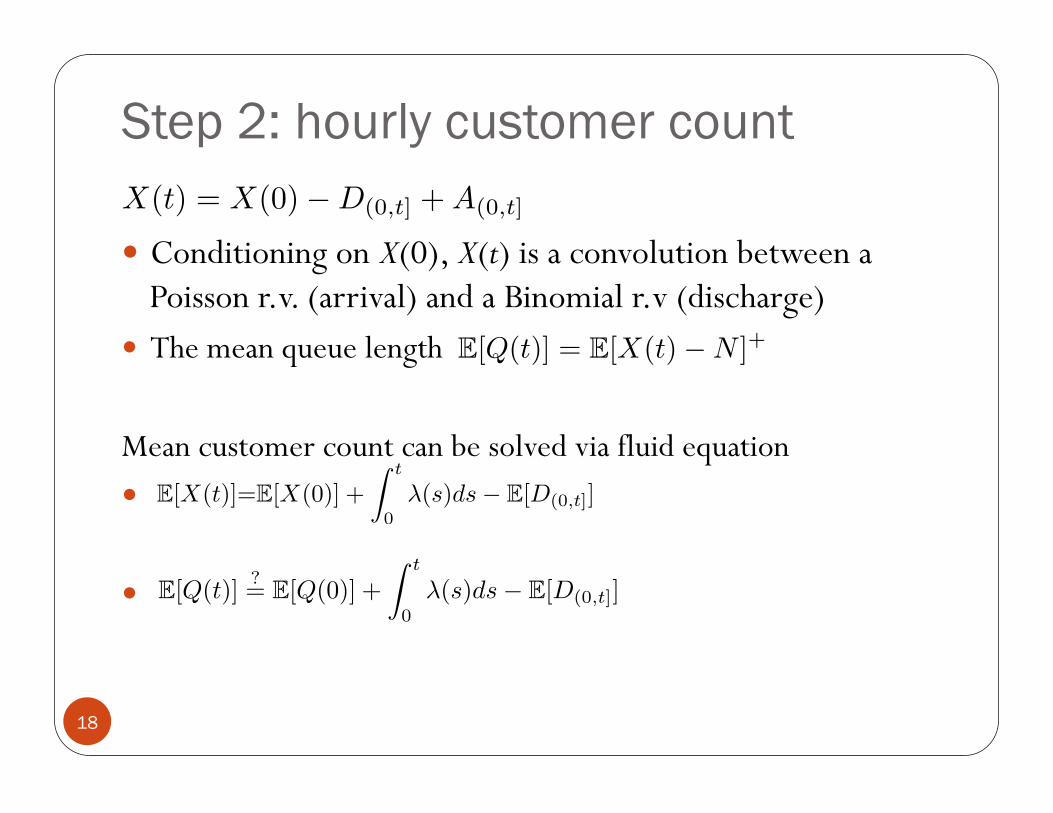
Step 2: hourly customer count � Conditioning on X(0), X(t) is a convolution between a
Poisson r.v. (arrival) and a Binomial r.v (discharge) � The mean queue length
Mean customer count can be solved via fluid equation �
�
18
X(t) = X(0)�D(0,t] +A(0,t]
E[Q(t)] = E[X(t)�N ]+
E[Q(t)]?= E[Q(0)] +
Z t
0�(s)ds� E[D(0,t]]
E[X(t)]=E[X(0)] +
Z t
0�(s)ds� E[D(0,t]]

Related work � M. Ramakrishnan, D. Sier, P. Taylor (2005), “A two-time-scale model for
hospital patient flow”, IMA Journal of Management Mathematics. � ED evolves in a much faster time scale than wards.
� A. Mandelbaum, P. Momcilovic, Y. Tseytlin (2012), “On Fair Routing from Emergency Departments to Hospital Wards: QED Queues with Heterogeneous Servers”, Management Science. � Two time scales: service times are in days; waiting times are in hours.
� E. S. Powell et al. (2012), “The relationship between inpatient discharge timing and emergency department boarding”, The Journal of Emergency Medicine � Affiliations: Department of Emergency Medicine, Northwestern University;
Harvard Affiliated Emergency Medicine Residency, Brigham and Women’s Hospital–Massachusetts General Hospital, …
19

Numerical results � Alloc delays follow a log-normal distribution
� Mean alloc delay is 2.5 hours, CV=1
� Discrete discharge distribution from NUH period 1 data � N=525; m=5.3;
20
⇤ = 90.95
0"
2"
4"
6"
8"
10"
12"
14"
16"
1" 2" 3" 4" 5" 6" 7" 8" 9" 10" 11" 12" 13" 14" 15" 16" 17" 18" 19" 20" 21" 22" 23" 24"
numerical" empirical"

Queue length curve from the FULL hospital model (Period 1)
21

queues fail to capture � Simulation results from an system
avg waiting time avg queue length
22
0 1 2 3 4 5 6 7 8 9 10 11 12 13 14 15 16 17 18 19 20 21 22 23 240
0.5
1
1.5
2
2.5
3
3.5
4
4.5
5
5.5
Bed request time
Aver
age
wai
ting
(hou
r)
SimulationEmpirical
0 1 2 3 4 5 6 7 8 9 10 11 12 13 14 15 16 17 18 19 20 21 22 23 240
2
4
6
8
10
12
14
16
18
Time
Aver
age
queu
e le
ngth
SimulationEmpirical
Mt/GI/N
Mperi/lognormal/N

Part 4: Insights & challenges
23

Aggressive early discharge policy
24
0%#
5%#
10%#
15%#
20%#
25%#
30%#
1# 2# 3# 4# 5# 6# 7# 8# 9# 10# 11# 12# 13# 14# 15# 16# 17# 18# 19# 20# 21# 22# 23# 24#
Discha
rge*distrib
u/on
*
NUH#per#1# NUH#per#2# aggressive#early#dis#

Insights from the simplified model
25
� Impact of discharge policy � Steady-state, time-of-day mean waiting time
2"
2.2"
2.4"
2.6"
2.8"
3"
3.2"
3.4"
1" 2" 3" 4" 5" 6" 7" 8" 9" 10" 11" 12" 13" 14" 15" 16" 17" 18" 19" 20" 21" 22" 23" 24"
Wai$n
g'$m
e'(hou
r)'
NUH"per"1" NUH"per"2" aggressive"early"dis"

Simulation results � Simulation shows NUH early discharge policy has little improvement
(a) hourly avg. waiting time (b) 6-hour service level
26

Aggressive early discharge + smooth allocation delay
27
� Waiting time performance can be stabilized (a) hourly avg. waiting time (b) 6-hour service level

Challenges
28
� For a multi-pool model with “state”-dependent overflow trigger time, develop an analytical theory for � Performance analysis � Near optimal overflow policy (real time); impossible for
simulation � Optimal capacity allocation among different wards (once every 6
months?); time consuming for simulation � Perry & Whitt (X-model); Pang & Yao (switch-over)
� For a single-pool model, analyze the discrete time queue under � General LOS distribution � Day-of-week model � Matrix analytic method, diffusion approximations

Operational Challenges
29
� Push early discharge � Reduce LOS
� AM- and PM-admissions � Using step-down care facilities

30
Questions?