Embed Size (px)
Citation preview

Stochastic Simulation Framework for a Data Mule Network in the Amazon Delta
by
Rachit Agarwal
A Thesis Presented in Partial Fulfillment of the Requirements for the Degree
Master of Science
Approved July 2015 by the Graduate Supervisory Committee:
Andrea Richa, Chair
Partha Dasgupta Thienne Johnson
ARIZONA STATE UNIVERSITY
August 2015
i
ABSTRACT
This report investigates the improvement in the transmission throughput, when fountain
codes are used in opportunistic data routing, for a proposed delay tolerant network to
connect remote and isolated communities in the Amazon region in Brazil, to the main
city of that area. To extend healthcare facilities to the remote and isolated communities,
on the banks of river Amazon in Brazil, the network [7] utilizes regularly schedules boats
as data mules to carry data from one city to other.
Frequent thunder and rain storms, given state of infrastructure and harsh geographical
terrain; all contribute to increase in chances of massages not getting delivered to intended
destination. These regions have access to medical facilities only through sporadic visits
from medical team from the main city in the region, Belem. The proposed network uses
records for routine clinical examinations such as ultrasounds on pregnant women could
be sent to the doctors in Belem for evaluation.
However, due to the lack of modern communication infrastructure in these communities
and unpredictable boat schedules due to delays and breakdowns, as well as high
transmission failures due to the harsh environment in the region, mandate the design of
robust delay-tolerant routing algorithms. The work presented here incorporates the
unpredictability of the Amazon riverine scenario into the simulation model - accounting
for boat mechanical failure in boats leading to delays/breakdowns, possible decrease in
transmission speed due to rain and individual packet losses.

ii
Extensive simulation results are presented, to evaluate the proposed approach and to
verify that the proposed solution [7] could be used as a viable mode of communication,
given the lack of available options in the region. While the simulation results are focused
on remote healthcare applications in the Brazilian Amazon, we envision that our
approach may also be used for other remote applications, such as distance education, and
other similar scenarios.

iii
ACKNOWLEDGMENTS
First and foremost I wish to thank my advisor, Dr. Andrea Richa, for giving me this great
opportunity to work with her. She has been supportive, generous with her time and
patient with me, since the days I began working on my thesis project. Additionally, I
would like to thank Dr. Alon Efrat and Dr. Thienne Johnson for their interest and help in
my work. I am thankful to Dr. Partha Dasgupta for his willingness to help in any way
necessary.
Every result described in this thesis was accomplished with the help and support of
Mengxue Liu - fellow lab mate and collaborator. She and I worked together on several
different phases of the project.
Finally, I would like to acknowledge my friend Aveesha Sharma, I owe a debt of
gratitude to her for her unconditional help and support during my time here.

iv
TABLE OF CONTENTS
Page
LIST OF TABLES ................................................................................................................. vi
LIST OF FIGURES ............................................................................................................... vii
LIST OF ALGORITHMS .................................................................................................... viii
CHAPTER
1 INTRODUCTION ........................................................................................................ 1
1.1 Main Contributions. ............................................................................................. 3
2 PRELIMINARIES ......................................................................................................... 4
2.1 CoDPON .............................................................................................................. 4
2.2 DTN and Data Mule ............................................................................................ 5
2.3 Robust Routing Protocols .................................................................................... 6
2.3.1 Epidemic Routing ………………………………………………………6
2.3.2 Opportunistic Routing .............................................................................. 7
2.3.3 Robust Routing…………………………………………………………8
2.3.3.1 Fountain Codes ............................................................................. 8
2.3.3.2 Routing with Acknowledgements and Priority Partitions ........... 8
2.4 Fountain Codes .................................................................................................... 8
2.5 Other Related Work ........................................................................................... 11
3 THE ONE SIMULATOR.................. ....................................................................... 12
3.1 Node Capabilities ............................................................................................... 13
3.2 Mobility Modeling ............................................................................................. 14

v
CHAPTER Page
3.2.1 Map Based Mobility Modeling .............................................................. 15
3.3 Routing ............................................................................................................... 16
3.4 Stochastic Process .............................................................................................. 18
4 EXPERIMENTS .................. .................................................................................... 22
4.1 Transmission Affected by Rain ......................................................................... 26
4.2 Transmission Loss ............................................................................................. 27
4.3 Break Down and Delay ...................................................................................... 30
5 CONCLUSION ........................................................................................................ 33
5.1 Future Scope ...................................................................................................... 33
5.1.1 Routing with Acknowledgements .......................................................... 34
REFERENCES...................................................................................................................... 36
APPENDIX
A CODE SNIPPETS ................................................................................................. 39
vi
LIST OF TABLES
Table Page
1. Fixed Simulation Parameters. ………………………………………………….24
2. Variable Simulation Parameters. ........................................................................... 25
3. Parameters Used in Simulations. ........................................................................... 26

vii
LIST OF FIGURES
Figure Page
1. Marajo-Archipelago Map and Boat Routes ............................................................ 4
2. Fountain Codes Data Generation .......................................................................... 10
3. A Snapshot Of Pear Base Stations Holding Stack of Data Packets and Boats .........
Moving Along the River Stream, Transferring Data from One PBS to Other, .........
Till the Time Data Reaches the Final Destination ................................................ 14
4. A Snapshot of Map Incorporated in the Simulator, Showing the River Path, ..........
Placement of Pear Base Stations and Initial Positioning of Boats ........................ 16
5. One Simulator, Representing Boat in Marajo Archipelago, Located in the State ....
of Para, Brazil ........................................................................................................ 22
6. Percentage of Files Successfully Received at Final Destination, for Different ........
Number of Generated Packets with Varying Transmission Loss Probability ..... 26
7. Number of Files Successfully Received at Final Destination, for Different .........
Number of Generated Packets with Varying Transmission Loss Probability ..... 29
8. Percentage of Files Successfully Received at Final Destination, for Different ........
Number of Generated Packets with Varying Transmission Loss Probability and ....
Boats Being Delayed and Broken ......................................................................... 31
9. Number of Files Successfully Received at Final Destination, for Different .............
Number of Generated Packets with Varying Transmission Loss Probability and ....
Boats Being Delayed and Broken .......................................................................... 32

viii
ALGORITHMS
Page
1. The Opportunistic Routing Protocol Implementation. ......................................... 17
2. The Stochastic Process Implementing Transmission Error ................................. 19
3. The Stochastic Process Implementing Reduction in Transmission Speed, Given ..
Harsh/Rainy Weather Conditions. ...................................................................... 19
4. Boat Mechanical Failure Leading to Delay or Hardware Breakdown ................ 20
5. Routing Protocol with Acknowledgements ........................................................ 34

1
CHAPTER 1
INTRODUCTION
For the people residing on along the banks of the Amazon River and its tributaries in
Brazil, boats on river are the only mean to commute. Thus the boats provide an
alternative way to set up an affordable communication channel to the outside world,
given the lack of communication infrastructure in these areas. Thus boats can be used as
data mules to carry messages, using store and forward mechanism, to transmit data from
its origin to the final destination. Considering no strict requirements on delay, and if
communications can bear disconnections, we can build a collaborative network and a
data collection system to mitigate the telecommunication infrastructure problems. A
prototype [6], [7] is under construction at the Laboratory for Research on Alternative
Technologies Related to the Amazon (PETALA), at University of Amazonia (Unama),
Brazil, in partnership with the University of Arizona and Arizona State University, USA.
Mobile Ubiquitous LAN Extension (Data Mule) refers to vehicles moving between
remote areas that effectively create data communication links [22]. These vehicles
usually carry a computer with a storage device and a limited telecommunication module
(usually Wi-Fi). Delay-Tolerant Network (DTN) architecture [5] provides a common
method for interconnecting heterogeneous gateways or proxies that employ store-and-
forward message routing in order to overcome communication disruptions. Data Mule
and DTN technologies are both tolerant to disconnections in the network and are often
complementary.

2
They open doors to integrate hundreds of applications that were not possible before,
mostly due to the high costs, or even infeasibility, of implementing a physical networked
infrastructure in some scenarios.
Located in the Amazon region in northern Brazil, the Marajo archipelago, which occupies
a vast area of 104,142 km2, is an example of a scenario where implementing a networked
infrastructure, if indeed feasible, would impose very high costs that would not scale with
the scarcely distributed population. Only 43% of the entire archipelago’s population of
487, 010 inhabitants lives in urban areas according to the last Brazilian census [11]. Boats
are by far the main method of transportation in the region since there are no bridges
connecting the islands to the mainland, and some cities are even completely built on
water. In these places, socio- infrastructure problems abound, especially health related
problems, as there are few physicians available in the remote communities.
Most medical care in the region is done through sporadic government programs, which
involve the displacement of a medical team from the main city in the region, Belem, to
serve the remote population of the Marajo archipelago, especially in the outlying areas.
An alternative would be to have local nurses or technicians perform routine clinical
examinations, such as ultrasounds on pregnant women, and have the examination records
sent to the doctors in Belem for evaluation. However, due to the lack of modern
communication infrastructure in these communities — e.g. no cellular networks and no
Internet connection — and of fast river transportation, one must fully utilize the regular
ferryboats, with a predefined time schedule of routes and stops at the villages, and
potentially also some of the local fisherman boats, as data mule nodes for timely delivery

3
of healthcare data records (e.g. ultrasound videos, electrocardiogram records) to
physicians in the city for remote analysis. Unpredictable boat delays and breakdowns, as
well as high transmission failures due to the harsh environment in the region, mandate the
design of robust delay- tolerant routing algorithms. The proposed solution incorporates
fountain codes into an opportunistic algorithm, in order to significantly enhance the
robustness/reliability of the routing scheme while incurring just a linear overhead on the
number of packets circulating in the network (rather than the exponential number of
packets incurred by epidemic routing). Fountain codes have been used in the literature to
improve the reliability of many other systems, e.g. [3], [16], [17], [20], [23].
1.1 Main Contributions
The main contribution of this thesis was to incorporate the unpredictability of the
Amazon riverine scenario as a stochastic framework for into our simulation model, by
extending the functionality of the ONE simulator (as explained in Chapter 3). Therefore,
various stochastic algorithms related to boat delays/breakdowns, to possible decrease in
transmission speed due to rain and individual packet losses have been included as
modules into the simulator. We present extensive simulations results to evaluate our
proposed delay tolerant network in such an unpredictable scenario, verifying that the
proposed solution could be used as a viable mode of communication, in the region.

4
CHAPTER 2
PRELIMINARIES
2.1 CoDPON
CoDPON stands for Continuous Displacement Plan Oriented network, which derives
from air traffic control systems. There are two basic types of nodes in a CoDPON
network model: boats and Peer Base Station (PBS). Boats can be seen as data mules since
they can carry a certain amount of data. Using CoDPON we try to model boats and Peer
Base Stations (PBS) on river Amazon in Marajo-archipelago [7], [8]. Data originating at
different PBSs is transferred, to final destination, using boats as data mules. Boats carry
data in form of small data packets while moving through a predefined path, called as
Displacement Plan (DP). When a boat comes in range of another boat or a PBS, a boat
form a connection, and start transferring data based on opportunistic routing mechanism.
Figure 1 presents a picture from Amazon River where boats and PBSs are deployed.
Figure 1: Marajo-Archipelago Map And Boat Routes
5
2.2 DTN And Data Mule
Data mule is defined as a vehicle that physically carries a computer with storage, between
the remote locations having limited connectivity. Thus data mule serves as a
communication link between these terminal points and data is automatically transferred
between a data mule and a terminal point, once a mule reached a terminal. On the other
hand a delay-tolerant network (DTN) is the underling network architecture, employing
data mules and different gateways or terminal points [7]. The data hops from one
terminal to another, using store and forward mechanism, before reaching the final
destination. Despite the long delays involved in receiving the data, large bandwidths are
possible by deploying large memory disks both on data mules and terminal points.
Data mules offer an inexpensive means of data connectivity and thus are prominently
used to set up communication link between remote areas. A computer with a disk and
antennae is mounted on a bus, and as bus stops at different villages on its route data can
be uploaded or downloaded, providing connectivity between the villages on the bus route.
Sensor networks [4, 12, 24] were the first to employ DTN for ground communication.
2.3 Robust Routing Protocols In the Amazon delta, boats are very often delayed and break down. This significantly
affects their displacement plan and connections with other boats and PBSs. Moreover,
due to challenging environmental conditions in the Amazon delta, wireless
communication is often disrupted or slowed down significantly due to rain and mist, as
well as the strong current and tidal waves resulting from the dense vegetation [1]. Hence,
the data packet routing paths, resulting from a general max flow algorithm analysis,

6
might no longer be feasible under such an unpredictable environment. Hence, one needs
to consider alternative approach that would enable the system to be more robust to
frequent changes in the boats displacement plans and any loss in data transmission that
may occur.
2.3.1 Epidemic Routing
On one side of the spectrum would be to utilize epidemic routing [25] as the underlying
routing mechanism. In epidemic routing, every packet of data is replicated and forwarded
at every connection (boat to boat or between boat and PBS). In a system without any
constraints on the capacity of data transmissions, epidemic routing would guarantee
fastest delivery times for every data packet, since the many replicas of a data packet
explore all the possible delivery paths for the given packet.
Given the very high level of replication, epidemic routing is also very robust in capacity
unconstrained systems, since the chance that at least one of the replicas make it to one of
the destination PBSs is high. The problems with epidemic routing appear when there are
limitations on the capacity of the network (i.e., on how much total data the network can
sustain from source to destination nodes), since epidemic routing increases the volume of
traffic in the network exponentially on the number of connections. This phenomenon has
already been verified for the CoDPON network [6], [7].
2.3.2 Opportunistic Routing On the other side of the spectrum is opportunistic routing, which never replicates a data
packet, and which forwards the single original copy of a data packet during a connection
if and only if the data packet could potentially get closer to its destination. More

7
specifically, opportunistic routing translates to our scenario through the following rule: a
boat A will forward a data packet to a boat B if and only if B has a PBS still to be visited
in its displacement plan that is closer to Belem than those still to be visited in the
displacement plan of A (for convenience, we assume that the displacement plan of a PBS
contains only the PBS itself). A boat A may also forward a data packet to a PBS P, when
there is another boat B that will stop by PBS P in the future and whose displacement plan
will get the packet closer to Belem than the displacement plan of A.
As opportunistic routing do not replicate data, there are no issues related to memory
overflow. But at the same time, no replication makes this routing protocol vulnerable to
data loss occurring in the network. As can been seen in Figure 5 and Figure 8
(simulations results presented later in the report for 133 no FC data packets), without
replication, percentage of files successfully reaching the final destination reduces below
5%, even with a small transmission loss probability.
2.3.3 Robust Routing
2.3.3.1 Fountain Codes We propose to incorporate the use of fountain codes (see Section Chapter 2.4) into our
opportunistic algorithm, in order to significantly enhance the robustness/reliability of the
routing scheme while incurring just a linear overhead on the number of packets
circulating in the network (rather than the exponential number of packets incurred by
epidemic routing). Our simulations results in chapter 4 show that fountain codes can
dramatically increase the performance of opportunistic routing under boat and packet
transmission failures, keeping the successful delivery rate of the generated files at the

8
remote communities close to 100% even at high boat delay/breakdown and packet loss
probabilities. Fountain codes have been used in the literature to improve the reliability of
many other systems, e.g. [3], [16], [17], [20], [23].
2.3.3.1 Routing With Acknowledgements And Priority Partitions Some other porches can incorporate acknowledgements or assign priority to partitioned
packets, along with the fountain codes, to make opportunistic routing more robust.
Especially in case of mechanical failure of a boat/data mule may lose all its data packets;
in such a scenario a simple replication, using fountain code, may not be enough to ensure
delivery of data to destination.
2.4 Fountain Codes The original CoDPON model and standard routing algorithms do not handle the situation
where packets can be lost during the transmission. Fountain codes approaches are often
used to tackle the challenge of packet loss and file recovery. Fountain codes are sparse-
graph codes for channels with erasures. Applications arise in the Internet, where files are
partitioned into multiple small packets and each packet is either successfully transferred
or not received at its destination node.
Instead of simply partitioning a file into some number K of packets, fountain codes
generate a total of N>K packets using random functions of the whole file. Once any N'
packets are received successfully, where N' is slightly greater than the original number of
packets K, but smaller than N, the whole file can be recovered. In the fountain code
solution, the server sends out a stream of distinct but multiplexed data, called packets that
can constitute a message, when put together. The server will transmit these packets

9
whenever there are any clients listening in on the session. A client accepts multiplexed
packets from the channel until it obtains exactly N’ packets. In this fountain code
solution, the data can be reconstructed regardless of which multiplexed packets the client
obtains. Therefore, once N’ multiplexed packets have been received the client can
disconnect from the channel. We assume that in this fountain code solution that there is
very little processing required by the server to produce the multiplexed packets and by
the clients to recover the original data from N’ received packets.
Hence fountain codes allow for some of the packets to be dropped without compromising
the integrity of a file. In [13], three basic fountain code approaches are discussed. The
random linear fountain code generates subsets of random K bits and tries to recover the
original file if sufficiently enough packets are received. The number of packets required
to have probability 1-δ of success is K+log2(1/δ). Another approach is given by the LT
codes proposed in [2], where an encoder is used based on a degree distribution that
defines a graph connecting encoded packets to source packets, and a respective decoder is
later used for recovering the original file. The LT codes retain the good performance of
the random linear fountain code and also reduce the encoding and decoding complexities.
A third approach, called Raptor codes [19], concatenates a weakened LT code with an
outer code patching the gaps in the LT code, achieving linear time encoding and
decoding. Other fountain code approaches that involve unequal error protection (UEP)
are discussed in [4], [16]. With UEP, different packets may have different weights and
the redundancies are of different levels, so that more important packets have higher
probability of being delivered.
10
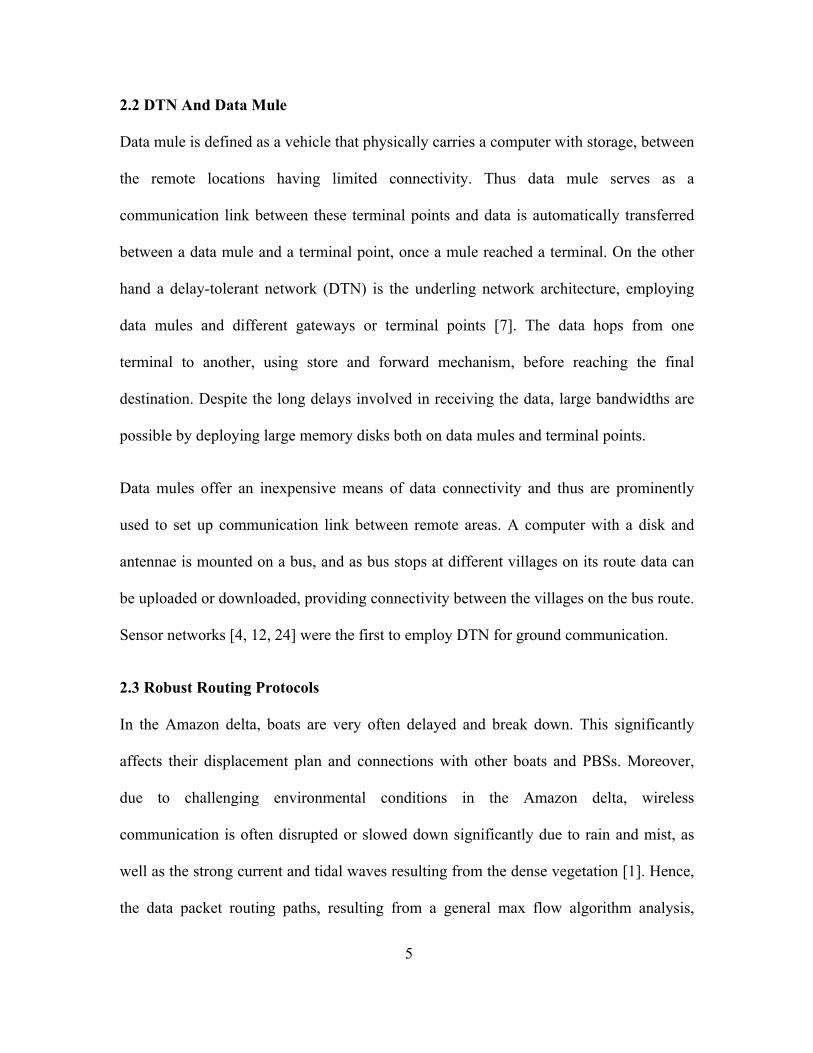
Figure 2: Fountain Codes Data Generation.
We metaphorically describe the stream of multiplexed/encoded packets produced by the
server (PBS) in this idealized solution as a fountain. The fountain has properties similar
to a fountain of water for quenching thirst: drinking a glass of water, irrespective of the
particular drops that fill the glass, quenches one's thirst.
2.5 Other Related Work
Following the success of DTN in terrestrial applications and owing to the low operating
cost, soon DTN became a popular choice to connect remote communities like Daknet
[19]. In another application, DTN were used to connect remote rural villages in India, the
project name MotoPost [18]. The concept was developed to address the communication
and information access needs of the villages [7].

11
Merugu, Ammar and Zegura [21] have considered a routing problem where nodes are
moving and carrying information, and the path between nodes might appear or disappear
at certain times, making traditional mobile ad hoc routing protocols unusable. In the
paper, they proposed a space and time routing framework, constructed a space-time
routing table, which can choose the next hop node from the current and future neighbors
using both arrival time and destination to calculate the next node, aiming at minimizing
the delay time for transferring the information from source to destination.
In [2], the authors proposed a routing algorithm that aims at computing shortest routes
based on a stochastic model of real-life bus traces in an urban network. They use buses as
data carriers to deliver timely data to its final destination, tackling quasi-deterministic
mobility scenarios. Their optimal routing algorithm outperforms other approaches that
aim at minimizing the expected traversal time or at maximizing the delivery probability
in the bus network. They do not consider direct data transmission between data carriers
(buses).

12
CHAPTER 3
THE ONE SIMULATOR
ONE is an agent-based discrete event simulation engine, which updates a number of
modules that implement the main simulation functions at each simulation step. The
detailed description and source code can be found at [26] and the ONE simulator project
page [27]. The main functions of the ONE simulator are the modeling of node
movement, inter-node contacts, routing and message handling. Visualization, reports and
post processing tools are made use of for result collection and analysis.
Movement models implement node movement. These are either synthetic models or
existing movement traces. Connectivity between the nodes is based on their location,
communication range and the bit-rate. Routing modules that decide which messages to
forward over existing contacts implement the routing function. Finally, the messages
themselves are generated through event generators. The messages are always unicast,
having a single source and destination host inside the simulation world.
Report modules generate reports during the simulation run. The simulation results are
collected primarily through these reports. Report modules receive events (e.g., message
or connectivity events) from the simulation engine and generate results based on them.
The results generated may be logs of events that are then further processed by the
external post-processing tools, or they may be aggregate statistics calculated in the
simulator. Secondarily, the graphical user interface (GUI) displays a visualization of the
simulation state showing the locations, active contacts and messages carried by the nodes.

13
3.1 Node Capabilities
The basic agents in the simulator are called nodes. A node models a mobile endpoint
capable of acting as a store-carry-forward router (e.g., in our case boats and pear base
stations with the required hardware). Groups of nodes in a simulation world are used to
build simulation scenarios. Each group is configured with different capabilities and hence
has a set of basic capabilities that are modeled.
These are radio interface, persistent storage, movement, energy consumption and
message routing. Node capabilities that involve only simple modeling, such as such as
the radio interface and persistent storage, are configured through parameterization (e.g.,
communication range, bitrate, peer scanning interval and storage capacity). Specialized
modules that implement a particular behavior for a capability (e.g., different mobility
models) are used to configure more complex capabilities, such as movement and routing.
The list of corresponding parameter values, for our simulation model, can be find in table
I and in table II - present in next chapter.
Modules in each node have access to the node’s basic simulation parameters and state,
including the position, current movement path, and current neighbors. This allows
implementing, e.g., geographic routing and other context-specific algorithms. Also,
modules can make any of their parameters available for other modules in the same node
through an inter module communication bus.
Therefore, the behavior of a movement module can be changed, depending on the
router’s module’s state or a router module can adjust the radio parameters based on the
node inter contact times. The focus of the simulator is on modeling the behavior of store

14
carry-forward networking. Figure 3 shows different boats and PBS represented as nodes,
with capabilities of holding and transmitting data.
Figure 3: A Snapshot Of Pear Base Stations Holding Stack Of Data Packets And Boats
Moving Along The River Stream, Transferring Data From One PBS To Other Till The
Time Data Reaches The Final Destination.
3.2 Mobility Modeling
Mobility models are used to implement node movement capabilities. Mobility models
define the algorithms and rules that generate the node movement paths. Here we follow
map-constrained movement, where every boat has a predefined path, passing through
different PBSs. Similarly PBSs are placed on fixed coordinates with zero movement
capabilities, thus acting as fixed nodes.
For the purpose of refining the real-world mobility, map-based mobility constrains node

15
movement to predefined paths and routes derived from real map data. Also, the simulator
includes a framework for creating movement models as well as interfaces for loading
external movement data. Using the interface we uploaded the Amazon River path,
flowing across the Brazil. Also the data provided from CoDPON project has been used to
place PBSs along with mapping out the boat movement along the river.
3.2.1 Map-Based Mobility To constrain the node movement to paths defined in map data, Map-based movement
models are employed. The simulator contains the map data of the Amazon River in Brazil
(boats and pear base stations) that the map-based movement models can use. Such data is
typically converted from real-world map data or created manually using Geographic
Information System (GIS) programs such as OpenJUMP.
In the simplest map-based model, boats/data mule nodes move from PBS to PBS always
following the paths defined by the map data. Resultant is a random walk of the network
defined by the map data and thus may not be a very accurate approximation of real
human mobility. Thus the nodes have pre-determined routes that they follow, along with
stopping at the PBSs on their path. Also, we numbered PBSs, from left to right, in
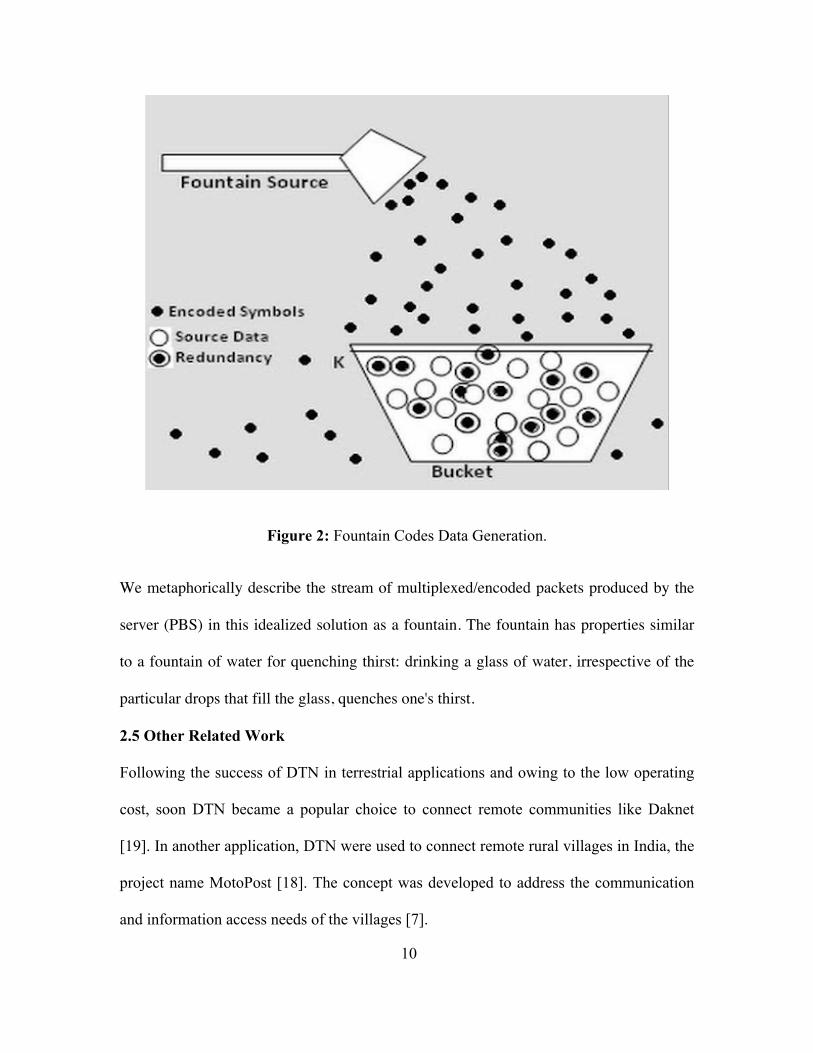
increasing numeric order i.e. from 1 to 13 while boats are named randomly. The Figure 4
shows the snapshot of the map of Amazon River, pear base stations and the initial
placements of boats along the river.
16
Figure 4: A Snapshot Of Map Incorporated In The Simulator, Showing The River Path,
Placement Of Pear Base Stations And Initial Positioning Of Boats.
3.3 Routing
The message routing capability is implemented similar to the movement capability. The
simulator includes a framework for defining the algorithms and rules used in routing
protocols. To evaluate new routing protocols in the ONE simulator, a new routing
module needs to be created for the respective protocol. All routing modules inherit basic
functionality, such as simple buffer management and callbacks for various message-
related events, from the MessageRouter module. The simulator engine for all kinds of
events invokes these callbacks, e.g., when a new message is created or a message is sent
to the node. A router module handles these events and also defines actions to be carried
out at every time step and the behavior when a new node comes into or leaves the nodes
radio range.

17
The basic functionality for all these events is simply re-used for new routing protocols by
extending the ActiveRouter module. This module provides functions for checking if any
of the currently buffered messages are destined to a neighboring node, offering sets of
messages to neighboring nodes, and dealing with successfully transferred and aborted
message transfers, and it implements FIFO and random-ordering buffer management.
For our model we implemented opportunistic routing protocol, a node transmits a
message as soon as its gets an opportunity to push message closer to the destination PBS.
The following algorithm is implemented to incorporate opportunistic routing protocol:
START
IF transmitting NODE is a PBS and receiving NODE is a BOAT
Transfer data packets from the PBS to the BOAT, only if BOAT’s itinerary
has PBSs numbered (name/label) higher than the number (name/label)
transmitting PBS.
IF transmitting NODE is a BOAT and receiving NODE is a PBS
Transfer data packets from the BOAT to the PBS, only if the receiving PBS
has largest numeric label among the PBSs in the BOAT’s itinerary.
IF transmitting NODE is a BOAT and receiving NODE is also a BOAT
COMPARE the largest PBS numeric label present in transmitter BOAT
itinerary with the largest PBS numeric label present in the receiver BOAT

18
itinerary and transfer data only if the receivers BOAT’s PBS label has
higher/greater value.
END
Algorithm 1: The Opportunistic Routing Protocol Implementation
3.4 Stochastic Process
We implemented various probabilistic models, as an extension to the existing movement
model, to incorporate various real world scenarios leading to data loss. Common
occurring phenomenon’s specific to the Amazon River environment are included as a part
of simulator. For example Algorithm 2 is used to implements error in the transmission
channel, Algorithm 3 is used to represent reduction in transmission speed due to
harsh/rainy weather conditions, and finally Algorithm 4 includes the stochastic process
representing the mechanical failure in boats that can possibly affect their schedule or
damage the hardware carrying the data. These different stochastic processes may or may
not occur at the same time; also they are computed independently for each node under
consideration, hence they cannot be classified as global or regional based phenomena.
Hence, in the following work we study their effect mainly under two major scenarios;
first when transmission is only affected by rain and transmission channel errors, and
second when along with rain and transmission channel faults, boats may loose packets
due to mechanical failure.
19
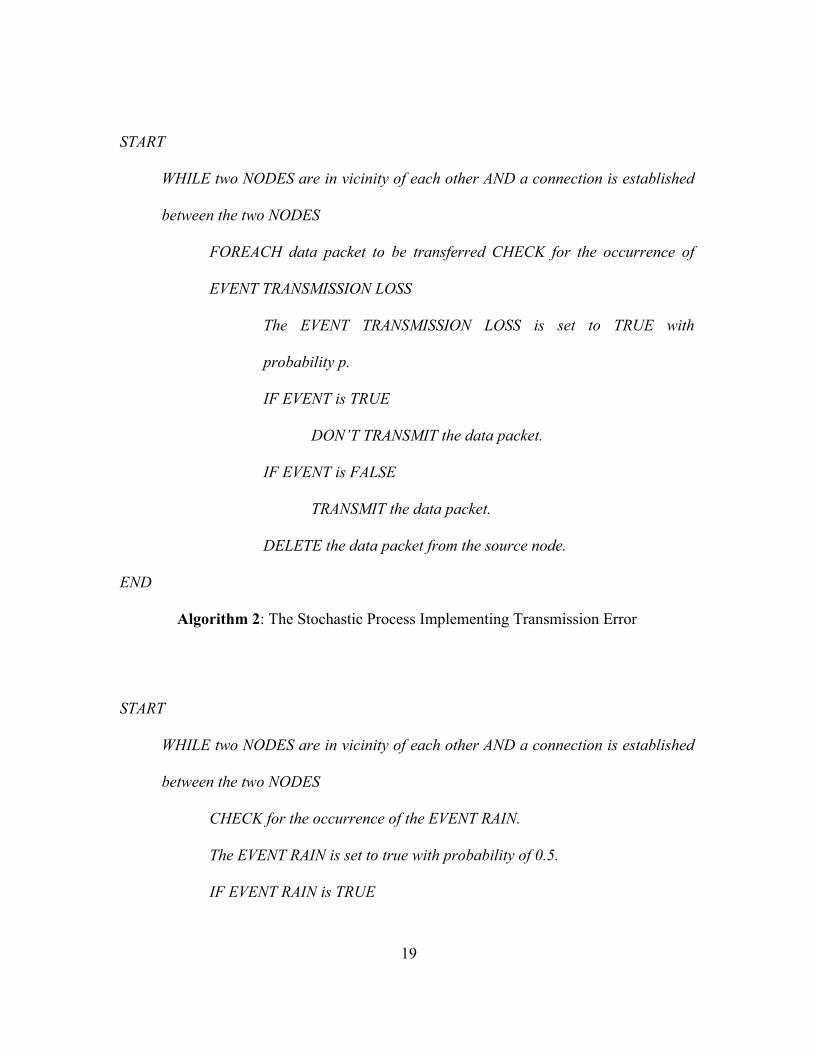
START
WHILE two NODES are in vicinity of each other AND a connection is established
between the two NODES
FOREACH data packet to be transferred CHECK for the occurrence of
EVENT TRANSMISSION LOSS
The EVENT TRANSMISSION LOSS is set to TRUE with
probability p.
IF EVENT is TRUE
DON’T TRANSMIT the data packet.
IF EVENT is FALSE
TRANSMIT the data packet.
DELETE the data packet from the source node.
END
Algorithm 2: The Stochastic Process Implementing Transmission Error
START
WHILE two NODES are in vicinity of each other AND a connection is established
between the two NODES
CHECK for the occurrence of the EVENT RAIN.
The EVENT RAIN is set to true with probability of 0.5.
IF EVENT RAIN is TRUE

20
Reduce the TRANSMISSION SPEED of the established connection
to 30% of the original value.
IF EVENT RAIN is FALSE
Don’t make any change in the TRANSMISSION SPEED.
SET the TRANSMISSION SPEED back to its original value.
END
Algorithm 3: The Stochastic Process Implementing Reduction In Transmission Speed,
Given Harsh/Rainy Weather Conditions.
START
Every time a BOAT reaches a PBS and establishes a connection for data
transmission. Check for the EVENT MECHANICAL FAILURE.
The EVENT MECHANICAL FAILURE is set to TRUE, with probability of 0.20
independently at all 9 PBSs.
IF the EVENT MECHANICAL FAILURE is TRUE
RANDOMLY select the duration, a values from 1,2,4,8,16,32 in hours,
for which boat suspends its movement.
Suspend boat movement.
Further CHECK for the EVENT BOAT-DELAY or BOAT-BREAKDOWN
Either one of the two EVENT is set to TRUE, with equal probability of
0.5.
IF the EVENT BOAT-DELAY is TRUE

21
Transmit all the data packets to the current PBS.
Mark a flag on the BOAT, which MARKS BOAT to reduce its stay
on all successive PBSs, to 5 minutes than usual 20 minutes.
ELSE IF the EVENT BOAT-BREAKDOWN is TRUE
DELETE all the data packets on the BOAT, without transmitting
them to the PBS.
END
Algorithm 4: Boat Mechanical Failure Leading To Delay Or Hardware Breakdown

22
CHAPTER 4
EXPERIMENTS
For the simulation study, an area of 104,142 km2 comprising the Marajo Archipelago,
located in the state of Para, Brazil will be selected. The routes for the boats will be
created according to local data, obtained from the office of the public boats terminal in
the city of Belem (capital of Para). Boats will be equipped with Wi-Fi (IEEE 802.11)
devices and they will follow predefined routes throughout the simulation area. Each boat
will have scheduled stopovers at various Peer Base Stations (villages). In order to
configure the traffic generator for the simulator, the demand of real data loads in Marajo
will be investigated.
Figure 5: One Simulator, Representing Boat In Marajo Archipelago, Located In The

23
State Of Para, Brazil.
During sporadic government health programs, physicians perform one hundred
ultrasound exams in one weekend, once a month. In other words, working at maximum
capacity, they perform fifty exams per day. If we consider the size of each ultrasound file
in MPEG format, and we add the high quality video of a health agent performing the
examination (so the physician at Belem can see if the technician performed the exam
correctly) the total size of an ultrasound examination record s around 75Megabytes. Thus,
the traffic generator of the ONE simulator will be set up to work at 384kbps. The value is
obtained considering that fifty ultrasounds per day are performed, each generating a
75MB ultrasound files. All PBSs besides Belem (located at the extreme points of the
Marajo-archipelago), will be selected as sources of video transmissions, all of them
sending files to the main PBS in Belem. The average boat speed at that region is 15Km/h.
For evaluating our robust opportunistic routing, we will create 50 files with their
generation being uniformly distributed across all PBSs except for final destination Belem.
These files will be created uniformly during the first 20 hours of the total simulation time,
i.e. twenty-four hours, so that files generated during the end of the simulation have
enough time to reach Belem. Here, a file will travel from source to destination by hoping
from boat to boat, boat to PBS or PBS to boat, following an opportunistic routing model.
The network under consideration consists of boats and PBS, serving as nodes where a
route of a boat determines the path between two nodes; here the edges between nodes
will be dynamically formed and broken when one node moves in and out of the
transmission range of the other node.

24
The simulation will be operated for two different modes: one being normal mode and
second being the fountain code mode. In normal mode, we will partition a file directly
into 133 packets with all packets belonging to a file being generated at the same PBS. A
file will be considered transmitted successfully, if all 133 packets are received at the final
destination. Under fountain code mode, we will generate more than 133 packets per file
(packets will of the same size as in normal mode and all packets belonging to the same
file will be generated at the same PBS), generating different levels of redundancy in the
code. We will be considering three different fountain codes that generate 161, 175, and
205 packets per file respectively. For all three-fountain codes considered, only 144
packets from a file will be required to be reach to the final destination for the file to be
successfully received, following [17]. A summary of all these parameters is summarized
in Table I and Table II
Parameter Value
Number of PBS 9
Number of Original Boats 13
Transmission Speed (Mbps) 30
Transmission Range (m) 40
Buffer Size Infinite
Probability of loosing a packet, when boat gets delayed 50%
Table I: Fixed Simulation Parameters

25
Parameter Value Alt. Value Alt. Value Alt. Value
Number of files 50 100 200 400
Generation
Interval
171 342 684 13680
File Size (MB) 75 150 225 300
Transmission
Success
Probability
100% 70% 50%
Routing
Scheme
Epidemic Opportunistic
Number of
Fishing Boats
5 10 20
Number of
Fountain Code
Partitions
161 175 205
Duration of a
Boat Staying at
PBS (minutes)
5 20
Table II: Variable Simulation Parameters
In order to evaluate fault tolerance performance, we will have three sets of stochastic
processes where speed of transmission would be reduced, transmission a packet may fail
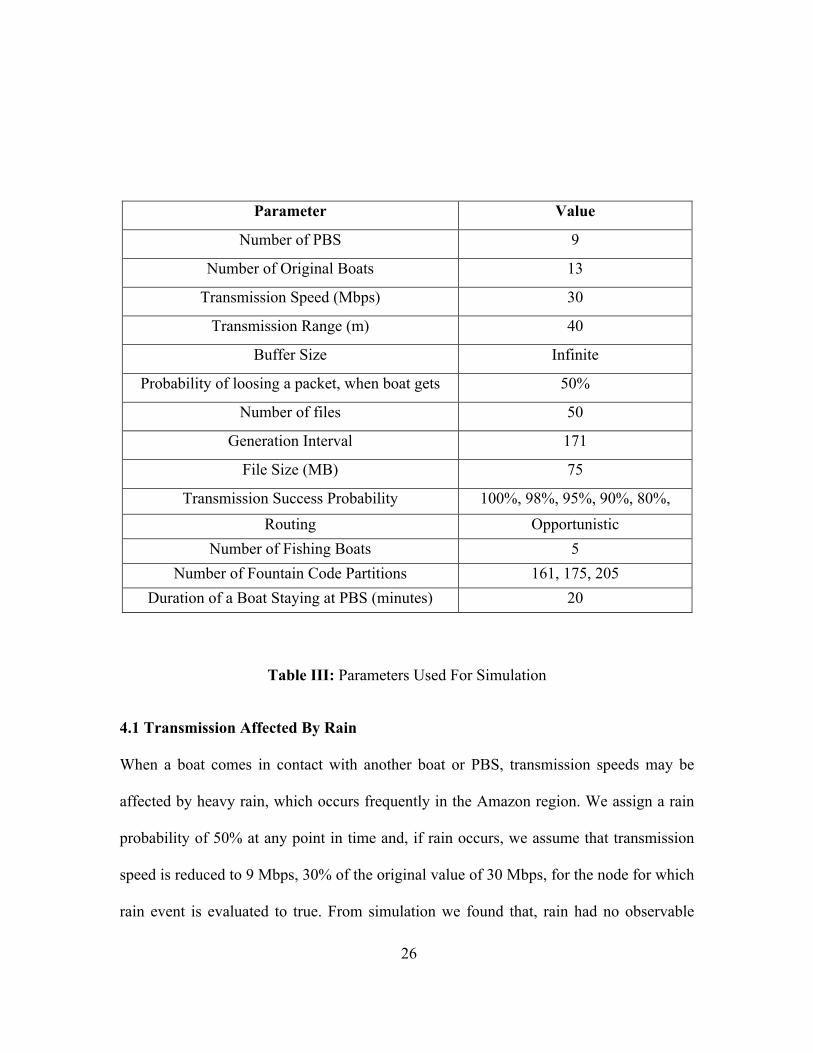
and a boat may break, loosing all packets or might be delayed. Table III gives the
combination of parameters used for the simulation results presented in this report
26
Parameter Value
Number of PBS 9
Number of Original Boats 13
Transmission Speed (Mbps) 30
Transmission Range (m) 40
Buffer Size Infinite
Probability of loosing a packet, when boat gets
delayed
50%
Number of files
50
Generation Interval 171
File Size (MB) 75
Transmission Success Probability 100%, 98%, 95%, 90%, 80%,
70% Routing Opportunistic
Number of Fishing Boats 5 Number of Fountain Code Partitions 161, 175, 205
Duration of a Boat Staying at PBS (minutes) 20
Table III: Parameters Used For Simulation
4.1 Transmission Affected By Rain
When a boat comes in contact with another boat or PBS, transmission speeds may be
affected by heavy rain, which occurs frequently in the Amazon region. We assign a rain
probability of 50% at any point in time and, if rain occurs, we assume that transmission
speed is reduced to 9 Mbps, 30% of the original value of 30 Mbps, for the node for which
rain event is evaluated to true. From simulation we found that, rain had no observable

27
effect on number of packets reaching the final destination.
4.2 Transmission Loss
Transmission loss is the loss probability associated with every data packet transmission
between two nodes where each data packet transmission is treated as an independent
event. We perform simulations with transmission loss probabilities of 0%, 2%, 5%, 10%,
20% and 30%. With increase in the probability of transmission loss, there is a decrease in
the number of data packets reaching the final destination. As the count of successfully
delivered packets decrease, the number of files successfully received at the final
destination keeps on declining.
It can be seen in Figure 6 that only about 4.8% of files are received for normal mode with
only 2% transmission loss probability. The percentage of successful files received is
further reduced to 0%, with 5% transmission loss probability. With fountain code mode,
though the percentage of successfully received files decrease with increase in
transmission loss probability, there is quite a bit of improvement compared to normal
mode. As it appears in Figure 6 and Figure 7, we are able to successfully transfer all 50
files when we use fountain code with a total of 175 or 205 packets with 2% transmission
loss. We are still able to transfer about 95% of files successfully, even if we increase
transmission loss probability to 5%.

28
Figure 6: Percentage Of Files Successfully Received At Final Destination, For Different
Number Of Generated Packets With Varying Transmission Loss Probability.
29
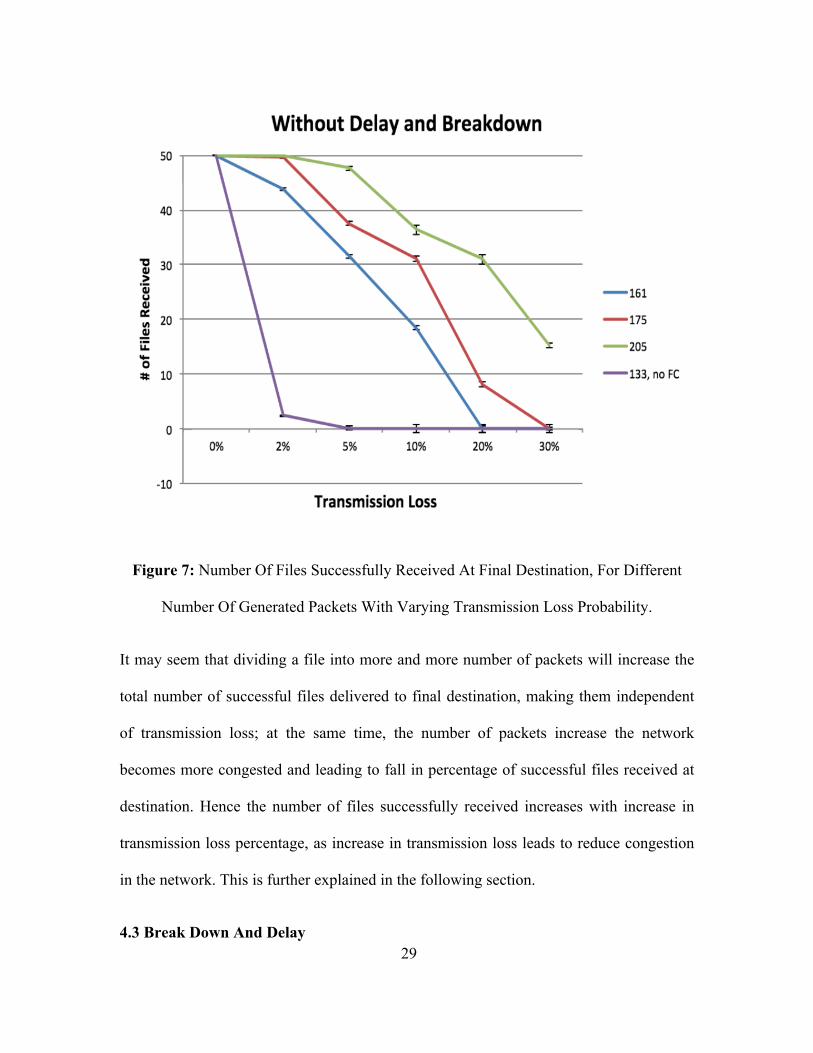
Figure 7: Number Of Files Successfully Received At Final Destination, For Different
Number Of Generated Packets With Varying Transmission Loss Probability.
It may seem that dividing a file into more and more number of packets will increase the
total number of successful files delivered to final destination, making them independent
of transmission loss; at the same time, the number of packets increase the network
becomes more congested and leading to fall in percentage of successful files received at
destination. Hence the number of files successfully received increases with increase in
transmission loss percentage, as increase in transmission loss leads to reduce congestion
in the network. This is further explained in the following section.
4.3 Break Down And Delay
30
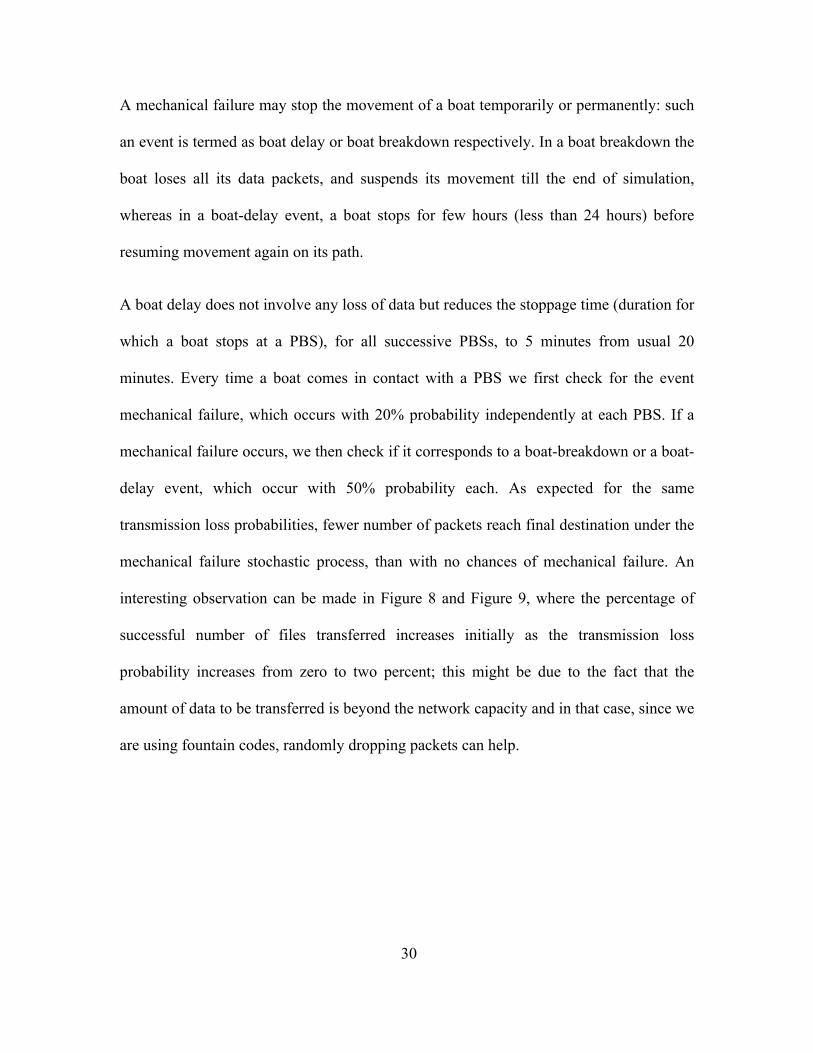
A mechanical failure may stop the movement of a boat temporarily or permanently: such
an event is termed as boat delay or boat breakdown respectively. In a boat breakdown the
boat loses all its data packets, and suspends its movement till the end of simulation,
whereas in a boat-delay event, a boat stops for few hours (less than 24 hours) before
resuming movement again on its path.
A boat delay does not involve any loss of data but reduces the stoppage time (duration for
which a boat stops at a PBS), for all successive PBSs, to 5 minutes from usual 20
minutes. Every time a boat comes in contact with a PBS we first check for the event
mechanical failure, which occurs with 20% probability independently at each PBS. If a
mechanical failure occurs, we then check if it corresponds to a boat-breakdown or a boat-
delay event, which occur with 50% probability each. As expected for the same
transmission loss probabilities, fewer number of packets reach final destination under the
mechanical failure stochastic process, than with no chances of mechanical failure. An
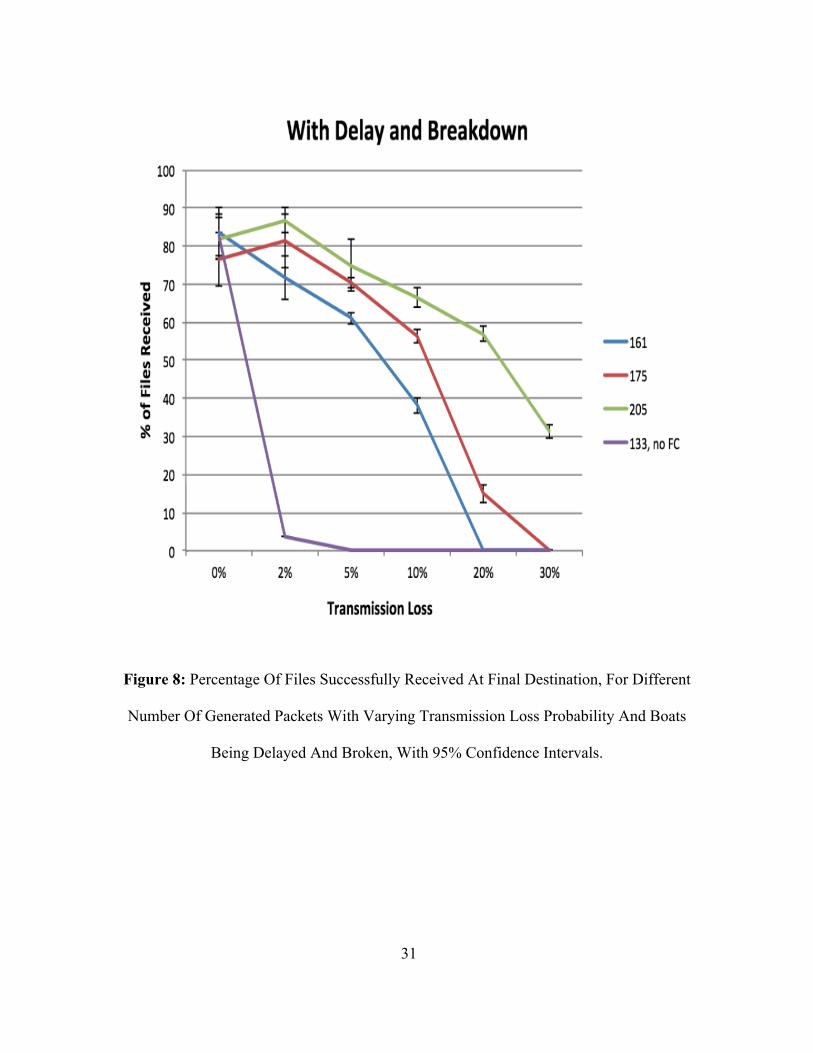
interesting observation can be made in Figure 8 and Figure 9, where the percentage of
successful number of files transferred increases initially as the transmission loss
probability increases from zero to two percent; this might be due to the fact that the
amount of data to be transferred is beyond the network capacity and in that case, since we
are using fountain codes, randomly dropping packets can help.
31
Figure 8: Percentage Of Files Successfully Received At Final Destination, For Different
Number Of Generated Packets With Varying Transmission Loss Probability And Boats
Being Delayed And Broken, With 95% Confidence Intervals.

32
Figure 9: Number Of Files Successfully Received At Final Destination, For Different
Number Of Generated Packets With Varying Transmission Loss Probability And Boats
Being Delayed And Broken.
33
CHAPTER 5
CONCLUSION
Given the significant challenge of providing healthcare to the remote and isolated
communities in the Brazilian Amazon, we proposed a robust opportunistic routing
algorithm, which takes advantage of using fountain codes to improve the delivery
probability of the healthcare data in the presence of failures and unpredictable boat
schedules. The proposed routing algorithm takes into account the probability of boats
being delayed or breaking down, as well as the probability of loss in individual data
packet transmissions due to the harsh environment in the region. Extensive experiments
results show that the delivery probability of the healthcare data is significantly increased
when using our robust opportunistic routing.
5.1 Future Scope
As for future work, we further recommend improving the probability of successful
delivery by incorporating acknowledgements for delivered packets and unequal error
protection in the fountain code approach, so that more important packets of a file are re-
assigned higher priority and hence have higher probability of being delivered to the final
destination. We can also have an intelligent file-partitioning algorithm where paths with
higher throughput can be assigned with larger packets while other paths, which take
longer time to the destination, will be assigned with smaller packets.
34
5.1.1 Routing With Acknowledgements
For each data packet reaching the final destination (PBS at Belem), an acknowledgement
signal (ACK) should be sent back to the packet source station. Given the small size of the
ACK, we suggest the use of epidemic routing protocol for transmitting ACKs from
packet’s destination PBS to packet’s origin PBS.
The source should keep a copy of the transferred packets, till the time source receives the
ACK signal from the destination. The source may fail to receive the ACK signal in time,
because either the packet was lost during transmission or the packet got delayed in
reaching the final destination. In both the cases i.e. packet loss or getting delayed, source
PBS will resend the corresponding data packets. Data packet should be resent only if it
lost during transmission or it exceeds the expected time of arrival (average time a packet
takes to reach from initial source to final destination) at the destination time. If a data
packet successfully reaches the final destination it should be deleted from the PBS (where
the data originated). Algorithm 5 presents the implementation of routing protocol with
acknowledgements.
START
WHILE two NODES are in vicinity of each other AND a connection is established
between the two NODES
Only for the case where transmitter is a PBS and receiver is a BOAT, along with
various stochastic processes.
FOREACH data packet on the PBS

35
IF the data packet originated at the sender PBS AND is being
TRANSMITTED again (already transmitted once before).
IF the difference of current simulator time and the data packet
origin time is GREATER than the expected time of arrival (average
time a packet takes to reach from initial source to final destination)
AND data packet has reached the final destination (check for the
final node in the packet path)
DON’T TRANSMIT the selected data packet between two
NODES
DELETE the data packet
ELSE IF the difference of current simulator time and the data
packet origin time is GREATER than the expected time of arrival
(average time a packet takes to reach from initial source to final
destination) AND data packet has not reached its final destination
RE-TRANSMIT the data packet between two NODES
ELSE
TRANSMIT the data packet between two NODE
IF data packet originated at the same PBS
DON’T DELETE the packet
ELSE
DELETE the data packet
END
Algorithm 5: Routing Protocol With Acknowledgements

36
REFERENCES
[1] http://en.wikipedia.org/wiki/amazon-river. [2] U. G. Acer, P. Giaccone, D. Hay, G. Neglia, and S. Tarapiah. Timely data delivery in a realistic bus network. IEEE T. Vehicular Technology, 61(3):1251–1265, 2012. [3] S. Ahmad, R. Hamzaoui, and M. Al-Akaidi. Unequal error protection using fountain codes with applications to video communication. IEEE Transactions on Multimedia, 13(1):92–101, 2011. [4] G. Anastasi, M. Conti, and M. Di Francesco. Data collection in sensor networks with data mules: An integrated simulation analysis. In Computers and Communications, 2008. ISCC 2008. IEEE Symposium on, pages 1096–1102. IEEE, 2008. [5] V. Cerf, S. Burleigh, A. Hooke, L. Torgerson, R. Durst, K. Scott, K. Fall, and H. Weiss. Delay-tolerant networking architecture. RFC4838, April, 2007. [6] Mauro Margalho Coutinho, Alon Efrat, Thienne Johnson, Andrea Richa, and Mengxue Liu, “Healthcare Supported by Data Mule Networks in Remote Communities of the Amazon Region,” International Scholarly Research Notices, vol. 2014, Article ID 730760, 8 pages, 2014. doi:10.1155/2014/730760 [7] M. M. Coutinho, T. Moreira, E. Silva, A. Efrat, and T. Johnson, “A new proposal of data mule network focused on amazon riverine population”, In ExtremeCom '11 Proceedings of the 3rd Extreme Conference on Communication: The Amazon Expedition, Article no. 10, Published 2011, Sponsors : CAPES Brazilian Higher Education Funding Council and UFAM Federal University Of Amazonas, In-Cooperations : SIGCOMM ACM Special Interest Group on Data Communication, Publisher : ACM New York, NY, USA ©2011, ISBN: 978-1-4503-1079-6. doi:10.1145/2414393.2414403 [8] J. Edmonds and R. M. Karp. Theoretical improvements in algorithmic efficiency for network flow problems. J ACM, 19(2):248–264, 1972. [9] M. Fonoberova and D. Lozovanu. The maximum flow in dynamic networks. Computer Science Journal of Moldova, 3(36):387–396, 2004. [10] E. Husni and J. Waworundeng. Telemedicine system based on delay tolerant network. In Electrical Engineering and Informatics (ICEEI), 2011 International Conference on, pages 1–5. IEEE, 2011. [11] IBGE. Ibge censo 2010. http://www.censo2010.ibge.gov.br/, 2010.

37
[12] Ari Keränen, Jörg Ott, and Teemu Kärkkäinen, “The one simulator for DTN protocol evaluation”, In Proceedings of the 2nd International Conference on Simulation Tools and Techniques at ICST (Institute for Computer Sciences, Social-Informatics and Telecommunications Engineering) Brussels, Belgium, Belgium ©2009, Article55, ISBN: 978-963-9799-45-5. doi :10.4108/ICST.SIMUTOOLS2009.5674 [13] P. Kohli and P. H. S. Torr. Dynamic graph cuts for efficient inference in markov random fields. IEEE Trans. Pattern Anal. Mach. Intell., 29(12):2079–2088, 2007. [14] Journal Article by A L. R. Ford, Jr. , A D. R. Fulkerson, “Constructing Maximal Dynamic Flows from Static Flows”, In 1958 Journal Operations Research, Pages 419-433, Volume 6, No. 3. doi:10.1287/opre.6.3.419 [15] Ford, L. R. and D. R. Fulkerson. Flows in Networks. Santa Monica, CA: RAND Corporation, 1962. http://www.rand.org/pubs/reports/R375. [16] M. Luby, “LT codes”, In 43rd Symposium on Foundations of Computer Science (FOCS 2002), 16-19 November 2002, Vancouver, BC, Canada, Pages 271-282, 2002. [17] D.J.C MacKay, "Fountain codes," Communications, IEE Proceedings- , vol.152, no.6, pp.1062, 1068, 9 Dec. 2005. doi: 10.1049/ip-com:20050237 [18] S. Naidu, S. Chintada, M. Sen, and S. Raghavan. Challenges in deploying a delay tolerant network. In Proceedings of the third ACM workshop on Challenged networks, pages 65–72. ACM, 2008. [19] A. Pentland, R. Fletcher, and A. Hasson. Daknet: Rethinking connectivity in developing nations. Computer, 37(1):78–83, 2004. [20] N. Rahnavard, B. N. Vellambi, and F. Fekri. Rateless codes with unequal error protection property. IEEE Transactions on Information Theory, 53(4):1521–1532, 2007. [21] M. A. S. Merugu and E. Zegura, “Routing in space and time in network with predictable mobility”, CC Technical Report; GIT-CC-04-07, 2004, Georgia Institute of Technology. [22] R. C. Shah, S. Roy, S. Jain, and W. Brunette, “Data mules: Modeling and analysis of a three-tier architecture for sparse sensor networks”, Ad Hoc Networks, 1(2):215–233, 2003. [23] A. Shokrollahi, “Raptor codes” IEEE Transactions on Information Theory, 52(6):2551–2567, 2006. [24] L. Sundararaj and P. Vellaiyan, “An overview of alagappa university delay tolerant water monitoring network”, IJCSNS, 10(5):19, 2010.

38
[25] A. Vahdat and D. Becker, “Epidemic routing for partially-connected ad hoc networks”, Technical Report CS-200006, Duke University, 2000. [26] Ari Keränen, “Opportunistic Network Environment Simulator”, Special Assignment report, Helsinki University of Technology, Department of Communications and Networking, May 2008. [27] TKK/COMNET. Project page of the ONE simulator. http://www.netlab.tkk.fi/tutkimus/dtn/theone, 2008. [28] Menxgue Liu, Rachit Agarwal, Andrea Richa, Thienne Johnson, Alon Efrat and Mauro Margalho Coutinho, “Robust Data Mule Networks With Remote Healthcare Applications in the Amazon Region: A Fountain Code Approach, Submitted to IEEE Healthcom, 2015

39
APPENDIX A
CODE SNIPPETS

40
Listing A.1 Implementation of Algorithm 2 public boolean canMessageBeTransfered() { Random randomNumberGenerator = new Random(); int number = randomNumberGenerator.nextInt(100); // we can have 100% or 70% or 50% probability that message might be transferred if(number < 100) return true; return false; } Listing A.2 Implementation of Algorithm 3 public double getTransmitSpeedMultiplyingFactorInRainyCondition() { Random randomNumberGenerator = new Random(); int number = randomNumberGenerator.nextInt(2); // we have 50% probability of rain thats, why generation random number from 0...1 // the transmission speed decreases to 30%of original value in case it rains. if(number == 0) return 1.0; return 0.3; }
Listing A.3 Implementation Of Algorithm 4
public class HostBreakdown { static int[] duration = {1,2,4,8,16,32}; private double start; private double end; public HostBreakdown() { this.start = SimClock.getTime(); double temp = durationOfBreakdown(); this.end =m start + temp*60.0*60.0; } public void setBreakdownState() { if( SimClock.getTime() > this.end+1) {

41
this.start = SimClock.getTime(); this.end = start + durationOfBreakdown()*60.0*60.0; } } public boolean isBroken() { return isInRange(SimClock.getTime()); } private boolean isInRange(double time) { if (time >= start && time < end ) { return true; } return false; } // returns true if boats break down else false private boolean probabilityOfBreakdown() { Random randomNumberGenerator = new Random(); // set the argument as n for probability of 1/n+1 int number = randomNumberGenerator.nextInt(45); // marking '0' as a number which results in breakdown of a host // since number can take any value from 0(inclusive) to 45(exclusive) with equal probability // hence probability of getting 0 is 1/45 // use -1 in order to enforce no breakdown if(number == -1) return true; else return false; } // return time duration of breakdown in hours // returns a random value from array "duration" if probability of breakdown is true private double durationOfBreakdown() { if(probabilityOfBreakdown()) { Random randomNumberGenerator = new Random(); int number = randomNumberGenerator.nextInt(6); return duration[number]; // return 1; } return -1; } }
42
// the whole boat break code remains the same
// but of consider that boat was only delayed, its transmitter and receiver were working fine // we set this variable to true with 50% probability. public void setOnlyDelayed() { Random randomNumberGenerator = new Random(); int number = randomNumberGenerator.nextInt(2); if(number == 0) { this.isOnlyDelayed = false; } this.isOnlyDelayed = true; } public boolean setBreakdownState() { if(this.state == null) { this.state = new HostBreakdown(); } else { this.state.setBreakdownState(); } boolean state = this.state.isBroken(); if(state) { this.setOnlyDelayed(); } if(state && !this.isOnlyDelayed) { List<Message> messages = new ArrayList<Message>(this.getMessageCollection()); for(Message m : messages) this.deleteMessage(m.getId(), false); } return state; } public boolean isConnectionBroken() { if(this.state != null && this.state.isBroken()) return true; else return false; } public boolean isConnected() { return this.connected; } public void setConnectdToPBS(double startTime) {

43
if(startTime > this.timeToEndConnectionToPBS) { // set the value for the duration you want boat to stop at PBS // if boat was delayed but not broken then it stops only for 5 minutes at PBS int timeInMinute = 20; if(this.isOnlyDelayed) { timeInMinute = 5; } this.timeToEndConnectionToPBS = startTime+timeInMinute*60; } } public double getTimeToEndConnectionToPBS() { return this.timeToEndConnectionToPBS; } // the whole boat break code remains the same // but of consider that boat was only delayed, its transmitter and receiver were working fine // we set this variable to true with 50% probability. public void setOnlyDelayed() { Random randomNumberGenerator = new Random(); int number = randomNumberGenerator.nextInt(2); if(number == 0) { this.isOnlyDelayed = false; } this.isOnlyDelayed = true; }
// Delete original messages public int startTransfer_2(DTNHost from, Message m) { assert this.msgOnFly == null : "Already transferring " + this.msgOnFly + " from " + this.msgFromNode + " to " + this.getOtherNode(this.msgFromNode) + ". Can't "+ "start transfer of " + m + " from " + from; this.msgFromNode = from; Message newMessage = m.replicate(); int retVal = getOtherNode(from).receiveMessage(newMessage, from); if (retVal == MessageRouter.RCV_OK) {

44
this.msgOnFly = newMessage; this.transferDoneTime = SimClock.getTime() + (1.0*m.getSize()) / this.speed; ///Delete the original message here if(from != m.getFrom()) from.deleteMessage(m.getId(), false); // mark message to wait for acknowledgement if(from == m.getFrom()) m.setWaitForAcknowledgement(true); } if (retVal == MessageRouter.DENIED_TRANSMISSION_FAILURE) { ///Delete the original message here if(from != m.getFrom()) from.deleteMessage(m.getId(), false); } return retVal; }
Listing A.4 Implementation To Set Parameters To Generate Different Number Of Packets E.G. 133, 161, 175, 205 And To Set PBS = 13 (Belem) As Destination For Every Generated Packet. public class MessageCreateEvent extends MessageEvent { private int size; private int responseSize; private int generateNumN = 205; */ public MessageCreateEvent(int from, int to, String id, int size, int responseSize, double time) { super(from,to, id, time); this.size = size; this.responseSize = responseSize; } /** * Creates the message this event represents. */ @Override public void processEvent(World world) { //Messages are always trasfered to Belem, PBS ID = 13

45
//DTNHost to = world.getNodeByAddress(this.toAddr); DTNHost to = world.getNodeByAddress(13); //from address are continuous from 14 //DTNHost from = world.getNodeByAddress(this.fromAddr); int tempfrom = Integer.parseInt(this.id.substring(1)) % 8;
APPENDIX A
CODE SNIPPETS
DTNHost from = world.getNodeByAddress(tempfrom + 14); for ( int i = 0; i != this.generateNumN; i++) { String Newid = this.id + "_" + Integer.toString(i); Message m = new Message(from, to, Newid, this.size); m.setResponseSize(this.responseSize); from.createNewMessage(m); } } @Override public String toString() { return super.toString() + " [" + fromAddr + "->" + toAddr + "] " + "size:" + size + " CREATE"; } }